
 ?Mathematical formulae have been encoded as MathML and are displayed in this HTML version using MathJax in order to improve their display. Uncheck the box to turn MathJax off. This feature requires Javascript. Click on a formula to zoom.
ABSTRACT
Cylindrical polymer electrolyte membrane fuel cells are promising energy conversion devices for next generation transportation applications because of their high volumetric and gravimetric power densities. The present study is focused to evaluate the effect of a design parameter (clamping pressure) and an operational parameter (gas pressure) on the contact resistance of the cell. The cell is modelled to visualise contact pressure at the interface of the gas diffusion layer and the current collector. It is observed that the contact pressure at the interface is dependent on both clamping as well as gas pressure.
The ohmic resistance of the cell is found to decrease with increase in current, reaches a minimum and then increases owing to membrane hydration and dehydration over gradual increase in the cell temperature. The threshold contact resistance is then calculated to be 33.21 mΩ cm2 based on the minimum ohmic resistance of 100 mΩ. The study highlights the optimum zone where the combination of both clamping and gas pressures can be used to minimise the contact resistance.
1. Introduction
Alternatives to primary energy sources have been pursued since mid-nineties in response to the global warming and rapid depletion of fossil fuels. Hydrogen, due to its high energy density and pollution free nature, is being realised as a replacement for conventional fuels by employing in devices such as polymer electrolyte membrane fuel cells (PEMFCs) to produce electricity (Wang et al. Citation2020). PEMFCs have been considered for applications such as automobile, stationary, space etc. (Gao et al. Citation2016; Markgraf et al. Citation2012; van Biert et al. Citation2016; Yilanci, Dincer, and Ozturk Citation2009) due to their high power density and low startup time. Cylindrical PEMFC, inspired from solid oxide fuel cells, is considered as a better alternative than the conventional planar PEMFC. The structure holds the membrane electrode assembly (MEA) firmly between a set of two concentric cylinders. The absence of conventional bipolar plates (BPPs) and end plates in cylindrical cells when compared to the planar architecture can be harnessed to increase volumetric and gravimetric power densities (Bullecks et al. Citation2010; Mahata et al. Citation2012; Othman et al. Citation2016).
Various structural/design modifications have been suggested by the researchers for the improvement of cylindrical cells. Saghali et al. (Saghali and Mahmoudimehr Citation2017) numerically compared the new conical design with the cylindrical one and found the former design to be better with respect to increase in the conical angle. Moreover, the relative humidity of the feed gas was seen to have more impact on the performance of the cell. Effect of arrangement of different channels (2, 4, 6 and 8) on the cell performance was simulated with eight channels performing better than the rest (Mohammadi-ahmar et al. Citation2016). On a similar line, while addressing issues such as cost, volumetric and gravimetric power densities, the tubular cell also performed better than the planar structure at higher current densities (Bullecks et al. Citation2010). This was primarily due to the effective management of water produced at cathode during the reaction. Suseendiran et al. (Suseendiran, Pearn-Rowe, and Rengaswamy Citation2017) observed an increase in performance with optimised clamping conditions as well as increase in relative humidity of the fuel. Also, the peak power was seen to increase by decreasing the hydrogen flow owing to better diffusion.
Of the many resistances present in the cell, contact resistance is found to be one of the important factors affecting cell performance (Bhosale, Mahajan, and Ghosh Citation2019) as it amounts to almost 55% of total ohmic loss in the cell (Netwall et al. Citation2013). Various approaches have been proposed by the researchers to minimise the resistance, specifically in planar/conventional PEMFCs (Dey et al. Citation2013; Jin, Zhu, and Zheng Citation2017; Singdeo, Dey, and Ghosh Citation2014). The effect of connections between GDL and BPP was investigated using a three-dimensional CFD model which underlined the increase in contact region resulting in increased cell performance (Khazaee and Ghazikhani Citation2011). A tubular PEMFC with an active area of 25 cm2 was compared with planar structure to observe the contact pressure distribution at the interface of GDL and current collector/BPP (In et al. Citation2010). The authors observed uniform pressure distribution with the tubular structure. However, the study was not extended to observe the effect of contact pressure distribution on ICR of the cell.
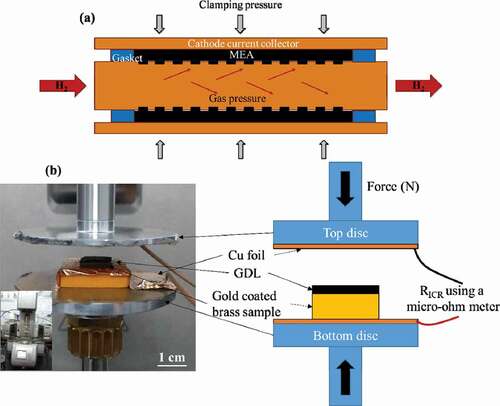
In this work, authors investigate the factors that affect the interfacial contact resistance (ICR) in cylindrical PEM fuel cells and its impact on the performance of these cells. When the fuel i.e. hydrogen is passed through the inner tube, it is suspected that the pressure of the gas will add an effect of local expansion of catalyst coated membrane (CCM) thereby forcing the cathodic GDL towards the current collector. Such effect of gas pressure will further increase the contact pressure at the interface of GDL and current collector thereby bringing down the ICR. There appears to be more contact pressure at the interface of cathodic part while the change in contact pressure on anodic side is negligible as the CCM is wrapped around the inner tube with a force ()).
Figure 1. (a) Schematic view of effect of gas pressure on the cell and (b) an experimental setup using rheometer (inset) with schematic explanation (right)
The relationship between clamping pressure and ICR was studied before by Bhosale et al. (Bhosale et al. Citation2017), although for unitised regenerative fuel cell, when operated in an electrolysis mode. In this work, the authors investigate the threshold values of clamping pressure and gas pressure which lead to acceptable ICR values for cylindrical fuel cells.
2. Methodology
Cylindrical fuel cells, in the view of ICR, are affected by non-uniform clamping pressures as well as the gas pressure (inlet pressure of hydrogen gas). Such contact resistance is highly dependent on the contact pressure at the interface of GDL and current collector. The resistance, however, is very negligible between the catalyst layer and GDL due to the carbon–carbon interface (Prass Citation2016). It, therefore, becomes very important to evaluate the response of ICR at the GDL/current-collector interface for different operating conditions.
The current section is divided into two categories viz. experimental and modelling of the cell. The evaluation of ICR at different contact pressures using a rheometer is discussed in detail with the help of samples of GDL and the current collector (1 cm2 each). ICR is found out for a known force applied by subtracting the individual resistances of the materials (GDL and the collector) as well as that of the connections. It is then followed by the procedure for assembling the cell wherein a commercial MEA is wrapped around a tube and enveloped by a pair of two hemi cylindrical halves. Appropriate gasket is used to make the assembly leak-proof with the help of the straps used for clamping the cell.
Modelling of cell involves setting up of the assumptions and governing equations for the computational study of the cell to investigate the contact pressure at the interface of GDL and the current collector. Replica of the cell drawn using SOLIDWORKS 13 is analysed in ANSYS® in a structural framework for the contact pressure distribution using appropriate boundary conditions such as clamping pressure, gas pressure, fixed support and directional displacement. Meshing of the model is first optimised to facilitate solution convergence. The procedure is discussed in detail at appropriate locations.
2.1. Experimental setup
2.1.1. Evaluation of ICR
The relation between force/pressure applied during clamping and the resistance is important as the resistance is inversely proportional to the force applied. Hence, a rheometer (Anton paar, MCR 502), due to its precise control on force applied, was used for the evaluation. The samples i.e. carbon cloth with a microporous layer and gold coated brass, each cut in 1 × 1 cm2 size were employed. The top and bottom discs ()) of the rheometer were electrically isolated using Teflon sheets onto which highly conductive copper foils were pasted for making electrical connections (a thin plastic block used on bottom disc for making some space between the discs for electrical connections). The electrical wires were soldered to these foils and were connected to a micro-ohm metre (KEITHLEY, 2016 THD). The resistance of carbon cloth was first evaluated for different clamping forces after which the resistances of coated brass and cloth were evaluated. The experiment was repeated for same set of forces to find out the using EquationEq. (1
(1)
(1) ).
Where,
is the resistance of entire circuit including the samples;
is the resistance of carbon cloth;
is the resistance of gold coated brass sample; and
is the resistance offered by the electrical connections including copper foils and soldered wires.
2.1.2. Cell assembly
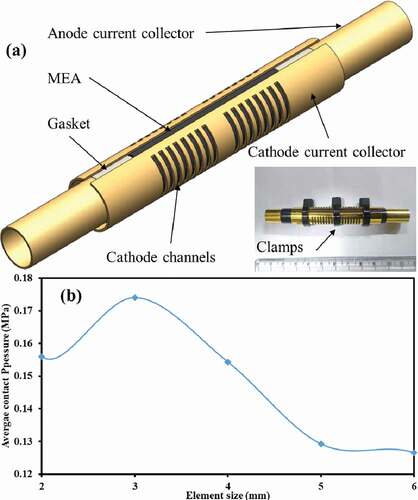
The air breathing cell was assembled as discussed in (Suseendiran, Pearn-Rowe, and Rengaswamy Citation2017). A commercially available CCM (Sainergy Fuel Cell India Pvt Ltd) was used with anodic and cathodic loadings of 0.1 and 0.5 mg cm−2 respectively. In brief, the CCM along with carbon cloths (ELAT LT 1400 W) was wrapped around a gold coated brass tube (outer diameter = 10 mm, thickness = 1 mm) with 1 mm channels/slots (16 in number) machined along the length of tube. Two semi-cylindrical gold coated brass pieces, as current collectors, (outer diameter = 11.35 mm, thickness = 0.35 mm) were used to hold the wrapped MEA around the inner tube. These collectors were machined to have 1 mm wide slots for the oxidant to facilitate the fuel cell reactions as shown in ). An arrangement was made in such a way that anodic part of MEA faced the inner tube, whereas the cathode was in contact with semi-cylindrical plates. The entire assembly was held firmly with a set of three plastic straps clamped with a known force at appropriate locations.
Figure 2. (a) Various components of cell with actual cell fabricated (inset) and (b) mesh convergence
2.2. Modelling of cell
The effect of gas pressure on the cell at different clamping conditions was modelled using 3D structural model and solved using ANSYS. The average contact pressure and its distribution was estimated using the model. The simulation results were compared with experimental results at atmospheric gas pressure for different clamping conditions.
2.2.1. Assumptions
The flow of gas through the inner tube was assumed to be steady and uniform throughout the length of the tube. The mechanical properties of all materials are assumed to be homogenous and no relative motion between the components was considered. The carbon cloth and the catalyst layer were assumed to have a uniform change in the porosity with their gas permeability to be isotropic in nature. Since the cell was clamped with higher pressures, the contact regions between different cell components as well as at the interface of GDL and BPP were assumed not to have any relative motion between them and therefore simulated with ‘no slip’ condition. The membrane and catalyst layers, on other hand, had ‘no separation’ condition between them as the MEA in the form of CCM was used in the study as discussed earlier.
2.2.2. Governing equations
The deformation of material in its elastic zone is given by Hook’s law (Movahedi, Ramiar, and Ranjber Citation2018)
Axial stress and shear modulus can be correlated using following equation:
Total normal strain is given by:
Hook’s law can also be applied to stress and strain during shear.
Moduli in normal and shear deformation can be related using Poisson’s ratio.
2.2.3. Procedure adopted during computation
SOLIDWORKS 13 was used to replicate the cell geometry ()). ANSYS® Academic Research, Release 14.5 workbench was used wherein the geometry was imported for further computation. Hexahedral meshing was found to be the optimum for this work. Since ICR is dependent on the average contact pressure at the interface of GDL and current collector, such pressure was observed as the primary result of the simulation and therefore was set as parameter for the mesh optimisation ()).
After setting up the boundary conditions (discussed in following section), the contact pressure and its distribution across the interface was observed using the contact tool. The computation was done with the convergence criteria of 10−6 after which the results were plotted.
2.2.4. Boundary conditions
Due to symmetrical distribution of contact pressure at the interface of GDL and cathodic current collector along the radius, a quarter of the geometry was simulated in 3D environment wherein the surfaces of membrane along the width were constrained to realise the actual assembly. The deformation in radial direction was considered whereas one along the length of the cell was neglected as the clamping force was observed to act radially inward. Since the cell was clamped using suitable straps at three different places (one at centre and two at each end of cathode current collectors as shown in ), the clamping load was applied at the respective positions in the simulation model.
3. Results and discussion
3.1. Interfacial contact resistance versus contact pressure
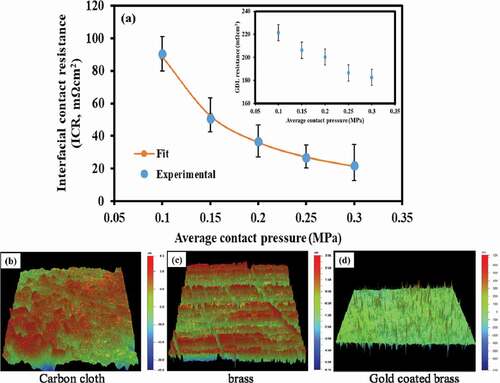
) shows the dependence of ICR with the contact pressure between carbon cloth and gold coated brass sample. The resistance was observed to decrease exponentially with increase in contact pressure which is in good agreement with the reported literature (Mine et al. Citation2017; Misra and Nagaraju Citation2010; S. E Oualid et al. Citation2017). The decrease was attributed to higher contact region due to the increased pressure underlining more pathways for electrons to flow across the interface. The results were modelled using an empirical relation (EquationEq. (10))(10)
(10) that was used in further analysis.
Figure 3. (a) ICR between carbon cloth and gold coated brass; inset bulk resistance of carbon cloth and surface profiles of (b) carbon cloth, (c) brass and (d) brass coated with gold
where, is the average contact pressure in MPa.
The bulk resistance of carbon cloth was observed to decrease with increase in the contact pressure due to increment in fibre density thereby easing more flow of electrons (S. E Oualid et al. Citation2017). The action, however, would subsequently affect the porosity, management of water as well as thermal conductivity of the GDL.
Surface morphology of the samples revealed the surface roughness of carbon cloth ()), brass ()) and the coated brass ()) as 16, 1.13 and 0.036 µm, respectively. The roughness of surfaces adds to reduction in the contact points between them which leads to hindrance to flow of electrons at the interface. Such hindrance thus contributes to loss of potential in the circuit. The gold coating, therefore, played a significant role in reducing the roughness as well as enhance the electrical conductivity of the brass as a substrate for current collectors. Hence, it facilitated the reduction in the ohmic drop between the samples.
3.2. Variation of contact pressure with clamping pressure and its distribution
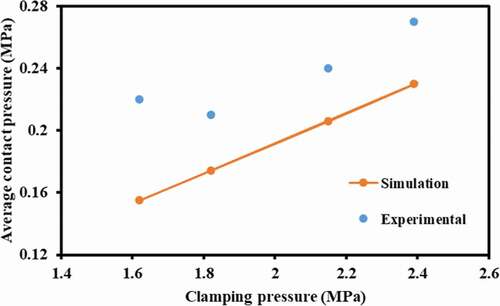
Average contact pressure can be obtained from when the cell was clamped for different clamping pressures (). The linear increment in the contact pressure was observed in both simulations as well as experimental results. The deviation between the two could be attributed to unsymmetrical positioning of straps used for clamping the cell and their mechanical properties further complicated by variation in thickness of gasket at respective ends of MEA and human errors. Detailed study of the cell with clamping pressure of 1.5 MPa and differential gas pressure of 200 kPa was done.
Figure 4. Dependence of contact pressure on clamping pressure
The distribution of simulated contact pressure at the interface of GDL and current collector is shown in ). The high pressure zones clearly indicate the clamping places whereas negative pressure (direction) indicate the pressure exerted by GDL on the current collector that acted opposite to the one exerted by the current collector on GDL. Therefore, the absolute values of the pressure were taken further to plot their distribution over the electrode area ()). It could be observed that the majority of area had a pressure between 0.1 and 0.4 MPa averaging about 0.3 MPa. The von-Mises stresses developed in GDL were in the range of 5–7 MPa for given clamping pressure range which were negligible compared to its modulus (stiffness) thereby underlining the assumptions as stated in Section 2.2.1. provides information on the mechanical properties of various materials used as cell components.
Figure 5. Distribution of contact pressure (MPa) at the interface of GDL and current collector (a) simulated with clamping pressure of 1.5 MPa and gas pressure of 200 kPa(b) over area of electrode
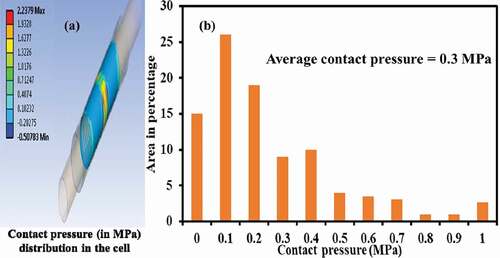
Table 1. Material properties of the various components of the cylindrical cell
3.3. Characterisation of cylindrical cell
The assembled cell was characterised using a test station (scribner, 850e) with the flowrate of hydrogen maintained at 50 sccm at atmospheric pressure (90% RH at 30°C). shows the polarisation curves obtained from the cell for different clamping pressures (0.9–1.6 MPa). The ohmic resistance was observed to decrease exponentially in the initial phase owing to better membrane conductivity due to increased water generation with increased load. The resistance gradually settled down and achieved the lowest (33.61 mΩ) when the membrane was fully hydrated and its conductivity was the highest (near maximum power density). More squeezing of cell components such as MEA and the cathodic GDL was, however, observed at higher clamping pressures leading to fuel leakage.
Figure 6. Polarisation curve obtained from the cell
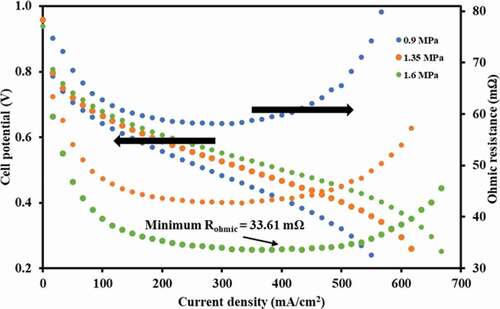
However, with further increase in load (i.e. current), the increase in cell temperature led to the evaporation of generated water at cathode (open to air). This resulted in the loss of membrane conductivity which increased the ohmic resistance. At appropriate clamping and gas pressure conditions, the value of the cell is said to be ∼50 % of total
(Netwall et al. Citation2013). At minimum ohmic resistance (33.61 mΩ), the
value of the cell calculated using EquationEq. (11
(11)
(11) ) is found to be ~100 mΩcm2.
3.4. Effect of gas pressure on contact pressure and ICR
The cell was simulated to visualise the effect of gas pressure on the contact pressure at the interface of GDL and current collector for a given clamping pressure (). The contact pressure was observed to increase linearly with gas pressure for all the cases of clamping pressures considered. This is due to the influence of gas that squeezed the GDL between the current collector and MEA,thus resulting in increased pressure at the interface. Furthermore, the contact pressure was interestingly lower compared to the applied clamping pressure e.g. ∼ 0.12 MPa at the interface against 1 MPa of clamping pressure. The PTFE gasket had the same thickness (∼ 400 µm) as that of the GDL, however, it had more compression strength which underlined more pressure/force required for its deformation. The total compression pressure that resulted at the interface of GDL and the collector, therefore, was lower than what was expected. This further highlights that the selection of gasket is very important in controlling the contact pressure.
Figure 7. Variation of contact pressure as well as ICR with different gas pressures (operating pressures) for various clamping conditions
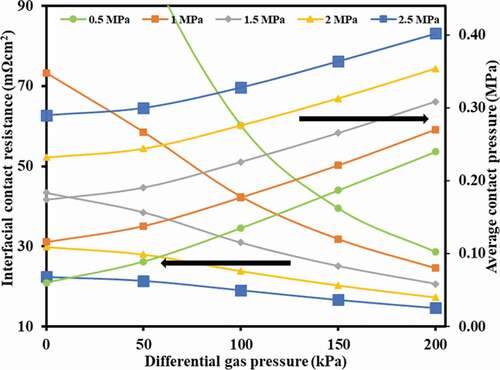
ICR was plotted against gas pressure () to realise its effect for different clamping pressures using EquationEq. (10(10)
(10) ). It could be observed that increasing gas pressure for any clamping pressure decreased the ICR due to increased contact pressure as discussed earlier.
Thus, the study underlines the guidelines for clamping as well as operating conditions for cylindrical cell to minimise the contact resistance. However, over-clamping shall cause unnecessary compression of GDL and MEA leading to their structural as well as chemical degradation followed by membrane puncture.
4. Conclusions
Cylindrical PEM fuel cells can be considered as a promising solution especially for mobile applications due to their higher volumetric and gravimetric power densities over conventional designs. However, contact resistance, among other challenges, needs to be addressed for improving the cell performance. The importance of ICR with respect to assembling of cells and operating conditions is highlighted in this paper. The resistance was observed to decrease exponentially with increase in contact pressure owing to more area in contact region thus facilitating more flow of electrons. Structural modelling of the cell assembly was undertaken to establish average contact pressure at the interface of GDL and current collector at various gas and clamping pressures. The increment in gas pressure actually helped contact pressure to increase due to local expansion of MEA.
The characterised cell benchmarked the ICR that was observed to decrease with gas pressure for a given clamping condition. ICR of 100 mΩ cm2 was found to underline the membrane in a fully hydrated condition (near maximum power density point). Thus, the study recommends various operating and clamping pressures to be used in combination as best fit to minimise contact resistance. Higher gas pressure would be beneficial to the cell in terms of performance as ICR would be low. However, it also increases the probability of gas leakage and MEA puncture. An appropriate clamping (~1.5 MPa in this case) and sealing arrangement should minimise such issues and therefore make the cell better in terms of performance.
Abbreviations
BPP Bipolar plate
CCM Catalyst coated membrane
CFD Computational fluid dynamics
GDL Gas diffusion layer
ICR Interfacial contact resistance
MEA Membrane electrode assembly
MPL Microporous layer
PEMFC Polymer electrolyte membrane fuel cell
SOFC Solid oxide fuel cell
URFC Unitized regenerative fuel cell
Nomenclature
Young’s modulus, MPa
Total strain developed in the material
Normal strain in X direction
Shear elastic modulus, MPa
Lame constant, MPa
Poisson’s ratio
Stress generated in X direction, MPa
Shear stress induced in the material on ith face in jth direction, MPa
Shear strain on ith face in jth direction
Resistance of gold coated brass sample, mΩcm2
Resistance offered by the electrical connections including copper foils and soldered wires, mΩcm2
Resistance of carbon cloth, mΩcm2
Interfacial contact resistance, mΩcm2
Total ohmic resistance of the cell, mΩ
Resistance of entire circuit including the samples, mΩcm2
Acknowledgments
Authors would like to thank Prof. Abhijit Deshpande, Department of Chemical engineering, IIT Madras for extending the lab facilities for the experiment. The help extended by the research scholars, Mr. Pankaj Jadhav, Dr. Ramya, Ms. Diksha, Mr. Sathish Swaminathan and Dr. Sujit Bontapalle is greatly acknowledged.
Disclosure statement
No potential conflict of interest was reported by the author(s).
Additional information
Notes on contributors
Amit C. Bhosale
Amit C. Bhosale is a mechanical engineer by profession and an energy practitioner by choice. He is currently Assistant Professor in the Department of Hydro and Renewable Energy, Indian Institute of Technology Roorkee since January 2020. He pursued M. Tech. in Mechanical Engineering from Indian Institute of Technology Madras and joined Arvin Meritor, Bengaluru as a Post Graduate Engineer Trainee. He then pursued his Ph.D. in the Department of Energy Science and Engineering, Indian Institute of Technology Bombay, and joined Institute Post Doctoral Fellowship (I-PDF) in the Department of Chemical Engineering, Indian Institute of Technology Madras. Fuel cells, electrolysers, contact resistance management, cylindrical fuel cells are some of his research interests.
S. R. Suseendiran
S. R. Suseendian is a B.Tech. Chemical and Electrochemical Engineering graduate from Central Electrochemical Research Institute, Karaikudi. He worked as an Engineer - Quality Assurance in AMCO Batteries Limited, Bangalore before joining the Indian Institute of Technology Madras for M.S. Chemical Engineering. He has graduated Ph.D. Chemical Engineering from Indian Institute of Technology Madras in July 2021. He is currently the Co-founder and CEO of Elicius Energy Private Limited, a start-up focussing on the commercialization of proton exchange membrane fuel cells.
Kiran Rokhade
Kiran Rokhade is M. Tech. in Mechanical Engineering and was associated with the Council Of Scientific And Industrial Research–Central Electro Chemical Research Institute (CSIR–CECRI) as a Project Assistant. Prior to his joining at CECRI, he worked on modeling of bipolar plates in the Department of Energy Science and Engineering, Indian Institute of Technology Bombay.
Raghunathan Rengaswamy
Prof. Raghunathan Rengaswamy is a Marti Mannariah Institute Chair Professor in the Department of Chemical Engineering at the Indian Institute of Technology Madras. He is currently the Dean of Global Engagement at the Indian Institute of Technology Madras and a core member of Robert Bosch Center for Data Science and Artificial Intelligence. He is also a fellow of the Indian National Academy of Engineering. Prior to this, he was Professor, Chemical Engineering, and co-director of the Process Control and Optimization Consortium (PCOC) at Texas Tech University, Lubbock, TX USA, Associate and Full Professor at Clarkson University, Potsdam, NY, and Assistant Professor at IIT Bombay, Mumbai, India. He has also been a visiting professor at Purdue University, USA, University of Delaware, USA, and the University of Alberta, Canada.
References
- Bhosale, A. C., M. A. Mahajan, and P. C. Ghosh. 2019. “Optimization of Contact Resistance with Better Gasketing for a Unitized Regenerative Fuel Cell.” International Journal of Hydrogen Energy 44 (37): 20953–20962. doi:https://doi.org/10.1016/j.ijhydene.2018.09.090.
- Bhosale, A. C., S. R. Mane, D. Singdeo, and P. C. Ghosh. 2017. “Modeling and Experimental Validation of a Unitized Regenerative Fuel Cell in Electrolysis Mode of Operation.” Energy 121: 256–263. doi:https://doi.org/10.1016/j.energy.2017.01.031.
- Bullecks, B., R. Rengaswamy, D. Bhattacharyya, and G. Campbell. 2010. “Development of a Cylindrical PEM Fuel Cell.” International Journal of Hydrogen Energy 36 (1): 713–719. doi:https://doi.org/10.1016/j.ijhydene.2010.09.079.
- Dey, T., D. Singdeo, M. Bose, R. N. Basu, and P. C. Ghosh. 2013. “Study of Contact Resistance at the Electrode-interconnect Interfaces in Planar Type Solid Oxide Fuel Cells.” Journal of Power Sources 233: 290–298. doi:https://doi.org/10.1016/j.jpowsour.2013.01.111.
- FuelCellsEtc. 2008. Retrieved 23 September 2015, from http://fuelcellsetc.com/store/N212
- FuelCellsEtc. 2015. Retrieved 23 September 2015, from https://www.fuelcellsetc.com/store/DS/gas-diffusion-layer-properties.pdf./http://fuelcellsetc.com/store/DS/gas-diffusion-layer-properties.pdf
- Gao, D., Z. Jin, J. Liu, and M. Ouyang. 2016. “An Interleaved Step-up/step-down Converter for Fuel Cell Vehicle Applications.” International Journal of Hydrogen Energy 41 (47): 22422–22432. doi:https://doi.org/10.1016/j.ijhydene.2016.09.171.
- In, K., S. Won, M. Soo, and C. Nam. 2010. “The Development of Air-breathing Proton Exchange Membrane Fuel Cell (PEMFC) with a Cylindrical Configuration.” International Journal of Hydrogen Energy 35 (21): 11844–11854. doi:https://doi.org/10.1016/j.ijhydene.2010.08.105.
- Jawad, R. S., A. Kadhum, S. M. Fayadh, and T. K. Abed. 2016. “Improvement of the Fatigue Resistance and Increase Its Life of Specimens of Naval Brass Alloy Using Laser Shock Wave Processing.” Journal of Nanoscience and Technology 2 (1): 69–72.
- Jin, J., Z. Zhu, and D. Zheng. 2017. “Influence of Ti Content on the Corrosion Properties and Contact Resistance of CrTiN Coating in Simulated Proton Exchange Membrane Fuel Cells.” International Journal of Hydrogen Energy 42 (1): 11758–11770. doi:https://doi.org/10.1016/j.ijhydene.2017.02.014.
- Khazaee, I., and M. Ghazikhani. 2011. “Performance Improvement of Proton Exchange Membrane Fuel Cell by Using Annular Shaped Geometry.” Journal of Power Sources 196 (5): 2661–2668. doi:https://doi.org/10.1016/j.jpowsour.2010.11.052.
- Mahata, T., S. R. Nair, R. K. Lenka, and P. K. Sinha. 2012. “Fabrication of Ni-YSZ Anode Supported Tubular SOFC through Iso-pressing and Co-firing Route.” International Journal of Hydrogen Energy 37 (4): 3874–3882. doi:https://doi.org/10.1016/j.ijhydene.2011.04.207.
- Markgraf, S., M. Hörenz, T. Schmiel, W. Jehle, J. Lucas, and N. Henn. 2012. “Alkaline Fuel Cells Running at Elevated Temperature for Regenerative Fuel Cell System Applications in Spacecrafts.” Journal of Power Sources 201: 236–242. doi:https://doi.org/10.1016/j.jpowsour.2011.10.118.
- Mine, E. F., Y. Ito, Y. Teranishi, M. Sato, and T. Shimizu. 2017. “Surface Coating and Texturing on Stainless-steel Plates to Decrease the Contact Resistance by Using Screen Printing.” International Journal of Hydrogen Energy 42 (1): 20224–20229. doi:https://doi.org/10.2016/j.ijhydene.2017.06.154.
- Misra, P., and J. Nagaraju. 2010. “Electrical Contact Resistance in Thin (≤0.5 μm) Gold Plated Contacts: Effect of Gold Plating Thickness.” IEEE Transactions on Components and Packaging Technologies 33 (4): 830–835. doi:https://doi.org/10.1109/TCAPT.2010.2060340.
- Mohammadi-Ahmar, A., B. Osanloo, A. Solati, and J. Ghasemi. 2016. “Performance Improvement of the Circular Tubular PEMFC by Using Different Architectures and Number of Layers.” Energy Conversion and Management 128: 238–249. doi:https://doi.org/10.1016/j.enconman.2016.09.074.
- Movahedi, M., A. Ramiar, and A. A. Ranjber. 2018. “3D Numerical Investigation of Clamping Pressure Effect on the Performance of Proton Exchange Membrane Fuel Cell with Interdigitated Flow Field.” Energy 142: 617–632. doi:https://doi.org/10.1016/j.energy.2017.10.020.
- Netwall, C. J., B. D. Gould, J. A. Rodgers, N. J. Nasello, and K. E. Swider-Lyons. 2013. “Decreasing Contact Resistance in Proton-exchange Membrane Fuel Cells with Metal Bipolar Plates.” Journal of Power Sources 227: 137–144. doi:https://doi.org/10.1016/j.jpowsour.2012.11.012.
- Othman, M. H. D., S. M. Jamil, A. F. Ismail, J. Jaafar, and M. A. Rahman. 2016. “Anode Supported Micro-tubular SOFC Fabricated with Mixed Particle Size Electrolyte via Phase-inversion Technique.” International Journal of Hydrogen Energy 42 (14): 9188–9201. doi:https://doi.org/10.1016/j.ijhydene.2016.05.016.
- Oualid, S. E., R. Lachat, D. Candusso, and Y. Meyer. 2017. “Characterization Process to Measure the Electrical Contact Resistance of Gas Diffusion Layers under Mechanical Static Compressive Loads.” International Journal of Hydrogen Energy 42 (1): 23920–23931. doi:https://doi.org/10.2016/j.ijhydene.2017.03.130.
- Prass, S. (2016). “Interfacial Morphology and Contact Resistance between the Catalyst and Microprous Layers in Proton Exchange Membrane Fuel Cells.” University Of British Columbia. doi:https://doi.org/10.14288/1.0300654.
- Saghali, Z., and J. Mahmoudimehr. 2017. “Superiority of a Novel Conic Tubular PEM Fuel Cell over the Conventional Cyilndrical One.” International Journal of Hydrogen Energy 42 (48): 28865–28882. doi:https://doi.org/10.1016/j.ijhydene.2017.10.058.
- Singdeo, D., T. Dey, and P. C. Ghosh. 2014. “Contact Resistance between Bipolar Plate and Gas Diffusion Layer in High Temperature Polymer Electrolyte Fuel Cells.” International Journal of Hydrogen Energy 39 (2): 987–995. doi:https://doi.org/10.1016/j.ijhydene.2013.10.147.
- Suseendiran, S. R., S. Pearn-Rowe, and R. Rengaswamy. 2017. “Strategies for Effective Utilization of Hydrogen in Cylindrical PEM Fuel Cells.” ECS Transactions 80 (8): 485–496. doi:https://doi.org/10.1149/08008.0485ecst.
- van Biert, L., M. Godjevac, K. Visser, and P. V. Aravind. 2016. “A Review of Fuel Cell Systems for Maritime Applications.” Journal of Power Sources 327 (X): 345–364. doi:https://doi.org/10.1016/j.jpowsour.2016.07.007.
- Wang, Y., B. Seo, B. Wang, N. Zamel, K. Jiao, and X. C. Adroher. 2020. “Fundamentals, Materials, and Machine Learning of Polymer Electrolyte Membrane Fuel Cell Technology.” Energy and AI 1: 100014. doi:https://doi.org/10.1016/J.EGYAI.2020.100014.
- Yilanci, A., I. Dincer, and H. K. Ozturk. 2009. “A Review on Solar-hydrogen/fuel Cell Hybrid Energy Systems for Stationary Applications.” Progress in Energy and Combustion Science 35 (3): 231–244. doi:https://doi.org/10.1016/j.pecs.2008.07.004.