
 ?Mathematical formulae have been encoded as MathML and are displayed in this HTML version using MathJax in order to improve their display. Uncheck the box to turn MathJax off. This feature requires Javascript. Click on a formula to zoom.
ABSTRACT
The manufacturing sector accounts for 40% and 25% of global energy and resources consumption respectively. Machining is one of the most power-intense operations in the manufacturing sector making a significant contribution to the environmental footprint. The purpose of this study is to identify the key parameters that contribute towards the environmental impacts of conventional turning. A set of experiments was designed using the Taguchi L9 method. Experiments were performed to analyse the electrical energy consumption, metalworking fluid (MWF) consumption, surface roughness, and material removal rate during turning of AISI P20 with both wet and dry machining. A life cycle assessment (LCA) was conducted to assess the environmental performance of turning. A multi-response optimisation was performed to identify the optimum operating conditions. The results show that turning with wet machining yields better machining and environmental performance compared to dry machining. The LCA results reveal that electrical energy is the highest contributor under most of the impact categories, while the effect of MWF is negligible. The use of workpiece material and cutting insert material contribute significantly to the impacts under aquatic ecosystem and resource depletion damage categories. Further, optimum parameters were proposed considering both machining performance and environmental impact.
1 Introduction
The manufacturing sector accounts for around 40% of the total global energy consumption and 25% of the global resource consumption (U.S. Energy Information Administration Citation2019) (Campitelli et al. Citation2019). Thus, it is evident that improving the ‘sustainability’ of this sector via reduced energy and resource consumption is an important goal. The manufacturing sector uses various processes in production, among which machining is prominently used in many industries (Munoz and Sheng Citation1995). Machining is one of the most energy-intense processes in the manufacturing sector, thus deserving special attention in the efforts for reducing sectoral energy consumption (Dambhare, Deshmukh, and Borade Citation2015). In the United States, around 75% of industrial electrical energy was consumed by machine tools (U.S. Energy Information Administration Citation2011). Machine tools are identified as the key energy-intensive devices in the manufacturing sector (Peng and Xu Citation2014).
Among the various types of machining operations, turning is the most commonly used technique (Nalbant, Gokkaya, and Sur Citation2007). The die and mould manufacturing industry uses turning operations for routine mould production processes. To obtain an acceptable surface quality of the machined regions and enhance the tool life, wet machining is used during turning operations (Siniawski and Bowman Citation2009). Hence, the use of energy and metalworking fluid (MWF) is significant during the routine production activities in the die and mould industry.
According to past literature, energy use and MWF are the key sources of environmental impacts related to machining (Campatelli Citation2009). Energy consumption is associated with a number of adverse impacts due to non-renewable resource use, emissions, damage to the ecosystem, land use, habitat alteration and human health risks. Higher energy use from the conventional fossil fuel supply sources increases the release of greenhouse gases such as carbon dioxide, nitrogen oxides and sulphur dioxide to the atmosphere (Huang and Ameta Citation2014). MWF, the next major source of environmental impacts, is also one of the top health threats on a machine shop floor (Schultheiss et al. Citation2013). The MWFs are toxic and non-biodegradable because they are produced using mineral oils (Pervaiz, Kannan, and Kishawy Citation2018) (Pusavec, Krajnik, and Kopac Citation2010). Moreover, some additives in MWFs contribute to the ozone layer depletion process (Dahmus and Gutowski Citation2004). During machining, the MWFs break down chemically due to high cutting temperatures and then contact with the human body both externally via skin and internally via inhalation, resulting in adverse health impacts (Campatelli Citation2009). Aforementioned adverse effects of energy and MWF use can be mitigated to some extent by optimising the machining process for reduced resource consumption.
There is a growing interest in sustainability assessments in many industrial sectors due to the significant consumption of natural resources and ultimate environmental impacts (Rao Citation2008). Yet, there is a lack of contemporary holistic environmental impact assessments carried out on conventional machining. Life Cycle Sustainability Assessment (LCSA) is a standard technique that quantifies the life cycle impacts of a product or a process on the environment, economy and society holistically from the raw material extraction to the ultimate end of life and this can be used for holistic triple bottom-line impact assessments of the manufacturing sector (Kloepffer Citation2008).
2 Literature review
Several previous studies have used the LCA technique to evaluate the sustainability performance of various practices in machining. This section briefly presents the LCA studies machining operations, LCA methodologies used, and the identified research gaps.
2.1 Machining sustainability
One study has been performed to identify the sustainability of several cooling techniques including cryogenic machining and high-pressure jet-assisted machining (HPJAM) using life cycle assessment (LCA). This study has been limited to evaluating only environmental and social impacts while assuming equal machining performance under each cooling condition (Pusavec, Krajnik, and Kopac Citation2010). Another study has been performed using LCA to identify the environmental effects created by turning of Ti-6Al-4 V at three levels of feed rate, cutting speed and machining conditions (dry, cryogenic with simple nozzle and cryogenic with two nozzles) (Mia et al. Citation2019). Pereira et al. (Citation2016) have investigated the contribution to the environmental impact by different cooling techniques during the turning operation of AISI 304 stainless steel. In the above study, the environmental impacts of alternative cooling techniques for flood lubrication (wet), namely, dry, MQL and cryogenic lubrication, have been compared. Campitelli et al. (Citation2019) used LCA to examine the resource efficiency of two different lubrication techniques (flood cooling (FL) and minimum quantity lubrication (MQL)) during drilling and milling operations of three different materials (aluminium, steel and cast iron). A recent study has compared the sustainability performance of turning of pure titanium under Ranque-Hilsch Vortex Tube-assisted MQL (RHVT-MQL) with the conventional MQL technique (Gupta et al. Citation2020).
2.2 System boundaries, functional units and reference flows used in literature
Few studies have clearly mentioned the system boundaries, functional units and reference flows of LCA studies. One machined workpiece has been considered as the functional unit for the LCA study that was conducted by Mia et al. (Citation2019). Campitelli et al. (Citation2019) have used the gate-to-gate system boundary and volume of removed material as the functional unit of LCA for both drilling and milling operations. Another study has been conducted to identify the most suitable reference flow to investigate the influence of varying cutting parameters on the environmental footprint of cylindrical plunge grinding of 21–2 N steel using the LCA technique. Machining of a single workpiece has been identified as a better reference flow compared to a one-second grinding operation (Silva et al. Citation2015).
2.3 LCA methods and analysis software
Mia et al. (Citation2019) have used the SimaPro software with European databases and impact assessment methods, Impact 2002+ and EPS 2000, to analyse damage to human health and environment. CML 2001 with the Ecoinvent database has been used by Campitelli et al. (Citation2019), for impact assessment of LCA. Silva et al. (Citation2015) have used the LCA software, GaBi (Professional version 6), to investigate the environmental footprint in terms of acidification potential (AP), global warming potential (GWP), freshwater aquatic toxicity potential (FAEP), abiotic depletion potential (ADP) and human toxicity potential (HTP) using the CML 2001 method. Gupta et al. (Citation2020) have performed LCA using SimaPro 8.3 software with two different impact assessment methods, ReCiPe Endpoint v1.12 and EPS 2000.
2.4 Research gap
There are several limitations associated with some of the previous studies in this area. One is that the contributions of different inputs on the environmental impacts have not been evaluated separately. The literature review revealed that there is a significant potential for research and improvement in controlling the machining process parameters to achieve lower energy and resource consumption from the life cycle perspective. Further investigations in this direction can lead to better operational practices throughout the life cycle instead of focusing on a single operational phase. In summary, the following specific gaps in research were revealed in the scope of sustainability of turning:
There is a lack of life cycle impact assessments carried out concerning the individual contribution of energy and resources in turning (Campitelli et al. Citation2019).
Significant process parameters associated with environmental impact have not been fully identified and evaluated.
There is a lack of evidence-based methods to develop better operational strategies for impact reduction in turning.
In particular, the material AISI P20 is commonly used in machining operations to make dies, die-casting and plastic injection dies (Chen and Xue Citation2002). Environmental performance analysis of Electro-discharge Machining of AISI P20 has been carried out previously (Gamage et al. Citation2016). However, there is a specific gap in research related to the environmental impact analysis of conventional machining operations of AISI P20.
This study aims to bridge the aforementioned research gaps by identifying the most significant process parameters contributing to the environmental impacts of conventional turning. Under this, the following objectives were defined: 1) to analyse the machining performance and overall environmental performance of commercial turning operations in the die and mould manufacturing sector, 2) to identify the contribution of different factors towards environmental impacts and 3) to analyse the effect of modifying the process parameters on the environmental impacts and thereby provide recommendations.
The methodology followed for this study is described in section 3. Analysis of data is presented in section 4. The results of the study are discussed in section 5. The final section describes the conclusions of the study.
3 Methodology
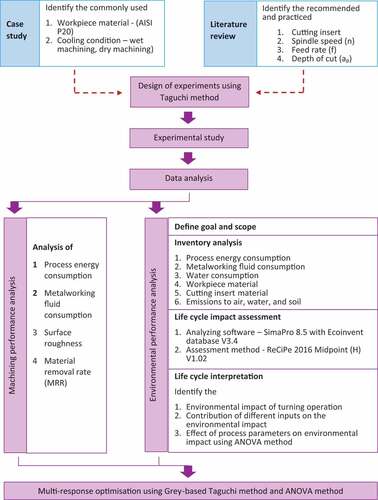
The overview of the research methodology adopted in this study is shown in . In this, the experiments were designed based on commonly practised machining conditions in the industry and previous literature. A case study was performed to identify the mostly used workpiece material and cooling conditions in the die and mould manufacturing sector. Generally practised and recommended cutting parameters were identified through literature review and three values were selected for each parameter. The design of experiments was done considering the selected cutting parameters. Then, an experimental study was performed to collect data on electric energy consumption, MWF consumption, surface roughness and material removal rate (MRR), under wet and dry machining conditions. Data analysis was performed under two categories: machining performance and environmental performance. Both machining and environmental performances under wet and dry conditions were compared to identify the better condition. As wet machining demonstrated better performance compared to dry machining, a multiresponse optimisation was done using the machining performance of wet machining to identify the best cutting parameters. Finally, a confirmation test was performed to clarify the results of multiresponse optimisation.
Figure 1. Methodology diagram of the study.
3.1 Design of experiments
The material AISI P20 was selected for this study, as it is the most commonly used material in die and mould manufacturing. The chemical composition of the workpiece material is provided in .
Table 1. Chemical composition of AISI SAE P-20 used for the research experiments (percentages in weight, %wt)
Mitsubishi TCMT16T304 CVD coated carbide (UE6110), which is one of the recommended tool inserts for AISI P20, was selected to conduct the experiments (Senevirathne Citation2015). Considering both the tool insert manufacturer’s recommendations and previous literature, the following values in , were selected for the cutting parameters in the straight turning operation of AISI P20.
Table 2. Summary of selected cutting parameters
The experiments performed under wet and dry machining conditions were designed using the Taguchi methodology, which is widely used in similar studies (Jakhar, Nayak, and Sharma Citation2017). This method is used to obtain the optimum parameters with fewer combinations (Karna and Sahai Citation2015). Taguchi L9 orthogonal array was used to perform the ANOVA (Analysis of Variance) analysis of midpoint impact categories and the multiresponse optimisation. The three cutting parameters, spindle speed (n), depth of cut (ap), and feed rate (f) were defined as variable parameters for the Taguchi L9 orthogonal array. The Taguchi L9 orthogonal array for the two machining conditions, wet machining and dry machining, is shown in .
Table 3. Design of experiments using Taguchi L9 orthogonal array
3.2 Experimental analysis
An experimental study was conducted to analyse the performance of a turning operation in terms of energy consumption, MWF consumption, surface roughness and MRR. The machining performance was measured during each experimental combination suggested by the Taguchi L9 orthogonal array under both machining conditions (wet and dry).
3.2.1 Measuring energy consumption
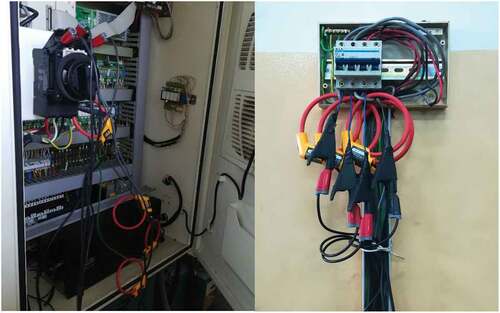
The energy consumption for the CNC lathe machine and the air conditioning system during the turning was measured using a FLUKE 1736 power logger as demonstrated by . All the lights in the machining centre were powered on during all the working time, thus simulating maximum energy use conditions for lighting. Furthermore, lighting in general, consumes between 9.5% and 29.1% of the total overhead for electricity consumption in the industrial sector, which indicates that this is a significant component contributing to environmental impacts (Akbari and Sezgen Citation1992). Hence, electricity consumption for lighting was apportioned and allocated on the basis of floor area.
Figure 2. Coupling the FLUKE 1736 power logger at the supply point of the CNC lathe machine (left) and mini circuit breaker of the air conditioning system (right).
3.2.2 Measuring metalworking fluid consumption
A mixture of EcoCool 700 NBF M (5%) and water (95%) was used as the MWF in the CNC lathe machine used for the experiments. The top-up volume of MWF was calculated considering the actual cutting time and top-up rate. This was considered to be equivalent to the MWF consumption during machining. Moreover, around 75 Litres of MWF is disposed to the environment for six months. Hence, the sum of top-up volume and apportioned disposed volume of MWF for a one-hour turning operation was taken as the functional unit representing MWF consumption for the LCA.
3.2.3 Measuring surface roughness (Ra)
The arithmetic mean surface roughness (Ra) is an effective and commonly used indicator in the industry to evaluate the quality of a machined surface (Gamage et al. Citation2017) (Smith Citation2019). Ra of the machined surface was measured using a Mitutoyo SJ-301 surface roughness tester, which had a resolution of 0.01 µm. While measuring the Ra, 2.5 mm and 20 mm were selected as the cut-off length (λ) and evaluation length, respectively.
3.2.4 Calculating material removal rates (MRR)
Three cutting parameters, spindle speed, feed rate and depth of cut, were changed in each experiment. Therefore, the volume of material removed was kept as a constant under contextualised limitations. Hence, the diameter (Ø) of the workpiece was reduced from 35 mm to 28.4 mm. The length of the cut was 40 mm as demonstrated in .
Figure 3. Associated dimensions of the workpiece.
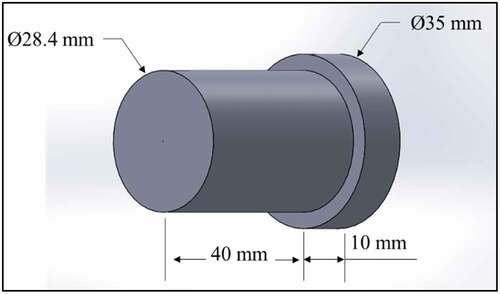
Dimensions of the workpiece to be machined were used to calculate the removed volume of material, which was 13,145.68 mm3. The time for the actual machining (turning) operation in each experiment was identified from power logger data. Using this, the material removal rates (MRR) were calculated.
4 Data analysis
The requisite data were gathered through observations, data recordings and measurements during research experiments. This section presents the analysis of experimental data, environmental performance and multiresponse optimisation.
4.1 Experimental data analysis
The recorded data of electric energy consumption by the CNC lathe machine during experiments, measured data of surface roughness, calculated data of MWF consumption and MRR after the experiments were analysed as explained below.
4.1.1 Energy consumption
The pattern of energy consumption of the ‘Tour ARIX TNC 430 CNC’ lathe machine during turning of AISI P20 in experiment no 06 is shown in . It can be observed that the STANDBY power is 0.85 0.02 kW. As indicated in previous literature, this could be due to the energy required to start-up the lathe machine, hydraulic pump, computer unit, unload motors, light system and constant power consumption of the lubricating pump (Balogun and Mativenga Citation2013). The initial surge of power ( – label ‘A’) is due to the additional power consumption of the spindle for acceleration from zero to a higher speed. This observation is also in alignment with past studies (Lv et al. Citation2017).
Figure 4. Energy consumption pattern by the CNC lathe machine during turning operation (Experiment number 6).
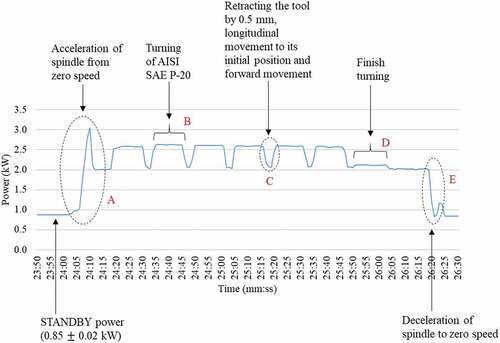
The repeating wave pattern in (label ‘B’) corresponds to each pass of the turning operation. During one pass, the tool moves the length of 40 mm to the direction, which is parallel to the axis of rotation of the workpiece, by reducing 1.1 mm from the workpiece diameter. Jogs, spindle motor, drives and coolant pump are the main components that are responsible for this increase in power consumption. Furthermore, additional power is required for the material removing process (Bilga, Singh, and Kumar Citation2016). The sudden decrement between each wave (label ‘C’) is due to the retracting of the tool by 0.5 mm away from the workpiece to move its initial position. After the coarse turning operation, a finish turning process is performed. The average power consumption during finish turning is comparatively lower than the same during rough turning as shown in – label ‘D.’ This is further validated by previous literature (Camposeco-Negrete Citation2013). The sudden fall after the finish turning (label ‘E’) corresponds to the deceleration of the spindle.
The turning time is made up of two components, machining time (tm) and nonmachining time (tnm). Machining time includes time for changeovers of the workpieces, spindle acceleration, rough turning, finish turning and spindle deceleration. The energy consumption during machining time is considered as machining energy (Em). The machining time is divided into two groups for the ease of calculation: changeover time (tco) and cutting time (tc). The aggregate of the machine set-up period, operator waiting period and finishing-up period is taken as the nonmachining time (Gamage et al. Citation2016). Energy consumption during those periods is considered to be nonmachining energy (Enm).
Both tm and tnm of the CNC lathe machine per working hour were calculated using power logger data. The calculated values of tm and tnm are 1,494 s (41%) and 2,106 s (59%), respectively. During tnm, the lathe machine operates in STANDBY mode. Hence, the Enm for one-hour turning operation is 0.50 kWh. tco depends on the operator. Moreover, due to the variation of the operator waiting period, tco of workpieces are varied. Hence, the average tco (577 s) was calculated. However, the entirety of this tco was not utilised for the changeover, as it also includes some operator waiting time. As stated in the literature, around 10% of the time is wasted due to technical problems (waiting and delays) during work (Bogatyreva et al. Citation2019). Therefore, 519 seconds is utilised for the changeover. Furthermore, ideal labour efficiency during work varies between 85% – 95% (Dragon2000, Dragon2000 Citation2017). Hence it was assumed that the operator has worked with a 90% efficiency. Accordingly, the calculated tco is 467 s. During the changeover period, the lathe machine operates under STANDBY mode. Therefore, the consumed energy per workpiece during the changeover period (Eco) was 0.11 kWh. tc per one-hour turning operation is 1027 s (tm – tco).
There were two 48,000 BTU split-type air conditioning (AC) units in the machining centre. The average energy consumed per hour for two AC units is estimated to be 6.65 kWh using the power logger data. The total floor area of the machining centre is 93.34 m2. The floor area for the CNC lathe machine including working space is 11.70 m2. It was assumed that all the machines in the machining centre were operating at that time under equal heating loads. Hence, the energy consumed per one hour of CNC turning operation by two AC units (Eac) was apportioned as 0.83 kWh. There were 20 fluorescent 40 W tube lights in the machining centre. The total power consumption for one hour is 0.80 kWh. The average energy consumed per hour of CNC turning operation by lighting (El) was 0.10 kWh. The energy consumption for fans and computers in the machining centre was excluded due to the inaccessibility of data accurately allocated to turning operation. Hence, for one-hour turning operation, the total energy consumption () was calculated using EquationEquation 1
Equation 1
Equation 1 ,
Then, the variation of energy consumption in each experiment with operating conditions was analysed.
4.1.2 Analysis of MWF consumption, Ra and MRR
The top-up volume of MWF for an eight-hour working shift is 3 Litres. According to the energy assessment, the machining time percentage for one-hour turning operation is 41% (1494 s). It includes 467 s of average changeover time and 1,027 s of average cutting time. Hence, the top-up rate of MWF during the cutting period of one-hour is 1,314.51 ml/hour. The top-up volume of MWF was calculated based on the actual cutting period in each experiment.
The collected data of MWF consumption, Ra and MRR were analysed to identify their variation with respect to each operating condition. For the analysis of MWF consumption, only the data of wet machining was considered. However, the fluctuation Ra and MRR with operating conditions under both wet and dry machining were plotted.
4.2 Environmental performance analysis
The environmental performance was assessed following the life cycle assessment (LCA) methodology. There are variants of LCA depending on the system boundary, such as cradle-to-grave, cradle-to-gate, gate-to-gate and cradle-to-cradle. To reduce the complexity of LCA and obtain more accurate and pertinent results through experimental data, the LCA of commercial turning operation under the gate-to-gate variant was conducted.
4.2.1 Goal and scope
The goal of LCA in the present study was to quantify the environmental impacts attributable to one hour of a commercial turning operation, due to the usage of energy, MWF, workpiece and tool materials. To achieve the aforementioned goal, the one-hour turning operation was chosen as the functional unit, since any combination of the selected parameters results in an acceptable surface quality for general functions (e.g. fitting the shaft to a bearing). The machining duration with general machining practices would sufficiently represent the intended function in all cases. Thus, within that region of Ra and constant volume of material removed, it is sensible to consider the functional unit as machining hours. The energy and resource consumption during commercial turning operation was observed considering the system boundary condition.
4.2.2 Inventory analysis
For the inventory analysis, the raw materials including the workpiece, cutting tool, MWF (EcoCool 700 NBF M and water) and energy were considered as the environmental inputs associated with the turning operation. The removed volume of workpiece material was defined as a constant at 13,145.68 mm3. Total energy consumption during each experiment was evaluated as described in section 3.2.1.
To obtain the MWF consumption during the one-hour turning operation for LCA, the sum of top-up volume and apportioned disposed volume in each experiment of wet machining was taken. The top-up volume for the one-hour turning period is 375 ml and around 75 L of MWF is disposed to the environment once every six months. The disposed amount of MWF for a machining hour is 273.86 ml. Hence, the MWF consumed during the one-hour turning period was estimated to be 648.86 ml.
The removed volume of tool material was variable based on the operating condition. The area of the top surface of the removed region of tool inserts was measured using SketchAndCalc Area Calculator (Shahabi and Ratnam Citation2009). The depth of the removed region was measured using Gwyddion open-source software. Then, the reduced weights of cutting inserts during turning were calculated. Cutting inserts are disposed to the environment, once they are at the end of their useful life. Hence, the total of actually removed volume and apportioned volume was taken as input for the LCA.
The outputs of the operation, emissions to air, emissions to water and emissions to soil, were estimated using the Ecoinvent database V3.4 and relevant literature. It was assumed that 5% of used MWF is lost through evaporation to the atmosphere and this was considered to be an emission to air (Clarens et al. Citation2008). The rest of EcoCool 700 NBF M and water in used MWF (95%) were considered to be emissions to soil and water, respectively. The summary of the inventory for the LCA is included in .
Table 4. Inventory summary
4.2.3 Life cycle impact assessment
To assess the life cycle environmental impacts of commercial turning operations, the SimaPro 8.5 software and the Ecoinvent database V3.4 were used. The ReCiPe 2016 Midpoint (H) V1.02 assessment method was used to quantify the environmental impacts. The ReCiPe 2016 method focuses on a wider range of impact categories comparing other impact assessment methods. Under the ecosystem damage category, the ReCiPe 2016 evaluates damage to terrestrial water, freshwater and marine water. However, the Eco-Indicator 99 evaluates damage on terrestrial water only (Goedkoop et al. Citation2009). The end point method focuses on the impact on three major areas: ecosystem, human health and resource depletion. Furthermore, it can provide greater information relevant to the environment. However, it does not analyse the damage to the man-made environment (Goedkoop et al. Citation2009) and its uncertainty is higher than the midpoint method (Huijbregts et al. Citation2016).
The environmental impacts under 18 impact categories were evaluated and results are shown in and . The obtained results were first analysed to assess the contribution of each input to different impact categories. Next, the variation of environmental impacts with different operating conditions was assessed. Finally, to identify the effect of process parameter changes on the environmental impacts, ANOVA analysis was performed using Minitab 19 statistical software. Here, the mean values of impact categories () related to each level of operating conditions were evaluated using EquationEquation 2
Equation 2
Equation 2 ,
where ‘’ is the
response at the
level of the cutting parameter and ‘
’ is the number of responses.
Most of the environmental impacts under the considered cooling condition demonstrated an identical behaviour. Hence, the impact category, Human toxicity: noncancer (HTnc), which created the largest value of impact, in both wet and dry machining is considered for the discussion.
4.3 Multiresponse optimisation
To identify the best operating condition that minimises energy consumption (E), surface roughness (Ra) and MWF consumption (MWFC) while maximising MRR, a Grey-based Taguchi method was applied (Chandrakasan, Kumanan, and Sivakumaran Citation2010). The multiresponse optimisation was performed using the following steps.
Step 1 – S/N ratios of each response were calculated using Minitab 19 statistical software. A ‘lower the better’ condition was applied for E, Ra and MWFc and corresponding S/N ratios were obtained from EquationEquation 3Equation 3
Equation 3 . EquationEquation 4
Equation 4
Equation 4 was used to calculate S/N ratios of MRR, which followed a ‘higher the better’ condition,
Step 2 – Normalised S/N ratios Zij were calculated by following EquationEquation 5Equation 5
Equation 5 for ‘smaller the better condition’ and EquationEquation 6
Equation 6
Equation 6 for ‘larger the better’ condition,
Step 3 – Deviation sequences were calculated by following EquationEquation 7
Equation 7
Equation 7 , where
is the reference sequence that equals one,
Step 4 – Grey relation coefficients of each response were calculated by using EquationEquation 8
Equation 8
Equation 8 ,
where is the distinguishing coefficient, defined in the range of
, and can be changed according to the practical needs and importance of the responses. E is the most important response. Therefore,
for E was taken to be 0.75. It considered other responses (Ra, MWFc and MRR) to be equal in importance and 0.5 was taken as
for those parameters (Radhika et al. Citation2015).
Step 5 – Grey relational grade (GRG) was calculated using EquationEquation 9Equation 9
Equation 9 ,
Where = Total number of responses (4),
= Operating condition (
),
= Responses (E =1, MRR =2, Ra = 3 and MWFc = 4).
GRG is a representative of all four responses considered. Hence, the multiresponse optimisation process has been converted into a single response optimisation problem. Here, a higher GRG corresponds to a better machining performance (Chandrakasan, Kumanan, and Sivakumaran Citation2010). To obtain the best level of each operating condition, S/N ratios of GRG under the ‘higher the better’ scenario were calculated using Minitab 19 statistical software.
To confirm the optimum operating condition, a confirmation test was performed. Then, its machining performance was compared with the initial operating conditions. Finally, an environmental performance analysis was conducted using the results of the confirmation test. Inventory analysis and life cycle impact assessment were performed following the same procedures explained in section 4.2.2 and section 4.2.3.
5 Results and discussion
This section presents the results of the experimental study, environmental performance analysis and multiresponse optimisation.
5.1 Experimental study
The analysed experimental results are presented in terms of energy consumption, metalworking fluid consumption, surface roughness and material removal rate.
5.1.1 Energy consumption
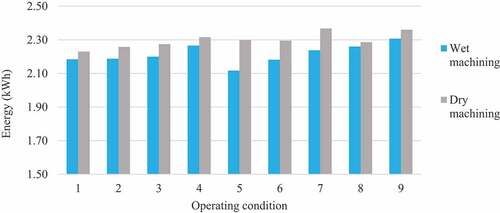
The analysed results of the correlation between energy consumption and the different operating conditions are shown in . The energy consumption of dry machining is larger than that of wet machining. The absence of MWF results in larger frictional forces between the cutting insert and the workpiece and also between the chip and the cutting insert (Diniz and Micaroni Citation2002). Larger friction forces lead to larger cutting forces (Çakır, Kıyak, and Altan Citation2004). Higher values of cutting forces lead to an increase in energy consumption during cutting (Mia et al. Citation2019).
Figure 5. The pattern of energy consumption with different operating conditions ().
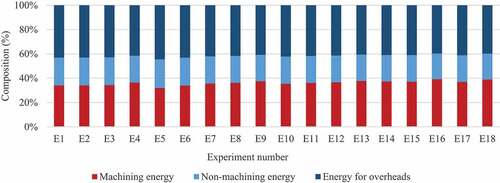
Energy consumption during turning consists of three major components: machining, nonmachining and energy for overheads. Energy for overheads represents the highest percentage of energy (40–44%) compared to other components as illustrated in . Energy for nonmachining processes is also significant and can be reduced by minimising operator waiting periods.
Figure 6. Composition of energy consumption during turning each experiment ().
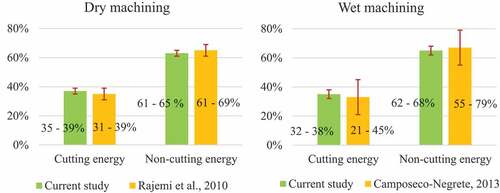
shows the comparison of energy shares identified through this study with previous literature. Noncutting energy includes the energy for nonmachining operations and overheads. It is evident from the comparison that under both dry (Rajemi, Mativenga, and Aramcharoen Citation2010) and wet machining (Camposeco-Negrete Citation2013), experimental results fall within the reasonably similar ranges.
Figure 7. Comparison of energy share of the current study with literature.
5.1.2 Metalworking fluid consumption
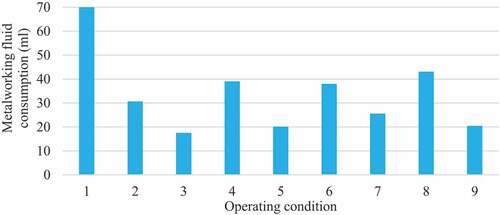
The pattern of MWF consumption during turning operation with different operating conditions is shown in . Operating conditions, 3, 5, 7 and 9 in wet machining, are responsible for smaller values of MWF usage. The common cutting parameter for operating conditions 3, 5 and 7 is the largest depth of cut (1.65 mm). However, under operating condition 9, both spindle speed and feed rate values are at their maximum values. Hence, a larger depth of cut and the combination of larger spindle speed and feed rate leads to a lower machining time. Lower machining time results in reduced MWF consumption. Then, the top-up volume during turning becomes correspondingly smaller.
Figure 8. The pattern of metalworking fluid consumption with different operating conditions () in wet machining.
5.1.3 Surface roughness
The graphical representation of the variation of surface roughness (Ra) with the operating condition is shown in . Ra under both machining conditions shows an increasing pattern with the increasing feed rate. This is also confirmed in the literature (Ghani, Rizal, and Haron Citation2014). The cutting insert easily moves over the workpiece at low feed rates resulting in a better surface finish. At higher feed rates, Ra becomes higher due to the appearance of feed marks on the machined surface as mentioned by Risbood, Dixit, and Sahasrabudhe (Citation2003). Overall, Ra in dry machining is higher than that in wet machining. Wet machining efficiently controls the temperature in the cutting zone. Smaller cutting temperatures result in lower thermal distortion of the machined region (Kaynak, Lu, and Jawahir Citation2014). This causes a low distance between peaks and valleys in surface topography and results in less Ra (Sivaiah and Chakradhar Citation2018). However, wet machining fails to absorb heat in the cutting region effectively at high spindle speeds and feed rates, thus resulting in poor surface quality, similar to dry machining.
Figure 9. Variation of surface roughness with different operating conditions ().
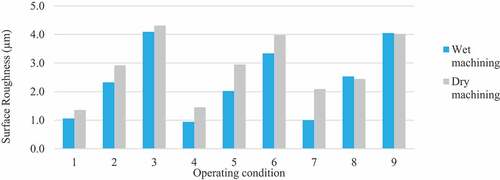
The range of surface roughness (Ra) of the machined workpieces varies between 0.9 µm and 4.3 µm. To use a shaft with minimum vibration and noise during bearing fitting, Ra should be between 0.8 µm and 1.6 µm (Tol Citation2020). Therefore, it is evident that the experimental parameters used in this study can be used to obtain an adequate quality product for most industrial applications.
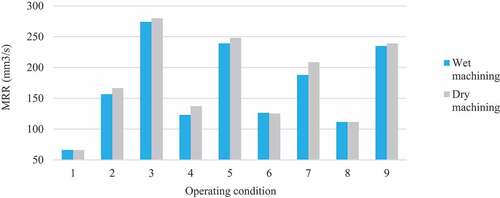
5.1.4 Material removal rate (MRR)
The variation of MRR with operating conditions is illustrated in . MRR depends on the machining time. The larger the depth of cut, feed rate and the spindle speed, the lower the machining time. When the cutting speed is higher, a larger amount of material is removed within a small cutting time. When the feed rate increases, the feed axis moves fast and the cycle time reduces (Camposeco-Negrete et al., Citation2016). Similarly, at a higher depth of cut, a larger amount of material is removed during one cut. According to the experimental results of MRR, the highest value of depth of cut (1.65 mm) and combination of the largest feed rate (0.2 mm/rev) and spindle speed (1100 rpm) give smaller machining times. Smaller machining time gives a higher MRR. This result was also confirmed by Dave, Patel, and Raval (Citation2012). MRR under a given operating condition in wet machining is approximately similar to the same in dry machining.
Figure 10. Variation of material removal rate (MRR) with different operating conditions ().
The experiments E1 to E18 were designed to represent the variations in spindle speed (n), depth of cut (ap) and feed rate (f) parameters. As recommended by the tool insert manufacturer, the values of the cutting parameters were varied within a relatively limited range. The results indicate that there are no drastic deviations in the set of observed energy values. Thus, the deviations observed are attributable to the minor variations in the parameter values as per the Taguchi L9 orthogonal array. Furthermore, the goal of the experimental analysis was mainly to identify the performance of wet machining vs. dry machining, to determine the better condition. Wet machining consistently demonstrated better performance compared to dry machining under all experimental conditions. Thus, these results were used as the basis to take wet machining forward in the analysis for a multiresponse optimisation, to identify the best cutting parameters. In addition, the experimental results have been compared with previous studies to determine their validity and it is seen that the results fall within comparable and reasonable ranges. Therefore, it can be reasonably assumed that the same conditions had prevailed throughout the set of experiments and that the experimental results are accurate.
5.2 Environmental performance analysis
and show the contribution (%) of inputs to impact categories during experiments. In the below figures, consecutive nine bars under an impact category represent the operating conditions 1 to 9 (). However, to increase the readability at the first vision, only the bars with odd numbers (1, 3, 5, 7 and 9) or even numbers (2, 4, 6 and 8) were named in the x-axis. According to and , the energy consumption shows the highest contribution among all inputs, in most of the impact categories. The impact categories, climate change (CC) and terrestrial ecotoxicity (TET) and fossil resource scarcity (FD), are influenced by the energy consumption of more than 77%, 66% and 75%, respectively. Around 52% of electricity is produced from fuel oils (diesel and gasoline) and coal in Sri Lanka (World Data Citation2019). Life cycle impacts of fossil fuel-based energy are significant (Muthukumarana et al. Citation2018). Moreover, the workpiece material, AISI P20 also contributes to more than 70% of the impact categories of eutrophication and toxicity. There is an increasing pattern of the contribution of cutting insert material with increasing spindle speed. It largely contributes to the impact categories ionising radiation (IR), land use (LO) and mineral resource scarcity (MRD), showing more than 35%, 54% and 60% contributions, respectively. Due to the larger composition of metals, Ti and Cr in the workpiece and cutting insert materials, their effects on aquatic ecosystems are higher (Miller et al. Citation2010). However, the effect of MWF on the environment can be neglected.
Figure 11. Contribution of inputs on impact categories in wet machining under different operating conditions ().
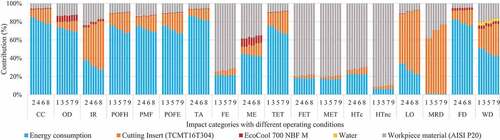
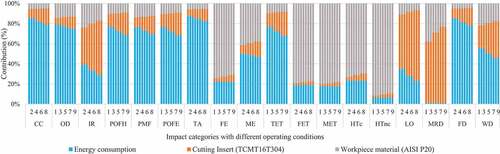
Figure 12. Contribution of inputs on impact categories in dry machining under different operating conditions ().
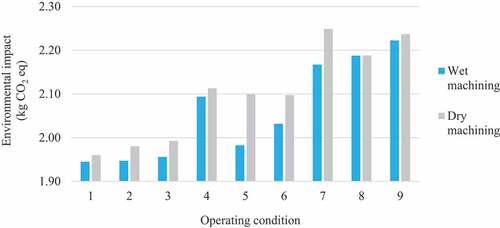
Most of the impact categories excluding IR, LO, MRD and water use (WD) show a similar variation with different operating conditions. Hence, the impact category CC, which represents the most critical environmental burden (Pandey, Dogan, and Taskin Citation2020), under different operating conditions is shown in and considered for the discussion. Overall, wet machining shows a lower impact in each operating condition compared with dry machining. The pattern of variation of CC is similar to the pattern of energy consumption during turning operations. Moreover, energy is the largest contributor to CC. Hence, it is clear that energy consumption is directly proportional to the CC impact. However, the impact categories IR, LO, MRD and WD appear to be higher with the increasing spindle speed. This is due to the increasing use of cutting insert material with spindle speed and a larger effect of cutting insert material on those impact categories.
Figure 13. Variation of climate change with operating conditions.
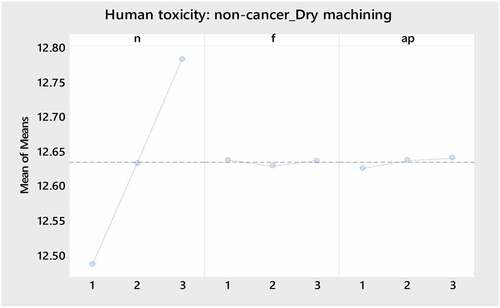
Variation of means of Human toxicity: noncancer (HTnc) in both wet machining and dry machining is shown in and , respectively. In both wet machining and dry machining, spindle speed (n) shows a greater effect on the HTPnc than the other two cutting parameters: feed rate (f) and depth of cut (ap). Variation of HTnc with the change in the feed rate can be neglected. However, HTnc at feed rate level 2 is slightly lower than that of the other two levels in both cooling conditions. The effect of ap on environmental impacts depends on the cooling condition. The smallest HTnc is given by the largest ap in wet machining and the smallest ap in dry machining. However, the effect of ap on the HTnc can be neglected compared to the effect of n. Similarly, n is the most influential cutting parameter on the other impact categories, whilst f and ap show negligible effects.
Figure 14. Variation of the environmental impact with the change in cutting parameters in wet machining (n: spindle speed, f: feed rate and ap: depth of cut).
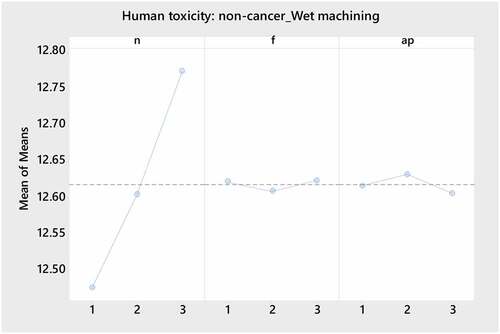
Figure 15. Variation of environmental impact with the change of cutting parameters in dry machining (n: spindle speed, f: feed rate, ap: depth of cut).
5.3 Multiresponse optimisation
Wet machining shows better environmental performance compared to dry machining. Hence, the machining performance in wet machining was selected for multiresponse optimisation. Results of deviation sequence (), grey relation coefficient (
) and grey relational grades (GRG,
) are summarised in . According to the variation of S/N ratios of GRG with levels of operating conditions as illustrated in , level 2 of spindle speed, n (980 rpm), level 1 of feed rate, f (0.10 mm/rev) and level 3 of depth of cut, ap (1.65 mm) offer the optimum machining performance.
Figure 16. Signal to noise ratios of grey relational grades.
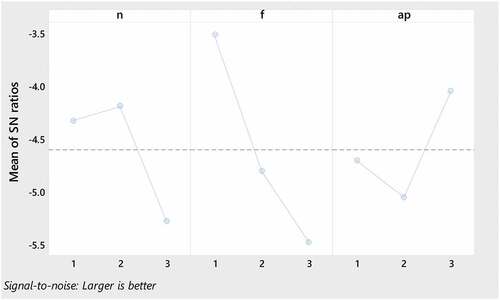
Table 5. Deviation sequences, grey relation coefficients and grey relational grades of responses
5.3.1 Confirmation test
The results of the confirmation test (CT) are summarised in . The most important response, energy consumption (E), of the CT is 2.17 kWh. Compared to the initial operating conditions, it is relatively smaller as illustrated in . The surface roughness (Ra) of CT is smaller than all surface roughness values under initial operating conditions. MWF consumption (MWFc) during CT is also relatively smaller. However, the MRR is not at its maximum level as expected. To minimise E, Ra and MWFc, the MRR has to be compromised without striving for the best possible value.
Figure 17. Comparison of machining performance of the confirmation test (CT); (a) Energy consumption, (b) Material removal rate (MRR), (c) Surface roughness and (d) Metalworking fluid consumption.
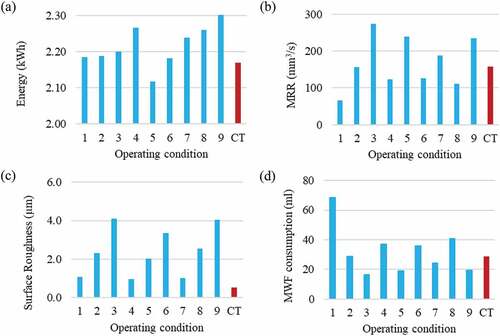
Table 6. Machining performance of the confirmation test
Environmental impacts of the CT were compared with the initial operating conditions and results are shown in . The improvements of environmental impacts relative to the maximum and minimum values of each impact category in initial operating conditions were evaluated and results are shown in 6th and 7th columns in . When considering the improvements in impact categories of the CT compared to the maximum impact values of initial operating conditions, they vary between 2% and 38%. A larger reduction of environmental impacts was demonstrated by the CT under the impact categories: mineral resource scarcity (MRD) (38%), land use (LO) (36%) and ionising radiation (IR) (28%). The highest impact categories, human toxicity: noncancer, terrestrial ecotoxicity and climate change, show 2%, 16% and 12% reduction, respectively. Most of the impact categories of CT maintain their values at the minimum level as initial operating conditions. However, there is a slight increment of impact categories: MRD (2%), LO (1%) and IR (1%) compared to their minimum levels. Hence, it is clear that the optimised operating condition can be used to obtain better machining and environmental performance.
Table 7. Environmental impacts of optimised operating conditions
5.4 Holistic implications on sustainable machining
The results of this study present the current context of turning operation in the Die and Mould Manufacturing (DMM) sector, which is one of the most influencing sectors in emerging economies. Electrical energy consumption is the largest contributor to environmental impact under each damage category as shown by . It is evident from the energy study that around 22% and 42% of total energy are consumed for non-machining operations and overheads, respectively. However, these operations are essential to perform a machining job. However, it is essential to reduce unnecessary energy consumption during turning considering its significance. Hence, it is important to reduce the time for non-machining operations by setting standard times for those operations through time studies. Reduction of overhead energy could also have a favourable impact. Smart and conscious use of the Air Conditioning (AC) systems and lights during the non-working period would be an effective approach. Furthermore, keeping the other non-operating machines switched off would reduce overall energy consumption and the heat load on the shop floor, thus reducing cooling energy (Renna Citation2018). The awareness of the management and shop floor staff is paramount in realising these savings.
Figure 18. Contribution of inventories on endpoint damage categories.
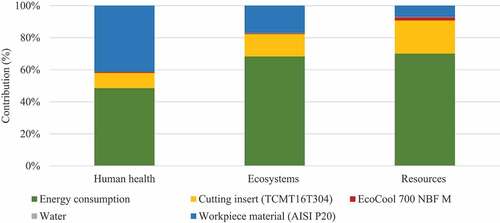
The second-highest impact is due to the cutting insert material (TCMT16T304 CVD coated carbide (UE6110)) and the workpiece material (AISI P20) as illustrated by . Even by using the manufacturer recommended and commercially practised cutting inserts with AISI P20 workpiece, the environmental impact is considerable. This was around 50% of the human health damage category and 30% of the other two categories, ecosystems and resources. It is not clear whether the manufacturer recommendation on cutting insert materials is partly based on the environmental impact. However, the use of recommended tool materials may yield better performance of the job being done and thus saving some unnecessary repetition or reworking energy losses.
Selecting appropriate cutting parameters for turning is essential in improving the sustainability of machining. It is evident from the results that the environmental impact highly depends on the variation of spindle speed. However, it is important to keep both machining and environmental performance at their best levels. The machining parameters identified through multiresponse optimisation can be used to develop more sustainable turning operations under a similar context. The same approach can be followed to obtain better machining parameters for the sustainable turning of other materials too. Moreover, machining sustainability can be improved if tool manufacturers could recommend the acceptable ranges of cutting parameters by considering not only machining performance but also the environmental impact.
6 Conclusions
This study was designed to identify the significant contributors and process parameters of the environmental impact of conventional turning in the die and mould manufacturing sector. The findings of this study present the current status of turning operations in the die and mould sector in terms of environmental impacts, major contributors and significant cutting variables of turning operation, which should be considered in enhancing sustainability.
The major contributions of this study can be summarised based on the objectives. The first objective of analysing the machining performance and overall environmental performance of commercial turning operations in the die and mould manufacturing sector was achieved through experimental study and environmental performance analysis. The turning of AISI P20 with wet machining yields lower energy consumption, surface roughness and environmental impact compared to dry machining. Moreover, a larger depth of cut and spindle speed-feed rate combinations results in lower machining times. It leads to a small amount of MWF usage and higher material removal rates.
The second objective of the study was to identify the contribution of different sources of environmental impact. Energy consumption and most midpoint impact indicators show corresponding variations because energy is the largest contributor towards the environmental impacts of machining. The cutting insert and workpiece materials also contribute significantly to environmental impacts, especially in the freshwater and marine ecosystem categories. However, the effect of MWF on environmental impacts can be neglected, compared to other inputs.
The third objective of identifying the effect of process parameters on the environmental impacts and providing recommendations was achieved through ANOVA analysis and multiresponse optimisation. The impact categories are highly influenced by the change in spindle speed (n) and a smaller ‘n’, which leads to lower impacts. However, the effect of the change in both the feed rate and the depth of cut on environmental impacts is negligible. To obtain the optimum machining performance whilst keeping the environmental impacts at their minimum level, the best operating conditions of spindle speed (n) = 980 rpm, feed rate (f) = 0.10 mm/rev and depth of cut (ap) = 1.65 mm can be proposed in the given context for turning of AISI P20 under wet machining.
Therefore, this study gives good insights into the practice of sustainable machining in the die and mould manufacturing centres with existing facilities. The novel contributions of this study are life cycle impact assessment for process elements and statistical analysis-based approach developed for the assessment of contributors and critical parameters. The findings of this study will be useful to industry practitioners to comprehend the importance of optimising the electrical energy and resource usage during machining to obtain more economically and environmentally sound machining operations. Furthermore, policy developers can use the results of this study to develop new policies or modify the existing policies regarding the environment concerning the most influencing contributors on the environmental impact during machining.
6.1 Limitations and further research
The working period in the machining centre was limited due to COVID-19 and hence, the power logger was coupled to the air conditioning system only for two consecutive working days, five hours per day. Moreover, energy consumption during the nonmachining period was obtained over three full working days. More accurate energy analysis could be performed by widening the data collection window. Moreover, much better results for the nonmachining and changeover periods could be obtained through a detailed time study. Here, only one set of experiments were conducted due to practical constraints in the given case study. It is suggested to conduct further experiments for varying cutting conditions to validate the findings in future research. In addition, the following future research directions are proposed:
The study can be extended to cover the economic and social aspects.
Gaseous emissions can be included in the study for much precise analysis, leading to operator health and safety. However, the impact of this relative to the effort of research has to be considered.
Acknowledgments
The authors would like to acknowledge the University of Moratuwa, Sri Lanka, for the financial support given through the University Senate Research Committee research grant (Grant numbers: SRC/CAP/2018/04, SRC/ST/2019/23 and SRC/ST/2019/50). The authors would further like to express their thanks to the collaboration and support given by Mr K. H. J. Mangala, Mr I. M. J. Priyankara and all the technicians in the Die & Mould Facilitation and Development Centre of the University of Moratuwa.
Disclosure statement
No potential conflict of interest was reported by the author(s)
Additional information
Funding
Notes on contributors
Raneesha Fernando
W. L. Raneesha Fernando is an MSc student in the Department of Mechanical Engineering, University of Moratuwa, Sri Lanka. She received her B.Sc degree in Mechanical and Manufacturing Engineering from the University of Ruhuna, Sri Lanka, in 2019. Her research interests include manufacturing engineering, material science, sustainable manufacturing and nanotechnology.
Janaka Gamage
Dr Janaka Ranganath Gamage is a Senior Lecturer in the Department of Mechanical Engineering, University of Moratuwa, Sri Lanka. He obtained his PhD in Sustainable Manufacturing - Unconventional Machining from Glasgow Caledonian University in 2017 and MPhil in Automotive Remanufacturing from the University of Strathclyde in 2015. His research focuses on sustainable Manufacturing, Unconventional Machining, Remanufacturing and Industrial Engineering. Please refer https://scholar.google.com/citations?user=kDf7wTIAAAAJ&hl=en for more information about his publications.
Hirushie Karunathilake
Dr Hirushie P Karunathilake is a Lecturer in the Department of Mechanical Engineering, University of Moratuwa, Sri Lanka. She received her PhD from the University of British Columbia in 2019. Her fields of expertise are energy systems, project management and industrial engineering. Please refer https://scholar.google.com/citations?user=QOusdz8AAAAJ&hl=en for more information about her publications.
Notes
1. W.r.t. – With respect to
References
- Akbari, H., and O. Sezgen. 1992. “Analysis of Energy Use in Building Services of the Industrial Sector in California: Two Case Studies.” Energy and Buildings 19 (2): 133–141. doi:10.1016/0378-7788(92)90007-4.
- Balogun, V. A., and P. T. Mativenga. 2013. “Modelling of Direct Energy Requirements in Mechanical Machining Processes.” J. Clean. Prod 41: 179–186. doi:10.1016/j.jclepro.2012.10.015.
- Bilga, P. S., S. Singh, and R. Kumar. 2016. “Optimization of Energy Consumption Response Parameters for Turning Operation Using Taguchi Method.” J. Clean. Prod 137: 1406–1417. doi:10.1016/j.jclepro.2016.07.220.
- Bogatyreva, I. V., L. A. Ilyukhina, M. V. Simonova, and N. V. Kozhukhova, 2019. “Estimation of the Efficiency of Working Time Usage as a Factor of Sustainable Increase of Labor Productivity.” SHS Web of Conferences, pp. 1–5, Gdańsk - Nynäshamn, Poland. 10.1051/shsconf/20196206002.
- Çakır, O., M. Kıyak, and E. Altan. 2004. “Comparison of Gases Applications to Wet and Dry Cuttings in Turning.” Journal of Materials Processing Technology 153-154: 35–41. doi:10.1016/j.jmatprotec.2004.04.190.
- Campatelli, G., 2009. “Analysis of the Environmental Impact for a Turning Operation of AISI 1040 Steel.” IPROMS Conference (pp. 6-17).
- Campitelli, A., J. Cristobal, J. Fischer, B. Becker, and L. Schebek. 2019. “Resource Efficiency Analysis of Lubricating Strategies for Machining Processes Using Life Cycle Assessment Methodology.” Journal of Cleaner Production 222: 464–475. doi:10.1016/j.jclepro.2019.03.073.
- Camposeco-Negrete, C. 2013. “Optimization of Cutting Parameters for Minimizing Energy Consumption in Turning of AISI 6061 T6 Using Taguchi Methodology and ANOVA.” Journal of Cleaner Production 53: 195–203. doi:10.1016/j.jclepro.2013.03.049.
- Camposeco-Negrete, C., J. D. C. D. Nájera, and J. C. Miranda-Valenzuela. 2016. “Optimization of Cutting Parameters to Minimize Energy Consumption during Turning of AISI 1018 Steel at Constant Material Removal Rate Using Robust Design.” . The International Journal of Advanced Manufacturing Technology 83 (5–8): 1341–1347. doi:10.1007/s00170-015-7679-9.
- Chandrakasan, A., S. Kumanan, and N. Sivakumaran. 2010. “Application of Grey Based Taguchi Method in Multi-Response Optimization of Turning Process.” Adv. Prod. Eng. Manag 5: 171–180.
- Chen, J., and L. Xue, 2002. “Microstructural Characteristics of Laser-clad AISI P20 Tool Steel.” The 1st ASM International Surface Engineering & the 13th IFHTSE Congress. pp. 198–205, Columbus, Ohio.
- Clarens, A. F., J. B. Zimmerman, G. A. Keoleian, K. F. Hayes, and S. J. Skerlos. 2008. “Comparison of Life Cycle Emissions and Energy Consumption for Environmentally Adapted Metalworking Fluid Systems.” . Environmental Science & Technology 42 (22): 8534–8540. doi:10.1021/es800791z.
- Dahmus, J. B., and T. G. Gutowski. 2004. “An Environmental Analysis of Machining, In: Proceedings of IMECE2004.” California 1–10. doi:10.1115/IMECE2004-62600.
- Dambhare, S. G., S. J. Deshmukh, and A. B. Borade. 2015. “Machining Parameter Optimization in Turning Process for Sustainable Manufacturing.” Int. J. Ind. Eng. Comput 6: 327–338. doi:10.5267/j.ijiec.2015.3.002.
- Dave, H. K., L. S. Patel, and H. K. Raval. 2012. “Effect of Machining Conditions on MRR and Surface Roughness during CNC Turning of Different Materials Using TiN Coated Cutting Tools – A Taguchi Approach.” Int. J. Ind. Eng. Comput 3: 925–930. doi:10.5267/j.ijiec.2012.04.005.
- Diniz, A. E., and R. Micaroni. 2002. “Cutting Conditions for Finish Turning Process Aiming: The Use of Dry Cutting.” International Journal of Machine Tools and Manufacture 42 (8): 899–904. doi:10.1016/S0890-6955(02)00028-7.
- Dragon2000, 2017. “Labour Efficiency Explained [WWW Document].” URL https://www.dragon2000.co.uk/labour-efficiency-explained/ (accessed 11. 26.20).
- Gamage, J. R., A. K. M. Desilva, C. S. Harrison, and D. K. Harrison. 2016. “Process Level Environmental Performance of Electrodischarge Machining of Aluminium (3003) and Steel (AISI P20).” . Journal of Cleaner Production 137: 291–299. doi:10.1016/j.jclepro.2016.07.090.
- Gamage, J. R., A. K. M. Desilva, D. Chantzis, and M. Antar. 2017. “Sustainable Machining: Process Energy Optimisation of Wire Electrodischarge Machining of Inconel and Titanium Superalloys.” . Journal of Cleaner Production 164: 642–651. doi:10.1016/j.jclepro.2017.06.186.
- Ghani, J. A., M. Rizal, and C. H. C. Haron. 2014. “Performance of Green Machining: A Comparative Study of Turning Ductile Cast Iron FCD700.” Journal of Cleaner Production 85: 289–292. doi:10.1016/j.jclepro.2014.02.029.
- Goedkoop, M., R. Heijungs, M. Huijbregts, S. A. De, Struijs, J. Zelm, and R. Van, 2009. “ReCiPe 2008.”
- Gupta, M. K., Q. Song, Z. Liu, C. I. Pruncu, M. Mia, G. Singh, J. A. Lozano, et al. 2020. “Machining Characteristics Based Life Cycle Assessment in Eco-benign Turning of Pure Titanium Alloy.” Journal of Cleaner Production 251: 119598. doi:10.1016/j.jclepro.2019.119598.
- Huang, H., and G. Ameta. 2014. “Computational Energy Estimation Tools for Machining Operations during Preliminary Design.” International Journal of Sustainable Engineering 7 (2): 130–143. doi:10.1080/19397038.2013.862580.
- Huijbregts, M. A. J., Z. J. N. Steinmann, P. M. F. Elshout, G. Stam, F. Verones, M. D. M. Vieira, A. Hollander, M. Zijp, Zelm, and R. Van. 2016. “ReCiPe 2016 V1.1.” A Harmonized Life Cycle Impact Assessment Method at Midpoint and Endpoint Level. Report I: Characterization, pp. 1-40.
- Jakhar, V., M. Nayak, and N. Sharma. 2017. “A Literature Review on Optimization of Input Cutting Parameters for Improved Surface Finish in Turning Process.” Int. Res. J. Eng. Technol 4: 2810–2815.
- Karna, S. K., and R. Sahai. 2015. “An Overview on Taguchi Method.” Int. J. Eng. Math. Sci 1: 11–18.
- Kaynak, Y., T. Lu, and I. S. Jawahir. 2014. “Cryogenic Machining-Induced Surface Integrity: A Review and Comparison with Dry, MQL, and Flood-Cooled Machining.” Machining Science and Technology 18 (2): 149–198. doi:10.1080/10910344.2014.897836.
- Kloepffer, W. 2008. “Life Cycle Sustainability Assessment of Products.” The International Journal of Life Cycle Assessment 13 (2): 89–95. doi:10.1065/lca2008.02.376.
- Lv, J., R. Tang, W. Tang, Y. Liu, Y. Zhang, and S. Jia. 2017. “An Investigation into Reducing the Spindle Acceleration Energy Consumption of Machine Tools.” Journal of Cleaner Production 143: 794–803. doi:10.1016/j.jclepro.2016.12.045.
- Mia, M., M. K. Gupta, J. A. Lozano, D. Carou, D. Y. Pimenov, G. Krolczyk, A. M. Khan, and N. R. Dhar. 2019. “Multi-objective Optimization and Life Cycle Assessment of Eco-friendly Cryogenic N2 Assisted Turning of Ti-6Al-4V.” Journal of Cleaner Production 210: 121–133. doi:10.1016/j.jclepro.2018.10.334.
- Miller, R. J., H. S. Lenihan, E. B. Muller, N. Tseng, S. K. Hanna, and A. A. Keller. 2010. “Impacts of Metal Oxide Nanoparticles on Marine Phytoplankton.” Environmental Science & Technology 44 (19): 7329–7334. doi:10.1021/es100247x.
- Munoz, A. A., and P. Sheng. 1995. “An Analytical Approach for Determining the Environmental Impact of Machining Processes.” Journal of Materials Processing Technology 53 (3–4): 736–758. doi:10.1016/0924-0136(94)01764-R.
- Muthukumarana, T. T., H. P. Karunathilake, H. K. G. Punchihewa, M. M. I. D. Manthilake, and K. N. Hewage. 2018. “Life Cycle Environmental Impacts of the Apparel Industry in Sri Lanka: Analysis of the Energy Sources.” . Journal of Cleaner Production 172: 1346–1357. doi:10.1016/j.jclepro.2017.10.261.
- Nalbant, M., H. Gokkaya, and G. Sur. 2007. “Application of Taguchi Method in the Optimization of Cutting Parameters for Surface Roughness in Turning.” Materials & Design 28 (4): 1379–1385. doi:10.1016/j.matdes.2006.01.008.
- Pandey, S., E. Dogan, and D. Taskin. 2020. “Production-based and Consumption-based Approaches for the Energy-growth-environment Nexus: Evidence from Asian Countries.” Sustainable Production and Consumption 23: 274–281. doi:10.1016/j.spc.2020.06.006.
- Peng, T., and X. Xu. 2014. “A Holistic Approach to Achieving Energy Efficiency for Interoperable Machining Systems.” International Journal of Sustainable Engineering 7 (2): 111–129. doi:10.1080/19397038.2013.811558.
- Pereira, O., A. Rodriguez, A. I. Fernández-abia, J. Barreiro, and L. N. Lopez de Lacalle. 2016. “Cryogenic and Minimum Quantity Lubrication for an Eco-efficiency Turning of AISI 304.” Journal of Cleaner Production 139: 440–449. doi:10.1016/j.jclepro.2016.08.030.
- Pervaiz, S., S. Kannan, and H. Kishawy. 2018. “An Extensive Review of the Water Consumption and Cutting Fluid Based Sustainability Concerns in the Metal Cutting Sector.” Journal of Cleaner Production 197: 134–153. doi:10.1016/j.jclepro.2018.06.190.
- Pusavec, F., P. Krajnik, and J. Kopac. 2010. “Transitioning to Sustainable Production – Part I: Application on Machining Technologies.” Journal of Cleaner Production 18 (2): 174–184. doi:10.1016/j.jclepro.2009.08.010.
- Radhika, N., G. K. Chandran, P. Shivaram, and K. T. V. Karthik. 2015. “Multi-Objective Optimization of EDM Parameters Using Grey Relation Analysis.” J. Eng. Sci. Technol 10: 1–11.
- Rajemi, M. F., P. T. Mativenga, and A. Aramcharoen. 2010. “Sustainable Machining: Selection of Optimum Turning Conditions Based on Minimum Energy Considerations.” Journal of Cleaner Production 18 (10–11): 1059–1065. doi:10.1016/j.jclepro.2010.01.025.
- Rao, R. V. 2008. “Environmental Impact Assessment of Manufacturing Processes Using a Combinatorial Mathematics Based Decision Making Method.” Int. J. Sustain. Eng 1 (1): 42–50. doi:10.1080/19397030801972611.
- Renna, P. 2018. “Energy Saving by Switch-off Policy in a Pull-controlled Production Line.” Sustainable Production and Consumption 16: 25–32. doi:10.1016/j.spc.2018.05.006.
- Risbood, K. A., U. S. Dixit, and A. D. Sahasrabudhe. 2003. “Prediction of Surface Roughness and Dimensional Deviation by Measuring Cutting Forces and Vibrations in Turning Process.” J. Mater. Process. Technol 132 (1–3): 203–214. doi:10.1016/S0924-0136(02)00920-2.
- Schultheiss, F., J. Zhou, E. Gröntoft, and J.-E. Ståhl. 2013. “Sustainable Machining through Increasing the Cutting Tool Utilization.” Journal of Cleaner Production 59: 298–307. doi:10.1016/j.jclepro.2013.06.058.
- Senevirathne, S. W. M. A. I. 2015. “Effect of Air and Chilled Emulsion Minimum Quantity Lubrication (ACEMQL) in Machining Hard to Cut Metals.” University of Moratuwa.
- Shahabi, H. H., and M. M. Ratnam. 2009. “In-cycle Monitoring of Tool Nose Wear and Surface Roughness of Turned Parts Using Machine Vision.” The International Journal of Advanced Manufacturing Technology 40 (11–12): 1148–1157. doi:10.1007/s00170-008-1430-8.
- Silva, D. A. L., R. A. P. Filleti, A. L. Christoforo, E. J. Silva, and A. R. Ometto, 2015. “Application of Life Cycle Assessment (LCA) and Design of Experiments (DOE) to the Monitoring and Control of a Grinding Process.” The 22nd CIRP Conference on Life Cycle Engineering Application. Elsevier B.V., pp. 508–513, Sydney, Australia. 10.1016/j.procir.2015.01.037.
- Siniawski, M., and C. Bowman. 2009. “Metal Working Fluids: Finding Green in the Manufacturing Process.” Industrial Lubrication and Tribology 61 (2): 60–66. doi:10.1108/00368790910940374.
- Sivaiah, P., and D. Chakradhar. 2018. “Effect of Cryogenic Coolant on Turning Performance Characteristics during Machining of 17-4 PH Stainless Steel : A Comparison with MQL, Wet, Dry Machining.” CIRP J. Manuf. Sci. Technol 21: 86–96. doi:10.1016/j.cirpj.2018.02.004.
- Smith, B., 2019. “Why Is Surface Finish Important in Engineering Applications? [WWW Document].” URL https://www.azom.com/article.aspx?ArticleID=17627 (accessed 4. 27.20).
- Tol, N. V., 2020. “Shaft Considerations for Bearing Applications Part 2: Roughness [WWW Document].” URL https://toolbox.igus.com/motion-plastics-blog/shaft-roughness-considerations-for-bearing-applications (accessed 8.21.21).
- U.S. Energy Information Administration, 2011. “Annual Energy Review [WWW Document].” URL http://www.eia.gov/totalenergy/data/annual/index.cfm (accessed 3. 20.21).
- U.S. Energy Information Administration. 2019. International Energy Outlook 2019. Washington.
- World Data, 2019. “Energy Consumption in Sri Lanka [WWW Document].” URL https://www.worlddata.info/asia/sri-lanka/energy-consumption.php (accessed 9.24.20).
Appendix A
Table A1. Life cycle impacts of turning operations under wet machining
Table A2. Life cycle impacts of turning operation under dry machining
