
 ?Mathematical formulae have been encoded as MathML and are displayed in this HTML version using MathJax in order to improve their display. Uncheck the box to turn MathJax off. This feature requires Javascript. Click on a formula to zoom.
ABSTRACT
Moving towards a circular and sustainable economy requires improving the management of municipal solid waste (MSW) increasing recycling rates while minimising unsorted waste and operational costs. It is essential to evaluate the economic and environmental efficiency of MSW services. Previous studies focused on developed countries and employed radial parametric and non-parametric methods. By contrast, this study assessed the technical efficiency, environmental efficiency and eco-efficiency of several Chilean municipalities employing the non-radial range adjusted measure approach. A second stage of assessment was conducted to explore the influence of a set of environmental variables on efficiency scores. Results revealed that the evaluated Chilean municipalities performed poorly from a technical perspective since the average technical efficiency score was 0.484. By contrast, average environmental efficiency and eco-efficiency scores were 0.899 and 0.922, respectively. Nevertheless, the percentage of eco-efficient municipalities was lower than 1%. It was also found that tourism had a major and negative impact on all types of efficiency. By contrast, population density had a significant and positive impact on environmental efficiency. The assessment of three types of efficiency provides relevant information to policymakers to define specific strategies to improve MSW management according to sustainability and circular economic objectives.
1. Introduction
Municipal solid waste (MSW) management is one of the most basic services carried out by municipalities (Sharma, Ganguly, and Gupta Citation2018; Salazar-Adams Citation2021). Over the last decades, the solid waste sector has undergone several reforms to deal with growing population, increased demand for resources, higher urbanisation and economic growth (Simões, Cruz, and Marques Citation2012b). Examples of these reforms include the promotion of circular economy, which aims to maintain the value of products, materials and resources for as long as possible by returning them into the product cycle at the end of their use, while minimising the generation of waste (European Commission Citation2020). The move towards a sustainable and greener economy and society where people’s health and conservation of environmental are of great importance requires sustainable waste management (United Nations Citation2015; Sharma, Ganguly, and Gupta Citation2019).
Despite the efforts at national and local level, the amount of waste generated is not going down (Hettiarachchi et al. Citation2018; European Commission Citation2020). Kaza et al. (Citation2018) noted that the volume of waste generated could increase to 3.4 billion tons by 2050 from 2 billion tons in 2016. Hence, the management of more MSW over time becomes a major concern for countries because if it is not properly managed can have serious negative economic and environmental consequences (Medina-Mijangos, De Andrés, and Guerrero-Garcia-Rojas Citation2021; Jaafarzadeh et al. Citation2021). As waste services are usually provided by municipalities, their efficient management through a reduction of operating costs could improve economic efficiency and potentially lead to lower tariffs and better quality of service (Guerrini et al. Citation2017; Amaral et al., Citation2022). From an environmental point of view, an efficient management of the MSW could lead to an increase in MSW recycling and a reduction of unsorted waste fulfilling circular economy targets and boosting environmental sustainability (Foggia and Beccarello Citation2018, Citation2020; Guoyan et al. Citation2022; Struk and Boďa Citation2022). Taking into account the economic and environmental relevance of an adequate MSW management, a proper evaluation of the efficiency of waste sector requires the joint assessment of economic and environmental performance, i.e. eco-efficiencyFootnote1 (Romano and Molinos-Senante Citation2020; Delgado-Antequera et al. Citation2021). Prior studies (e.g. Diaz-Villavicencio et al., Citation2017; Sarra, Mazzocchitti, and Rapposelli Citation2017; Agovino et al., Citation2018; Halkos and Petrou Citation2019; Romano and Molinos-Senante Citation2020; Llanquileo-Melgarejo et al. Citation2021) have evidenced the relevance of assessing the eco-efficiency of municipalities in the provision of MSW services to define strategies that could lead to improvements in MSW management.
From a methodological perspective, the measurement of the performance of the management of MSW services can be conducted using parametric and non-parametric techniques. The former approach estimates efficiency econometrically by specifying a functional form for the production technology (Coelli et al. Citation2005). This is a relevant limitation since the analyst has to make different assumptions regarding the distribution of the efficient frontier such as half-normal and exponential (e.g. Simões and Marques Citation2011; Carvalho and Marques Citation2014; Swart and Groot Citation2015; Foggia and Beccarello Citation2018, Citation2020; Fan et al. Citation2020). The most widely used parametric technique is Stochastic Frontier Analysis (SFA). In contrast, non-parametric techniques do not require the specification of a functional form for the production technology. The efficient frontier is constructed using observed input and output data using linear programming methods. The most widely used non-parametric approach is Data Envelopment AnalysisFootnote2 (DEA) (e.g. Simões and Marques, Citation2012; Sarra, Mazzocchitti, and Rapposelli Citation2017; Guerrini et al. Citation2017; Castillo-Giménez, Montañés, and Picazo-Tadeo Citation2019).
Both techniques (parametric and non-parametric) have been used to evaluate the eco-efficiency of the solid waste sector in developed countries, such as in Italy, Spain and Portugal (see, for instance, Marques and Simoes Citation2009; Simoes et al., Citation2010; Rogge and De Jaeger Citation2013; Guerrini et al. Citation2017; Sarra, Mazzocchitti, and Rapposelli Citation2017; Díaz-Villavicencio, Didonet, and Dodd Citation2017; Expósito and Velasco, Citation2018). By contrast, few studies exist from developing economies such as in Chile (see, for instance, Llanquileo-Melgarejo et al. Citation2021; Llanquileo-Melgarejo and Molinos-Senante Citation2021). It should be noted that Latin American countries have witnessed a significant rise in urban population and waste generation (Salazar-Adams Citation2021). In particular, Chile reaches the second position among Latin American countries, which generate most MSW per capita, surpassed only by Mexico (World Bank Citation2019). Additionally, relevant differences among Chilean municipalities exist in terms of MSW generated and operational costs of managing solid waste. Thus, operational costs of Chilean municipalities in the provision of MSW services range between 4 US$ per capita and 88 US$ per capita (SINIM Citation2018), whereas the generation of MSW per capita is between 0.3 kg/day and 1.7 kg/day (SINADER Citation2018).
Previous studies evaluating the eco-efficiency of municipal service waste providers have been very useful, but they present a main limitation from a methodological perspective. They used radial (parametric or non-parametric) techniques, which means that all inputs were allowed to be contracted proportionally for a given level of output. A recent study by Delgado-Antequera et al. (Citation2021) used a non-radial DEA model, the weighted Russell directional distance model (WRDDM), which allows for simultaneous expansion of outputs and reduction in inputs and undesirable outputs. However, the main limitation of this study was that the authors did not measure the concept of technical and environmental efficiency in a unified manner.
To overcome the above limitation, we use the methodological framework developed by Sueyoshi, Goto, and Ueno (Citation2010) where the ‘range-adjusted measure’ (RAM) based DEA models (Cooper, Park, and Pastor Citation2001) allows estimating three types of efficiency, i.e. i) technical, ii) environmental and iii) eco-efficiency. Technical efficiency is measured by allowing for simultaneous increase in the quantity of desirable product such as recycled waste and reduction in inputs such as operating costs (Sueyoshi and Goto Citation2010, Citation2012). Environmental efficiency allows for changes in undesirable products such as unsorted waste and inputs (Sueyoshi and Goto Citation2011a, Citation2011b, Citation2011c). Eco-efficiency is finally estimated by allowing for a contraction of undesirable products and inputs, while the amount of recycled waste increases at the same time (Sueyoshi, Goto, and Ueno Citation2010; Wang, Lu, and Wei Citation2013). To the best of our knowledge, there are no previous studies evaluating technical efficiency, environmental efficiency and eco-efficiency using the RAM-DEA models in the solid waste sector.
Within this context, the main objectives of this study are twofold. First, estimate the technical efficiency, environmental efficiency and eco-efficiency of a sample of Chilean municipalities in the provision of MSW services using non-radial RAM-DEA models. This allows us to measure efficiency by allowing for simultaneous changes in inputs, desirable and undesirable outputs. Moreover, researchers and policymakers have the opportunity to identify how municipalities perform in controlling production costs and undesirable products while trying to collect as much as recyclable products as possible. The second objective of this study is to explore the relationship between efficiency of municipalities in the provision of MSW and operating characteristics. In doing so, we build a regression tree model to visualise and quantify the impact of these operating characteristics on the different types of efficiency. This is a novel approach because, to the best of authors’ knowledge, this is the first study that aims to combine non-radial efficiency analysis and decision tree analysis approaches to evaluate the eco-efficiency of the waste sector and its drivers.
2. Material and methods
2.1 Methodology to compute technical efficiency, environmental efficiency and eco-efficiency scores
In this section, we present the methodological approach employed to evaluate the efficiency of the Chilean waste sector in a unified manner using non-parametric techniques. In particular, we employed RAM-DEA models, which allow for simultaneous expansions of desirable outputs (recycled waste) and contractions of inputs and undesirable outputs (unsorted waste) (Sueyoshi and Goto Citation2010). In other words, this approach allows measuring the performance of the municipalities in the provision of MSW from a production and environmental point of view. In doing so, three RAM models were applied which are described as follows. The first RAM model aims to derive the technical efficiency by assuming that municipalities want to minimise inputs such as operating costs while expanding desirable outputs such as recyclable products (Sueyoshi and Goto Citation2011a). The second RAM aims to estimate the environmental efficiency of each municipality by minimising undesirable outputs and inputs (Sueyoshi and Goto Citation2011b). Finally, the third RAM brings together the concepts of technical and environmental efficiency (unified efficiency or eco-efficiency) by allowing simultaneous expansions of desirable outputs and reduction of inputs and undesirable products (Sueyoshi, Goto, and Ueno Citation2010; Wang, Lu, and Wei Citation2013).
Before presenting the linear programming models used to compute technical efficiency, environmental efficiency and eco-efficiency scores, the production technology is defined. Let us assume that municipalities exist in the waste sector and jth municipality uses a set of inputs to produce a set of desirable (good) and undesirable (bad) products for the provision of MSW services. The vector of total inputs,
, is denoted as
, whereas the vector of good,
and bad outputs,
is defined as
and
, respectively. The operational efficiency of the rth municipality is found by solving the following RAM model:
As it can be seen from EquationEq. (1)(1)
(1) the RAM non-radial model is defined in terms of slacks for inputs and desirable products,
and, respectively. The scalar
is a set of intensity variables representing the weighting of each observed municipality
in the composition of the efficient frontier (Sala-Garrido et al. Citation2021a, Citation2021b). In the objective function of the RAM model,
and
denote the ranges of inputs and desirable outputs, respectively. In other words, they are based on the maximum and lower values of inputs and desirable outputs (Sueyoshi, Goto, and Ueno Citation2010). Therefore, the aforementioned ranges are defined as follows:
(2) where
capture the maximum and lower values of inputs, respectively, and
present the maximum and minimum values of desirable outputs, respectively (Sueyoshi, Goto, and Ueno Citation2010).
The technical efficiency, , is defined as follows:
where * denotes optimality. Technical efficiency scores take values between 0 and 1. A value equal to 1 means that the unit (municipality) is on the efficient frontier, and therefore it is technically efficient, whereas scores lower than 1 indicate technical inefficiency.
To estimate the environmental efficiency of the rth municipality, the following RAM model is solved:
The RAM model of Equationeq. (4)(4)
(4) is defined in terms of the slacks of inputs and undesirable outputs,
and
, respectively. In analogous manner,
denotes the range of undesirable outputs and is defined based on the upper and lower bounds of the undesirable outputs (Sueyoshi and Goto Citation2011a). Thus, the
is defined as follows:
where present the maximum and minimum values of undesirable outputs, respectively (Sueyoshi and Goto Citation2011b). The environmental efficiency,
, is derived as follows:
The environmental efficiency scores also take values between 0 and 1, with a value of 1 indicating that the municipality is fully efficient from an environmental perspective.
Finally, the eco-efficiency (unified technical and environmental efficiency) of the rth municipality is computed by solving the following RAM model:
The RAM model in EquationEq. (7)(7)
(7) is defined in terms of the slacks of inputs, desirable and undesirable products. Consequently, the eco-efficiency,
, is defined as follows:
The eco-efficiency scores () in EquationEq. (8)
(8)
(8) take values between zero and one, with a value equal to one indicating that the municipalities are fully eco-efficient, i.e. efficient from both a technical and environmental perspective.
2.2 Methodology to assess the influence of environmental variables on the efficiency estimations
To explore the impact of operating characteristics (environmental variables) on the efficiency of the municipalities in the provision of MSW services, a regression tree model is employed (James et al. Citation2013). This method allows us to visualise and assess the importance of environmental variables on the efficiency scores previously computed. A regression tree model iteratively divides the values of the operating characteristics and offers a predicted (fitted) value for the output (outcome) within each division, which in our case is the efficiency score. A graph of a regression tree can be easily understood by non-experts and allows visualisation of the importance of environmental variables on the efficiency scores (Rebai, Yahia, and Essid Citation2019).
The following steps are followed to build a regression tree model (James et al. Citation2013). The first step involves the split of the observations into several regions (branches) The second step provides the average predicted efficiency score (output) for each region by minimising the residual sum of squares (RSS):
A regression tree model has the following form in general:
wherein EquationEq. (10(10)
(10) )
is a set of environmental (explanatory) variables,
is the number of non-overlapping regions and
is the average value of the output variable that is derived based on the observations that belong to region
.
As a robustness check, a Tobit regression is also performed (for more details please Guerrini et al. Citation2015; Ananda Citation2018; Wang, Han, and Yin Citation2017; Wang et al. Citation2020; Sala-Garrido et al. Citation2021a), by using as the dependent variable, the efficiency scores of each municipality obtained from the RAM models and as explanatory variables the operating characteristics of each municipality.
2.3 Data sample
The measurement of technical, environmental and eco-efficiency was carried out for 119 Chilean municipalities that provide collection, transport and final treatment (including recycling services) across different regions of Chile. The MSW collection system of the 119 municipalities evaluated is door-to-door. The collection and treatment of MSW in Chile is a municipal responsibility (Llanquileo-Melgarejo and Molinos-Senante et al., Citation2021). Currently, recycling is not compulsory for local authorities (Valenzuela-Levi Citation2021). By contrast, the recycling programmes emerge as independent initiatives on the available municipal budget (Araya-Cordova et al., Citation2021). Nevertheless, after the implementation in 2016 of the Chilean Law for Promoting Recycling and Extended Producer Responsibility, municipalities have started to define and implement strategies for MSW recycling (Llanquileo-Melgarejo et al. Citation2021).
The data used to evaluate the efficiency of the Chilean municipalities in the provision of MSW referred to the year 2018 and was downloaded from the National Waste Declaration System and National Municipal Information System. The choice of inputs, desirable and undesirable outputs was done based on data availability and a review of literature on this topic (e.g. Simões, De Witte, and Marques Citation2010; Guerrini et al. Citation2017; Romano and Molinos-Senante Citation2020). Consequently, the input was defined at the annual operating costs related to the collection, transport on the one side and final treatment of MSW and was measured in Chilean PesosFootnote3 (CLP) per year (Llanquileo-Melgarejo et al. Citation2021; Llanquileo-Melgarejo and Molinos-Senante Citation2021). The desirable output was derived as the total amount of recycled waste: glass, paper, plastic and organic waste and was measured in tons per year (Marques and Simoes Citation2009; Rogge and De Jaeger Citation2013; Guerrini et al. Citation2017; Sarra, Mazzocchitti, and Rapposelli Citation2017; Exposito and Velasco Citation2018). As far as the undesirable product is concerned, this was defined as the total quantity of unsorted waste and was measured in tons per year (Delgado-Antequera et al. Citation2021). It was estimated as the difference between the total amount of MSW collected and recycled waste.
Several previous studies in the MSW sector underlined the importance of including environmental variables in the analysis of performance (e.g. Simoes and Marques, Citation2011; Benito, Moreno-Enguix, and Solana Citation2011; Benito, Solana, and Moreno Citation2014; Sarra, Mazzocchitti, and Rapposelli Citation2017; Romano and Molinos-Senante Citation2020). Hence, the following environmental variables were considered to evaluate their impact on efficiency scores estimated. The first variable involved population density as a proxy for the urbanisation of the served area (Guerrini et al. Citation2017; Halkos and Petrou Citation2019; Romano, Rapposelli, and Marrucci Citation2019; Agovino, Matricano, and Garofalo Citation2020). Population density was defined as the ratio of inhabitants in each municipality and the service area measured in km2 (Molinos-Senante and Maziotis Citation2021). The second variable captured the touristic intensity of the municipality. Thus, we used a tourist indicator developed by the Division of Studies and Territory of the Undersecretariat of Tourism (Sernatur Citation2018; Llanquileo-Melgarejo and Molinos-Senante Citation2021). The tourist index was estimated based on principal component analysis maximising variance. It embraces 15 variables, such as number of overnight stays, non-resident population, number of accommodations, number of tourism agencies. The third variable was presented by the total amount of waste produced per inhabitant. This variable was derived as the total quantity of MSW generated divided by the number of inhabitants resided in each municipality (Molinos-Senante and Maziotis Citation2021). reports the descriptive statistics of the variables employed in this study.
Table 1. Descriptive statistics of the variables employed to estimate efficiency scores
3. Results and discussion
3.1 Technical efficiency, environmental efficiency and eco-efficiency estimation
The results from the measurement of the different types of efficiency are summarised in . It is concluded that on average the Chilean waste sector showed low levels of technical efficiency but performed well in terms of environmental efficiency. In particular, municipalities were found to be 0.484 technically efficient, which means that the potential savings in operating costs while collecting as much as recyclable products were at the level of 51.6%. It should be noted that recycling is subject to separate waste collection and therefore, improving recycling rates is challenging as previously, people should separate solid waste at household level. This issue is even more relevant in Chile where the system for collecting MSW is door-to-door. High levels of technical inefficiency were reported by past studies by Llanquileo-Melgarejo and Molinos-Senante (Citation2021) and Llanquileo-Melgarejo et al. (Citation2021). Using radial non-parametric techniques, the aforementioned studies reported an average of technical efficiency of 0.50. A recent study by Molinos-Senante and Maziotis (Citation2021) reported an average cost-efficiency of 0.52 for the Chilean waste sector using parametric techniques. Thus, the findings of our study indicate that on average municipalities needed to make improvements in their managerial practices to become more efficient in the production process. Actually, as it is shown in , only 1 out of 119 municipalities (0.84%) evaluated is technically efficient, i.e. located on the efficient production frontier and served as reference for the other municipalities. It is a medium size municipality (around 19,000 people) located in the Metropolitan Region. Within its municipal territory, there is a large landfill and, therefore, the operational costs of managing MSW for this municipality are low because it hardly incurs transportation costs.
Table 2. Summary of efficiency score results
From an environmental point of view, where operating costs and unsorted waste are included in the analysis, it was found that the Chilean waste sector performed well. An average environmental efficiency of 0.899 was reported which means that municipalities could further reduce unsorted waste by 10.1% to improve environmental performance. This could be done, for instance, by establishing green dots to gather recyclable products such as glass, plastic and paper. Another example could be to invest in new resources such as information campaigns that could educate citizens about the benefits of recycling for society and environment. It is also noticeable that the lowest environmental efficiency score was 0.609 which is notably larger than the minimum technical efficiency score. It evidences the efforts carried out by the municipalities to reduce the amount of unsorted waste. Considering environmental efficiency, 6 out of 119 Chilean municipalities (5.04%) were efficient. They were located in different regions of the country but had in common the relatively large percentage of recycled waste (at least in relative terms with other Chilean municipalities).
In terms of eco-efficiency, i.e. performance assessment integrating into a single index operating cost, recycled waste and unsorted waste, the evaluated Chilean municipalities appeared to perform excellent. The mean eco-efficiency of the waste sector was 0.922. This means that comparatively, municipalities could further reduce unsorted waste and inputs by 7.8% on average while gathering as much as recyclable product as possible to become more eco-efficient. As in the case of technical efficiency, only one Chilean municipality was identified as eco-efficient. This municipality was also efficient from an environmental perspective and was characterised for its large recycling rates thanks to the activities carried out by informal recyclers. The standard deviation values for technical efficiency, environmental efficiency and eco-efficiency were 0.159, 0.096 and 0.076, respectively. Hence, in terms of technical efficiency, a heterogeneous performance of the municipalities evaluated was evident. By contrast, when recycled waste and unsorted waste are included in performance assessment, the performance of the municipalities is more homogeneous. Therefore, there are not any notable differences among Chilean municipalities in terms of their environmental efficiency and eco-efficiency. Overall, the results indicate that the Chilean municipal solid waste sector was characterised by high levels of environmental efficiency and eco-efficiency. It appears that municipalities are doing well in reducing unsorted waste, but they need to put more efforts in reducing their production costs and in increasing recycling.
As the levels of the different types of efficiency differed, it is worth discussing how these efficiency scores are distributed across municipalities. This is reported in . The results indicate that technical efficiency scores showed the highest variability across municipalities (). More particularly, 75 out of 119 municipalities (63%) were found to have an average technical efficiency score between 0.41 and 0.60. This means that these municipalities had the potential to reduce their production costs between 60% and 40% while expanding the recycling process. Improving therefore the day-to-day operations could be important to catch-up with more technically efficient municipalities in the sector. It was also found that there were several municipalities reported even lower technically efficient scores. In particular, 25 municipalities (21% of the sample) could further reduce their operational costs between 60% and 80% to improve technical efficiency. Considering the variables involved in technical efficiency assessment results revealed that most of the Chilean municipalities presented a very deficient MSW management both from an economic and recycling perspective. Our findings confirm the low performance of the Chilean waste sector identified by past research (Valenzuela-Levi Citation2019, Citation2021; Llanquileo-Melgarejo et al. Citation2021). Finally, only 16 municipalities (13% of the sample) presented a technical efficiency score greater than 0.61. Nevertheless, this is a moderate level of technical efficiency, which also involves considerable room for improvements in the provision of MSW services.
Figure 1. Histogram of technical efficiency scores across Chilean municipalities evaluated.
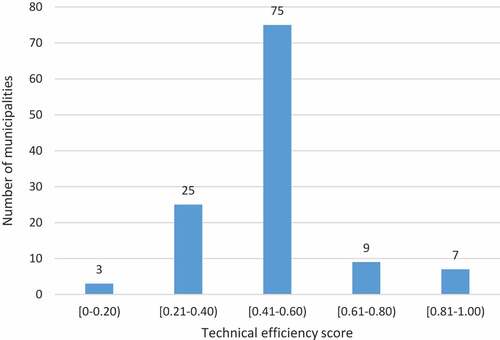
Figure 2. Histogram of environmental efficiency scores across Chilean municipalities evaluated.
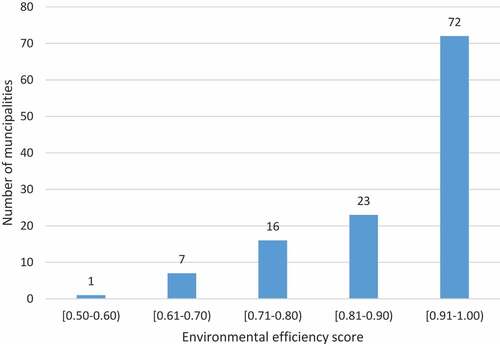
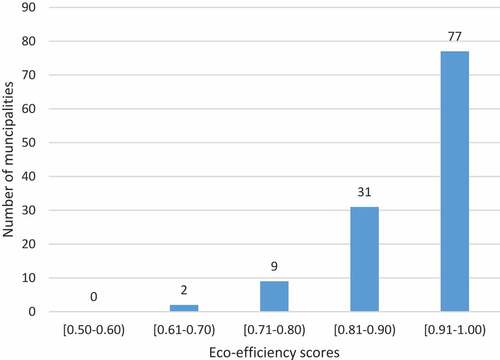
Figure 3. Histogram of eco-efficiency scores across Chilean municipalities evaluated.
From an environmental point of view, the majority of the municipalities evaluated reported a mean efficiency that was greater than 0.91. This means that they performed well in reducing unsorted waste although it could further go down by up to 9%. There were several municipalities that reported slightly lower environmental efficiency scores. In particular, there were 23 municipalities with an average efficiency that ranged between 81% and 90%. This means that there is still room for improvement in environmental efficiency as these municipalities could reduce unsorted waste by up to 20%. In contrast, there was one municipality only which could be considered as highly environmentally inefficient as it reported an efficiency score less than 0.60. It is one of the largest Chilean cities in terms of population (around 225,000 inhabitants) which has developed some initiatives for promoting MSW recycling, such as green points to collect paper, plastic and glass for recycling. However, it does not collect organic matter which is the recyclable solid waste generated in larger quantity.
The distribution of eco-efficiency scores across municipalities () evidenced that the majority of them showed a high eco-performance. Seventy-seven out of one hundred and nineteen municipalities evaluated (65%) could further reduce their operational costs and unsorted waste by up to 9% while continuing to expand their recycling services. Moreover, there were 31 municipalities that performed well (average eco-efficiency between 0.81 and 0.90) in terms of both technical and environmental point of view. Although in general the waste sector is characterised by high levels of eco-performance, there is still room for improvement. For instance, nine municipalities could further reduce production costs and undesirable products between 20% and 30% while making efforts to collect as much as recyclable products as possible. Substantial more savings from an eco-point of view could be achieved by municipalities who reported an eco-efficiency score between 0.61 and 0.70. Overall, environmental and eco-efficiency scores showed similar patterns in terms of distribution of efficiency across municipalities. The distribution of technical efficiency considerably varied. These findings suggest that the waste sector could improve its performance by putting more efforts in reducing any technical inefficiencies occurred during the collection and recycling process, such as reduction in operating costs and collection of more recyclable products.
To explore the potential influence of the geographic location of the municipalities on their efficiency in the provision of MSW services, the municipalities evaluated were clustered by administrative regions. This analysis is reported in . It is noted that the municipalities embraced 12 out of 16 Chilean regions. Nevertheless, there is only one municipality belonging to the north area of Chile. This municipality reported a technical efficiency of 0.389 which means that the potential reduction in operational costs could reach the level of 61% while expanding the recyclable products by the same magnitude. The same municipality also reported considerably lower levels of environmental and eco-efficiency compared to other municipalities located in the central and south area of Chile. Moreover, there were several other regions who reported slightly higher levels of technical efficiency. The Metropolitan Region, where the capital of the country is located, showed low levels of technical efficiency, 0.410. It appears that this region did not perform well in terms of environmental and eco-efficient when compared to the efficiency scores of the other regions. Being densely populated with 924 inhabitants per km2, it is noted that this region of Chile needed to become more eco-efficient in the future. The potential savings in operating costs and unsorted waste among municipalities of the Metropolitan Region could reach the level of 14% while recycling more products by the same magnitude. Other regions of the central area of Chile showed a better eco-performance. For instance, more densely populated municipalities such as the ones located in Bernardo O’Higgins region reported an eco-efficiency score of 0.980. The 14 municipalities in that region could further improve their performance by making efforts to reduce operating costs and increase recycling as the mean technical efficiency was particularly low, 0.588.
Table 3. Technical efficiency, environmental efficiency and eco-efficiency scores of the Chilean municipalities evaluated clustered by region
As far as the south part of Chile is concerned, it is concluded that all regions performed well in terms of environmental efficiency and eco-efficiency. For instance, on average eco-efficiency scores ranged between 0.920 and 0.980 which means that costs and unsorted waste could reduce by up to 8% while expanding desirable outputs (recycled waste) by the same magnitude. Most potential for improving overall performance could come from eliminating any technical inefficiencies. Although these regions reported the highest levels of technical efficiency among all regions in the sample, there is still room for improvement. For instance, the region of Los Lagos could become more technically efficient by reducing costs and increasing recyclable products by 36%. Higher cost savings could achieve for the region of Bio-Bio, who reported an average technical efficiency score of 0.428. Overall, the results indicate that regardless of the location, municipalities needed to make improvements in their production performance by reducing operating costs and increasing the quantity of recyclable products.
3.2 Influence of environmental variables on efficiency scores
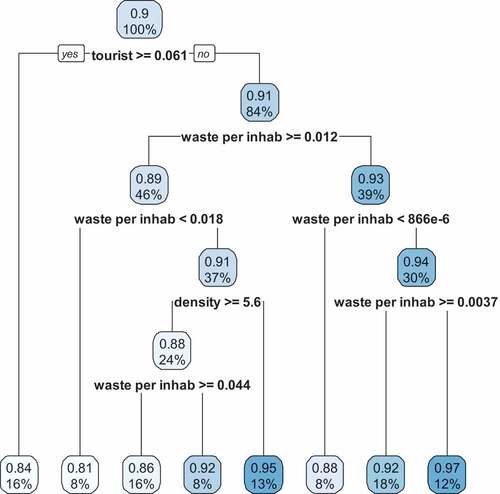
In order to explore the relationship between other operating characteristics (or environmental variables) and efficiency, regression tree analysis was performed. The impact of population density, MSW generated per inhabitant (per capita) and tourist index is visualised in . The predicted (output) variable is the eco-efficiency score of each municipality previously computed, and the explanatory variables are the aforementioned operating characteristics. For each node, the left branch is provisional on the node being true and the right one is provisional on the node being false (Rebai, Yahia, and Essid Citation2019). At the bottom of each branch, the average eco-efficiency score is displayed, which is derived based on the percentage of observations that belong to that particular branch. For instance, an average eco-efficiency score of 0.86 could be achieved based on 8% of observations who have a tourist index of more than 0.016.
Figure 4. Regression tree model using eco-efficiency score as predicted (dependent) variable.
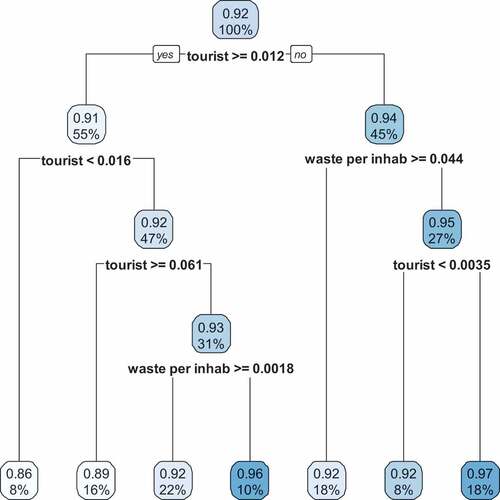
The discussion of the results of the regression tree model can be summarised as follows. It was found that on average, tourist index and total MSW per inhabitant had a significant impact on eco-efficiency. By contrast, population density had a smaller influence on eco-efficiency (see Appendix – Figure A1) of municipalities in the provision of MSW services. As it is shown in , a touristic municipality whose tourist index is greater than 0.012 could experience an eco-efficiency of 0.91 and this is supported by 55% of observations. However, municipalities with a tourist index between 0.012 and 0.016 could report lower levels of efficiency, 0.86. This refers to 8% of observations. By contrast, when municipalities present a tourist index greater than 0.061, higher levels of eco-efficiency could be achieved 0.89. The levels of eco-efficiency could be even higher in those areas with a tourist index less than 0.061, and total waste generated is less than 0.0018 tons per inhabitant. The analysis showed that average eco-efficiency could reach the level of 0.96. This means that in highly touristic areas residents and tourists might dispose higher amounts of waste than those located in less touristic areas. This requires good quality of service to provide waste services. Moreover, there might be more locations where people could recycle the products they no longer use. Therefore, in those municipalities might have already invested in resources to collect as much as recyclable products and reduce any sorted waste.
We will next discuss the levels of eco-efficiency in case where regions are less touristic. The results indicate that areas with a tourist index less than 0.012 reported a mean eco-efficiency of 0.94 and this is based on 55% of observations used in the study. These municipalities could slightly increase the levels of eco-efficiency if the waste collected is less than 0.044 tons per inhabitant. If this amount of waste per capita is collected in touristic areas with a tourist index higher than 0.0035, then eco-efficiency could be higher, 0.97. Eco-efficiency could maintain its high levels, 0.92, even if more than 0.044 tons of waste per capita is collected in several municipalities. Overall, the results indicate that on average the Chilean MSW sector reported high levels of eco-efficiency but there is room for improving performance. This could be achieved in less touristic areas and in some extend to highly touristic areas. For example, eco-taxes for tourists could be introduced to fund recycling initiatives.
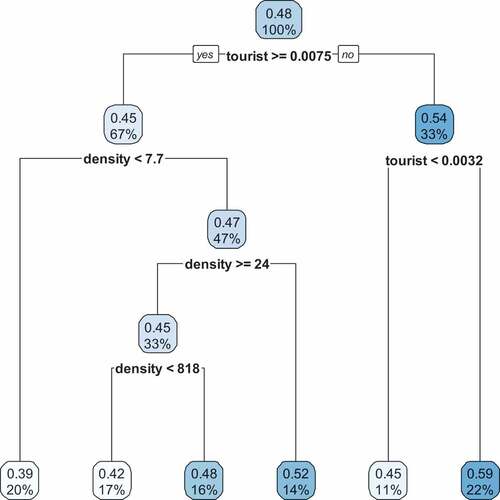
displays the results of the regression tree model when the predicted (outcome) variable is the technical efficiency score of each municipality. In this case, tourist index and population density had the major influence on technical efficiency (Appendix – Figure A2). It was found that regions with a tourist index greater than 0.0075 and population density with less than 7.7 inhabitants per km2 could experience high levels of technical inefficiency. This means that the provision of waste services in less densely populated areas could be associated with higher operational costs compared with more densely populated areas. Twenty per cent of the observations in our study predict that average technical efficiency could drop to 0.39 in less densely populated areas. By contrast, regions with a population density of less than 24 inhabitants per km2 could increase technical efficiency up to 0.51 on average. Results in evidenced that it is less costly to provide waste services to a densely populated area than a less densely populated one. Previous studies were inconclusive about the influence of population density on the cost of collecting MSW (e.g. De Jaeger et al. Citation2011; Exposito and Velasco Citation2018). However, the results of this study are consistent with Guerrini et al. (Citation2017) and Romano and Molinos-Senante (Citation2020) who concluded that Italian municipalities with a large population density performed the best in terms of MSW services.
Figure 5. Regression tree model using technical efficiency score as predicted (dependent) variable.
reports the results from building a regression tree model when environmental efficiency score is the predicted variable. The results indicate that tourist index, waste generated per inhabitant and population density had an impact on municipalities environmental efficiency on average (Appendix – Figure A3). It is found that municipalities with a tourist index greater than 0.061 could experience lower levels of environmental efficiency, 0.84 on average. This means that highly touristic regions might be associated with higher costs to reduce unsorted waste, which could have a negative impact on efficiency. However, this was apparent in some regions that were less touristic. For instance, regions with a tourist index less than 0.061 and quantity of waste generated ranging between 0.012 and 0.0.18 tons per capita could experience even lower levels of environmental efficiency, 0.81 on average. Moreover, 16% of municipalities in less touristic regions with a population density of greater than 5.6 inhabitants per km2 could experience an average environmental efficiency of 0.86 if the waste produced was greater than 0.044 tons per capita. Environmental efficiency could improve if the amount of waste collected and recycled was less than 0.012 tons per inhabitant or in some regions where density was less than 5.6 inhabitants per km2. Overall, the results indicate that the level of tourism could put pressure on municipalities’ costs and environmental efficiency which is consistent across regression tree models. On average, the higher the quantity of waste collected and recycled the higher the environmental efficiency could be. However, in less touristic areas, the higher the amount of waste collected and recycled the lower the environmental efficiency could be.
Figure 6. Regression tree model using environmental efficiency score as the predicted (dependent) variable.
As robustness check, we performed Tobit regression using the different types of efficiency scores of each municipality as the dependent variable. This is reported in . The results indicate that tourist index and waste generated per capita had a significant impact on eco-efficiency. It was found that keeping other things equal, on average, a unit increase in tourist index could lower eco-inefficiency by 0.303 units. By contrast, the higher the total quantity of MSW is generated per capita, the higher the level of eco-efficiency could be. Similar findings were reported when environmental efficiency was used as the dependent variable. This finding suggests the presence of economies of scale in the provision of MSW services supporting the conclusions of a number of prior studies (e.g. Carvalho and Marques Citation2014; Pérez-López, Prior, and Zafra-Gómez Citation2018; Romano and Molinos-Senante Citation2020). In that case, population density also had a statistically significant impact on environmental efficiency. It is found that on average as population density increases by one unit, then environmental efficiency could go up by 0.101 units. Population density was found to play a major role in explaining technical efficiency. The more densely populated the region is the lower the costs to provide collection and recycling services could be. Hence, this could have a positive impact on technical efficiency. By contrast, the more touristic the region is, the lower the technical efficiency could be as shown by the statistical significance of the negative sign of the tourist index. Overall, the level of tourism was found to be a major driver of efficiency across the different regression models.
Table 4. Estimates of Tobit regression to evaluate the influence of environmental variables on the efficiency of the Chilean municipalities evaluated
By contrast, results showed that population density did not significantly influence on the eco-efficiency of Chilean municipalities in the provision of MSW services. Similar results were concluded by Marques and Simoes (Citation2009), De Jaeger et al. (Citation2011) and Expósito and Velasco (Citation2018). Nevertheless, other studies found that density might have a significant impact on eco-efficiency (Guerrini et al. Citation2017; Llanquileo-Melgarejo and Molinos-Senante Citation2021). Hence, the literature is inconclusive about this topic and additional research is needed. The volume of waste generated per capita is not a factor influencing the technical efficiency from a statistical point of view. It should be noted that this metric does not differentiate among recycled waste and unsorted waste and, therefore, municipalities generating large volume of MSW might be efficient even if operational costs are low.
4. Conclusions
In a circular economic context, it is relevant to assess the performance of municipalities in the provision of MSW services embracing economic and environmental variables. Prior studies evaluated the eco-efficiency of municipal solid waste providers employing radial methods assuming that inputs (operational costs) were contracted proportionally for a given level of outputs (recycled waste and unsorted waste). Moreover, most of these previous studies had focused on developed countries, whereas research focused on developing countries is much more limited. Nevertheless, municipalities in developing and middle-income countries present deficiencies in waste management and face conditions of underfunding of their initiatives for promoting MSW recycling.
In this study, we used a non-radial efficiency analysis technique to evaluate the technical efficiency, environmental efficiency and eco-efficiency of the Chilean municipal waste sector in a unified manner. We also employed regression tree model techniques to explore the impact of several operating characteristics on the different types of efficiency.
The main findings can be summarised as follows. Firstly, it was found that on average the waste sector performed poorly from a technical perspective since municipalities could further cut down their operational costs by 51.6% on average while continuing to collect as much as recyclable waste as possible. By contrast, on average the waste sector showed high levels of environmental efficiency and eco-efficiency, 0.899 and 0.922, respectively. This means that, on average, the potential savings in costs and unsorted waste could be almost 8% among municipalities while continuing to collect recyclable waste. Considerable improvements in technical efficiency and eco-efficiency were found to be in several densely populated regions located in the central part of Chile.
Secondly, the level of tourism had a major and negative on all types of efficiency. From a technological perspective, it was found that Chilean regions with a population density of less than 24 inhabitants per km2 could reach a technical efficiency of 0.51 on average. Waste services in densely populated could be provided in a more efficient way than in less densely populated areas. From an environmental point of view, it is found that higher levels of waste per inhabitant could lead to higher levels of environmental performance.
Based on the findings of this study, it is of the utmost importance to introduce eco-taxes for tourists, which can be used to support and finance MSW recycling programmes. Moreover, the presence of economies of scale suggests that small municipalities could consider opportunities to increase the number of citizens served, for example, by merging the provision for two or more neighbouring municipalities or by adopting programmes at regional level.
The performance assessment of municipalities from three different perspectives is of great interest in policymakers and local authorities to define strategies that can lead to an improvement in MSW management. Policy makers have the opportunity to identify best and worst municipalities in terms of technological, environmental and eco-efficiency. Thus, they can understand how much costs and unsorted waste could be reduced while trying to collect recyclable products at the same time. A municipality could be efficient in terms of collecting recyclable waste (technical efficiency) but could be inefficient in reducing unsorted waste and operating costs (environmental efficiency and eco-efficiency). Therefore, this information could support policymakers on making informed decisions on the efficient use of resources and assets. Understanding the importance of operating characteristics in each type of efficiency could encourage policymakers to set more bespoke targets and better monitor waste services performance. An efficient management of collection and recycling services could pave the way for creating a greener economy and society protecting the health of the people and the environment.
Supplemental Material
Download MS Word (12.9 KB)Disclosure statement
No potential conflict of interest was reported by the author(s).
Supplementary material
Supplemental data for this article can be accessed here.
Additional information
Funding
Notes on contributors
Ramon Sala-Garrido
Ramon Sala-Garrido is PhD in Economics and full professor at the Faculty of Economics, University of Valencia.
Manuel Mocholi-Arce
Manuel Mocholi-Arce is PhD in Economics and professor at the Faculty of Economics, University of Valencia.
Maria Molinos-Senante
Maria Molinos-Senante is PhD in Local Development and Territory. She is professor at Hydraulic and Environmental Engineering Department, Pontificia Universidad Catolica de Chile.
Alexandros Maziotis
Alexandros Maziotis is PhD in Economics and postdoc researcher at Hydraulic and Environmental Engineering Department, Pontificia Universidad Catolica de Chile.
Notes
1. Eco-efficiency is defined as the production of more goods (outputs) and services with fewer resources (inputs) and less of an environmental impact (Beltrán-Esteve, Reig-Martínez, and Estruch-Guitart Citation2017). The prefix ‘eco’ represents the environmental and economic performance; therefore, the assessment of eco-efficiency involves considering both environmental and economic variables (Gomez et al. Citation2018).
2. Two alternative non-parametric methods are free disposal hull (FDH) and data envelopment analysis (DEA). On the one hand, FDH method relies exclusively on monotonicity and minimal extrapolation. On the other hand, DEA additionally assumes convexity (Deprins and Simar Citation1984). Moreover, in the case of DEA, the estimator is a piece-wise linear function, while in the case of FDH, the estimator is a step function.
3. On 6 October 2021, the conversion rate was: 810 CLP 1US$ and 940 CLP
1€
4. The intercept is the expected mean value of Y when all X = 0. If X sometimes equals 0, the intercept is simply the expected mean value of Y at that value.
References
- Agovino, M., D'Uva, M., Garofalo, A., and Marchesano, K. 2018. Waste management performance in Italian provinces: Efficiency and spatial effects of local governments and citizen action. Ecological Indicators 89: pp. 680-695.
- Agovino, M., D. Matricano, and A. Garofalo. 2020. “Waste Management and Competitiveness of Firms in Europe: A Stochastic Frontier Approach.” Waste Management 102: 528–540. doi:10.1016/j.wasman.2019.11.021.
- Amaral, C., M. Isabel Pedro, D. Cunha Ferreira, and R. Cunha Marques. 2022. “Performance and Its Determinants in the Portuguese Municipal Solid Waste Utilities.” Waste Management 139: 70–84. doi:10.1016/j.wasman.2021.12.020.
- Ananda, J. 2018. “Explaining the Environmental Efficiency of Drinking Water and Wastewater Utilities.” Sustainable Production and Consumption 17: 185–195.
- Araya-Córdova, P. J., S. Dávila, N. Valenzuela-Levi, and Ó. C. Vásquez. 2021. “Income Inequality and Efficient Resources Allocation Policy for the Adoption of a Recycling Program by Municipalities in Developing Countries: The Case of Chile.” Journal of Cleaner Production 309: 127305. doi:10.1016/j.jclepro.2021.127305.
- Beltrán-Esteve, M., E. Reig-Martínez, and V. Estruch-Guitart. 2017. “Assessing Eco-efficiency: A Metafrontier Directional Distance Function Approach Using Life Cycle Analysis.” Environmental Impact Assessment Review 63: 116–127. doi:10.1016/j.eiar.2017.01.001.
- Benito, B., M. Moreno-Enguix, and J. Solana. 2011. “Determinants of Efficiency in the Provision of Municipal Street-cleaning and Refuse Collection Services.” Waste Management 31 (6): 1099–1108. doi:10.1016/j.wasman.2011.01.019.
- Benito, B., J. Solana, and M. R. Moreno. 2014. “Explaining Efficiency in Municipal Services Providers.” Journal of Productivity Analysis 42: 225–239. doi:10.1007/s11123-013-0358-7.
- Carvalho, P., and R. C. Marques. 2014. “Economies of Size and Density in Recycling of Municipal Solid Waste in Portugal.” Waste Management 34: 12–20. doi:10.1016/j.wasman.2013.10.004.
- Castillo-Giménez, J., A. Montañés, and A. J. Picazo-Tadeo. 2019. “Performance and Convergence in Municipal Waste Treatment in the European Union.” Waste Management 85: 222–231. doi:10.1016/j.wasman.2018.12.025.
- Coelli, T. J., D. S. Prasada Rao, C. J. O’Donnell, and G. E. Battese. 2005. An Introduction to Efficiency and Productivity Analysis. 2nd ed. New York: Springer.
- Cooper, W. W., K. S. Park, and J. T. Pastor. 2001. “The Range Adjusted Measure (RAM) in DEA: A Response to the Comment by Steinmann and Zweifel.” Journal of Productivity Analysis 15: 145–152. doi:10.1023/A:1007882606735.
- De Jaeger, S., J. Eyckmans, N. Rogge, and T. Van Puyenbroeck. 2011. “Wasteful Waste Reducing Policies? The Impact of Waste Reduction Policy Instruments on Collection and Processing Costs of Municipal Solid Waste.” Waste Management 31 (7): 1429–1440. doi:10.1016/j.wasman.2011.02.021.
- Delgado-Antequera, L., G. Gémar, M. Molinos-Senante, T. Gómez, R. Caballero, and R. Sala-Garrido. 2021. “Eco-efficiency Assessment of Municipal Solid Waste Services: Influence of Exogenous Variables.” Waste Management 130: 136–146. doi:10.1016/j.wasman.2021.05.022.
- Deprins, D., L. Simar, and Tulkens, H. 1984. Measuring labor-efficiency in post offices. In The Performance of Public Enterprises: Concepts and Measurement, edited by M. Marchand, P. Pestieau, and H. Tulkens., 243-267. Amsterdam: Elsevier.
- Díaz-Villavicencio, G., S. R. Didonet, and A. Dodd. 2017. “Influencing Factors of Eco-efficient Urban Waste Management: Evidence from Spanish Municipalities.” Journal of Cleaner Production 164: 1486–1496. doi:10.1016/j.jclepro.2017.07.064.
- European Commission (2020). “First Circular Economy Action Plan.” Available at: https://ec.europa.eu/environment/topics/circular-economy/first-circular-economy-action-plan_es
- Exposito, A., and F. Velasco. 2018. “Municipal Solid-waste Recycling Market and the European 2020 Horizon Strategy: A Regional Efficiency Analysis in Spain.” Journal of Cleaner Production 172: 938–948. doi:10.1016/j.jclepro.2017.10.221.
- Fan, X., B. Yu, Z. Chu, X. Chu, W.-C. Huang, and L. Zhang. 2020. “A Stochastic Frontier Analysis of the Efficiency of Municipal Solid Waste Collection Services in China.” Science of the Total Environment 743: 140707. doi:10.1016/j.scitotenv.2020.140707.
- Foggia, G. D., and M. Beccarello. 2018. “Improving Efficiency in the MSW Collection and Disposal Service Combining Price Cap and Yardstick Regulation: The Italian Case.” Waste Management 79: 223–231. doi:10.1016/j.wasman.2018.07.040.
- Foggia, G. D., and M. Beccarello. 2020. “Drivers of Municipal Solid Waste Management Cost Based on Cost Models Inherent to Sorted and Unsorted Waste.” Waste Management 114: 12 202–214. doi:10.1016/j.wasman.2020.07.012.
- Gomez, T., G. Gémar, M. Molinos-Senante, R. Sala-Garrido, and R. Caballero. 2018. “Measuring the Eco-efficiency of Wastewater Treatment Plants under Data Uncertain.” Journal of Environmental Management 226: 484–492. doi:10.1016/j.jenvman.2018.08.067.
- Guerrini, A., P. Carvalho, G. Romano, R. C. Marques, and C. Leardini. 2017. “Assessing Efficiency Drivers in Municipal Solid Waste Collection Services through a Nonparametric Method.” Journal of Cleaner Production 147: 431–441. doi:10.1016/j.jclepro.2017.01.079.
- Guerrini, A., G. Romano, C. Leardini, and M. Martini. 2015. “The Effects of Operational and Environmental Variables on Efficiency of Danish Water and Wastewater Utilities.” Water 7: 3263–3282. doi:10.3390/w7073263.
- Guoyan, S., A. Khaskheli, S. A. Raza, and M. Ahmed. 2022. “Nonlinear Impact of Municipal Solid Waste Recycling and Energy Efficiency on Environmental Performance and Economic Growth: Evidence from Non-parametric Causality-in-quantiles.” Environmental Science and Pollution Research 29 (11): 16066–16081. doi:10.1007/s11356-021-16721-1.
- Halkos, G., and K. N. Petrou. 2019. “Assessing 28 EU Member States’ Environmental Efficiency in National Waste Generation with DEA.” Journal of Cleaner Production 208: 509–521. doi:10.1016/j.jclepro.2018.10.145.
- Hettiarachchi, H., S. Ryu, S. Caucci, and R. Silva. 2018. “Municipal Solid Waste Management in Latin America and the Caribbean: Issues and Potential Solutions from the Governance Perspective.” Recycling 3 (2): art. no. 19. doi:10.3390/recycling3020019.
- Jaafarzadeh, N., M. Ahmadmoazzam, R. Kojloo, S. Jorfi, and Y. Baasim. 2021. “The Environmental Performance of Four Municipal Solid Waste Management Scenarios: A Life Cycle Assessment Study.” Environmental Quality Management 31 (2): 77–84. doi:10.1002/tqem.21719.
- James, G., D. Witten, R. Tibshirani, and T. Hastie. 2013. An Introduction to Statistical Learning with Applications in R. New York: Springer.
- Kaza, S., L. C. Yao, P. Bhada-Tata, and F. Van Woerden (2018). “What A Waste 2.0: A Global Snapshot of Solid Waste Management to 2050.” World Bank, Urban Development, Washington D.C, USA, Urban Development Series Knowledge Papers.
- Llanquileo-Melgarejo, P., and M. Molinos-Senante. 2021. “Evaluation of Economies of Scale in Eco-efficiency of Municipal Waste Management: An Empirical Approach for Chile.” Environmental Science and Pollution Research 28: 28337–28348. doi:10.1007/s11356-021-12529-1.
- Llanquileo-Melgarejo, P., M. Molinos-Senante, G. Romano, and L. Carosi. 2021. “Evaluation of the Impact of Separative Collection and Recycling of Municipal Solid Waste on Performance: An Empirical Application for Chile.” Sustainability 13 (4): 2022. doi:10.3390/su13042022.
- Marques, R. C., and P. Simoes. 2009. “Incentive Regulation and Performance Measurement of the Portuguese Solid Waste Management Services.” Waste Management Research 27 (2): 188–196. doi:10.1177/0734242X08095025.
- Medina-Mijangos, R., A. De Andrés, and H. Guerrero-Garcia-Rojas. 2021. “A Methodology for the Technical-economic Analysis of Municipal Solid Waste Systems Based on Social Cost-benefit Analysis with A Valuation of Externalities.” Environmental Science and Pollution Research 28: 18807–18825. doi:10.1007/s11356-020-09606-2.
- Molinos-Senante, M., and A. Maziotis. 2021. “The Cost of Reducing Municipal Unsorted Solid Waste: Evidence from Municipalities in Chile.” Sustainability 13: 6607. doi:10.3390/su13126607.
- Pérez-López, G., D. Prior, and J. L. Zafra-Gómez. 2018. “Temporal Scale Efficiency in DEA Panel Data Estimations. An Application to the Solid Waste Disposal Service in Spain.” Omega (United Kingdom) 76: 18–27.
- Rebai, S., F. B. Yahia, and H. Essid. 2019. “A Graphically Based Machine Learning Approach to Predict Secondary Schools Performance in Tunisia.” Socio-Economic Planning Sciences 70: 100724. doi:10.1016/j.seps.2019.06.009.
- Rogge, N., and S. De Jaeger. 2013. “Measuring and Explaining the Cost Efficiency of Municipal Solid Waste Collection and Processing Services.” Omega 41: 653–664. doi:10.1016/j.omega.2012.09.006.
- Romano, G., and M. Molinos-Senante. 2020. “Factors Affecting Eco-efficiency of Municipal Waste Services in Tuscan Municipalities: An Empirical Investigation of Different Management Models.” Waste Management 105: 384–394. doi:10.1016/j.wasman.2020.02.028.
- Romano, G., A. Rapposelli, and L. Marrucci. 2019. “Improving Waste Production and Recycling through Zero-waste Strategy and Privatization: An Empirical Investigation.” Resources, Conservation & Recycling 146: 256–263. doi:10.1016/j.resconrec.2019.03.030.
- Sala-Garrido, R., M. Mocholi-Arce, M. Molinos-Senante, and A. Maziotis. 2021a. “Marginal Abatement Cost of Carbon Dioxide Emissions in the Provision of Urban Drinking Water.” Sustainable Production and Consumption 25: 439–449. doi:10.1016/j.spc.2020.11.025.
- Sala-Garrido, R., M. Mocholi-Arce, M. Molinos-Senante, M. Smyrnakis, and A. Maziotis. 2021b. “Eco-Efficiency of the English and Welsh Water Companies: A Cross Performance Assessment.” International Journal of Environmental Research and Public Health 18: 2831. doi:10.3390/ijerph18062831.
- Salazar-Adams, A. 2021. “The Efficiency of Municipal Solid Waste Collection in Mexico.” Waste Management 133: 71–79. doi:10.1016/j.wasman.2021.07.008.
- Sarra, A., M. Mazzocchitti, and A. Rapposelli. 2017. “Evaluating Joint Environmental and Cost Performance in Municipal Waste Management Systems through Data Envelopment Analysis: Scale Effects and Policy Implications.” Ecological Indicators 73: 756–771. doi:10.1016/j.ecolind.2016.10.035.
- Sernatur (2018). “Informe de Intensidad Turística y Definición de Destinos Turísticos 2018.” Available at: http://www.subturismo.gob.cl/wp-content/uploads/2015/09/Informe-de-Intensidad-Tur%C3%ADstica-y-Definici%C3%B3n-de-Destinos-Tur%C3%ADsticos-2018-1.pdf (In Spanish).
- Sharma, A., R. Ganguly, and A. K. Gupta. 2018. “Matrix Method for Evaluation of Existing Solid Waste Management System in Himachal Pradesh, India.” Journal of Material Cycles and Waste Management 20 (3): 1813–1831. doi:10.1007/s10163-018-0703-z.
- Sharma, A., R. Ganguly, and A. K. Gupta. 2019. “Characterization and Energy Generation Potential of Municipal Solid Waste from Nonengineered Landfill Sites in Himachal Pradesh, India.” Journal of Hazardous, Toxic, and Radioactive Waste 23 (4): 04019008. doi:10.1061/(ASCE)HZ.2153-5515.0000442.
- Simões, P., N. F. Cruz, and R. C. Marques. 2012b. “The Performance of Private Partners in the Waste Sector.” Journal of Cleaner Production 29-30: 214–221. doi:10.1016/j.jclepro.2012.01.027.
- Simões, P., K. De Witte, and R. C. Marques. 2010. “Regulatory Structures and Operational Environment in the Portuguese Waste Sector.” Waste Management 30: 1130–1137. doi:10.1016/j.wasman.2009.12.015.
- Simoes, P., and R. C. Marques. 2012. “On the Economic Performance of the Waste Sector: A Literature Review.” Journal of Environmental Management 106: 40–47. doi:10.1016/j.jenvman.2012.04.005.
- Simões, P., and R. C. Marques. 2011. “How Does the Operational Environment Affect Utility Performance? A Parametric Study on the Waste Sector.” Resources, Conservation & Recycling 55: 695–702. doi:10.1016/j.resconrec.2011.02.001.
- SINADER (2018). “National Waste Declaration System.” Available at: https://mma.gob.cl/actividades/sistema-nacional-de-declaracion-de-residuos-solidos-nuevo-sinader/
- SINIM (2018). “National Municipal Information System.” Available at: http://www.sinim.gov.cl/
- Struk, M., and M. Boďa. 2022. “Factors Influencing Performance in Municipal Solid Waste Management – A Case Study of Czech Municipalities.” Waste Management 139: 227–249. doi:10.1016/j.wasman.2021.09.022.
- Sueyoshi, T., and M. Goto. 2010. “Should the US Clean Air Act Include CO2 Emission Control?: Examination by Data Envelopment Analysis.” Energy Policy 38: 5902–5911. doi:10.1016/j.enpol.2010.05.044.
- Sueyoshi, T., and M. Goto. 2011a. “DEA Approach for Unified Efficiency Measurement Assessment of Japanese Fossil Fuel Power Generation.” Energy Economics 33: 292–303. doi:10.1016/j.eneco.2010.07.008.
- Sueyoshi, T., and M. Goto. 2011b. “Measurement of Returns to Scale and Damages to Scale for DEA-based Operational and Environmental Assessment: How to Manage Desirable (Good) and Undesirable (Bad) Outputs?” European Journal of Operational Research 211: 76–89. doi:10.1016/j.ejor.2010.11.013.
- Sueyoshi, T., and M. Goto. 2011c. “Methodological Comparison between Two Unified (Operational and Environmental) Efficiency Measurements for Environmental Assessment.” European Journal of Operational Research 210: 684–693. doi:10.1016/j.ejor.2010.10.030.
- Sueyoshi, T., and M. Goto. 2012. “Data Envelopment Analysis for Environmental Assessment: Comparison between Public and Private Ownership in Petroleum Industry.” European Journal of Operational Research 216: 668–678. doi:10.1016/j.ejor.2011.07.046.
- Sueyoshi, T., M. Goto, and T. Ueno. 2010. “Performance Analysis of US Coal-fired Power Plants by Measuring Three DEA Efficiencies.” Energy Policy 38: 1675–1688. doi:10.1016/j.enpol.2009.11.017.
- Swart, J., and L. Groot. 2015. “Waste Management Alternatives: (Dis)economies of Scale in Recovery and Decoupling.” Resources, Conservation & Recycling 94: 43–55. doi:10.1016/j.resconrec.2014.11.005.
- United Nations (2015). “The Sustainable Development Agenda.” Retrieved 5 July 2021, sustainable development GOALS website: https://www.un.org/sustainabledevelopment/development-agenda/ Accessed 5 July 2021.
- Valenzuela-Levi, N. 2019. “Factors Influencing Municipal Recycling in the Global South: The Case of Chile.” Resources, Conservation and Recycling 150: 104441. doi:10.1016/j.resconrec.2019.104441.
- Valenzuela-Levi, N. 2021. “Poor Performance in Municipal Recycling: The Case of Chile.” Waste Management 133: 49–58. doi:10.1016/j.wasman.2021.07.021.
- Wang, X., L. Han, and L. Yin. 2017. “Environmental Efficiency and Its Determinants for Manufacturing in China.” Sustainability 9: 47. doi:10.3390/su9010047.
- Wang, K., B. Lu, and Y.-M. Wei. 2013. “China’s Regional Energy and Environmental Efficiency: A Range-Adjusted Measure Based Analysis.” Applied Energy 112: 1403–1415. doi:10.1016/j.apenergy.2013.04.021.
- Wang, L., Z. Zhou, Y. Yang, and J. Wu. 2020. “Green Efficiency Evaluation and Improvement of Chinese Ports: A Cross-efficiency Model.” Transportation Research Part D 88: 102590. doi:10.1016/j.trd.2020.102590.
- World Bank (2019). “World Development Indicators.” Available at: https://datatopics.worldbank.org/what-a-waste/
Appendix
Table A1. Variable importance in regression tree model when eco-efficiency, technical efficiency and environmental efficiency are the predicted variables