
 ?Mathematical formulae have been encoded as MathML and are displayed in this HTML version using MathJax in order to improve their display. Uncheck the box to turn MathJax off. This feature requires Javascript. Click on a formula to zoom.
ABSTRACT
Growing population leads to generating more waste and depletion of natural resources. Moreover, the cost of supplying some resources has increased substantially. Hence, the manufacturer is trying to focus on planning to get back old or partially/wholly unusable products and make the best disposition decisions on them. This research aims to build a multi-industry applied model using the deep learning method in social media analysis to make the best decision for returning products in reverse logistics, along with the sustainability and circular economy concerns. Furthermore, we outline the usage of social network analytics in aligning consumers’ expectations with supply chain policies, strategies, and decisions. An industry benchmark concerning circular economy concepts can be attained by applying the proposed model to different industries. We have proposed a generalisable model using social media analytics, consumer sentiment analysis, reverse logistics, and circular economy theory to attain a circular supply chain regarding sustainability concerns. Applying the proposed model to the electronics industry as a case study, the model was further validated with Twitter data analysis of developing versus developed countries for laptop devices. We collected over 70-million tweets using the Twitter Application Programming Interface (API) over fifteen months. The results approved the proposed model by leveraging the Twitter geolocation attribute to extract Twitter data from developing and developed countries. Moreover, the model is general enough to be used on various industries’ supply chains and provides managers and policymakers with deep insight into reverse logistics’ decision-making. It would be interesting to use real-time analytics and improve accuracy in future works. We made original contributions to reverse logistics decision-making in the circular economy context. Previous research, which has focused on supply chain decision-making, has been extended by providing theoretical and practical implications for social media analytics and the circular economy ecosystem. Thus, by scrutinising the consumers’ needs and expectations, we suggested the best decision on returned products to close an open-ended supply chain and achieve a circular economy. Furthermore, we derived industry benchmarks for both developing and developed countries separately. The results showed that the best decision on returning products in developing countries is different from developed countries. We advise top managers and policymakers to improve supply chain sustainability using social media analytics in developing and developed countries to substantially optimise waste and companies’ profits.
1. Introduction
With population growth and technological advances, the manufacturing and consumption of short life-cycle products have expanded, leading to more raw materials and, consequently, more landfills (Lombardi, Rana, and Fellner Citation2021; Van Wassenhove and Besiou Citation2013). Hence, manufacturers have recently integrated effective zero waste strategies in their supply chains (SCs) (Awasthi et al. Citation2021; S. C. Tseng and Hung Citation2014). Sustainability policies have inspired manufacturers to change their SCs to be aligned with the circular economy (CE) (Bag and Pretorius Citation2020). However, there are more barriers to adopting new technologies, such as initial financial investment in developing countries (Kouhizadeh, Saberi, and Sarkis Citation2021). Given the depletion of raw materials and the rise in their prices over the last decade, governments, top managers of manufacturers, and researchers devote more attention to the recovery of the products returning and circular supply chain (CSC) (Awasthi et al. Citation2021; Bouzon et al. Citation2016; Nikolaou, Evangelinos, and Allan Citation2013; Shahidzadeh and Shokouhyar Citation2022). As consumers are the ending point in the forward SC and starting point in the reverse SC, we consider them eminent stakeholders that can make SCs more sustainable (García-Herrero, De Menna, and Vittuari Citation2019). Social responsibility and sustainability are among the factors that persuade consumers to pay a higher price for purchasing products (Gong et al. Citation2019). Environmental and sustainability concerns have become pressing for consumers (M. S. Khan et al. Citation2020). Besides, as consumers are at the beginning of the product returning process, implementing sustainability and CE concepts in SCs is impossible without full attention to their sentiments about the products (García-Herrero, De Menna, and Vittuari Citation2019). This paper has proposed a model in which consumers’ needs convert a regular SC into a CSC regarding sustainability and CE concerns. We closed an open-ended forward supply chain by sentiment analysis of consumers about the products using state-of-the-art deep learning techniques. Moreover, we derived an industry benchmark for developing and developed countries in reverse logistics (RL). To propose the model, we utilised social media analytics to determine consumers’ perception of sustainability while closing an open-ended regular supply chain (Mathiyazhagan et al. Citation2021; Shahidzadeh and Shokouhyar Citation2022). We also employed a deep learning method for sentiment analysis to attain ultimate accuracy. Furthermore, content analysis was applied to extract features, and descriptive analysis was used to gain insight into the findings. This study indicated that user-generated data and its extracted knowledge help managers handle returned products and make the best decision aligned with consumers’ needs, sustainability, and CE theory.
1.1. Problem description, research gap and motivation
As production, and consequently, the waste of electronic devices is increasing worldwide, one of the best solutions for implementing sustainability policies, along with the CE concepts, is RL (Julianelli et al. Citation2020; Maheswari, Yudoko, and Adhiutama Citation2019). The paper’s motivation is about the decision-making process that could assist and give the managers insight into achieving a zero-waste circular supply chain. However, circular economy and reverse logistics goals are to minimise returning products while maximising the manufacturer’s profits. While many researchers recognise RL as the best strategy towards a CSC, there are few models to connect consumers’ needs to the disposition decisions of RL. Furthermore, as social media became an essential part of peoples’ life, involving consumers’ needs and ideas in social media for SC decisions has not been well discussed regarding the CE and sustainability concepts. Consumers play a vital role in the implementation and performance of RL. Satisfied consumers encourage others on social media to buy the products, while unsatisfied ones discourage others by reflecting their negative sentiments on social media. The more negative sentiments of consumers about products on social media, the more products return to the manufacturing SC, and more waste is generated (Shahidzadeh et al. Citation2020). Moreover, the company’s brand reputation and future sales are negatively affected. Thus, the consumers’ role in generating waste is not neglectable.
Concerning reverse logistics strategies, manufacturers could decide on returning, refurbishing/remanufacturing, repairing/reusing, recycling, or disposing of products. However, according to the CE concepts, disposal is not recommended (Agrawal and Singh Citation2019). Implementing RL is a burden on the shareholders, but the investment can return in the future if the RL policymakers make the best disposition decision on returning products based on some related criteria. Besides financial burdens, many researchers have studied the barriers and importance of implementing RL from various perspectives (Julianelli et al. Citation2020; Rajak, Parthiban, and Dhanalakshmi Citation2021; Vieira et al. Citation2020). Consumers are identified as the most critical stakeholders in implementing RL. They are also crucial concerning RL performance and return on RL investment, as well as a companies’ total profits. With the advent of social media, consumers’ effects on many aspects of sustainability, i.e. environmental, financial, and social ones, are becoming more intensive. We addressed the following main questions in this article.
Q1: How can the consumers’ needs be connected with the decision-making of manufacturers’ top managers in RL?
Q2: What is the best decision on returning products regarding consumers’ appetite while considering a zero waste strategy?
Q3: How can a holistic model be proposed for extracting industry benchmarks to make the best decision for returning products?
A few studies have proposed models that connect the manufacturers’ needs with the sustainability aspects while satisfying consumers’ expectations and appetites (Abualfaraa et al. Citation2020; Abubakr et al. Citation2020; Godina et al. Citation2020). To promote the efficiency of manufacturers’ investments, managers should make the best disposition decisions on returned products by satisfying the real consumers’ needs and sentiments about their products. As a CSC begins with consumers, they play an important role in returning products. A few studies have focused on maximising companies’ profit and sustainability while minimising consumers’ dissatisfaction with products and waste regarding CE policies. Since consumers reflect their opinions and happy/unhappy sentiments on social media, these are the cheapest and most reliable and available data that could affect all sustainability aspects and decision-making of reverse supply chain managers. Recently, due to its availability, using social media data has attracted more attention from authors (Govindan and Bouzon Citation2018). However, in the literature, a few studies have proposed a holistic model concerning user-generated data, sustainability aspects, CE, zero waste strategies, company stakeholders’ profit and, most importantly, consumers’ sentiments on products (Kazemi, Modak, and Govindan Citation2019). However, the model could fit the concepts above by taking the best disposition decision based on the consumers’ needs. Some authors have researched the barriers to implementing RL to identify the gap between developed and developing countries (Rajak, Parthiban, and Dhanalakshmi Citation2021). However, no study compares the decision-making of returning products in developed and developing countries. We fill the research gaps by answering Q1, Q2, and Q3 as follows:
Q1: By proposing the model, we aligned the consumers’ needs and expectations with the manufacturer’s profits and RL’s top managers’ decision processes.
Q2: The last section of the model gives some insight into and suggestions to the manufacturer using the deep learning technique. Moreover, considering RL disposition alternatives, we ensured the manufacturer’s zero-waste strategy by minimising returning products and reusing, refurbishing, and remanufacturing products.
Q3: The final stage of the model’s output generates an industry benchmark, while the proposed model is general enough to apply to the mass-production industries such as automobiles, electronics, etc. Making the best decision on returning products is challenging for RL managers, as consumers’ needs and expectations are more important due to the effect of social media.
As a contribution, we have proposed a theoretical and a practical model to aid top managers in making the best decision in RL and effectively implement a CSC based on the CE concept considering sustainability concerns and consumers’ opinions. This was done through the deep learning technique to analyse the data on social media where consumers interact with each other about the quality of products. By using the proposed model in the electronics industries, a benchmark was extracted for laptop manufacturers, improving CSC performance by aligning consumers’ opinions with manufacturers’ capabilities. The proposed model connects the crucial point of the returning products, consumers, to the decision-making of top managers and policymakers, and policymaking on the returned products is aligned with the implementation of the zero-waste strategies. Accordingly, social media reflects consumers’ ideas, needs, expectations, and sentiments, providing the best recommendations for decision-makers. We mapped these to the reverse supply chain to be aligned with the CE and CSC approaches. The proposed model defines a framework in which consumers’ opinions on products are categorised and analysed by their features separately. This framework ensures managers have their consumers’ views near real-time, separated by product models/features. Examining consumers’ sentiments, this framework ensures managers have their consumers’ views near real-time, separated by product models/features. Furthermore, we used a novel model that makes competitive advantages for manufacturers using deep learning techniques in social media analytics, leading to ultimate accuracy.
The remainder of the article is structured as follows. The second section presents an overview of the related literature. The research methodology is discussed in the third section. In the fourth section, we apply the proposed models to compare the developed countries with developing ones in the electronics industry as a prominent industry and laptop devices as a subsection of this industry. The data analysis of results, as well as the policy recommendations, are also addressed in this section. The discussion of findings and more analysis are given in the fifth section. Research implications, including practical and theoretical ones, are imparted in the sixth section. Finally, the seventh section offers concluding remarks, exclusive contributions on modelling and findings, limitations, and recommendations for future work directions.
2. Literature review
Globalisation policies encourage manufacturing companies to create environmentally-friendly goods that present a sustainable competitive benefit (Waqas et al. Citation2018). Today, a zero-waste strategy for green SCs and product recovery has garnered the attention of professionals and manufacturers (Franco-García, Carpio-Aguilar, and Bressers Citation2019). Reverse logistics, which is among the most effective approaches to performing a CSC, has been viewed as the most critical section of SC leadership in developed countries (Julianelli et al. Citation2020). Unfortunately, however, due to specific obstacles, serving the CSC across developing countries is currently in the first steps (Lahane, Kant, and Shankar Citation2020; Mangla et al. Citation2018). A few researchers consider consumers’ relevant issues as a profound obstacle to performing a CSC (González-Sánchez et al. Citation2020). The current section covers the research already done on CSC leadership and CSC/CE and discovers the electronic waste in CSC leadership. The analytics of social media, as well as related ways in some studies, have also been considered (Shahidzadeh et al. Citation2020).
2.1. Circular economy/circular supply chain
In the last decades, the idea of a CE has received increasing attention, particularly from lawyers, legislators, consultants, and researchers who concentrate on a more sustainable society (Reike, Vermeulen, and Witjes Citation2018; Thomas Citation2020). There are numerous initiatives to perform CE, including eco-effectiveness and eco-efficiency, 7Rs, waste reduction, and stock optimisation, created by the major actors engaging, which are non-governmental organisations (NGOs), governmental and legislative bodies, and consultancy corporations (Kalmykova, Sadagopan, and Rosado Citation2018; Moktadir et al. Citation2020).
The linear economic pattern developed by the “take-make-dispose” approach is incapable of handling the supply and demand balance of natural resources. By understanding the challenge of the rareness of resources in the future, today’s linear economy pattern paves the path for the circular supply pattern (George, Lin, and Chen Citation2015; Goyal, Esposito, and Kapoor Citation2018; Mhatre et al. Citation2021; Velenturf et al. Citation2018). The first paper about the CE was published by (Andersen Citation2007), demonstrating an outline of the basic principles and solutions in environments and economies seeking sustainability. This idea seems to be contained within the concept of “cradle to cradle”. By assuming the waste as the raw material for a new product in a similar or different manufacturing procedure, the life cycles of products would be infinite (Braungart and McDonough Citation2002; Figge, Thorpe, and Good Citation2021).
The need to prolong the useful life of products is considered the basic assumption of the CE that supports reducing the incineration of materials or disposal of them in landfills and sending back the waste to productive business cycles (Rajak, Parthiban, and Dhanalakshmi Citation2018; Reike, Vermeulen, and Witjes Citation2018). A CE deals with the manufacturing cycle, which begins with the design of products, selecting raw materials and suppliers, manufacturing, distribution, consumption, and finally, its accumulation for recycling, reproducing or reutilising (Hysa et al. Citation2020; Mathiyazhagan et al. Citation2021; K. Zhang, Schnoor, and Zeng Citation2012).
Given that the waste should be returned through the reverse cycle, RL must shape a raw or unprocessed material for a similar or different production cycle. The waste should be collected, transported, sorted, and then managed in recycling, reproducing, refurbishing, or reconditioning processes (Braungart, McDonough, and Bollinger Citation2007; Sangwan Citation2017). A few studies on the CSC in the CE have sought to maximise the product life cycle and minimise waste using reverse logistics strategies. Making the best decision on the disposition of returned products is a strategy that dramatically impacts the CSC performance, leading to competitive advantages and ecosystem sustainability (Mathiyazhagan et al. Citation2021; Shahidzadeh and Shokouhyar Citation2022). As consumers have the leading role in returning the products, we developed a brand-new CSC model in the CE using the most advanced deep learning method and social media analytics.
Furthermore, the proposed framework ensures managers and policymakers that a consumer-centric CSC has improved material consumption efficiency. Given that consumers are among the essential stakeholders in implementing the CSC, sentiment analysis plays a vital role in maximising the performance of CSC management. In addition, consumers’ ideas and sentiments on products affect manufacturer strategies towards disposition decisions on returned products and the design of new products in the future.
2.2. Social media and sustainability
Today, given its ability to attract users and motivate them to take action, social media is considered a solid approach for all kinds of businesses. To comprehend the significance of the impressive utilisation of sustainability communication and social media, we refer the interested readers to (Reilly and Hynan, Citation2014; Reilly and Larya, Citation2018), who demonstrate how international corporations from different businesses use corporate social media responsibility reports and social media on sustainability.
(M. L. Tseng et al. Citation2019) recommend a decision-based pattern aimed at elucidating the qualities of sustainable SC management and their impacts on the industry, emphasising the effect of social media. (Shan, Peng, and Wei Citation2020) provided a planning framework of the data-driven from social media to estimate and assess people’s emotional reactions to river pollution. Research on green products and their various phases on social media like Twitter conducted recently by (Karmugilan and Pachayappan Citation2019) demonstrated the people’s full awareness of the different phases of green products. A review of 54 papers in thematic publications on social media conducted by (Rathore, Kar, and Ilavarasan Citation2017) revealed that among different platforms, Twitter is the most popular one, given its various functions.
(N. Mishra and Singh Citation2018) showed that Twitter is essential for researchers to perform scientific research and for industry activists to produce standards for industrial customers. Social media data plays an essential role in the market in real-time. The good or bad opinions of consumers would exponentially affect brand reputations, as well as the manufacturing products’ economic, environmental, and social aspects. However, the most important effects are shaped by consumers, which involve economic, environmental, and social elements (Bangsa and Schlegelmilch Citation2020). Numerous studies have utilized Twitter as an information source to investigate buyers’ viewpoints about brands (Asghar et al. Citation2019; Jansen et al. Citation2009; Juntunen, Ismagilova, and Oikarinen Citation2020; Rasool et al. Citation2019). This is due to the speed and efficiency of sentiment analysis on Twitter for organizations to find out people’s feelings about their managers and business.
The sentiment is applied to the text regarding negative or positive emotions of an individual on social media, including an ultimate goal and an object (Shahidzadeh et al. Citation2020). Consumers’ sentiments towards purchased products affect returned products’ quality and quantity, as well as their future purchasing. As consumers’ cultures are different from country to country, we studied CSC management in developing and developed countries. Furthermore, the economic state of the countries influences top strategies of governments to rule the companies towards the CE and zero waste strategy.
2.3. Deep learning and sentiment analysis
As an application of ANN, the short form of the artificial neural network, deep learning utilises networks of compound layers to learn tasks. It can take advantage of the vastly greater learning or representation ability of neural networks supposed to work just with a small amount of data and one or two layers in the past.
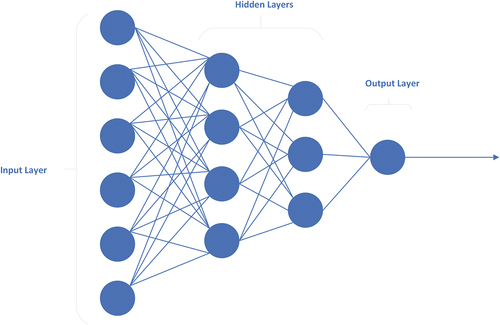
Deep learning has progressed and generated up-to-date outcomes in numerous application fields in the past decade, beginning with computer vision and then involving speech recognition, as well as natural language processing (NLP) studied lately (Collobert et al. Citation2011; Goldberg Citation2016; Liu et al. Citation2017; Yang et al. Citation2019). depicts the arrangement of a deep learning system from a lower layer on the left to a higher layer on the right (Dhillon and Verma Citation2020; Lee et al. Citation2009). Over recent years, deep learning models have been applied extensively in the domain of NLP and demonstrated strong possibilities. The usage of deep learning and related approaches in NLP tasks is briefly classified in the following sections.
Figure 1. The arrangement of the deep learning system
2.3.1. Sentiment analysis tasks with deep learning technique
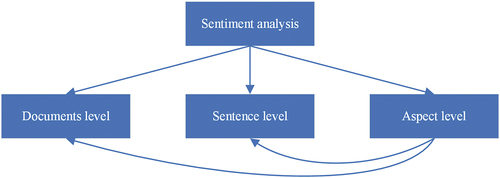
Researchers have performed sentiment analysis in three levels of data sets: sentences, aspects, and documents (Tedmori and Awajan Citation2019). The document-level sentiment classification sorts an opinionated document (e.g. product feedback) stating a generally negative or positive idea (Choi, Oh, and Kim Citation2020). It takes the entire document in the role of the fundamental data unit and recognizes the document as being opinionated, containing ideas on a whole unit such as a particular cellphone. The sentence-level sentiment analysis classifies single statements in a document (Y. Zhang et al. Citation2019). However, it is impossible to assume every statement as an opinionated sentence. The sentence-level sentiment analysis classifies sentences as negative, neutral, or positive. The aspect-level sentiment analysis uses a much more minor data set than sentence-level and document-level ones (Wang et al. Citation2021). It is responsible for extracting and summing up the people’s ideas stated about entities and features/aspects of entities or targets. Given product feedback as an example, aspect-level sentiment analysis aims to sum up positive and negative ideas about various product features, while the overall sentiment about it can be negative or positive. demonstrates various levels of sentiment classification/analysis and their interrelationship.
Figure 2. Sentiment analysis and categorization levels and their interrelationship
As far as we know, no predominating method has been used so far in the literature, despite several deep learning methods suggested to work with aspect-level sentiment classification. lists the related research articles.
Table 1. Recent studies on three levels of sentiment analysis
We performed sentence-level and aspect-level sentiment analyses using CNN and LSTM simultaneously, as discussed in Section 3.3, whose results are presented in Section 4.
3. Research methodology
To have a systematic approach to the study, at first, the framework of the research is introduced. Secondly, a consumer-centric CSC model is proposed using a novel deep learning method in four parts, including social media analytics, feature extraction of the products, sentiment analysis of the user-generated data, and some recommendations and industry benchmark on returning products. Thirdly, we discussed the deep learning method which has been used in the proposed model.
3.1. The framework of the research
As shown in , to visualise the research methodology, we divide the study into four phases. In the first phase, we review the literature on the CE concept and circular supply chain, along with the social media analytics and sentiment analysis. The use of social media analytics in implementing the CE concept has been identified as a main research gap in the literature. However, a few studies have recently been conducted with different approaches to RL (Julianelli et al. Citation2020; Sharifi and Shokouhyar Citation2021). We also discuss the competitive advantages gained for manufacturers after implementing the CSC compared to the old-fashioned linear SC.
Figure 3. Proposed research methodology framework
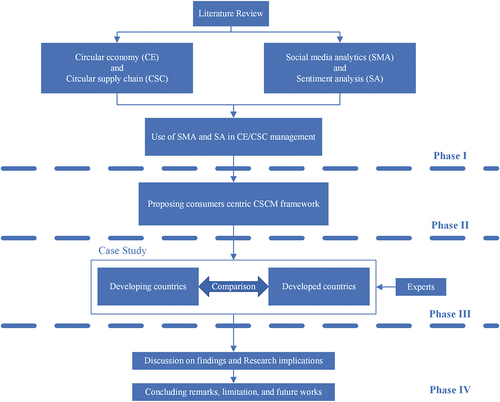
In the second phase, we propose the consumer-centric CSC management model based on the CE approach and the consumers’ opinions and sentiments obtained from social media analytics (Shahidzadeh et al. Citation2020). Furthermore, some prescriptions are suggested to the top managers and policymakers for returning products. Given that RL is among the best strategies for closing an open-ended SC, we use reusing, recycling, remanufacturing, refurbishing, and disposal disposition decisions to suggest alternatives to the managers for returned products. Industry benchmarks and practices are also derived after implementing the proposed model used by different companies in the same industry scope. In the third phase, to validate the proposed model, we conduct a case study on laptops, a sub-section of the electronics industry, in developing and developed countries. Furthermore, we analyse the results to propose the best practice for laptop producers separately in developing and developed countries. An electronics industry benchmark is attained by an analysis of the results. Finally, in the last phase, we discuss findings and theoretical and practical research implications. The concluding remarks, main contributions, limitations, and future works are also reviewed.
3.2. Proposed model/framework
We depicted the proposed model in . The proposed model consists of two main streams. The first stream is to determine the hashtags and keywords, which is the input to the second stream. Using content analysis of the social media and documents of the manufacturer leads to extracting the product’s features (modules) which the experts refine. The Second stream is to extract consumers’ opinions, ideas, and sentiments about every feature/model of the products. In the second stream, user-generated data from social media is gathered using the hashtags and keywords which has been identified in the first stream. Then, analytical processing is used to have qualified information for the sentiment analysis. With descriptive analysis and suggestions on returning product disposition in RL, a consumer-centric circular supply chain is attained. Using the results on a specific industry, an industry benchmark is broadly usable in similar industries. To attain an industry benchmark for implementing a CSC, we propose a novel model for designing an automated system for extracting consumers’ opinions and sentiments on social media. This model uses the deep learning technique to extract aspects of consumers’ social media posts. A deep learning method is also used to classify users’ opinions as negative, neutral, and positive sentiments. This model comprises four sections.
Figure 4. Proposed consumers-centric circular supply chain management framework based on the social media analytics
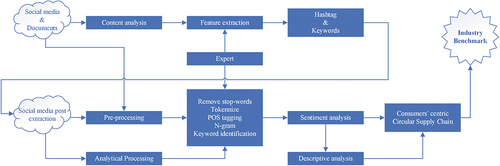
Social media raw data was used as an input for feature extraction and sentiment analysis, both of which were done through deep learning methods. However, before feature extraction, content analysis was done to improve the accuracy of the feature extraction. Furthermore, we implemented pre-processing and procedures such as removing stop words, tokenising, Part-of-speech (POS) tagging, and n-gram in the proposed model to have a more robust and accurate sentiment analysis. These procedures ensure the higher accuracy of the deep learning techniques.
Feature extraction was designed based on the automated aspect extraction in the sentence-level analysis as in most social media and microblogging, some length limitations for the posts are imposed. We filtered the extracted features with experts’ opinions to derive the best categorisations based on the related hashtags and keywords.
Sentiment analysis was conducted using the literature’s most accurate deep learning technique. The analysis was performed separately on every extracted feature identified in the previous section. This analysis ensures that consumers’ opinions on every feature are analysed and suggests to the top managers about their productions. Furthermore, user-generated data was categorised as negative, neutral, and positive, providing a deep insight into the CSC management decision-making and aligning the existing SC to consumer-centric CSC.
Industry benchmark was derived after a desired period regarding the nature of the industry. The benchmark ensures that the provided results are the best for the products, as long as the industry technology does not change. However, in the case of technology alteration, a new benchmark could be derived due to the near real-time nature of the proposed model. Industry benchmarks ensure fast and agile decision-making processes in the SC.
3.2.1. SOCIAL MEDIA
Social media data, as a significant source of user/consumer-generated data in the SC for returned products, is gathered and stored in companies to be analysed (Nguyen et al. Citation2018). In the proposed model, social media data, which was received through API automatically, was stored along with the documents provided by the company about the products. Content analysis is necessary to gain insight from data using a wide range of Natural Language Processing (NLP) techniques. The social media data is unstructured, informally written, and usually contains hashtags, URLs, and expressions. Regarding the content analysis, (Shahidzadeh et al. Citation2020) proposed a genuine technique to overcome the language variety in social media by translating it to English. Furthermore, they removed duplicate text from the next stage of processing. Most NLP techniques and machine learning algorithms are more accurate in English (Nassif et al. Citation2021). With pre-processing techniques, social media data can be prepared and classified in different ways, such as machine learning and deep learning to attain structured data for further analytics. Other pre-processing and content analysis methods, including emoji detection, text cleaning, parsing or tokenising, and word frequency analysis (Pimpalkar and Raj Citation2020), were also used to get precise results in the current research. We further applied POS tagging, n-gram, and keyword identifications, removed stop words and tokenised the sentences to have more accurate sentiment analysis results (Avasthi, Chauhan, and Acharjya Citation2021). These methods ensure that the semi-structured data resulting from the content analysis and pre-processing stages provide more consistent data for feature extraction and sentiment analysis stages.
3.2.2. FEATURE EXTRACTION
An automated aspect extraction technique was applied in the sentence-level analysis, while most micro-blogging social media have post length limitations. This process ensures that all aspects of the user-generated data are identified and classified by techniques such as deep learning (Ray and Chakrabarti Citation2019). Experts filtered out the desired features among the classified aspects of the social media data regarding industry context and products. By counting the number of mentioned aspects and features, a ranking was formed among features. However, this ranking might change over time. Furthermore, some recognised aspects would differ in words but have the application and meaning in semantic language. Some techniques like synonym recognition might be used to merge similar aspects. Nevertheless, given the industry context and high level of accuracy, we preferred to fine-grain and combine recognised aspects with the aid of industry experts in the proposed model. A list of hashtags and keywords was attained and used to categorise social media data for the next steps.
3.2.3. SENTIMENT ANALYSIS
The input data was prepared to be analysed using the state-of-art deep learning method. Pre-processing and applied techniques in the previous stages ensured the ultimate accuracy of the sentiment analysis. However, no exact level of accuracy improvements was guaranteed, while some methods like removing stop words would increase the probability of showing positive and negative contents. As we used aspect classification in the previous stage, we only focused on sentence-level sentiment analysis. After subjectivity classification, we classified subjective sentences as positive, neutral, and negative. The sentiment analysis approaches like supervised or unsupervised machine learning techniques provide results with different accuracies (Z. Y. Khan et al. Citation2021; Stojanovski et al. Citation2018). After preparing the data for analysis and attaining the industry benchmark, as well as quantitatively describing a set of data’s statistical properties, we conducted a descriptive analysis to sum up the data in a graphical format. In SC studies of forecasting models and intelligence, descriptive analysis has been broadly adopted to get the current data state in an executive dashboard (Amirmokhtar Radi and Shokouhyar Citation2021; Shahidzadeh et al. Citation2020).
3.2.4. INDUSTRY BENCHMARK
After applying sentiment analysis to every feature, we suggest that the top managers, through descriptive analysis, ensure the company has consumer-centric CSC. These suggestions on every feature form an industry benchmark after a while. The industry benchmark would eventually be documented and published by SC managers and used for intra-organisation or extra-organisation applications. Furthermore, industry benchmarks would increase the speed and accuracy of the decision-making process. By implementing this model to the industry subsections, sub-industry benchmarks would be created (Park and Lee Citation2021). It is worth mentioning that, as a product’s life cycle approaches its end, the industry benchmark should be revised and analysed. However, we proposed this model to be fast enough to be used in near-realtime applications.
3.3. New approach of the implementing proposed model
As mentioned in Section 2, many researchers have recently used machine learning techniques. Nevertheless, due to the increasing computing power, parallel processing, and Graphics processing unit (GPU), the preferable methods are deep learning with massive training and testing procedures. As explained in Section 3.2, feature extraction and sentiment analysis could be implemented in various machine learning techniques. However, deep learning techniques are more complex than the old machine learning algorithms and need more computing power, as well as time for training the algorithms. Some of the deep learning algorithms have very similar performances. For example, Recursive CNN and gated recurrent unit (GRU) have approximately equal accuracy with CNN and LSTM, respectively (Kamiş and Goularas Citation2019). Many researchers have tested various configurations, combining CNN and LSTM networks to outperform each of them alone. Recently, different configurations of word embedding features and various combinations of neural networks have been investigated in studies to attain higher precision scores compared to deep learning methods (Kamiş and Goularas Citation2019).
3.4. Results of case study – developing vs developed countries
The proposed model is a holistic model which can be used in many industries. As illustrated in , in this research, we used the model in two different contexts developing countries and developed countries (Phase IV of the research framework). We applied the model and scrutinised the results to find the resemblances and differentiation between consumers’ needs and ideas of the developing and developed countries.
4. Case study and results/findings
We used the same raw data which has been classified and analysed for this study. However, sentiment analysis is done on classified and parallel analysing processes for developing and developed countries. The results and findings of the research are discussed in this section.
The Twitter API enables us to filter out tweets with different attributes. To differentiate between developing and developed countries, we used World Economic Situation and Prospects 2020 report (WESP Citation2020), officially published by the United Nations (United Nations Citation2020). We used Twitter geolocation attributes to separate tweets of developing countries from those of developed countries using Twitter search API from January 1, 2020, to March 15, 2021. We utilised the model results to compare developing and developed countries separately and assess and improve the proposed model’s robustness and truthfulness. Different results were obtained for developing and developed countries, and additional suggestions and industry benchmarks were given to policymakers. We also tested the proposed model results with the sensitivity analysis with different periods to validate the model with obtained results. According to , the model had four main components, i.e. social media, feature extraction, sentiment analysis, and industry benchmark. The extracted results are described in the following. It is worth mentioning that social media raw data and feature extraction were the same for the data of developing and developed countries.
4.1. Social media data
The first phase started with getting related tweets’ data specified in the Twitter search API query of hashtags and keywords. Four secret keys were required to use the Twitter Search API, which was obtained from the https://developer.twitter.com/. After authentication of secret keys, the transferred data were encoded in JavaScript Object Notation (JSON) format. Each tweet in JSON format comprises a unique ID, an author, a timestamp of sending, geolocation coordination if available, and some other data. We used the output format to parse the tweets’ data for the next pre-processing and content analysis steps. We employed Twitter Search API with “Laptop” keyword search in thirty-four languages supported by Twitter.com (Twitter Citation2021).
4.1.1. Content analysis and descriptive analysis
In this subsection, we analysed and categorised each tweet by separating the name and handle of the user composing tweets; main tweet text; hashtags; links; images; the number of retweets, quotes, favourites, and replies; and geolocation. We also separated emoticons if there were any, which is vital for the sentiment analysis. As most of the robust feature extraction and sentiment analysis methods are more accurate in English, we translated the tweets’ main text from other languages to English with auto-translation to overcome the language diversity. Furthermore, we removed the exact tweet text after translation. The descriptive tweet data analysis is summarised in .
Table 2. Summarisation of descriptive tweet data analysis
As shown in , we separated developing and developed countries’ tweets for further analysis in the following steps.
4.1.2. Pre-processing
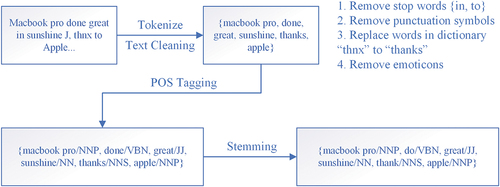
To attain higher accuracy, we removed invaluable data in the text pre-processing step, which is optional. It ensures that unstructured and sophisticated texts of tweets are made more structured and unsophisticated by applying POS tagging, stemming, removing double spaces, removing stop words, and employing word normalisation techniques. Using pre-processing, we ensured that the highest accuracy in the sentiment analysis was achieved as most of the techniques’ accuracy was word-dependent (Shahidzadeh et al. Citation2020). A tweet example with the applied techniques is represented in .
Figure 5. Example of a tweet in pre-processing
4.2. Feature extraction
The goal of feature extraction was to identify the most discussed feature of the Apple laptops in the extracted tweets, along with the other documents such as Portable Document Format (PDF)s and website pages. SC experts filtered out these features to attain the most related ones. To gain the ultimate accuracy, we applied the hybrid method of CNN and LSTM for aspect extraction and categorisation, as mentioned earlier in Section 2.4.5. The configuration details of the deep learning methods are presented in Section 4.5. represents the extracted feature filtered out by three experts with at least four years of experience in the RL of the electronics industry.
Table 3. Feature extraction with deep learning technique of aspect extraction and categorizations
As depicts, the primary laptop features, along with related keywords and hashtags, were categorised in indirect and direct relationships with the RL. A physical component of a laptop was defined as having a direct relationship to the RL, and it could be reusable by making the best disposition decision in the RL. On the other hand, indirect features were not physical components but the consumers’ sentiments about these factors affecting decision-making in the RL. The direct features included storage, display, design, battery, and connector. The indirect features were price, security, warranty, and operating system. Feature extraction ensured that all the tweets were categorised into nine classes, including five direct and four indirect features.
4.3. Sentiment analysis
We used both CNN and LSTM on the data extracted from Twitter over the year 2020 to enhance the precision of the results, which achieved the highest accuracy of 93.78% (Feizollah et al. Citation2019). Due to the limited nature of the microblogs such as Twitter, along with the character count of every post, the sentence-level sentiment analysis is more applicable and has higher accuracy in total. The sentiment analysis was done on every feature separately using the hybrid combination of CNN and LSTM. The training data was selected from the tweets with happy and sad emoticons (Peacock and Khan Citation2019). presents the final results of the sentiment analysis for each feature. To have a more comprehensive insight into the consumers’ needs and corresponding sentiment analysis, we performed the sentiment analysis of developing and developed countries separately.
Table 4. The final results of the sentence level of the extracted tweets
As presented in , the final results of the sentiment analysis for every feature were calculated and separated for the developing and developed countries. There was a high correlation between the SA results of the developing countries and developed ones. However, the warranty feature gained more satisfaction in the developed countries. While consumers were happy with the storage, display, design, and operating system in developing and developed countries, they were not satisfied with the price, security, battery, and connector. shows the happiness/unhappiness corresponding to the following formula for every feature in spider chart format.
Figure 6. The amount of consumers’ happiness compared developing countries vs developed countries
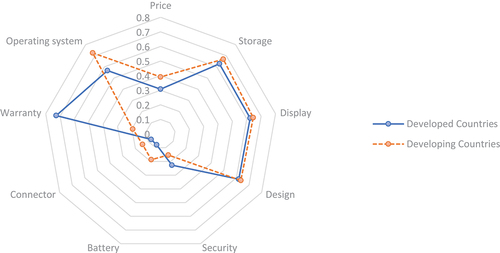
The level of happiness ranges between zero and one.
The happier the consumer is with a feature, the closer the corresponding point in is to the perimeter of the spider graph. In contrast, the closeness to the centre of the spider graph determines the unhappiness of the consumers. As demonstrated in , unlike the warranty feature, there are approximately the same sentiment analysis results for all features in developing and developed countries. Display, design, and storage had the highest correlation among developing and developed countries. However, the consumers of the developed countries were delighted with the warranty, while the consumers in the developing countries were very unhappy with this feature. This is due to the vast warranty service in a limited area, mainly located in developed countries. Most consumers were very unhappy with the battery, price, and connector features. Rather than having an overall sentiment analysis of the consumers on every feature, tweet classification in three categories, i.e. happy, neutral, and unhappy, would be suggested to the SC managers and policymakers. Furthermore, a greater insight into the current status of the products can be attained to provide more compatible future products regarding the consumers’ needs and expectations.
4.3.1. Sentiment analysis results on developing countries’ data
Consumers in developing countries have more population rather than in developed countries. Thus, the number of tweets that have been analysed is also more. As depicts, all the extracted tweets from Twitter were filtered out by the geolocation tags of the tweets; then, it has been categorised into Happy, Neutral, and Unhappy classes through sentiment analysis. Most people who live in developing countries are happy with the products’ storage, display, design, and operating system. However, the majority of the consumers were unhappy with the price, security, battery, connector, and warranty of the products. It is worth mentioning that there are not the same SA results only on warranty attributes between developing and developed countries. Furthermore, as illustrates, there is a huge difference in the calculated amount of happiness in developing and developed countries. However, the difference in happiness in other attributes is approximately the same. The gaps between happiness in the warranty are related to the company’s warranty coverage that most of the after-sale and warranty service location resides in developing countries.
4.3.2. Sentiment analysis results on developed countries’ data
The population living in developed countries is less than in developing countries. Hence, the number of tweets considered in the sentiment analysis process is also less. We filtered out all the extracted tweets from the raw Twitter data by the geolocation tags of the tweets; then, like developing countries, it has been categorised into Happy, Neutral, and Unhappy classes through sentiment analysis. Most people who live in developed countries are happy with the products’ storage, display, design, warranty, and operating system. However, the majority of the consumers were unhappy with the price, security, battery, and connector of the products. It is worth mentioning that, as shows, the correlation of happiness between developing and developed countries is high. However, the sentiment score of warranty attributes in developing countries is lower than in developed countries due to the warranty service locations.
4.4. Industry benchmark
Beyond the sentiment analysis of the consumers, an industry benchmark could be derived for developed and developing countries separately. An industry benchmark would help top managers and policymakers make RL’s best and fast decisions about direct and indirect features. As indirect features are not related to the strategic decisions in RL and are not physical components, we used the corresponding tweets to give some suggestions to the managers who could apply them for future products or for enhancing the existing RL performance. However, we proposed an industry benchmark for Apple laptops’ direct features, i.e. physical components, with the CE and zero-waste approaches considering consumers’ needs from all around the world separately for developing and developed countries.
Concerning the zero-waste strategy, we matched the happiness spectrum of , ranging from zero to one, to the three disposition decisions to map consumers’ sentiment analysis into RL disposition decisions, as depicted in . However, we did not recommend waste and disposal.
Figure 7. Schematic diagram of the forward supply chain and reverse supply chain flow
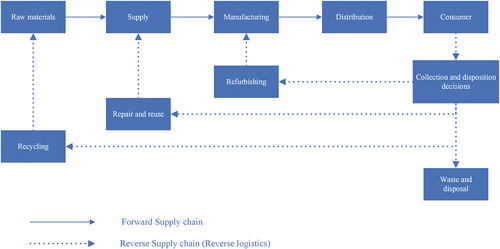
Figure 8. Mapping and matching consumers’ happiness and disposition decision
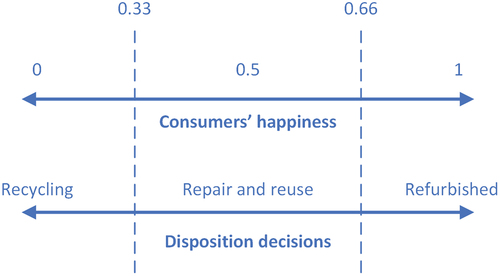
Based on the defined mapping between the consumers’ happiness, extracted by the sentiment analysis of the tweets, and disposition decisions defined by the RL theory, we proposed an industry benchmark for laptops towards zero-waste strategy and CE approach. shows the final result of the derived laptop benchmark as a sub-section of the electronics industry benchmark, which aids top managers and SCs be aligned with the CE through consumers’ ideas and needs.
Table 5. Laptop benchmark as a sub-section of the electronics industry
As presented in , mapping the sentiment analysis score to the disposition decision shows that the laptop benchmark for developed and developing countries was derived separately. The best disposition decision for the battery and connector features was recycling in developed and developing countries. Developing countries were happier with both the battery and connector features of the Apple laptops. The best disposition decision for the display and design features in both developed and developing countries was repair and reuse. However, the SA results were very close to 0.66, which is the decision point for refurbishing. This means consumers were happy with these features, but they criticised that display and design would be refurbished in new products by applying them to new products. Furthermore, the best disposition decision for the storage feature in developed countries was repair and reuse, concerning the CE concept. In contrast, the best disposition decision for this “ feature in developing countries was refurbishing.
5. Research practical and theoretical implications
By proposing a CSC model, we concurrently addressed the raw material demand, waste management, consumers’ satisfaction, and sustainability to develop a CE ecosystem. Additionally, we demonstrated that different consumers’ behaviours could be centralised into an industry benchmark by analysing and comparing developing and developed countries. Although developing countries have sought to improve the concepts of CSC and create some strategies consistent with circular model practices so far, no significant difference exists among the industry benchmarks in developing and developed countries. Besides the level of CSC implementations, due to the more population and product usage in the developing countries, we suggested more pressure on developing countries’ governments to use the proposed model and implement the industry benchmark to achieve higher performance in a much shorter time. No study has been conducted upon proposing a comprehensive analysis and a holistic CSC execution model from the manager’s perspective (Goyal, Esposito, and Kapoor Citation2018). Thus, to fill the literature gap, we proposed a framework to connect the circular economy concepts to the effective implementation of the CE while focusing on the consumers’ needs as the most critical stakeholders in the reverse SC. This also promotes general performance and results of companies in sustainable growth. We used state-of-the-art deep learning techniques for feature extraction and sentiment analysis in the proposed model to gain the most accurate results.
6. Concluding remarks
Because of elevated ecological awareness and unsustainable models of resource utilisation and waste production, business organisations worldwide are searching for broader circular models within their SCs. The CSC concepts or extension of the circular model enables organisations to efficiently utilise resources and improve customers’ standards. Simultaneously, it has also been observed that the embrace of CSC management is challenging for organisations, specifically in developing countries, because of different governmental regulations and financial restrictions. However, social media analytics is a low-cost and fast strategy to convert the SC into a consumer-centric CSC. There are still few studies on modelling CSC using social media, proper enough to be generalised to various industries. Satisfying consumers’ needs not only affects eliminating the waste but also helps the managers to make the best disposition decisions in the RL. In developing countries, implementing the RL system is generally significant, while it also has more importance in polluting industries like the electronics industry. To put it in a nutshell, we fill the literature gaps as follows:
- We devised the model in order to align the consumer’s needs and expectations with the manufacturers’ profits and top managers’ decisions in real-time.
- The model offers some insights and suggestions about returning products in RL to the manufacturer using the state-of-the-art deep learning technique.
- By considering alternative of RL procedures (disposition decisions on reverse supply chain), we were able to guarantee the manufacturer’s zero-waste strategy by minimising returns and reusing, refurbishing, and remanufacturing products.
- We provide an industry benchmark that can be applied to mass-production industries, such as automobiles and electronics.
- Due to social media’s tremendous impact, the ability to make appropriate decisions about returning products is becoming a challenge for RL managers since consumers’ expectations and needs are becoming more critical. We solve this concern by analysing social media data and converting it into sensible decisions.
6.1. Unique contributions
In this research, we focused on proposing a holistic model that connects the consumers to the SC decision-makers while satisfying CE concepts, sustainability aspects, zero-waste strategy, and consumers’ needs, as well as the SC theory, using the most accurate integrated framework of deep learning technique. This contribution attempts to discern and analyse major consumers’ views to follow CSC principles while taking the CE viewpoint (Shahidzadeh and Shokouhyar Citation2022). In the case study, we defined laptops’ features and modules using the proposed system to provide some advice to the managers on disposition decisions of product returns separately. We also analysed the possible difference in decision-making for laptops as a sub-section of the electronics industry in the RL of developing and developed countries. Moreover, an industry benchmark was presented for top managers and policymakers of the SC. The proposed model is applicable to various industries such as automotive, food, and textile to attain industry benchmarks and practices. Using a state-of-art deep learning method, we increased the precision of the decision-making of the managers, which leads to a more sustainable SC while minimising the waste. Extracting consumers’ sentiments, we defined a method for mapping them to the disposition decisions in the reverse SC. The results outlined in this study would enable managers and government entities to solve the issues related to economic growth and climate change by concentrating on the CSC models in the industry. To put it in a nutshell, we emphasised major contributions as follows:
We have proposed a theoretical and practical model based on the CE concept that will help top management make the best decision in RL and successfully implement a CSC that considers sustainability concerns and consumer opinions.
Using social media data rather than the old-fashion way of gathering user data like surveys have been used through deep learning technique to analyse these data where consumers interact with each other about the quality of products in near real-time.
A benchmark could be extracted for the mass production industry by applying the proposed model.
Improving CSC performance by aligning consumers’ opinions with manufacturers’ capabilities.
Providing the best recommendations for decision-makers in RL considering circular economy theory.
The proposed model defines a framework in which consumers’ opinions on products are categorised and analysed by their features separately with the minimum time and effort.
This framework ensures managers have their consumers’ views near real-time, separated by product models/features.
Using the proposed model ensures manufacturers with the minimum level in their inventory, returning products and wastes while having maximum performance on using returned products and the company’s profit.
6.2. Future works and limitations
The proposed CSC model is general enough to be applied to mass-production industries. However, other approaches should consider low-volume production due to its special consumers and possibly low number of consumers. In the future, the model could be extended for low-volume production industries. This study proposes an advanced social network monitoring system utilising a deep learning process. Fittings the deep learning methods to attain higher accuracy is very tricky. Moreover, getting more accurate results requires stronger hardware and more data to be trained. The integrated deep learning-based feature extraction method is based on expert judgements, which should be checked out quite cautiously. As a case study, we validated and analysed the proposed model for developing and developed countries to extract industry benchmarks for laptops as a sub-section of the electronics industry. However, other industry benchmarks, such as the automotive industry, could be derived from the proposed model. In future work, this model can also be used to design an RL roadmap for top managers by changing the as-is state to the to-be state.
HIGHLIGHTS
The proposed model connects the consumers to the policymakers’ decision-making on the returning products align with the zero-waste strategies.
A case study in comparison of the developing and developed countries validates the persistency of the framework
Proposing an industry benchmark based on the social media analytics for circular supply chain
The results proved focusing on consumers’ needs will convert the regular SC to the CSC regarding sustainability and CE concerns.
Examining consumers’ sentiments, managers and policymakers are getting deep insight into the returned and new products.
Disclosure statement
No potential conflict of interest was reported by the author(s).
References
- Abualfaraa, W., K. Salonitis, A. Al-Ashaab, and M. Ala’raj. 2020. “Lean-green manufacturing practices and their link with sustainability: A critical review.” Sustainability (Switzerland) 12 (3). doi:10.3390/su12030981.
- Abubakr, M., A. T. Abbas, I. Tomaz, M. S. Soliman, M. Luqman, and H. Hegab. 2020. “Sustainable and smart manufacturing: An integrated approach.” Sustainability (Switzerland) 12 (6). doi:10.3390/su12062280.
- Agrawal, S., and R. K. Singh. 2019. “Analyzing disposition decisions for sustainable reverse logistics: Triple Bottom Line approach.” Resources, Conservation and Recycling 150: 104448. doi:10.1016/j.resconrec.2019.104448.
- Amirmokhtar Radi, S., and S. Shokouhyar. 2021. “Toward consumer perception of cellphones sustainability: A social media analytics.” Sustainable Production and Consumption 25: 217–233. doi:10.1016/j.spc.2020.08.012.
- Andersen, M. S. 2007. “An introductory note on the environmental economics of the circular economy.” Sustainability Science 2 (1): 133–140. doi:10.1007/s11625-006-0013-6.
- Asghar, Z., T. Ali, I. Ahmad, S. Tharanidharan, S. K. A. Nazar, and S. Kamal. 2019. “Sentiment Analysis on Automobile Brands Using Twitter Data.” Communications in Computer and Information Science 932. doi:10.1007/978-981-13-6052-7_7.
- Avasthi, S., R. Chauhan, and D. P. Acharjya. 2021. “Processing Large Text Corpus Using N-Gram Language Modeling and Smoothing.” Lecture Notes in Networks and Systems 166. doi:10.1007/978-981-15-9689-6_3.
- Awasthi, A. K., V. R. S. Cheela, I. D’Adamo, E. Iacovidou, M. R. Islam, M. Johnson, T. R. Miller, et al. 2021. “Zero waste approach towards a sustainable waste management.” Resources, Environment and Sustainability 3. doi:10.1016/j.resenv.2021.100014.
- Bag, S., and J. H. C. Pretorius. 2020. “Relationships between industry 4.0, sustainable manufacturing and circular economy: proposal of a research framework.” International Journal of Organizational Analysis. doi:10.1108/IJOA-04-2020-2120.
- Bangsa, A. B., and B. B. Schlegelmilch. 2020. “Linking sustainable product attributes and consumer decision-making: Insights from a systematic review.” Journal of Cleaner Production 245: 118902. doi:10.1016/j.jclepro.2019.118902.
- Bouzon, M., K. Govindan, C. M. T. Rodriguez, and L. M. S. Campos. 2016. “Identification and analysis of reverse logistics barriers using fuzzy Delphi method and AHP.” Resources, Conservation and Recycling 108: 182–197. doi:10.1016/j.resconrec.2015.05.021.
- Braungart, M., and W. McDonough. 2002. “Design for the Triple Top Line.” Corporate Environmental Strategy 9 (3): 251-258.
- Braungart, M., W. McDonough, and A. Bollinger. 2007. “Cradle-to-cradle design: creating healthy emissions - a strategy for eco-effective product and system design.” Journal of Cleaner Production 15(13–14. doi:10.1016/j.jclepro.2006.08.003.
- Chen, P., Z. Sun, L. Bing, and W. Yang (2017). “Recurrent attention network on memory for aspect sentiment analysis.” In Proceedings of the 2017 Conference on Empirical Methods in Natural Language Processing, pages 452–461, Copenhagen, Denmark. Association for Computational Linguistics. DOI:10.18653/v1/d17-1047.
- Choi, G., S. Oh, and H. Kim. 2020. “Improving document-level sentiment classification using importance of sentences.” Entropy 22 (12): 1336. doi:10.3390/e22121336.
- Collobert, R., J. Weston, L. Bottou, M. Karlen, K. Kavukcuoglu, and P. Kuksa. 2011. “Natural language processing (almost) from scratch.” Journal of Machine Learning Research 12 (2011): 2493-2537.
- Dhillon, A., and G. K. Verma. 2020. “Convolutional neural network: a review of models, methodologies and applications to object detection.” Progress in Artificial Intelligence 9 (2): 85–112. doi:10.1007/s13748-019-00203-0.
- Feizollah, A., S. Ainin, N. B. Anuar, N. A. B. Abdullah, and M. Hazim (2019). “Halal Products on Twitter: Data Extraction and Sentiment Analysis Using Stack of Deep Learning Algorithms.” IEEE Access, 7: 83354-83362. DOI:10.1109/ACCESS.2019.2923275.
- Figge, F., A. S. Thorpe, and J. Good. 2021. “Us before me: A group level approach to the circular economy.” Ecological Economics 179. doi:10.1016/j.ecolecon.2020.106838.
- Franco-García, M.-L., J. C. Carpio-Aguilar, and H. Bressers. 2019. Towards Zero Waste, Circular Economy Boost: Waste to Resources. In Towards zero waste, pp. 1-8. Springer, Cham, 2019. doi:10.1007/978-3-319-92931-6_1.
- García-Herrero, L., F. De Menna, and M. Vittuari. 2019. “Sustainability concerns and practices in the chocolate life cycle: Integrating consumers’ perceptions and experts’ knowledge.” Sustainable Production and Consumption 20. doi:10.1016/j.spc.2019.06.003.
- George, D. A. R., B. C. A. Lin, and Y. Chen. 2015. “A circular economy model of economic growth.” Environmental Modelling and Software 73. doi:10.1016/j.envsoft.2015.06.014.
- Godina, R., I. Ribeiro, F. Matos, B. T. Ferreira, H. Carvalho, and P. Peças. 2020. “Impact assessment of additive manufacturing on sustainable business models in industry 4.0 context.” Sustainability (Switzerland) 12 (17). doi:10.3390/su12177066.
- Goldberg, Y. 2016. “A primer on neural network models for natural language processing.” Journal of Artificial Intelligence Research 57. doi:10.1613/jair.4992.
- Gong, M., Y. Gao, L. Koh, C. Sutcliffe, and J. Cullen. 2019. “The role of customer awareness in promoting firm sustainability and sustainable supply chain management.” International Journal of Production Economics 217. doi:10.1016/j.ijpe.2019.01.033.
- González-Sánchez, R., D. Settembre-Blundo, A. M. Ferrari, and F. E. García-Muiña. 2020. “Main dimensions in the building of the circular supply chain: A literature review.” Sustainability (Switzerland) 12 (6). doi:10.3390/su12062459.
- Govindan, K., and M. Bouzon. 2018. “From a literature review to a multi-perspective framework for reverse logistics barriers and drivers.” Journal of Cleaner Production 187: 318–337. doi:10.1016/j.jclepro.2018.03.040.
- Goyal, S., M. Esposito, and A. Kapoor. 2018. “Circular economy business models in developing economies: Lessons from India on reduce, recycle, and reuse paradigms.” Thunderbird International Business Review 60 (5): 729–740. doi:10.1002/tie.21883.
- Hysa, E., A. Kruja, N. U. Rehman, and R. Laurenti. 2020. “Circular economy innovation and environmental sustainability impact on economic growth: An integrated model for sustainable development.” Sustainability (Switzerland) 12 (12). doi:10.3390/SU12124831.
- Jansen, B. J., M. Zhang, K. Sobel, and A. Chowdury. 2009. “Twitter power: Tweets as electronic word of mouth.” Journal of the American Society for Information Science and Technology 60 (11): 2169–2188. doi:10.1002/asi.21149.
- Julianelli, V., R. G. G. Caiado, L. F. Scavarda, and S. P. D. M. F. Cruz. 2020. “Interplay between reverse logistics and circular economy: Critical success factors-based taxonomy and framework.” Resources, Conservation and Recycling 158: 104784. doi:10.1016/j.resconrec.2020.104784.
- Juntunen, M., E. Ismagilova, and E. L. Oikarinen. 2020. “B2B brands on Twitter: Engaging users with a varying combination of social media content objectives, strategies, and tactics.” Industrial Marketing Management 89. doi:10.1016/j.indmarman.2019.03.001.
- Kalmykova, Y., M. Sadagopan, and L. Rosado. 2018. “Circular economy - From review of theories and practices to development of implementation tools.” Resources, Conservation and Recycling 135. doi:10.1016/j.resconrec.2017.10.034.
- Kamiş, S., and D. Goularas (2019). “Evaluation of Deep Learning Techniques in Sentiment Analysis from Twitter Data.” Proceedings - 2019 International Conference on Deep Learning and Machine Learning in Emerging Applications, Deep-ML 2019. Istanbul, Turkey. DOI:10.1109/Deep-ML.2019.00011.
- Karmugilan, K., and M. Pachayappan (2019). “Sustainable manufacturing with green environment: An evidence from social media.” Materials Today: Proceedings, 22. 2nd International Conference on Materials Manufacturing and Modelling, ICMMM – 2019, VIT University, Vellore, 29th - 31st March 2019. DOI:10.1016/j.matpr.2020.03.087.
- Kazemi, N., N. M. Modak, and K. Govindan. 2019. “A review of reverse logistics and closed loop supply chain management studies published in IJPR: a bibliometric and content analysis.” International Journal of Production Research 57: Issues 15–16. doi:10.1080/00207543.2018.1471244.
- Khan, M. S., P. Saengon, A. M. N. Alganad, D. Chongcharoen, and M. Farrukh. 2020. “Consumer green behaviour: An approach towards environmental sustainability.” Sustainable Development 28(5. doi:10.1002/sd.2066.
- Khan, Z. Y., Z. Niu, S. Sandiwarno, and R. Prince. 2021. “Deep learning techniques for rating prediction: a survey of the state-of-the-art.” Artificial Intelligence Review 54(1. doi:10.1007/s10462-020-09892-9.
- Kouhizadeh, M., S. Saberi, and J. Sarkis. 2021. “Blockchain technology and the sustainable supply chain: Theoretically exploring adoption barriers.” International Journal of Production Economics 231. doi:10.1016/j.ijpe.2020.107831.
- Lahane, S., R. Kant, and R. Shankar. 2020. “Circular supply chain management: A state-of-art review and future opportunities.” Journal of Cleaner Production 258: 120859. doi:10.1016/j.jclepro.2020.120859.
- Lee, H., R. Grosse, R. Ranganath, and A. Y. Ng (2009). “Convolutional deep belief networks for scalable unsupervised learning of hierarchical representations.” Proceedings of the 26th International Conference On Machine Learning, ICML 2009. Montreal Quebec Canada June 14 - 18, 2009. DOI:10.1145/1553374.1553453.
- Li, Z., Y. Zhang, Y. Wei, Y. Wu, and Q. Yang (2017). “End-to-end adversarial memory network for cross-domain sentiment classification.” IJCAI International Joint Conference on Artificial Intelligence. DOI:10.24963/ijcai.2017/311.
- Liu, W., Z. Wang, X. Liu, N. Zeng, Y. Liu, and F. E. Alsaadi. 2017. “A survey of deep neural network architectures and their applications.” Neurocomputing 234. doi:10.1016/j.neucom.2016.12.038.
- Lombardi, M., R. Rana, and J. Fellner. 2021. “Material flow analysis and sustainability of the Italian plastic packaging management.” Journal of Cleaner Production 287. doi:10.1016/j.jclepro.2020.125573.
- Ma, D., S. Li, X. Zhang, and H. Wang (2017). “Interactive attention networks for aspect-level sentiment classification.” IJCAI International Joint Conference on Artificial Intelligence. DOI:10.24963/ijcai.2017/568.
- Maheswari, H., G. Yudoko, and A. Adhiutama. 2019. “Government and intermediary business engagement for controlling electronic waste in Indonesia: A sustainable reverse logistics theory through customer value chain analysis.” Sustainability (Switzerland) 11 (3). doi:10.3390/su11030732.
- Mangla, S. K., S. Luthra, N. Mishra, A. Singh, N. P. Rana, M. Dora, and Y. Dwivedi. 2018. “Barriers to effective circular supply chain management in a developing country context.” Production Planning and Control 29 (6): 551–569. doi:10.1080/09537287.2018.1449265.
- Mathiyazhagan, K., S. Rajak, S. Sampurna Panigrahi, V. Agarwal, and D. Manani. 2021. “Reverse supply chain management in manufacturing industry: a systematic review.” International Journal of Productivity and Performance Management 70 (4): 859–892. doi:10.1108/IJPPM-06-2019-0293/FULL/XML.
- Mhatre, P., R. Panchal, A. Singh, and S. Bibyan. 2021. “A systematic literature review on the circular economy initiatives in the European Union.” Sustainable Production and Consumption 26: 187–202. doi:10.1016/j.spc.2020.09.008.
- Mishra, A., K. Dey, and P. Bhattacharyya (2017). “Learning cognitive features from gaze data for sentiment and sarcasm classification using convolutional neural network.” ACL 2017 - 55th Annual Meeting of the Association for Computational Linguistics, Proceedings of the Conference (Long Papers), 1. Vancouver, Canada. DOI:10.18653/v1/P17-1035.
- Mishra, N., and A. Singh. 2018. “Use of twitter data for waste minimisation in beef supply chain.” Annals of Operations Research 270 (1–2): 337–359. doi:10.1007/s10479-016-2303-4.
- Moktadir, M. A., A. Kumar, S. M. Ali, S. K. Paul, R. Sultana, and J. Rezaei. 2020. “Critical success factors for a circular economy: Implications for business strategy and the environment.” Business Strategy and the Environment 29(8. doi:10.1002/bse.2600.
- Nassif, A. B., A. Elnagar, I. Shahin, and S. Henno. 2021. “Deep learning for Arabic subjective sentiment analysis: Challenges and research opportunities.” Applied Soft Computing 98: 106836. doi:10.1016/j.asoc.2020.106836.
- Nguyen, T., L. ZHOU, V. Spiegler, P. Ieromonachou, and Y. Lin. 2018. “Big data analytics in supply chain management: A state-of-the-art literature review.” Computers & operations research 98. doi:10.1016/j.cor.2017.07.004.
- Nikolaou, I. E., K. I. Evangelinos, and S. Allan. 2013. “A reverse logistics social responsibility evaluation framework based on the triple bottom line approach.” Journal of Cleaner Production 56. doi:10.1016/j.jclepro.2011.12.009.
- Park, J., and B. K. Lee. 2021. “An opinion-driven decision-support framework for benchmarking hotel service.” Omega (United Kingdom). doi:10.1016/j.omega.2021.102415.
- Peacock, D. C., and H. U. Khan. 2019. “Effectiveness of social media sentiment analysis tools with the support of emoticon/emoji.” Advances in Intelligent Systems and Computing 800 (Part F1). doi:10.1007/978-3-030-14070-0_68.
- Pimpalkar, A., and R. J. R. Raj (2020). “Evaluation of Tweets for Content Analysis Using Machine Learning Models.” Proceedings - 2020 12th International Conference on Computational Intelligence and Communication Networks, CICN 2020. Held 25-26 September 2020, Bhimtal, India. DOI:10.1109/CICN49253.2020.9242611.
- Qian, Q., M. Huang, J. Lei, and X. Zhu (2017). “Linguistically regularized LSTM for sentiment classification.” ACL 2017 - 55th Annual Meeting of the Association for Computational Linguistics, Proceedings of the Conference (Long Papers), 1. Vancouver, Canada. DOI:10.18653/v1/P17-1154.
- Rajak, S., P. Parthiban, and R. Dhanalakshmi. 2018. “Selection of Transportation Channels in Closed-Loop Supply Chain Using Meta-Heuristic Algorithm.” International Journal of Information Systems and Supply Chain Management 11 (3): 64–86. doi:10.4018/IJISSCM.2018070104.
- Rajak, S., P. Parthiban, and R. Dhanalakshmi. 2021. “Analysing barriers of sustainable transportation systems in India using Grey-DEMATEL approach: A supply chain perspective.” 14 (3): 419–432. International Journal of Sustainable Engineering DOI:10.1080/19397038.2021.1929553.
- Rasool, A., R. Tao, K. Marjan, and T. Naveed. 2019. “Twitter Sentiment Analysis: A Case Study for Apparel Brands.” Journal of Physics: Conference Series 1176 (2). doi:10.1088/1742-6596/1176/2/022015.
- Rathore, A. K., A. K. Kar, and P. V. Ilavarasan. 2017. “Social media analytics: Literature review and directions for future research.” Decision Analysis 14 (4): 229–249. doi:10.1287/deca.2017.0355.
- Ray, P., and A. Chakrabarti. 2019. “A Mixed approach of Deep Learning method and Rule-Based method to improve Aspect Level Sentiment Analysis.” Applied Computing and Informatics. doi:10.1016/j.aci.2019.02.002.
- Reike, D., W. J. V. Vermeulen, and S. Witjes. 2018. “The circular economy: New or Refurbished as CE 3.0? — Exploring Controversies in the Conceptualization of the Circular Economy through a Focus on History and Resource Value Retention Options.” Resources, Conservation and Recycling 135. doi:10.1016/j.resconrec.2017.08.027.
- Reilly, A. H., and K. A. Hynan. ”Corporate Communication, Sustainability, and Social Media: It's Not Easy (Really) Being Green.” Business horizons 57, no. 6 (2014): 747–758.
- Reilly, A. H., and N. Larya. 2018. “External Communication About Sustainability: Corporate Social Responsibility Reports and Social Media Activity.” Environmental Communication 12 (5): 621–637.
- Sangwan, K. S. 2017. “Key Activities, Decision Variables and Performance Indicators of Reverse Logistics.” Procedia CIRP 61: 257–262. doi:10.1016/j.procir.2016.11.185.
- Shahidzadeh, M. H., S. Ahmadi, S. Shokouhyar, and I. Elpiniki Papageorgiou. 2020. “The bright side of consumers’ opinions of improving reverse logistics decisions: a social media analytic framework.” International Journal of Logistics Research and Applications 1–34. doi:10.1080/13675567.2020.1846693.
- Shahidzadeh, M. H., and S. Shokouhyar. 2022. “Toward the closed-loop sustainability development model: a reverse logistics multi-criteria decision-making analysis.” Environment, Development and Sustainability 1–93. doi:10.1007/S10668-022-02216-7.
- Shan, S., J. Peng, and Y. Wei. 2020. “Environmental Sustainability assessment 2.0: The value of social media data for determining the emotional responses of people to river pollution—A case study of Weibo (Chinese Twitter).” Socio-Economic Planning Sciences. doi:10.1016/j.seps.2020.100868.
- Sharifi, Z., and S. Shokouhyar. 2021. “Promoting consumer’s attitude toward refurbished mobile phones: A social media analytics approach.” Resources, Conservation and Recycling 167. doi:10.1016/j.resconrec.2021.105398.
- Stojanovski, D., G. Strezoski, G. Madjarov, I. Dimitrovski, and I. Chorbev. 2018. “Deep neural network architecture for sentiment analysis and emotion identification of Twitter messages.” Multimedia Tools and Applications 77(24. doi:10.1007/s11042-018-6168-1.
- Tay, Y., L. A. Tuan, and S. C. Hui (2017). “Dyadic memory networks for aspect-based sentiment analysis.” International Conference on Information and Knowledge Management, Proceedings, Part F131841. Singapore, Singapore, 2017 November 6 - 10. DOI:10.1145/3132847.3132936.
- Tedmori, S., and A. Awajan. 2019. “Sentiment analysis main tasks and applications: A survey.” Journal of Information Processing Systems 15 (3). doi:10.3745/JIPS.04.0120.
- Thomas, S. 2020. “Waste, marginal property practices and the circular economy.” Journal of Property, Planning and Environmental Law 12 (3): 203–218. doi:10.1108/JPPEL-02-2020-0012.
- Tseng, S. C., and S. W. Hung. 2014. “A strategic decision-making model considering the social costs of carbon dioxide emissions for sustainable supply chain management.” Journal of Environmental Management 133. doi:10.1016/j.jenvman.2013.11.023.
- Tseng, M. L., M. K. Lim, K. J. Wu, and W. W. Peng. 2019. “Improving sustainable supply chain capabilities using social media in a decision-making model.” Journal of Cleaner Production 227: 700–711. doi:10.1016/j.jclepro.2019.04.202.
- Twitter. (2021). Supported Languages and Browsers. Twitter Website. https://developer.twitter.com/en/docs/twitter-for-websites/twitter-for-websites-supported-languages/overview.html
- United Nations. (2020). World Economic Situation and Prospects 2020. https://www.un.org/development/desa/dpad/publication/world-economic-situation-and-prospects-2020/
- United Nations Department for Economic and Social Affairs. 2020. World Economic Situation and Prospects 2020. UN.
- Van Wassenhove, L. N., and M. Besiou. 2013. “Complex problems with multiple stakeholders: how to bridge the gap between reality and OR/MS?.” Journal of Business Economics 83 (1): 87–97. doi:10.1007/s11573-012-0643-3.
- Velenturf, A. P. M., P. Purnell, M. Tregent, J. Ferguson, and A. Holmes. 2018. “Co-producing a vision and approach for the transition towards a circular economy: Perspectives from government partners.” Sustainability (Switzerland) 10 (5). doi:10.3390/su10051401.
- Vieira, B. D. O., P. Guarnieri, L. C. E Silva, and S. Alfinito. 2020. “Prioritizing barriers to be solved to the implementation of reverse logistics of e-waste in Brazil under a multicriteria decision aid approach.” Sustainability (Switzerland) 12 (10). doi:10.3390/su12104337.
- Wang, Y., Q. Chen, J. Shen, B. Hou, M. Ahmed, and Z. Li. 2021. “Aspect-level sentiment analysis based on gradual machine learning.” Knowledge-Based Systems 212. doi:10.1016/j.knosys.2020.106509.
- Waqas, M., Q. L. Dong, N. Ahmad, Y. Zhu, and M. Nadeem. 2018. “Critical barriers to implementation of reverse logistics in the manufacturing industry: A case study of a developing country.” Sustainability (Switzerland) 10 (11). doi:10.3390/su10114202.
- Yang, H., L. Luo, L. P. Chueng, D. Ling, and F. Chin. 2019. Deep Learning and Its Applications to Natural Language Processing. 89–109. Springer, Cham. doi:10.1007/978-3-030-06073-2_4.
- Yin, Y., Y. Song, and M. Zhang (2017). “Document-level multi-aspect sentiment classification as machine comprehension.” EMNLP 2017 - Conference on Empirical Methods in Natural Language Processing, Proceedings, Copenhagen, Denmark. DOI:10.18653/v1/d17-1217.
- Zhang, K., J. L. Schnoor, and E. Y. Zeng. 2012. “E-waste recycling: Where does it go from here?.” Environmental science & technology 46 (20): 10861–10867. doi:10.1021/es303166s.
- Zhang, Y., Z. Zhang, D. Miao, and J. Wang. 2019. “Three-way enhanced convolutional neural networks for sentence-level sentiment classification.” Information Sciences 477. doi:10.1016/j.ins.2018.10.030.
- Zhao, Z., H. Lu, D. Cai, X. He, and Y. Zhuang (2017). “Microblog sentiment classification via recurrent random walk network learning.” IJCAI International Joint Conference on Artificial Intelligence. DOI:10.24963/ijcai.2017/494.
- Zhou, X., X. Wan, and J. Xiao (2016). “Attention-based LSTM network for cross-lingual sentiment classification.” EMNLP 2016 - Conference on Empirical Methods in Natural Language Processing, Proceedings, Austin, Texas. DOI:10.18653/v1/d16-1024.