
 ?Mathematical formulae have been encoded as MathML and are displayed in this HTML version using MathJax in order to improve their display. Uncheck the box to turn MathJax off. This feature requires Javascript. Click on a formula to zoom.
ABSTRACT
Using waste plastics as a partial natural aggregate replacement and monitoring strength and workability reduction in pavement structures is vital to net-carbon zero. This study explores the utilisation of waste plastic as a fine aggregate replacement in medium-strength reinforced concrete pavements, for improving plastic aggregate performance and the intrinsic reasoning for observed strength performance. Various weight fractions of fines were substituted by the same weight of plastic aggregates ranging from 5–15% according to the appropriate standards (Eurocodes and British Standards). The physical and mechanical properties of the composites were analysed. The results indicated that the use of polymeric materials as a partial replacement for fines contributed to a decrease in workability, compressive strength and push-out bond between steel reinforcement and concrete. Despite these trends, 5% replacement of fine aggregates with plastic waste surpassed all the feasibility criteria. Furthermore, using 10% of plastic replacement by weight was deemed feasible in non-structural applications such as roads, pavements, and facades. The outputs have demonstrated environmental engineering concepts in tackling plastic waste, providing an alternative to conventional aggregate. Environmental benefits can arise due to the removal of potentially hazardous plastics from entering ecosystems as well as minimising dredging of global sand reserves.
1 Introduction
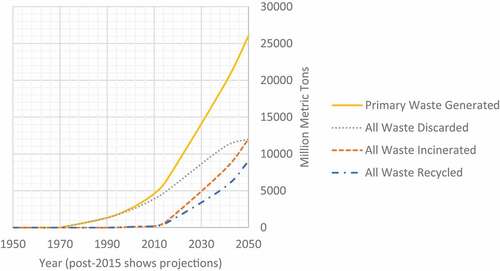
With the ever-growing need of the world to become more sustainable, waste products are being disfavoured more and more. Das, Alam, and Chowdhury (Citation2019) state that plastic waste is a pertinent part of the complete amount of waste worldwide. At present, the general waste management practices and treatment of such waste streams are incineration, recycling, or landfills (wherein the unsustainable process of landfilling is performed). However, current recycling practice across the United Kingdom (UK) is not sustainable, and landfill is still the most commonly adopted method. Statistics show that about 51% are buried, 27% are incinerated, and only 22% are recycled for plastic waste (Saikia and de Brito Citation2012). illustrates data adapted from Geyer, Jambeck, and Law (Citation2017), which shows that plastic waste that cannot be recycled is the most significant part of cumulative plastic waste generation across the world. Polyethylene terephthalate (PET), polypropylene (PP), polystyrene (PS), polyethylene (PE), polyolefins (PO) and Poly (methyl methacrylate) (PMME) are the main sources of plastic waste, producing about 6.5 billion tonnes of plastic every year (Li, Ling, and Mo Citation2000). illustrates the primary, discarded, incinerated, and recycled global plastic waste generation in million metric tons between 1950–2050. 2015–2020 are projections based on current usage trends.
Figure 1. Global cumulative plastic waste generation and disposal (Geyer, Jambeck, and Law Citation2017).
Polymeric materials are not only a significant source of waste but are becoming an ecological threat (Ali and Wahab Citation2017). Li, Ling, and Mo (Citation2000) state that plastics form a substantial environmental burden due to being non-biodegradable. Consequently, they will remain in the environment indefinitely, polluting soil and water, creating ecological contamination (Das, Alam, and Chowdhury Citation2019).
The lifecycle of waste plastic is therefore unsustainable. Braungart and McDonough (Citation2002) point out that the practice of dumping this waste into landfills is indicative of a failure to design recyclable and sustainable products and processes. Instead, the concept of waste should be looked at as a ‘resource’. As a result of the typical lifecycle for plastics, the manufacture, use, wastage and disposal of materials are becoming an essential consideration in the sustainability of the built environment (Windapo and Ogunsanmi Citation2014). Non-conventional materials such as plastic are gaining traction as a solution to these problems, and their introduction into the construction industry is becoming a widely considered trend to pursue sustainable development (Zhang and Canning Citation2011).
Today, second only to water resources, concrete is the most consumed material, with three tonnes per year used for every person in the world. In addition, twice as much concrete is used in construction globally as a core material compared to all other building materials combined (Gagg Citation2014). As a result, concrete may be one solution to combat plastic pollution on land, water, infrastructure and ecosystems. Moreover, alternatives to – and the reuse of – current materials are essential, since there are targets for infrastructure to reuse and recycle at least 8–36% of its waste (Waste and Resource Action Programme (WRAP) Citation2017).
Therefore, the replacement of conventional aggregate in concrete mixtures with waste plastics has great environmental potential. This basic idea could lead to an effective waste management solution for plastics and effectively increase the sustainable procurement of aggregates for concrete, meeting material reuse targets.
2 Overview of waste plastics
2.1 Waste plastics and physical properties
Modern plastics have both physical and mechanical properties that are desirable in engineering. da Costa et al. (Citation2016) state some of their desirable characteristics as being low cost, resistant to water, chemical, temperature and long-term natural light and UV- allowing plastics to be versatile in a range of industries. Andrady and Neal (Citation2009) state that plastic use ranges from simple stationary components to a wide array of applications for complex air and spacecrafts. Wuchinich (Citation2015) explains that certain thermosetting plastic composites provide static strengths comparable to certain metals whilst having slightly greater densities than water and an acoustic resistance equivalent to aluminium. Such characteristics are displayed in , comparing a variety of common plastics. As shown (), the density, water absorption, impact strength, compressive strength, shear modulus, tensile strength, bending strength, young’s modulus and friction coefficient for common waste plastics to give an idea of the differences between the characteristics of certain plastics.
Table 1. Intrinsic properties of common plastics used today (Designer Data Citation2015).
Subsequently, Guendouz, Debieb, and Boukendakdji et al. (Citation2016) state that depending on the type of plastic used, the mechanical performance of concrete can either be positively or negatively influenced, and this needs to be considered. There is the potential to save 410 million tonnes of fine aggregate from concrete use every year, equating to about 2.5% of global sand aggregate consumption (Van Oss Citation2015). Therefore, the demand for the worlds fine aggregate may be reduced, which currently has an extremely high demand (Mineral Products Association (MPA) Citation2016).
2.2 Adhesion and surface energy of plastics
The specific factor that governs bonding strength between materials is surface energy. Jaccodine (Citation1963) states that surface energy is a measure of the work necessary to separate a material into two parts along a plane. below shows common adherents and plastics and their surface energy. The surface energy of aluminium, Kapton, nylon 6,6, acrylonitrile butadiene styrene, polyethylene, polypropylene and polymethyl methacrylate to give an idea of the differences in surface energy of common adherents used in the construction industry is presented in . Ruban, Skriver, and Nørskov (Citation2002) explains that a greater surface area will improve a material’s intrinsic surface energy, indicating that surface energy and surface area are directly correlated. Goli, Mohammad, and Singh (Citation2020) describe the relation between surface areas and the compressive strength of concrete when embedded with waste plastics. Using a higher surface area of plastic waste can, sometimes lead to increased compressive strength properties. However, the higher the surface area, the greater the interfacial transition zone volumes within the concrete structure and can increase the chances of failure due to poor contact time between the cement and plastics.
Table 2. Surface energy of common adherents (Jialanella Citation2010).
Nevertheless, it is not entirely apparent that using plastics with a high surface area can be most feasible. In this research project, the authors have experimented with this hypothesis. The application of waste plastics with a higher surface area to cement can be achieved by using fine aggregate rather than coarse or plastic strips. As a rule, if the surface energy is above 40 mJm−2 this is deemed sufficient for bonding to an adhesive (Jialanella Citation2010).
2.3 Current review of concrete infrastructure and waste plastics
2.2.1 Wet state of concrete
Concrete fully cured strength properties are directly related to its wet state because the consistency of the wet concrete continuously diminishes from the very start of the process, blending until full hydration (Neville Citation1995). According to Babafemi et al. (Citation2017), consistency and compaction of wet concrete are vital factors in the development of strength and durability of cured concrete.
Currently, the workability of concrete using plastic aggregates has been investigated but with different outputs. Li, Ling, and Mo (Citation2000) conclude that the workability of plastic aggregate concrete highly depends on the friction between the plastic particles, which is affected by the shape and content used. This investigation initially observed that the inclusion of plastic aggregate contributed to a workability reduction in mortar and concrete. Specifically, higher contents of plastic aggregates tended to cause a more significant decrease in workability.
Rahmani et al. (Citation2013) observed similar findings. It was found that the workability of concrete with PET waste generally decreased, with a more pronounced decrease as plastic content increased. This was attributed to the flaky shape of the particles. Silva, de Brito, and Saikia (Citation2013) discussed the effect of shape extensively, suggesting that lamellar and angulated particles led to less workable concrete while regular or spherical shaped particles promoted it. Similarly, Ismail and AL-Hashmi (Citation2008) attributed the decrease in slump values of fine plastic aggregate concretes to angular and non-uniform shapes, resulting in less fluidity.
2.2.2 Hard state of concrete
Generally, there has been mutual analysis among researchers regarding the strength characteristics’ of concrete with the use of waste plastics. Similar investigations have observed that strength characteristics decrease with increasing percentages of waste plastics.
Jaivignesh and Sofi (Citation2010) investigated the partial replacement of aggregate by weight using non-biodegradable mixed plastic waste. The investigation replaced fine aggregates by 10%, 15% and 20% with fine plastics, using 25MPa concrete at a ratio of 1:1:2 (cement, fine aggregate and coarse aggregate). Their results concluded that compressive strength, split tensile strength and flexural strength were reduced with increasing percentages of plastic aggregates.
Babafemi et al. (Citation2017) looked at the engineering properties of concrete with waste recycled plastic as an admixture. Their investigation focussed first on the properties of fresh concrete and then on the mechanical and durability properties of cured concrete. The intrinsic behaviour of plastic aggregates was found to reduce the performance of concrete under both mechanical and durability tests, with results attributed to increased air content and weak bonding between the plastic and natural aggregate.
Li, Ling, and Mo (Citation2000) stated that the hydrophobic and non-hydrating properties, as well as the size, shape and content of plastic aggregate, played an important role in influencing compressive strength. Generally, an increasing loss in compressive strength was observed with the increase in PET aggregate content.
Ismail and AL-Hashmi (Citation2008) researched the applications of a mixture consisting of PET and polystyrene as sand replacements in concrete. As with those mentioned, subsequent increases in the percentage of plastic used decreased compressive strength. This was attributed to a decrease in the adhesive strength between the waste plastics surface and the cement paste due to the hydrophobic properties of plastic.
Saikia and de Brito (Citation2012) investigated both compressive and tensile strengths. In this investigation, much like the trends for compression, there was a loss in tensile performance where the more plastic added, the greater the loss in strength.
2.2.3 Suggested applications based on experimental results
Li, Ling, and Mo (Citation2000) states that the addition of plastic aggregate can be used in non-load bearing structures, irrespective of the decreased workability and compressive strength that others have observed. Examples of such structures include lane dividers, roundabouts and roadblocks, sound barriers and buildings as an earthquake shock-wave absorbers (Siddique, Citation2008). Additionally, plastic is observed to reduce the density and -brittleness of concrete and mortar and demonstrate improved performance in heat insulation, water resistance, and noise reduction characteristics (Rashad Citation2016; Thomas and Gupta Citation2016; Ferrándiz-Mas and García-Alcocel Citation2013). Similarly, Babafemi et al. (Citation2017) concluded that feasible civil engineering applications included pavements, concrete bricks, facades and non-structural panels.
Generally, research into waste plastic as either a partial aggregate replacement or an admixture by weight has shown similar trends for the past few years. Waste plastic is a widely available material in many markets (Thorneycroft et al. Citation2018), making it a cost-effective alternative for the construction industry. However, large surface areas and their proportion to the strength of concrete structures need further investigation (Goli, Mohammad, and Singh Citation2020). Such trends indicate that increasing the percentage of plastic in concrete reduces strength characteristics such as compressive and tensile strength, however some plastics are shown to be more feasible than others – particularly in non-primary structures. Further research on the topic, particularly in higher strength concrete in reinforced structures, needs to be done. In doing so, the application of plastics in concrete will not be limited to non-structural use, but its feasibility can also be assessed in load-bearing scenarios.
2.3 Considerations from literature
2.3.1 Aggregate type
The intrinsic properties of plastics govern their adhesion. Therefore, by investigating factors relating to maximising adhesion, it has been deemed most appropriate to adopt a large surface area available for bonding, which will improve surface energy and give a better chance for bonding success. Moreover, Das, Alam, and Chowdhury (Citation2019) state that fine aggregate will increase the packing density of the concrete and, as such compressive strength will be maximised. Therefore, fine aggregate replacement has been deemed most feasible and will be used.
2.3.2 Percentage replacement
This investigation is concerned with finding the optimum and highest feasible quantity of plastic aggregate to use in reinforced concrete. Guendouz, Debieb, and Boukendakdji et al. (Citation2016) state that a maximum aggregate replacement percentage of 20% should be investigated for fines. Furthermore, Thorneycroft et al. (Citation2018) state that up to 10% of sand can be replaced in concrete without compromising strength. However, Kaur and Pavia (Citation2020) observed a decline in mechanical and hygric properties with plastic replacements by a 15% change. Considering these reports and scientific literature, it has been deemed that 0%, 5%, 10% and 15% were the most appropriate percentages to use in this investigation.
3 Materials and methods
3.1 Materials
Ordinary Portland cement was used in this study, conforming to BS EN 197–1:2011 specifications (BSI Citation2011). A mix of grit and natural holm sand was used as fine aggregates with 4–10 mm and 10–20 mm diameter stone for coarse aggregate. This blend was selected to comply as closely as possible with the requirements of natural normal-weight aggregates outlined in BS EN 12620:2002 (BSI, Citation2002b). Potable water was used in the concrete mix and conformed to BS EN 1008:2002 (BSI (Citation2002a)).
3.1.1 Plastic aggregate
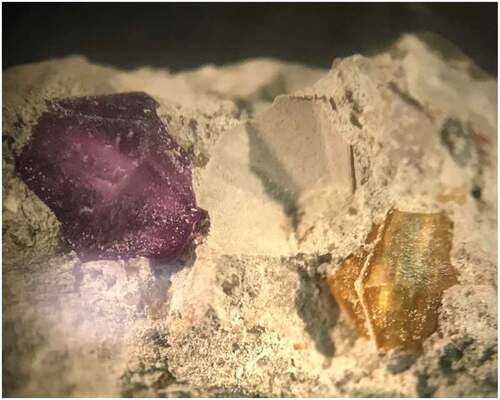
From the literature studied it was determined that fine-aggregate, defined in BS EN 12620:2002 as 4 mm or less in diameter, would be the most appropriate grade to partially replace. Plastic waste was collected from a Plastic recycling facility in Bristol, England, UK which used a sorting and shredding process. The plastic sourced was a 50/50 mix of 3 mm and 4 mm diameter acrylic (or Polymethyl methacrylate, PMME) particles, with regular angular facets to create angles and edges for bonding; displays the shape and dimensions of the particles with the geometry and diameter of the plastic waste used to partially replace fine aggregate in this investigation.
Figure 2. Shape and dimensions of plastic aggregates sourced.
3.1.2 Concrete composition
As outlined in the literature research, further research is needed regarding plastic aggregate use in medium strength concrete. It was deemed that a medium strength 40MPa concrete mix would be utilised. The composition of each batch is shown in , with the equivalent fines and sand replacement for each plastic weight used shown in . For a 40MPa Concrete Mix Design, displays the design concrete mix proportions in kg to produce 1 m3 and the concrete mix proportions in kg for the 0%, 5%, 10% and 15% batches required 0.024 m3 respectively.
Table 3. Slump classes (BSI Citation2013).
Table 4. Equivalent fines and sand replacements.
shows the fine plastic replacement for conventional materials (sand), and plastic fines.
3.2 Methods
3.2.1 Workability
3.2.1.1 Procedure to determine fresh concrete consistency within pavements
The slump tests to determine the consistency of fresh concrete were conducted in accordance with BS EN 12350–2:2019. The slump was determined by carefully upturning the cone and measuring the difference in height between the cone and the highest point of the slumped specimen, shown in .
Figure 3. Slump measurement with forms of slump: a) True; b) Shear (adapted after BSI, Citation2019a; BSI Citation2019b and BSI Citation2019c).
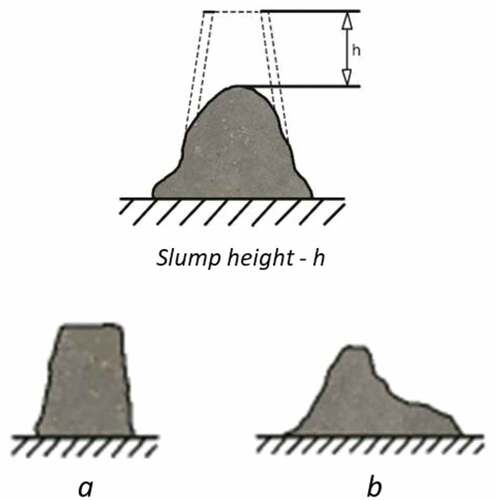
The slump measurement (BSI, Citation2019a; BSI, Citation2019b and BSI, Citation2019c) indicated the measurement of the height (h) of the slump between the wet concrete and the slump cone with the forms of slump (a) True and (b) Shear which indicates the forms that a slump can take; true being acceptable and shear being unacceptable.
3.2.1.2 Feasibility criteria for workability
details the various slump classes according to BS EN 12350–2:2019. According to the British Ready-Mixed Concrete Association (Citation2011), medium workable concretes with a slump in the range of 50–90 mm are typically used for light, general and heavy industrial applications. This includes normal reinforced concrete placed with vibration. Slump Class 2 is the most feasible for the high strength reinforced concrete investigated in this paper. Batches that fall within this range will therefore be deemed feasible ().
Table 5. 40MPa concrete mix design.
Furthermore, the test is only valid if the sample yields a true slump (BSI Citation2013), this being a slump in which the concrete remains substantially intact and symmetrical, as shown in . Therefore, specimens must also meet this criterion.
3.2.2 Cube Compression test
3.2.2.1 Creating specimens
The shape and dimensions of the cube specimens were made according to BS EN 12390–1:2012, making and curing of specimens in according to BS EN 12390–2:2019 and the determination of compressive strength in accordance with BS EN 12390–3:2019. Conforming to BS EN 12390–1:2012 specification, 100x100x100mm polystyrene moulds were selected for the compression cube specimens in this investigation (BSI. Citation2012; BSI. Citation2013). Three specimens were made per batch, totalling twelve cubes.
3.2.2.2 Compression procedure
Concrete cubes tested in accordance with BS EN 12390–3:2019 are generally tested at 7 days and/or 28 days. All concrete specimens were cured for 28 days in this investigation to judge the fully cured and hydrated concrete compressive strength. The cubes were tested using a calibrated Autocon Digital Compression machine. Cubes were tested on the face perpendicular to the casted face to ensure a sufficiently flat surface. The compression machine was set to a load rate of 1kN/s until failure occurred to obtain the maximum failure load. The maximum compressive strength and failure mode of specimens were then recorded. It is important to note that the machine was calibrated to calculate the maximum compressive strength using Equation (1) (BSI, Citation2019a; BSI Citation2019b; BSI Citation2019c).
Where fcu is the characteristic compressive strength, P is the Load at failure, and A is the cross-sectional area.
3.2.2.3 Feasibility criteria for compression
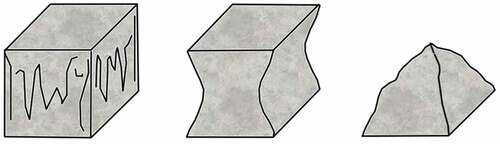
Based on the compressive strength requirement of C40 concrete being 40 N/mm2 outlined in BS EN 206:2013, batches that met or exceeded this strength were judged as feasible. Additionally, displays the three satisfactory failure modes of concrete cubes specimens. Specimens also displayed one of the failure modes outlined to be deemed feasible.
Figure 4. Satisfactory failures of cube specimens (adapted after BSI, Citation2019a; BSI Citation2019b and BS1 Citation2019c).
3.2.3 Pull-out test
3.2.3.1 Creating specimens
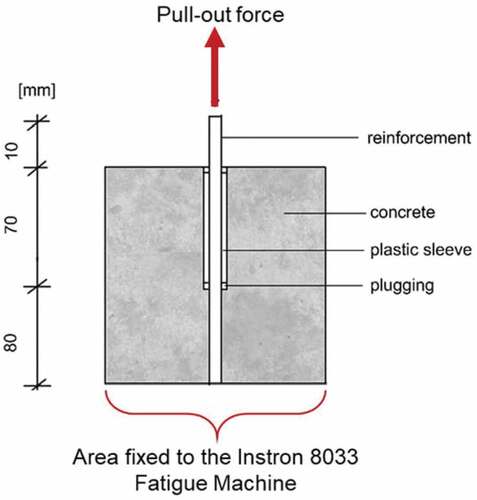
It was deemed appropriate to create and test the reinforced concrete specimens in accordance with RILEM RC: 6 specifications, due to both the ease of comparison with other research and compatibility with the testing apparatus. RILEM specification states that the minimum nominal cube size to be tested was 200x200x200mm (0.008 m3). However, this was too large for the available equipment, so 150x150x150mm (0.003 m3) moulds were chosen. The test set-up was modified to become a push-out test (as it is used to avoid localised tensile strain due to the outward motion of the bar); results are expected to be the same had a pull-out test been executed. Again, three specimens were made per batch totalling twelve cubes. Twelve concrete cube samples were prepared using a 0.003 m3 mould in accordance with ASTM C234-91a, (ASTM C234-91a. Standard Test Method for Comparing Concretes based on the Bond Developed with Reinforcing Steel) where a 16 mm diameter steel road was embedded into the wet concrete cubes (see ). The verticality of the reinforcement was maintained by supporting it until the concrete hardened. Whilst this represents a decrease in volume of the moulds, there would be a standard deviation decrease slightly but not significantly as the in-test variability of sets of tests in this study were constant. Care was taken to ensure as far as possible, that compaction through the depth of specimens throughout each test were uniform. The generally would give conservative values for compressive strength (Al-Sabah et al. Citation2021).
3.2.3.2 Push-out test procedure
Following the curing stage, specimens were carefully centralised in an Instron 8033 Fatigue Machine in the set-up configuration shown in the adapted push-out test set up used to determine the steel-concrete bond, based on the RILEM: RC6 pull-out test set up) (Rilem, Citation1973). The load plate was lowered to the immediate point of contact on the reinforcement bar while the test commenced at a displacement rate of 0.03 mm/s until failure. The recorded load at failure was used in Equation (2) to determine the steel-concrete bond strength of the specimens according to Rilem (Citation1992);
Figure 5. Modified Test Set Up: Push-Out Test, illustrating the adapted push-out test set up used to determine the steel-concrete bond, based on the RILEM: RC6 pull-out test set up (Rilem, Citation1973).
Where is the bond strength; P is the Load at failure; ϕ is steel bar diameter and Ld is the embedment length of steel bar.
3.2.3.3 Feasibility criteria for steel-concrete bond
A variety of researchers have proposed equations that predict the steel-concrete bond based on experimental data. The expressions are based on a variety of different parameters. These were used to judge the feasibility of the concrete specimens by comparing experimental data with predicted data. Below is a brief explanation of these. AS 3600 (SA (Standards Australia) Citation1994) proposed the following formula:
Cmin and Cmax are the minimum and maximum slippage (Bošnjak, Sharma, and Bessert Citation2017). The rebar at the edge (clear cover to closer edge can be taken as Cmin ≈ 24 mm and clear cover to other edge, Cmax ≈ 72 mm).
MC2010 (CEB-FIP (Comité Euro-International du Béton and Fédération International de la Précontrainte) Citation2012) and CEB-FIP Report (Citation2000) proposed two formulas, based on the failure mode of the sample:
For pull-out failure:
For splitting failure:
Al-Jahdali, Wafa, and Shihata (Citation1994) proposed the following formula:
Darwin et al. (Citation1992) proposed the following formula:
Orangun, Jirsa, and Breen (Citation1977) proposed the following formula
These equations were used to judge the feasibility of the test sample’s steel-concrete bond. Experimental outputs meeting the following criteria were deemed as feasible:
a maximum reduction in bond strength of 10% from the control specimens, as deemed fit by Siempu and Pancharthi (Citation2017);
the maximum predicted bond strength based on the experimental compressive strength;
and the bond strength is based on a minimum concrete compressive strength of 40MPa
4 Result and discussion
4.1 Workability of waste plastics in pavements
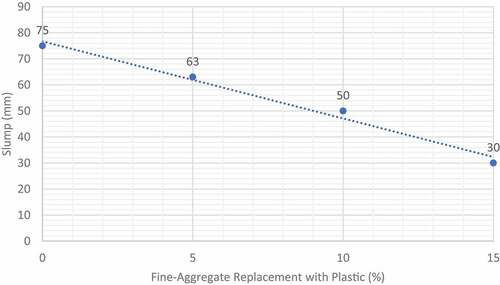
shows the slump values of each batch. The slump height in mm recorded for the 0%, 5%, 10% and 15% batches based on this research investigation. From the slump test performed, it can be seen that as the percentage of plastic used in the concrete mix increases, the workability of the concrete decreases. This phenomenon could be due to the characteristic properties of plastic discussed in the literature research. For example, da Costa et al. (Citation2016) stated that plastics have many desirable characteristics, one of which is resistance to water, also known as hydrophobia. Particularly in concrete, this seems like a desirable characteristic that may aid the resistance of concrete to weathering. . Water is dosed in certain amounts and this volume is retained in the mix. Less water was absorbed in the mixture. Bleeding would occur as a result of less water available in the mix, resulting in less workable concrete. Although it probably wets the surface of the plastic waste particles to a lesser extent. For our cases, the same amount of water content was used in all mixes. Bleeding was not observed in the specimens (the amount of water that was not absorbed, rising to the surfaces). If the mixture was uptaking water, then there would have to be a surplus of water accumulating somewhere (outside the mixture), which is certainly not the case in this study. However, this water resistance caused less water uptake as increased percentages of plastic were used. As a result, it was observed that the wet concrete mix became drier, and workability decreased concurrently.
Figure 6. Slump Measurement of Batches (Illustrating the slump height in mm recorded for the 0%, 5%, 10% and 15% batches in this investigation.).
4.2 Compressive strength
It was also observed that the compressive strength decreases as the percentage of plastic increases. shows the individual compressive strength of specimens used to calculate the average compressive strength of each batch shown in . shows the recorded compressive strength in MPa of all 12 cube test specimens in this investigation and illustrates the mean compressive strength in MPa for the 0%, 5%, 10% and 15% batches in this investigation, calculated using the data stemmed from .
Figure 7. Compressive Strength of All Test Specimens (the recorded compressive strength in MPa of all 12 cube test specimens in this investigation.).
Figure 8. Average Compressive Strength of Each Batch - (the average compressive strength in MPa for the 0%, 5%, 10% and 15% batches in this investigation, calculated using the data in Figure 8.).
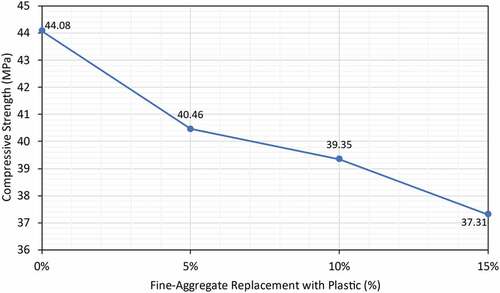
From the compression test performed, it can be observed that increasing percentages of plastic aggregate decreases the compressive strength of concrete. Unlike the results observed on concrete workability, there are a variety of reasons why plastic may reduce the strength of concrete. Previous studies by Kumar and Kumar (Citation2016) stated that plastic has low bonding properties, resulting in reduced compressive strength and also agreed upon by other researchers. Sule, Emmanuel, and Joseph et al. (Citation2017) andGurmel at al. (Citation2015) concluded in their research that the reason for a reduction in the compressive strength of concrete with plastic aggregates or admixtures is a result of low adhesion of plastics. This resulted in weaker bonds between the plastic particulates, aggregates, and the cement paste. Moreover, Alqahtani et al. (Citation2017) state that hydrophobia also contributes to creating a wall effect between the plastic and concrete, resulting in delamination. As such, bonding is reduced, so compressive strength is also reduced. This observation is consistent with other researchers; Kou et al. (Citation2009) and Ismail and AL-Hashmi (Citation2008). Delamination was observed in this investigation following the compression procedure, which is shown in (magnified image of a 15 % cube sample following failure).
4.3 Steel-concrete bond
illustrates the maximum push-put force in kN of the 12 test specimens created according to the test set up outlined in . shows the maximum bond strength in MPa for all 12 specimens, calculated using equation 2 and data from . The maximum push-out force for each sample were used in calculating the bond strength. The 0% sample 1 was ignored as it was an anomaly from the study. As per RILEM RC: 6 testing procedure, it was observed that increasing percentages of plastic results in a lower maximum push-out force and, therefore, a lower steel-concrete bond strength (Mendis and French, Citation2000). Like the reasoning for reduced compressive strength, this trend can be attributed to plastic having low adhesion to the concrete mix. In addition, hydrophobia also contributed to delamination, which allowed failure planes to develop (Alqahtani et al. Citation2017). shows the interface between the reinforcement bar and the concrete for a 10% sample after failure. The image shows a significant increase in abnormalities in the structure of the concrete and an increase in voids and air pockets compared to the control in (the interface between the steel reinforcement and the concrete specimen for a 0% push-out sample after failure). This increase in voids gives a starting point for cracks to form, causing failure. Moreover, the increased number of voids reduces the contact area between the reinforcement and the concrete, decreasing the bonded area.
Figure 9. Magnified Image of Plastic Particle Delamination (x10), showing the magnified picture of the delamination between the plastic aggregate and the concrete after failure.
shows a x10 magnified image of the delamination between the plastic aggregate and the concrete after failure. Additionally, PMME plastic is a hard but brittle material. As a result, plastic particles at the interface between the reinforcement and concrete were crushed, as shown in -the interface between the steel reinforcement and the concrete specimen for a 10% push-out sample after failure, where crushing of a plastic aggregate particle can be observed which contributed to a decrease in the push-out force. Following the crushing of the particle, mechanical interlocking was reduced. Osifala, Salau, and Adeniyi (Citation2015) found that RILEM specimens with the addition of plastic shreds failed by slipping, and RILEM specimens without the addition of plastic failed by splitting. All concrete specimens failed by splitting in this study, as shown in , the splitting failure mode of all 12 test specimens after failure following the push-out testing. This suggests that failing by splitting, the specimens in this study had a much greater bond.
Figure 10. Maximum Push-Out Force of Test Specimens.
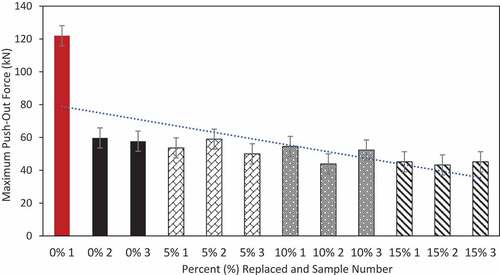
Figure 11. Maximum Bond Strength of Test Specimens.
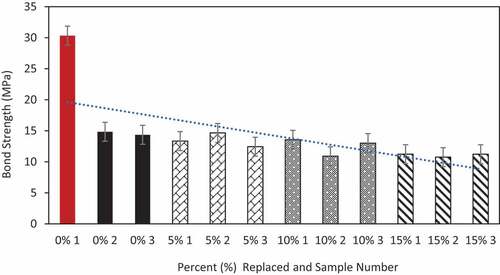
Figure 12. Steel-Concrete Interface After Failure (10% Replacement), illustrating the interface between the steel reinforcement and the concrete specimen for a 10% push-out sample after failure.
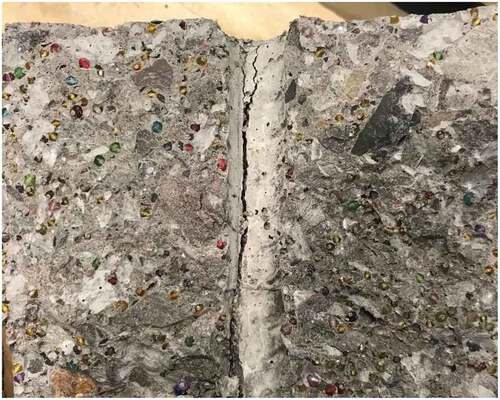
Figure 13. Steel-Concrete Interface After Failure (0% Replacement), illustrating the interface between the steel reinforcement and the concrete specimen for a 0% push-out sample after failure.
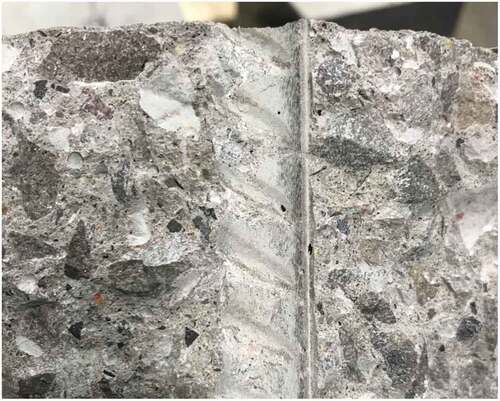
Figure 14. Crushing of Plastic Aggregate at Steel-Concrete Interface. Illustrating the interface between the steel reinforcement and the concrete specimen for a 10% push-out sample after failure, where crushing of a plastic aggregate particle can be observed which contributed to a decrease in the push-out force.
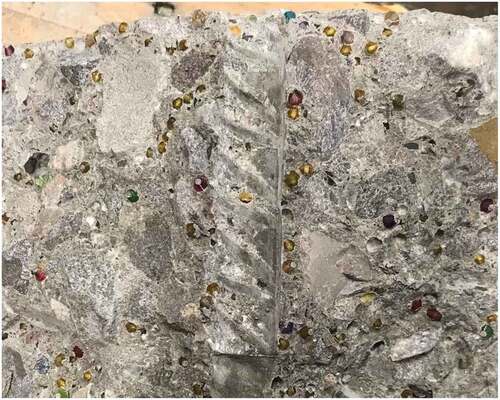
Figure 15. Splitting Failure Displayed by All Reinforced Concrete Pavement Test Specimens, showing the splitting failure mode of all 12 test specimens after failure following the push-out testing.
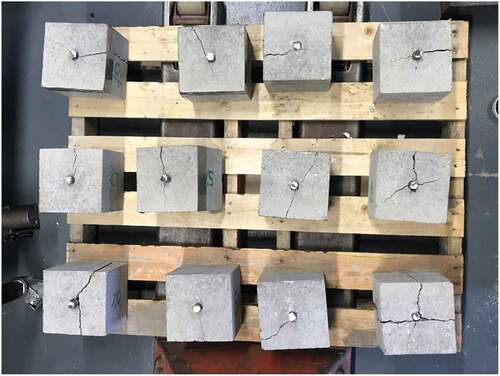
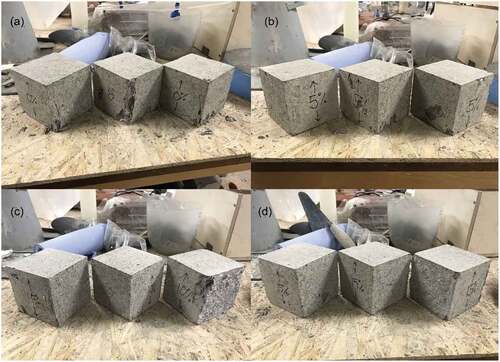
Figure 16. Compression Pavement and Cube Failures for: (a) 0%; (b) 5%; (c) 10%; (d) 15%, illustrating the failure modes of the 3 test specimens for the 0%, 5%, 10% and 15% batches; cracking is observed to be approximately equal for all exposed faces which is considered to be satisfactory.
5 Feasibility of waste plastics within pavement structures
5.1 Workability
Though it was observed that concrete workability decreased with increasing percentages of plastic used, 5% and 10% specimens fell within the permissible limits of Slump Class 2 outlined in BS EN 206:2013 – shown in . Therefore, the slump data was determined from the slump tests and whether the values have met the feasibility criteria outlined in the materials and methods section.
Table 6. Assessment of Slump Requirement.
Additionally, all batches slump failure modes were satisfactory, displaying true failure and therefore, these are acceptable.
5.2 Compressive strength
Despite the trend of decreasing compressive strength with increasing plastic additions, the average compressive strength of the 5% plastic aggregate batch was above the minimum strength requirement of 40MPa of the C40 concrete, shown in . These average compressive strength data determined from the compression tests and whether the values have met the feasibility criteria outlined in the materials and methods section are presented in .
Table 7. Assessment of Compression Requirement.
Additionally, all sample failure modes were satisfactory, with all four exposed faces cracked approximately equally, with little damage to the faces in contact with the load platens. These failures can be seen in , showing the failure modes of the 3 test specimens for the 0%, 5%, 10% and 15% batches; cracking is observed to be approximately equal for all exposed faces which is considered to be satisfactory. On the other hand, because of the variability of the concrete results for which the target strength must exceed the grade by a margin that depends on a standard deviation, in the absence of detailed statistical analysis, the study also used a margin of 13 MPa. Selecting 40 MPa as the target strength and not the grade an average difference of the grade equates to 27 MPs, indicating that all specimens have achieved this target.
5.3 Steel-concrete bond
Bond Requirement 1
displays the percentage reduction of the average bond strength of each batch from the control. Looking at the table, the only batch that is within 10% is the 5% plastic specimens. These mean bond strength values and the reduction in the bond strength of each batch as a percentage of the control batch. Specimens with a percentage reduction of 10% or less were deemed feasible ().
Table 8. Assessment of Bond Requirement 1.
Bond Requirement 2
shows the predicted bond strength of each batch based on their compressive strength, using equations outlined in the methodology. The table shows that the only batch with plastic to surpass its maximum predicted bond strength is the 5% batch. Calculation (4) was ignored as this prediction was for pull-out failure, which was not observed. As presented in is the comparison between experimental bond strengths and predicted bond strengths, the predicted bond strengths are calculated using the average experimental compressive strength determined from compression testing in equations 3–8. Experimental bond strengths greater than the highest predicted bond strength were deemed feasible.
Table 9. Assessment of Bond Requirement 2 Based on its Compressive Strength.
Bond Requirement 3
presents the minimum bond strength requirements based on a compressive strength of 40MPa. The table shows that the only batch to surpass the minimum calculated requirement is the 5% batch. Calculation (4) was again ignored. As displayed in , the comparison between experimental bond strengths and predicted bond strengths; with the expected bond strengths calculated using the 40MPa requirement of the design mix in equations 3–8. Once more, experimental bond strengths greater than the highest predicted bond strength were deemed feasible (Mendis and French, Citation2000).
Table 10. Assessment of Bond Requirement 3 Based on 40MPa Requirement.
5.4 Critical analysis of outputs
shows that based on the experimental outputs, it can be concluded that a 5% replacement of fines with waste plastic is the most feasible after passing all criteria. The research replicates all the conditions that reinforced concrete pavements (RCPs) faces. Therefore, it can be concluded that this application in RCP scenarios merely is a feasible approach to the percentages of waste plastics that can be utilised in such structures. As presented in summary of the experimental batches tested and whether or not these specimens met the feasibility criteria outlined for the pavement specimens workability, compressive strength and bond strength outlined in this paper.
Table 11. Summary of All Requirements.
6 Conclusions and outlook
Using plastic as a fine aggregate replacement shows that increasing percentages used reduces workability, compressive strength, and steel-concrete bond in higher strength, reinforced concrete. Despite this, comparing experimental results against criteria for workability, compression and bond strength showed that a replacement of fine aggregates with 5% of plastic by weight was the most feasible after passing all requirements outlined. This has the potential to save approximately 410 million tonnes of conventional fine aggregate use yearly across the world while providing a waste management solution for 6.3% of global annual plastic waste. The project presents opportunities to save the bulk mass of waste plastics being conveyed to landfills, combusted/burnt, or finding their way into the natural environment and related ecosystems. This effort would allow 6.3% of global annual plastic waste to be used as a material resource rather than an environmental burden. Hence, the outputs of this paper demonstrate an essential concept for waste plastic management and an alternative to conventional fine aggregates.
Finally, replacing 10% of fines with waste plastic aggregate had a compressive strength of only 1.63% below the 40MPa requirement. In addition, failure modes for slump and compression testing were satisfactory, suggesting that this percentage may be feasible in non-primary structures such as roads, pavements, and facades.
6.1 Future research
Increasing the percentage of plastic waste as fine aggregate in concrete production requires further investigations. Due to constraints with procuring waste plastic, this study focussed on the use of PMME plastic specifically, and therefore the use of other waste plastics should be investigated. Additionally, it would be beneficial to investigate the microstructure, tensile and bending strength, corrosion, and fire performance to give a more encompassing assessment. Sustainable methods of controlling the particle size distribution of waste plastics would be environmentally beneficial as changes to the concrete’s compressive strengths can be minimised. Therefore, future investigations should implement sieving analysis. Analysing the effect on cost may also be beneficial, demonstrating the environmental benefits and the economic benefits to construction stakeholders. Finally, after determining other strength parameters, FEA modelling may be beneficial in assessing structural performance in a simulated environment.
Notations
∅bar diameter (mm)
Aarea of testing face (mm2)
Cmaxmaximum concrete cover (mm)
Cminminimum concrete cover (mm)
fcucompressive strength (N/mm2)
Ld embedment length of bar (mm)
P load at failure (N)
bond strength (N/mm2)
PETPolyethylene terephthalate
PPPolypropylene
PCPolycarbonate
POMPolyoxymethylene
ABSAcrylonitrile butadiene styrene
PMMEPoly(methyl methacrylate)
Acknowledgments
The authors would like to thank the following individuals within the Civil and Environmental Engineering Cluster, University of the West of England, Bristol (UWE Bristol): Dr. Andy Geary (Senior Environmental Engineering Technician), Mr Atul Vadgama, Engineering Technician, and Daniel Cole, Structural Engineering Technician, for their assistance with material procurement and testing.
Disclosure statement
All authors have seen and agree with the contents of the manuscript and there is no conflicts of interest to declare.
Additional information
Notes on contributors
Kiran Tota-Maharaj
Dr. Kiran Tota-Maharaj is an Associate Dean for External Engagement and a Reader in Civil and Environmental Engineering within the School of Infrastructure and Sustainable Engineering, College of Engineering and Physical Sciences, Aston University Birmingham, England, UK. Dr. Tota-Maharaj graduated with his bachelor’s in mechanical engineering from the University of the West Indies, his Masters in Environmental Engineering from Newcastle University, UK and his doctorate in Civil and Environmental Engineering from the University of Edinburgh, Scotland UK. Dr Tota-Maharaj is a Chartered Engineer (CEng) and a corporate member of the Institution of Mechanical Engineers (MIMechE), a Fellow of the Institution of Civil Engineers (FICE) a Fellow of the Institute of Water (FIWATER), a Registered Engineer (REng) with the Board of Engineers for Trinidad and Tobago (BOETT) a member of the American Society of Civil Engineers (M.ASCE), a member of The International Association for Hydro-Environment Engineering and Research (IAHR) and a fellow of the Higher Education Academy, UK.
Blessing Oluwaseun Adeleke
Dr. Blessing Adeleke is a Chartered Engineer (CEng) and a member of the Institution of Civil Engineers (MICE) with several years of professional engineering practice. Dr. Adeleke graduated with a BSc (Hons), MSc and PhD in Civil Engineering from the University of South Wales, a PGCert in Education from the University of Essex and a Fellow of Higher education (FHEA). Currently, he is a Lecturer in Civil Engineering at the University of South Wales, UK and is actively involved in undergraduate teaching, postgraduate lecturing, and PhD supervision. Dr. Adeleke’s specialist teaching areas include: Professional Engineering, Engineering Surveying, Advanced Civil Engineering Materials, Low Carbon Technologies and Construction Materials. Dr. Adeleke's research expertise focuses on sustainable construction material technology, developing low carbon materials and encapsulating industrial waste for applications in soils, mortar and concrete and research interests include construction materials, civil engineering materials, structural analysis, soil-structure interaction, Finite Element Modelling, Concrete Material Technology and Construction Engineering.
Ghassan Nounu
Dr. Ghassan Nounu FHEA MIET is a Senior Lecturer in Structural Engineering and the Programme Leader for the MSc in Civil Engineering at University of the West of England, Bristol (UWE Bristol). Dr Nounu was awarded a BSc(Hons) in Civil Engineering from King Saud University (Saudi Arabia) in 1980, and PhD in Civil engineering from the University of Glasgow, Scotland, UK in 1985 and was a postdoctoral research fellow at London South Bank University, England UK focusing on Finite Element Modelling of reinforced concrete repaired beams from 1985-1987. He has a strong and established academic research and teaching profile with extensive experience in Structural Engineering, Structural Analysis and Design for more than 35 years. His areas of expertise includes: Structural analysis and design; Reinforced Concrete Repairs; Non-destructive testing of concrete; Sustainable Concrete and Finite Elements Analysis of Reinforced Concrete. Dr. Nounu has won several academic awards for exemplary academic performance, lecturing and teaching skills at UWE Bristol.
References
- Al-Jahdali, F. A., F. F. Wafa, and S. A. Shihata. 1994. “Development Length for Straight Deformed Bars in High-Strength Concrete.” ACI Symposium Publication 149 (1): 507–522.
- Al-Sabah, S., S. Sourav, and C. McNally. 2021. “The post-installed Screw pull-out Test: Development of a Method for Assessing in-situ Concrete Compressive Strength.” Journal of Building Engineering 33: 101658. doi:10.1016/j.jobe.2020.101658.
- Ali, H., and I. Wahab. 2017. “Microbial Degradation of Plastic: A Short Study.” RADS Journal of Biological Research & Applied Science 8 (1): 32–36.
- Alqahtani, F. K., G. Ghataora, M. I. Khan, and S. Dirar. 2017. “Novel Lightweight Concrete Containing Manufactured Plastic Aggregate.” Construction and Building Materials 148 (1): 386–397. doi:10.1016/j.conbuildmat.2017.05.011.
- Andrady, A. L., and M. A. Neal. 2009. “Applications and Societal Benefits of Plastics.” Philosophical Transactions of the Royal Society B: Biological Sciences 364 (1526): 1977–1984. ASTM C234-91a. Standard Test Method for Comparing Concretes on the Basis of the Bond Developed with Reinforcing Steel 10.1098/rstb.2008.0304.
- Babafemi, A. J., B. Šavija, S. C. Paul, and V. Anggraini. 2018. “Engineering Properties of Concrete with Waste Recycled Plastic: A Review.” Sustainability (Switzerland) 10 (11): 3875–3900. doi:10.3390/su10113875.
- Bošnjak, J., A. Sharma, and S. Bessert, 2017. “Bond Performance of Reinforcement in Concrete after Exposure to Elevated Temperatures.” In 3rd International Symposium on Connections between Steel and Concrete, Stuttgart, Germany.
- Braungart, M., and W. McDonough. 2002. Cradle to Cradle: Remaking the Way We Make Things. New York: North Point Press.
- BRMCA (British Ready-Mixed Concrete Association) (2011). “Get the Right Concrete on Site.” See https://www.brmca.org.uk/documents/Get_the_Right_Quality_on_Site_23_Jun_11.pdf (accessed 01 April 2020).
- BSI (2002a). “BS EN 1008:2002. Mixing Water for Concrete. Specification for Sampling, Testing and Assessing the Suitability of Water, Including Water Recovered from Processes in the Concrete Industry, as Mixing Water for Concrete.” BSI, London, UK.
- BSI. 2002b. BS EN 12620:2002. Aggregates for Concrete. London, UK: BSI.
- BSI. 2011. BS EN 197-1:2011. Cement. Part 1: Cement. Composition, Specifications and Conformity Criteria for Common Cements. London, UK: BSI.
- BSI. 2012. BS EN 12390-1:2012. Testing Hardened Concrete. Part 1: Shape, Dimensions and Other Requirements for Specimens and Moulds. London, UK: BSI.
- BSI. 2013. BS EN 206:2013. Concrete - Specification, Performance, Production and Conformity. London, UK: BSI.
- BSI. 2019a. BS EN 12350-2:2019. Testing Fresh Concrete. London, UK: Slump-test. BSI.
- BSI. 2019b. BS EN 12390-2:2019. Testing Hardened Concrete. Part 2: Making and Curing Specimens for Strength Tests. London, UK: BSI.
- BSI. 2019c. BS EN 12390-3:2019. Testing Hardened Concrete. Part 3: Compressive Strength of Test Specimens. London, UK: BSI.
- CEB-FIP (Comité Euro-International du Béton and Fédération International de la Précontrainte). 2012. Model Code 2010 – Final Draft. Vol. 1. London, UK: Thomas Telford.
- CEB-FIP Report. 2000. “Bond of Reinforcement in Concrete: State of the Art.” FIB Bulletin 10: 434. doi:10.1680/macr.11.00091.
- da Costa, J. P., P. S. M. Santos, A. C. Duarte, and T. Rocha-Santos. 2016. “(Nano)plastics in the Environment – Sources, Fates and Effects.” Science of the Total Environment 566-567 (1): 15–26. doi:10.1016/j.scitotenv.2016.05.041.
- Darwin, D., S. L. McCabe, E. K. Idun, and S. P. Schoenekase. 1992. “Development Length Criteria: Bars Not Confined by Transverse Reinforcement.” ACI Structural Journal 89 (6): 709–720.
- Das, S., M. T. Alam, and I. Chowdhury (2019). “Utilization of Plastic Waste in Concrete as a Partial Replacement of Fine Aggregate.” In Proceedings of 3rd International Conference on Advances in Civil Engineering (I. Islam, H. Ali, Rahman, and Haque (eds)). CUET (Chittagong University of Engineering and Technology), Chittagong, Bangladesh, pp. 585–590.
- Designer Data (2015). “Thermo Plastics”. See https://designerdata.nl/materials/plastics/thermo-plastics accessed 17 April 2020.
- Ferrándiz-Mas, V., and E. García-Alcocel. 2013. “Durability of Expanded Polystyrene Mortars.” Construction and Building Materials 46: 175–182. doi:10.1016/j.conbuildmat.2013.04.029.
- Gagg, C. R. 2014. “Cement and Concrete as an Engineering Material: An Historic Appraisal and Case Study Analysis.” Engineering Failure Analysis 40: 114–140. doi:10.1016/j.engfailanal.2014.02.004.
- Geyer, R., J. R. Jambeck, and K. L. Law. 2017. “Production, Use, and Fate of All Plastics Ever Made.” Science Advances 3 (7): e1700782. doi:10.1126/sciadv.1700782.
- Goli, V. S. N. S., A. Mohammad, and D. N. Singh. 2020. “Application of Municipal Plastic Waste as a Manmade neo-construction Material: Issues & Wayforward.” Resources, Conservation and Recycling 161: 105008. doi:10.1016/j.resconrec.2020.105008.
- Guendouz, M., F. Debieb, O. Boukendakdji, E. H. Kadri, M. Bentchikou, and H. Soualhi. 2016. “Use of Plastic Waste in Sand Concrete.” JMES (Journal of Materials and Environmental Science) 7 (2): 382–389.
- Gurmel, G., K. M. Iqbal, D. Samir, K. Azzedine, and A. O. Mansour. 2015, November. Lightweight concrete containing recycled plastic aggregates. In 2015 International Conference on Electromechanical Control Technology and Transportation (pp. 527-533). Atlantis Press, Paris, France, pp. 527-533, doi: 10.2991/icectt-15.2015.101.
- Ismail, Z., and E. AL-Hashmi. 2008. “Use of Waste Plastic in Concrete Mixture as Aggregate Replacement.” Waste Management 28 (11): 2041–2047. doi:10.1016/j.wasman.2007.08.023.
- Jaccodine, R. J. 1963. “Surface Energy of Germanium and Silicon.” Journal of the Electrochemical Society 110 (6): 524–527. doi:10.1149/1.2425806.
- Jaivignesh, B., and A. Sofi (2017). “Study on Mechanical Properties of Concrete Using Plastic Waste as an Aggregate.” In International Conference on Civil Engineering and Infrastructural Issues in Emerging Economies (ICCIEE 2017). IOP Conference Series: Earth and Environmental Science, Thanjavur, India, vol. 80, pp. 1–7, 10.1088/1755-1315/80/1/012016.
- Jialanella, G. L. 2010. “Advances in Bonding Plastics.” In Advances in Structural Adhesive Bonding, edited by David A. Dillard, 237–264. Cambridge, UK: Woodhead Publishing.
- Kaur, G., and S. Pavia. 2020. “Physical Properties and Microstructure of Plastic Aggregate Mortars Made with acrylonitrile-butadiene-styrene (ABS), Polycarbonate (PC), Polyoxymethylene (POM) and ABS/PC Blend Waste.” Journal of Building Engineering 31: 101341. doi:10.1016/j.jobe.2020.101341.
- Kou, S. C., G. Lee, C. S. Poon, and W. L. Lai. 2009. “Properties of Lightweight Aggregate Concrete Prepared with PVC Granules Derived from Scraped PVC Pipes.” Waste Management 29 (2): 621–628. doi:10.1016/j.wasman.2008.06.014.
- Kumar, P., and G. Kumar. 2016. “Effect of Recycled Plastic Aggregates on Concrete.” International Journal of Science and Research (IJSR) 5 (6): 912–915. doi:10.21275/v5i6.NOV164227.
- Li, X., T. Ling, and K. H. Mo. 2020. “Functions and Impacts of plastic/rubber Wastes as eco-friendly Aggregate in Concrete – A Review.” Construction and Building Materials 240: 117869. doi:10.1016/j.conbuildmat.2019.117869.
- Mendis, P., and C. French. 2000. “Bond Strength of Reinforcement in high-strength Concrete FAILURE, Advanced.” Structural. Engineering 3 (3): 245–253.
- Mineral Products Association (MPA) (2016). “Long-term Aggregates Demand and Supply, 2016-30.” See https://mineralproducts.org/documents/MPA_Long_term_aggregates_demand_supply_scenariors_2016-30.pdf (accessed 17 April 2020).
- Neville, A. M. 1995. Properties of Concrete. 4th Edn ed. London, UK: Longman Group Limited.
- Orangun, C. O., J. O. Jirsa, and J. E. Breen. 1977. “Revaluation of Test Data on Development Length and Splices.” ACI Journal Proceedings 74 (3): 114–122.
- Osifala, K. B., M. A. Salau, and A. A. Adeniyi (2015). “Effect of Waste Plastic Shreds on Bond Resistance between Concrete and Steel Reinforcement.” In 2nd International Conference on Innovative Materials, Structures and Technologies. IOP Conference Series: Materials Science and Engineering, Riga, Latvia, vol. 96, pp. 1–11, 10.1088/1757-899X/96/1/012051.
- Rahmani, E., M. Dehestani, M. H. A. Beygi, H. Allahyari, and I. M. Nikbin. 2013. “On the Mechanical Properties of Concrete Containing Waste PET Particles.” Construction and Building Materials 47: 1302–1308. doi:10.1016/j.conbuildmat.2013.06.041.
- Rashad, A. M. 2016. “A Comprehensive Overview about Recycling Rubber as Fine Aggregate Replacement in Traditional Cementitious Materials.” International Journal of Sustainable Built Environment 5 (1): 46–82. doi:10.1016/j.ijsbe.2015.11.003.
- Rilem, 1973. “Rilem TC-9 RC 6: Bond Test for Reinforcing Steel: 2. Pull-out Test (7-II-128): Tentative Recommendations.” Materials and Structures 32 (6): 96–105.
- Rilem, 1992. “Rilem TC-51 AAC 8.1 Pull-out Test for Reinforcement.” Materials and Structures 32 (6): 140–141.
- Ruban, A. V., H. L. Skriver, and J. K. Nørskov. 2002. “Chapter 1 - Local Equilibrium Properties of Metallic Surface Alloys.” The Chemical Physics of Solid Surfaces 10: 1–29. doi:10.1016/S1571-0785(02)80088-8.
- SA (Standards Australia). 1994. AS 3600: Australian Standard for Concrete Structures. Sydney, Australia: Standards Australia Limited.
- Saikia, N., and J. de Brito. 2012. “Use of Plastic Waste as Aggregate in Cement Mortar and Concrete Preparation: A Review.” Construction and Building Materials 34 (1): 385–401. doi:10.1016/j.conbuildmat.2012.02.066.
- Siddique, R., J. Khatib, and I. Kaur. 2008. “Use of Recycled Plastic in Concrete: A Review.” Waste Management 28 (10): 1835–1852. doi:10.1016/j.wasman.2007.09.011.
- Siempu, R., and R. K. Pancharthi. 2017. “Bond Performance of Ribbed Steel Reinforcing Bars in Vibrated and self-compacting Concrete.” Proceedings of the Institution of Civil Engineers - Structures and Buildings 170 (6): 419–436. doi:10.1680/jstbu.16.00083.
- Silva, R. V., J. de Brito, and N. Saikia. 2013. “Influence of Curing Conditions on the durability-related Performance of Concrete Made with Selected Plastic Waste Aggregates.” Cement and Concrete Composites 35 (1): 23–31. doi:10.1016/j.cemconcomp.2012.08.017.
- Sule, J., S. Emmanuel, I. Joseph, O. Ibhadobe, B.Y. Alfred, F. I. Waziri. and E. Sunny 2017. “Use of Waste Plastics in Cement-Based Composite for Lightweight Concrete Production.” International Journal of Research in Engineering Technology 2 (5): 44–54.
- Thomas, B. S., and R. C. Gupta. 2016. “A Comprehensive Review on the Applications of Waste Tire Rubber in Cement Concrete.” Renewable and Sustainable Energy Reviews 54: 1323–1333. doi:10.1016/j.rser.2015.10.092.
- Thorneycroft, J., J. Orr, P. Savoikar, and R. J. Ball. 2018. “Performance of Structural Concrete with Recycled Plastic Waste as a Partial Replacement for Sand.” Construction and Building Materials 161: 63–69. doi:10.1016/j.conbuildmat.2017.11.127.
- Van Oss, H. G. 2015. “CEMENT.” In Mineral Commodity Summaries, edited by Usgs, 38–39. Virginia, US: U.S. Geological Survey.
- Waste and Resource Action Programme (WRAP) (2017). “The Construction Commitments: Halving Waste to Landfill. Benchmarks for Target Setting.” See http://www.sustainabilityexchange.ac.uk/files/wrap_benchmarks_for_target_setting.pdf (accessed 06 April 2020).
- Windapo, A., and O. Ogunsanmi. 2014. “Construction Sector Views of Sustainable Building Materials.” Proceedings of the Institution of Civil Engineers: Engineering Sustainability 167 (2): 64–75. doi:10.1680/ensu.13.00011.
- Wuchinich, D. 2015. “Acoustic Properties of Selected High Strength Thermosetting Plastic Composites at Ultrasonic Frequencies.” Physics Procedia 63: 208–216. doi:10.1016/j.phpro.2015.03.034.
- Zhang, C., and L. Canning. 2011. “Application of non-conventional Materials in Construction.” Proceedings of Institution of Civil Engineers: Construction Materials 164 (4): 165–172. doi:10.1680/coma.900061.