
 ?Mathematical formulae have been encoded as MathML and are displayed in this HTML version using MathJax in order to improve their display. Uncheck the box to turn MathJax off. This feature requires Javascript. Click on a formula to zoom.
ABSTRACT
In this research, the evaluation of Ghana’s wave energy potential was presented based on the ERA5 monthly averaged data on single levels from 1979 to 2020 from European Centre for Medium-Range Weather Forecast (ECMWF). The data obtained which was the Significant Wave Height and Wave Period were used to calculate the Average Wave Power and Energy. The total wave power crossing the three divisions of Ghana’s coastline has been calculated to be 7215 MW. The calculated wave energy available was compared to the Annual Energy Demand of Ghana. The calculated value gives a clear picture that wave energy can be another renewable energy source in Ghana. This was done relying on data from a third-generation spectral wave model to simulate the wave conditions which were used to analyse the potential of the wave-generated energy of the selected coastal areas in Ghana.
Introduction
The worldwide call for energy is rising speedily, since there is rapid population growth, specifically in developing countries. According to the International Energy Agency (IEA), global energy demand could increase by more than 50% by 2030 in the absence of public policies in this area (International Energy Agency Citation2011). This demand for energy across the globe has also been an emerging factor in a lot of environmental problems. Energy security concerns can arise as more users always need ever more energy resources and higher consumption of non-renewable energy sources such as fossil fuels lead to higher greenhouse gas emissions, commonly carbon dioxide (CO2), which give rise to global warming. Fossil fuels are non-renewable, unsustainable, and also pollute the environment. Burning coal, for example, releases toxic particles like sulphur dioxide and heavy metals into the atmosphere. These compounds lead to many serious side effects, such as acid rain and respiratory damage in humans. Pollutants from the burning of fossil fuels have been linked to diseases like cancer and asthma in several scientific studies. The particles released from burning fossil fuels also have negative effects on our planet as a whole. Simultaneously, the number of societies (Ghana) without access to routine electricity remains excessively high (International Energy Agency Citation2011). Therefore, there is the need to move from these conventional energy sources to renewable energy sources such as ocean wave energy which is a copious renewable resource and believes to be one of the most environmentally friendly ways to generate energy. It does not render any waste that will damage the environment. It is also believed to be one of the lowest-cost renewable energy sources (Drew, Plummer, and Sahinkaya Citation2009). The wave energy is more predictable than other forms of energy, offering a better likelihood of being dispatched to an electrical grid system, essentially always in motion and are never interrupted, it is a reliable source compared to others (Drew, Plummer, and Sahinkaya Citation2009). The Hubbert model of resource utilisation states that when it is first realised that a resource is useful, the utilisation of that resource begins slowly. This is because efficient procedures for utilising and the appropriate infrastructure has to be developed. But once the appropriate infrastructure has been developed resource utilisation increases. When the resource becomes scarce, utilisation decreases and eventually stops
As depicted in , the well-known ‘Hubbert curve’ says that the production curve of a crude oil in a free market economy is ‘bell shaped’ and symmetric (Hubbert Citation1962). According to this model, once the potential of oil is identified, it is necessary to locate its reserves, build appropriate wells, and set up a system for the transportation and its use. Oil consumption grew when these resources are created. There will be a stage when it will be challenging to find new oil resources, its utilisation will decline and it will be more demanding (Hubbert Citation1962). However, this model applies to the use of conventional energy sources such as fossil fuel but cannot be applied to the wave energy source since waves are renewable sources of energy and regenerate itself (Dunlap Citation2015).
Figure 1. Quantity of a resource used per unit time as a fraction of time (Hubbert Citation1962).
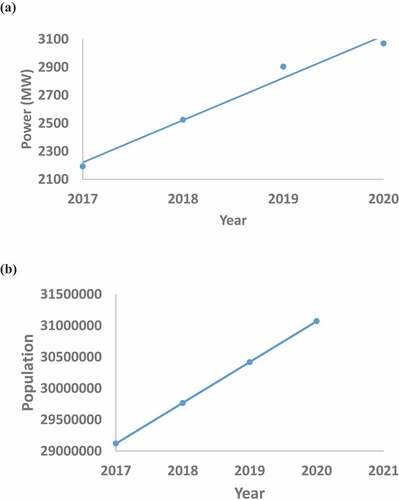
) Clearly shows that Ghana’s peak demand has grown from 2,192.5 MW in 2017 to 3,090.0 MW in 2020 at a cumulative annual average of 8.96% (Power Planning Technical Committee (PPTC) Citation2021). It can also be said that the energy consumption in Ghana will increase in the same pattern if much attention is not given to the conservation of energy by the usage of energy-saving bulbs. The population of Ghana from 2017 to 2020 has been illustrated in ) and it gives an obvious upward surge in the same direction as in the case of the power demanded in the same time frame. This increase in power can be associated with population growth in Ghana and also more Ghanaians are now using modern appliances (technological advancement gadgets) for their daily life. The increase in Ghana’s energy demand will have a serious effect on both commercial and domestic activities which calls for the drive to investigate other energy sources. Energy is a vital input to economic activities. This facility lights up our households and schools, powers economic activity to produce and consume, provide comfort and transportation, pumps water, and contributes to health and security (Energy Commission, National Energy Statistics Citation2021). Energy can be obtained from the sea either by temperature gradient or salinity or from the movement of water; that is from tides, ocean currents, or waves (Dunlap Citation2015). From these possibilities, wave energy utilisation seems to have the greatest general application. This energy is enormous, so far, not used to maximum benefit. According to IEA-OES, 2007 annual report 2007, the global annual potential energy generation of Tidal, osmotic pressure, ocean thermal gradient and wave energy are >300 TWh, 2,000 TWh, 10,000 TWh, and 8,000–80,000 TWh, respectively (Pontes Citation2007). This renewable energy source across the world and in Ghana is the dynamic evolution of sea energy. A significant characteristic of sea energy resources is their high density, the highest one among the renewables (Energy Commission, National Energy Statistics Citation2021).
Figure 2. (a) Ghana System Peak Demand (2017–2020) data from 2021 Power Planning Technical Committee (PPTC) and (b) Ghana Population (2017–2020).
Wave energy is being increasingly regarded in many countries such as Ghana as a major and likely resource for decades. For instance, in the United Kingdom in May 2010, launched a wave farm which is currently made up of 66 machines in Scotland. It was announced in 2007 and cost over 4 million pounds, equivalent to 5.9 million dollars. Off the north coast of Cornwall, England, the wave hub facility acts as a giant extension cable. It allows 20 MW to be connected to it but could go up to 40 MW. It also could end up powering up to 7,500 households and save around 300,000 tons of CO2 in the next 25 years (OpenEI, Citation2021).
Ghana’s power generation has been through several stages: beginning with isolated diesel generators and stand-alone power supply systems owned by industrial organisations such as factories, mines, and institutions like schools and hospitals to the hydro stage following the building of the hydropower, and today to a thermal complement stage powered by gas and/or light crude oil. Power challenges in Ghana have become one of the leading problems affecting the development and livelihood of people. This has also affected the country’s economic progress and transformation (Cleveland and Ayres Citation2004). The worrying rationing system, the go-slow in industrial activity, the collapse of jobs, disruptions in communication, water, and transportation, close retail businesses, grocery, stores, gas stations, ATMs, banks, and other services are noticeable indicators of what now appears to be a continuing hindrance on Ghana’s development programme. Between 2009 and 2018, transmission losses accounted for 4.1% of the total electricity transmission annually in Ghana (Energy Commission of Ghana. National Energy Statistics, 2009–2018; Energy Commission of Ghana: Accra, Ghana, 2019). Electricity losses at the distribution level were much higher between 2011 and 2018, the distribution losses for ECG and NEDCo-Ghana’s largest electricity distribution companies – averaged about 25% of the total electricity distributed (Energy Commission of Ghana. National Energy Statistics, Citation2009–2018 2019). Thus, with the economic costs of insufficient energy supply, a dependable and satisfactory supply of energy becomes even more demanding.
‘Dumsor’, as the rapid power outrages which have been doubled in Ghana, is not a new issue. The country has had periods of load shedding exercises in the past; in 1983, 1998, 2016/7, and as recently as the past years. In the few years, however, the situation has become dire. Electricity demand has seen an increase of about 52% over the last decade (from 2006 to 2016). The installed generation capacity has almost doubled within the same period. Despite this, ‘Dumsor’ still occurs on an almost daily basis (ISSER Citation2005).
The increase in installed generation capacity from 1730 MW in 2016 to 3785 MW in 2016 coupled with the fact that the highest power demand only increased by 50% shows that all hope is not lost. With little more research and deployment of more advanced and efficient technology, Dumsor can become a thing of the past. Renewable energy provides Ghana with viable options to the power problems because the country is endowed with numerous renewable energy resources particularly Ocean and Sea Wave. Developing these sources will greatly supplement the energy supply while reducing the reliance on the available power generation methods. As a result of this, a major transformation is needed in the way we produce, deliver and consume energy.
This research, therefore, aims to evaluate Ghana’s wave energy potential for its utilisation as renewable energy in Ghana, due to the long stretch of its coastline.
Methodology
Description of the study area
Ghana is one of the coastal countries in West Africa with a coastline of approximately 550 km (Boateng Citation2012) with several sandy and rocky beaches as well as lagoons and estuaries (Alves et al. Citation2020). Ghana is bordered in the west by Cote d’Ivoire and east by Togo (red border in ). In the south, Ghana shares similar regional coastal ocean conditions experienced in the coastal area of the Gulf of Guinea arm of the Atlantic Ocean (shown on the map of the study area in ). The narrow continental shelf in the region makes swell waves generated in the South Western part of the Atlantic Ocean be the predominant wave experienced in Ghana. The annual average of wave height and wave period in the region is 1.36 m and 9.6 s respectively predominantly from the S-SW direction (Almar et al. Citation2015).
Figure 3. Map of the coastal areas subdivisions of Ghana (blue boundaries) covered by the wave data.
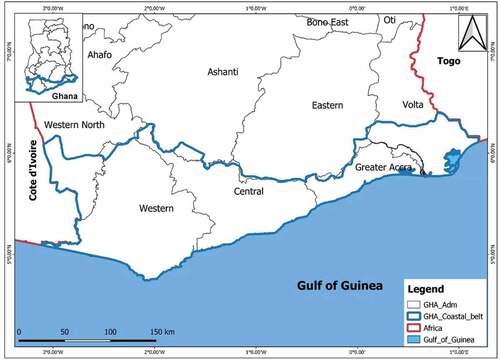
The coastline of Ghana is subdivided into three parts based on geomorphological features (Alves et al. Citation2020). They are the Eastern, Central, and Western coasts. The border between Ghana and Togo at Aflao to Prampram forms the Eastern coast and the predominantly sandy coast stretches for about 149 km (Angnuureng, Addo, and Wiafe Citation2013). The central coast which is the longest and most developed stretches for approximately 296 km between Prampram to Cape Three Points. It has both sandy and rocky beaches (Angnuureng et al. Citation2020). The Western coast lies between the entrance of the Ankobra River to the ocean and Ghana’s border with Côte d’Ivoire. illustrates a map of the coastal areas covered by the wave data used for the assessment of wave power in this study.
2.2 Wave Data
The wave data used were the ERA5 monthly averaged data on single levels from 1979 to 2020 from European Centre for Medium-Range Weather Forecast (ECMWF). This is the fifth generation ECMWF reanalysis that replaced the ERA-Interim (Hersbach et al. Citation2020). The modelling approach used in the simulation involves the use of a combination of model and observation data through data assimilation to improve model performance globally. This data has been validated against observations for different parts of the globe (Sharmar et al. Citation2021, Sharmar and Markina Citation2020). It is one of the most applied for ocean wave-related studies especially in regions such as the Gulf of Guinea where Ghana is located due to the unavailability of in-situ database with long temporal coverage for policies impacting studies.
The data were obtained from the Copernicus Climate Data Store (ECMWF Citation2021). The acquisition procedures include the selection of the option of monthly averaged reanalysis. The temporal coverage of the data was between January 1979 and December 2020. In the latest update to the ERA5 database, the temporal coverage has been extended to cover previously unavailable years covering as far back as 1959 to the present. The spatial coverage of the downloaded data is between 5E – 5 W and 9 N – 9S to cover the whole coast of Ghana as well as the coastal waters. The parameters downloaded are the significant height of combined wind waves and swell and Mean wave period. The data were extracted on a spatial resolution of 0.5° x 0.5° which is the default resolution of the wave parameters provided in this data. The data were already monthly averaged between 1979 and 2020. This was further averaged to give the yearly average for the three geomorphological zones of the coast of Ghana defined as given below:
West: Longitude = 3° West to 2° West, Latitude = 5° North to 5° South (3 grid point).
Central: Longitude = 2° West to 0°, Latitude = 5° North to 5° South (5 grid point).
East: Longitude = 0° to 1° East, Latitude = 5° North to 5° South (3 grid point).
All the points for each region were further averaged to give a single value for each wave parameter estimated. The separation into the three geomorphological zones is to properly see the west to east reduction of wave height and as a result decreasing wave energy eastward known in the Gulf of Guinea region.
2.3. Wave Power Density
Similar to what was done for the wave parameters, estimation of wave power density was done both annually and on seasonal basis. The two seasons experienced in Ghana are the dry and wet seasons. For this study, these seasons were defined as 5 months of dry season from November to March while 7 months of wet (rainy) season was defined from April to October. This is to assess the impact of seasonal variation in wave climate on the estimated wave power for the country.
The wave power density was estimated using the method used by (Osinowo, Balogun, and Eresanya Citation2018) adapted from previous works by (Gregorio and Carballo’s Citation2011) in the assessment of wave energy resources over the mid-Atlantic. The formula is given as follows:
where, is the wave power expressed in kW/m, ρ is the density of water usually taken as approximately 1025 kg/m3 for ocean water, g represents acceleration of gravity,
is the Significant Wave Height measured in metres and
is mean wave period measured in seconds. The above formula suggests that wave power is directly proportional to the wave period and to the square of the wave height. Therefore, one expects higher wave power in the region where higher waves are experienced if the wave period does not vary much. This formula was applied to each grid point in the study area.
In addition, trend analysis was done for both the wave parameters and the estimated wave power using an approach that calculates the linear trend of a data series by least squares. This was applied for every gid point, and the average is presented here in this study.
Results and Discussion
The average wave conditions of the Ghanaian coast used to estimate the annual and seasonal average of wave power potential are presented here. show spatial distribution of the annual and seasonal mean of significant wave height and mean wave period in the coast of Ghana between 1979 and 2020, respectively.
Figure 4. Spatial distribution of the mean of significant wave height in the coast of Ghana between 1979–2020 (a) annual (b) dry season (c) wet season.
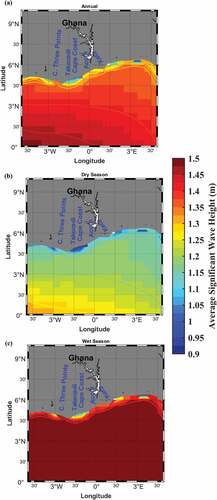
The spatial coverage of the map was made to include some parts of the neighbouring countries (Cote d’Ivoire in the west and Togo in the east) to give clearer and less pixelated image due to the spatial resolution of the data. However, the data used for the analysis of wave power were strictly covering the Ghanaian coast between 3° West and 1° East as previously highlighted. To increase the confidence in the estimation of wave power results produced using these wave parameters, it was checked for agreement with previously known wave condition in the Ghana coast. For example, the average value of 1.39 m was reported for the wave height and 10.91 s for mean wave period in the coast of Ghana by (Xorse Citation2013). Similarly, the seasonal variations also confirm lower values of wave height and wave period in the dry season. More recent studies including (Jayson-Quashigah et al. Citation2019,24; Addo Citation2018) all reported values similar to those found here for different parts of the Ghanaian coast. These values have been projected to experience significant increase before the end of the century in 2100 in a recent study by Dahunsi et al. (Citation2022). This increase in wave climate is expected to also contribute to the future potential of ocean wave power generation in the Ghanaian coastal water.
The results presented in show the temporal trend of the wave height and wave period between 1979 and 2020, respectively.
Figure 5. The substantial wave height/m in an average year corresponding to the various coast across Ghana (a) annual (b) dry season (c) wet season.
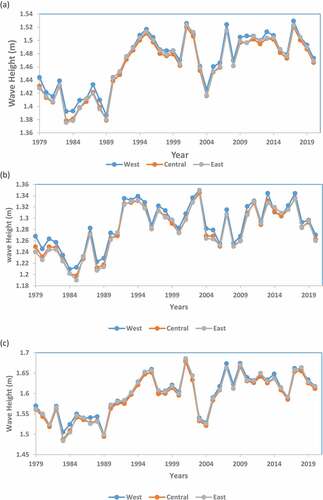
Figure 6. Spatial distribution of the mean wave period in the coast of Ghana between1979-2020 (a) annual (b) dry season (c) wet season.
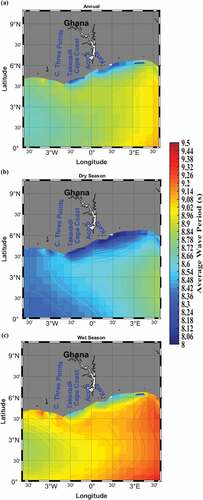
Figure 7. Illustration of mean wave periods (s) in an average year corresponding to the various coast across Ghana (a) annual (b) dry season (c) wet season.
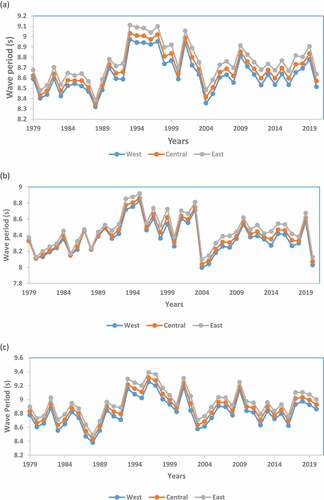
A close observation shows that, on average, the wave height is higher in the western coast which agrees with the general west to east decrease of wave height in the Gulf of Guinea (Osinowo, Balogun, and Eresanya Citation2018). To quantify the rates of changes in these wave parameters, the linear trend values presented in were estimated. This shows that both wave height and wave period have been experiencing increase over the years covered in this study. This is expected to also lead to more energetic waves, thereby, higher wave power. This result also agrees with the reported increase in these wave parameters resulting from impacts of climate change in the West African coastal area. When the spatial variation of the rates in is considered, it can be seen that, both on annual and seasonal basis, the eastern coast has been experiencing higher increase in the wave height. This same observation is seen for the rates of change of wave period presented in .
Table 1. Rate of change per year of Significant Wave Height (m) in the three subdivisions of the Ghanaian coast between 1979 and 2020.
Table 2. Rate of change per year of Mean Wave Period(s) in the three subdivisions of the Ghanaian coast between 1979 and 2020.
The spatial and temporal variations seen in the previously presented wave parameters are also seen in the estimated wave power density. This is not surprising since the formula already suggested a direct relationship between wave power and these parameters. This can be confirmed from the results presented in as well as the trend values shown in .
Figure 8. Spatial distribution of the annual wave power on the coast of Ghana estimated as an average between 1979–2020 (a) annual (b) dry season (c) wet season.
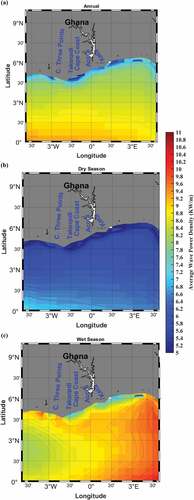
Table 3. Rate of change per year of Wave Power Density (kW/m) in the three subdivisions of the Ghanaian coast between 1979 and 2020.
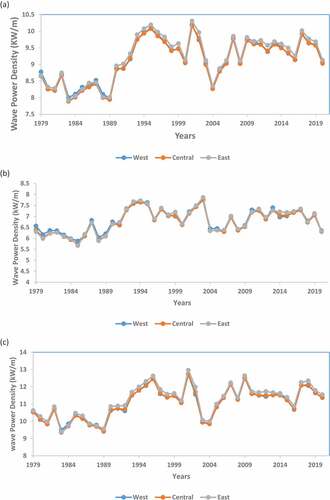
Generally, on average, the wave power density showed variations between 7.5 and 10.5 kW/m on annual basis () but lower values between 5.5 and 8.0 kW/m in the dry season () when the wave energy is low. The highest values of up to 13 kW/m are recorded in the rainy season () when the wave energy is at its peak in the Ghanaian coast. Similarly, shows that higher rates of increasing wave power are experienced in the eastern parts. Therefore, it is not surprising that the graphs in showed that higher wave power are experienced in the eastern coast which can be linked to the continuous higher increasing trend.
Figure 9. Illustration of mean wave power (KW/m) in an average year corresponding to the various coast across Ghana (a) annual (b) dry season (c) wet season.
shows that the maximum average power density that can be extracted from the coastline of Ghana is 13 kW/m. The coastline of Ghana 555 km of coastline and is an area identified with some of the world’s best wave power potential across its coastline. The total wave power crossing three coasts has been calculated to be 7215 MW which is greater than the 2021 estimated total power (3,303.72 MW) requirement of Ghana (Power Planning Technical Committee (PPTC) Citation2021). Although Ghana has a Dam used to harness hydroelectricity power. One drawback however is the extremely hot temperatures, which can result in high evaporation rates (Power Planning Technical Committee (PPTC) Citation2021). Hydro Generation has been projected to give a total annual hydro generation of 7,001.2 GWh in 2021, which is made up of 5,650 GWh from Akosombo GS, 850 GWh from Kpong GS. The projected total annual hydro generation from Akosombo and Kpong is 6,500 GWh. The headwater level at Bui GS is critically low. The projected energy to be generated from Bui GS is 501.2 GWh. The total thermal energy generation in 2021 has also been estimated to be 14,111.97 GWh. A total of US$ 758.8 M is required for thermal fuel purchase in 2021. This comprises US$ 753.33 M for Gas and US$ 5.48 M for HFO. A total of 152.34 GWh of electrical energy is expected from Renewable Energy sources in 2021. The renewable energy sources will include the grid-connected solar RE farm at Bui, the embedded BXC and Meinergy solar plants, and VRA’s facilities at Navrongo and Lawra/Kaleo (Cleveland and Ayres Citation2004). While Ghana is harnessing hydropower without much hesitation, its wave power industry still has not taken flight, with none of its wave facilities being set up. Although Ghana is harnessing energy from various sources mentioned earlier but , gives a clear picture of the necessity to bring in other sources of energy needed to meet the estimated demand with adequate reserve margin as required for reliability. The calculated wave energy has now exposed Ghana to its potential for wave energy applications. Therefore, Ghana with 555 km of coastline will be feasible to make use of its abundant wave resources to generate meaningful levels of electricity.
The ultimate part of the commercialisation of any energy technology must consider economics as a major factor in determining its viability (Dunlap Citation2015). Installation of a new energy facility requires long-term financial viability. The cost per kilowatt-hour (kWh) of electricity produced from wave power is given as;
where is the cost per kilowatt-hour for wave power,
is the operating and maintenance cost per kilowatt hour, I is the total capital installation cost, R is the total maximum capacity (kW), F is the capacity factor and CRF is the capital recovery factor.
where i is the annual interest rate expressed as a fraction, T is the payback period
The contribution to the cost per kilowatt-hour of generated power from the capital recovery term is given by;
where I is the installation cost, i designates the annual interest rate, T represents payback period which is normally estimated to be 15 years, R signifies the total maximum capacity in (kW), and f means the capacity factor. Knowing the installation cost, the annual interest rate, the total maximum capacity, and the capacity factor the capital recovery cost can be calculated.
Possible Devices for Extracting Wave Energy
There exist wide variety of the devices used to extract energy from ocean waves and they can be located onshore, where they obtain energy from breaking waves, or they can be offshore and extract energy from wave as they propagate in the ocean. These are some of the popular devices for wave energy extraction as follows: Wave-Focusing Devices, Oscillating Water Columns and Floats and Pitching Devices. Based on the fact that Ghana is a middle lower income country our chose of the wave energy devices would be conducted solely on devices with; affordable prices, good durability and robust in nature. Since there is a global attention towards sustainable energy generation, there is the necessity to develop novel and innovative solutions in this direction of coming out with sustainable devices for the extraction of wave power every day throughout the world by researchers. Herein, new conceptual design of wave energy devices that are robust has been made by researchers by considering its cost-effective nature. Finally, Ocean wave power has enormous potential as a renewable energy source and should be exploited appropriately using cost-effective, weatherproof and robust devices (Fadaeenejad et al. Citation2014,27; Prasad et al. Citation2022).
Conclusion
From the study, it has been proven that the utilisation of Wave Energy is an attractive power source as it is renewable, unpolluted, sustainable, and resourceful and it is considered a key feature of development especially in developing countries like Ghana. Hydropower which gives Ghana a significant amount of power has several setbacks. Environmental hazards and climate changes diminish the prospects for hydropower, which is mainly seen in the reduced water levels due to increased reservoir evaporation and droughts. This means that a power crisis is inevitable should water levels go down. There is a need for the Ghana energy commission to focus on alternative renewable energy such as the efficient use of wave energy. As depicted in , Ghana will have to expand its energy infrastructure and its installed capacity to advance supply frequency and reliability sustainably. In this research, the potential areas in the coastal areas of Ghana were investigated for wave energy extraction. Based on the ECMWF wave dataset, we have estimated that global Ghana’s gross wave power resource is about 7215 MW. This study confirms that the wave energy is much greater in the Western Region. However, all the results obtained illustrate a very high potential of Ghana’s wave energy which is future promising. Therefore, using the established procedures, the results of this research delivers the essential information for the decision-makers based on wave energy utilisation. Yet, further economic estimations are necessary to evaluate the final cost and offer extra evidence for upcoming development.
Supplemental Material
Download MS Word (13.3 KB)Acknowledgments
The authors are thankful to the University of Cape Coast, Ghana.
Disclosure statement
No potential conflict of interest was reported by the author(s).
Supplementary material
Supplemental data for this article can be accessed online at https://doi.org/10.1080/19397038.2022.2145384
Correction Statement
This article has been corrected with minor changes. These changes do not impact the academic content of the article.
Additional information
Notes on contributors
Samuel Kofi Tulashie
Samuel Kofi Tulashie is an Associate Professor at Industrial Chemistry Unit, Department of Chemistry, School of Physical Sciences, University of Cape Coast, Ghana. He acquired his PhD in Chemical and Process Engineering from the Max Planck Institute for Dynamics of Complex Technical Systems, Magdeburg, Germany in 2010. He attained his MSc degree in Chemical and Process Engineering from the Otto von Guericke University, Magdeburg, Germany in 2005. He obtained his BSc degree in Chemistry from University of Cape Coast, Ghana in 2001. His current research interests include; separation engineering, waste recycling, renewable energy, environmental remediation and process safety. Also, he is the Applied Research Coordinator at the World Bank funded project African Centre of Excellence in Coastal Resilience (ACECoR) at the Centre of Coastal Management in University of Cape Coast, Ghana.
Raphael Odai
Raphael Odai (BSc. Industrial Chemisrtry), 2020, University of Cape Coast. Raphael has already conducted studies on environmental waste management and milk production. He is an awardee of the Erasmus Mundus Joint Masters Scholarship for 2022. With this Scholarship he is currently an MSc. Student in Environmental Technology and Engineering at the University of Chemistry and Technology, Prague. He will continue this degree in IHE Delft Institute of Water Education, Netherlands and Ghent University in Belgium for the 2022/2024 academic year. He is Interested in energy issues and wastewater treatment technologies
Adeola Michael Dahunsi
Adeola Michael Dahunsi is a researcher at UNESCO International Chair in Mathematical Physics and Applications, University of Abomey Calavi, Benin Republic. Currently, his research focuses on the impacts of climate change on ocean and coastal hydrodynamics including wave and sediment. He works with models, satellites, and in-situ observation tools for ocean studies.
Sandra Atisey
Sandra Atisey (MSc. Advanced Materials and Innovative Recycling), BSc. Industrial Chemistry, 2020. University of Cape Coast, is from Ghana. Sandra’s past research was focused on waste management and coconut milk production. She is also currently an Erasmus Mundus Scholar at Universidade NOVA de Lisboa with the focus on Materials Engineering and Circular Economy.
Jacking Amenakpor
Jacking Amenakpor has a bachelor’s degree in Industrial Chemistry from University of Cape Coast, Ghana - West Africa. He has research interests in Food Science, Renewable energy and Advanced materials.
References
- Addo, K. A. 2018. “Assessing Ocean Wave Dynamics, Potential Sediment Transport, and Coastal Erosion along Accra Coast in Ghana.” Journal of Coastal Research 81 (10081): 86–91. doi:10.2112/SI81-011.1.
- Almar, R., E. Kestenare, J. Reyns, J. Jouanno, E. J. Anthony, R. Laibi, M. Hemer, Y. Du Penhoat, and R. Ranasinghe. 2015. “Response of the Bight of Benin (Gulf of Guinea, West Africa) Coastline to Anthropogenic and Natural Forcing, Part 1: Wave Climate Variability and Impacts on the Longshore Sediment Transport.” Continental Shelf Research 110: 48–59. doi:10.1016/j.csr.2015.09.020.
- Alves, B., D. B. Angnuureng, P. Morand, and R. Almar. 2020. “A Review on Coastal Erosion and Flooding Risks and Best Management Practices in West Africa: What Has Been Done and Should Be Done.” Journal of Coastal Conservation 24 (3): 38. doi:10.1007/s11852-020-00755-7.
- Angnuureng, D. B., K. A. Addo, and G. Wiafe. 2013. “Impact of Sea Defense Structures on Downdrift Coasts: The Case of Keta in Ghana.” Academia Journal of Environmental Sciences 1: 104–121.
- Angnuureng, D. B., P.-N. Jayson-Quashigah, R. Almar, T. C. Stieglitz, E. J. Anthony, D. W. Aheto, and K. A. Addo. 2020. “Application of shore-based Video and Unmanned Aerial Vehicles (Drones): Complementary Tools for Beach Studies.” Remote Sensing 12 (3): 394. doi:10.3390/rs12030394.
- Angnuureng, D. B., P.-N. Jayson-Quashigah, K. Appeaning Addo, D. W. Aheto, R. Almar, F. Bonou, and E. Brempong (2019). Quantification of the Shoreline Evolution of an Open Beach between Coastal Defenses. Coastal Sediments 2019: Proceedings of the 9th International Conference. Florida, USA: 1562–1576.
- Boateng, I. 2012. “An Application of GIS and Coastal Geomorphology for Large Scale Assessment of Coastal Erosion and Management: A Case Study of Ghana.” Journal of Coastal Conservation 16 (3): 383–397. doi:10.1007/s11852-012-0209-0.
- Cleveland, C. J., and R. U. Ayres. 2004. Encyclopedia of Energy. Amsterdam: Elsevier Academic Press.
- Copernicus, Climate Data Store (CDS). 2021. ERA5 monthly averaged data on single levels from 1959 to present.(Accessed 29 06 2021) https://cds.climate.copernicus.eu/cdsapp#!/dataset/reanalysis-era5-single-levels-monthly-means?tab=overview.
- Dahunsi, A. M., F. Bonou, O. A. Dada, and E. Baloïtcha. 2022. Spatio-Temporal Trend of Past and Future Extreme Wave Climates in the Gulf of Guinea Driven by Climate Change. Journal of Marine Science and Engineering 10(11): 1581. 10.3390/jmse10111581
- Drew, B., A. Plummer, and M. Sahinkaya, (2009). A Review of Wave Energy Converter Technology. Proceedings of The Institution of Mechanical Engineers Part A-journal of Power and Energy - PROC INST MECH ENG A-J POWER. 223. 887–902. 10.1243/09576509JPE782.
- Dunlap, R. A. 2015. Sustainable Energy. second ed. Toronto: Cengage Learning.
- Energy Commission, National Energy Statistics, Available at:https://www.energycom.gov.gh. Accessed 27 May 2021.
- Energy Commission of Ghana. National Energy Statistics, 2009–2018. 2019. Accra, Ghana: Energy Commission of Ghana.
- Fadaeenejad, M., R. Shamsipour, S. D. Rokni, and C. Gomes. 2014. “New Approaches in Harnessing Wave Energy: With Special Attention to Small Islands.” Renew. Sustain. Energy Rev 29: 345–354. doi:10.1016/j.rser.2013.08.077.
- Gregorio, I., and R. Carballo’s. 2011. “Choosing the Site for the First Wave Farm in A Region: A Case Study in the Galician Southwest (Spain).” Fuel and Energy Abstracts 36: 5525–5531. doi:10.1016/j.energy.2011.07.022.
- Hersbach, H., B. Bell, P. Berrisford, S. Hirahara, A. Horányi, J. Muñoz-Sabater, and T. Jean-Noël. 2020. “The ERA5 Global Reanalysis.” In Quarterly Journal of the Royal Meteorological Society –. Wiley Online Library; 1999–2049.
- Hubbert, M. K. 1962. “Energy Resources.” National Academy of Sciences, Publication 1000-D 57.
- International Energy Agency. 2011. Towards Green Growth, OECD Green Growth Studies. Paris, France: OECD Publishing.
- ISSER. 2005. Guide to Electric Power in Ghana. Resource Center for Energy Economics and Regulation. Legon: Institute of Statistical, Social and Economic Research, University of Ghana.
- Jayson-Quashigah, P.-N., K. A. Addo, B. Amisigo, and G. Wiafe. 2019. “Assessment of short-term Beach Sediment Change in the Volta Delta Coast in Ghana Using Data from Unmanned Aerial Vehicles (Drone).” Ocean & Coastal Management 182: 104952. doi:10.1016/j.ocecoaman.2019.104952.
- OpenEI. 2021. https://openei.org/wiki/Wave_Energy. Wave Energy | Open Energy Information. (Accessed 01 09 2021).
- Osinowo, A. A., I. A. Balogun, and E. O. Eresanya. 2018. “Assessment of Wave Energy Resource in the mid-Atlantic Based on 37-year Numerical Hindcast Data.” Modeling Earth Systems and Environment 4 (3): 935–959. doi:10.1007/s40808-018-0484-3.
- Pontes, M. T. “Implementing Agreement on Ocean Energy Systems (IEA-OES), Annual Report 2007”. International Energy Agency, Jochen Bard ISET. 2007. p. 5)
- Power Planning Technical Committee (PPTC). 2021. Electricity Supply Plan: An Outlook of the Power Supply Situation for 2021 and Highlights of Medium-Term Power Requirements. Accra, Ghana: Power Planning Technical Committee. http://energycom.gov.gh/files/2021%20Electricity%20Supply%20%20Plan_Final.pdf.
- Prasad, K. A., A. A. Chand, N. M. Kumar, S. Narayan, and K. A. Mamun. 2022. “A Critical Review of Power Take‐Off Wave Energy Technology Leading to the Conceptual Design of A Novel Wave‐Plus‐Photon Energy Harvester for Island/Coastal Communities.” Energy Needs. Sustainability 14: 2354. doi:10.3390/su14042354.
- Sharmar, V., and M. Markina (2020). Validation of Global Wind Wave Hindcasts Using ERA5, MERRA2, ERA-Interim and CFSRv2 Reanalyzes. IOP Conference Series: Earth and Environmental Science, 606, 12056.
- Sharmar, V. D., M. Y. Markina, and S. K. Gulev. 2021. “Global Ocean Wind‐wave Model Hindcasts Forced by Different Reanalyzes: A Comparative Assessment.” J. Geophys. Res. Oceans 126 (1). doi:10.1029/2020JC016710.
- Xorse, T. M. 2013. Impact of Wave Dynamics on the Coast of Ghana. University of Ghana.