
ABSTRACT
Water Quality Index (WQI) model was utilised to evaluate the physicochemical parameters of groundwater quality at the effluent discharge and administration areas of a waste treatment facility (WTF) in Shama Municipality in Ghana. Borehole water samples were collected once a week for six months and coliform bacteria were determined in the samples using Colony Forming Unit while the physicochemical parameters were analysed using instrumental and titrimetric techniques. Twenty physicochemical parameters were used in computing the WQI of groundwater. Groundwater collected I km away and within the WTF tested negative and positive for coliform bacteria respectively. WQI classified groundwater samples collected at the effluent discharge area as poor water quality type. However, groundwater collected 1 km away and at the administration area of the treatment facility was of good physicochemical quality. The levels of EC, COD, TDS, Ca2+, Mg2+and Cl− ions exceeded the WHO drinking water permissible limits. Statistically, there was no significant difference between mean levels of physicochemical parameters of groundwater at the three locations (p < 0.05). PCA revealed that weathering and dissolution of rock minerals and human-induced activities negatively affected the groundwater quality. The WTF groundwater was unsafe for use. Aquifer development and artificial recharge for sustainable development are recommended.
1.0 Introduction
Groundwater is a precious natural resource and serves as a vital water source for domestic and industrial use worldwide (Abadom and Nwankwoala Citation2018). In Ghana, groundwater is widely used as a source of drinking water in most communities (Lutterodt et al. Citation2021; Community Water & Sanitation Agency Citation2014). Groundwater quality is of great concern because it is one of the determinants of users’ good health and welfare. Kabila (Citation2010) reiterates that public health depends immensely on the quality of water used. According to Seidu and Ewusi (Citation2018), data on groundwater quality is a requirement for the efficient and sustainable management of such resources. Determining the quality of groundwater in communities that use groundwater for domestic and industrial activities is therefore necessary.
Groundwater contamination is one of the environmental issues facing most communities in developing countries including Ghana (Twinomucunguzi et al. Citation2020; Masindi and Foteinis Citation2021). Naturally, groundwater may become contaminated with elements such as magnesium, calcium, chloride, fluoride, and nitrate as it flows through sedimentary rocks and soils (Subba Rao et al. Citation2021). The extent of contamination depends on the forms and concentrations of the elements (Shigut et al. Citation2017). Nonetheless, human-induced activities such as haphazard waste disposal and discharge of poorly treated effluent water contaminate a groundwater resource, affecting its long-term sustainability (Pandey et al. Citation2020; Edokpayi, Odiyo, and Durowoju Citation2017; Akhtar et al. Citation2021). Leachate generated at waste disposal sites contains dissolved inorganic and organic solutes, which disperse into the soil and change the physicochemical properties of groundwater, causing problems for groundwater users (Nihalani, Behede, and Meeruty Citation2022; Sappa et al. Citation2013). The extent of contamination depends on the rate of contaminants transport and the repository conditions at the site as the contaminants infiltrate the soil (Vasanthi, Kaliappan, and Srinivasaraghavan Citation2008). Poor groundwater quality poses health risks and requires a lot of costs for its remediation (Kumar et al. Citation2022; Pandey et al. Citation2020). Again, it is strenuous to restore groundwater quality once it is contaminated.
Studies have shown that waste handling activities can contaminate groundwater resources (Nihalani, Behede, and Meeruty Citation2022; Igboama et al. Citation2022; Shivaraju Citation2016; Gugulothu et al. Citation2022). Vasanthi, Kaliappan, and Srinivasaraghavan (Citation2008) reported that groundwater around a waste treatment facility had high concentrations of dissolved solids, chloride, sulphate, and nitrate ions due to the seepage of leachate into the groundwater system. In a similar study, Kayode, Okagbue, and Achuka (Citation2018) reported that TDS, chloride ions, and conductivity of groundwater samples exceeded the World Health Organisation (Citation2011) drinking water guideline values. Besides, the findings of a study carried out by Ikem et al. (Citation2002) revealed that the quality status of groundwater near waste treatment areas in Nigeria was poor in terms of pH, dissolved solids, conductivity, total coliform, aluminium, and heavy metals (Cd, Cr, Fe, Pb, Ni), indicating that waste treatment activities had an impact on groundwater quality. On this premise, it is essential to investigate the quality of groundwater in a waste treatment setting like that in Shama Municipality.
The Water Quality Index (WQI) model has been utilised to evaluate the physicochemical quality status of groundwater in most countries (Saana et al. Citation2016; Armah, Luginaah, and Ason Citation2012; Yisa, Jimoh, and Oyibo Citation2012) as it provides a distinct rating to determine water quality status in a single term that helps make a decision, particularly the selection of suitable treatment method to meet concerning environmental issue (Tyagi et al. Citation2020). WQI is a reliable way of delivering information on water quality to stakeholders such as citizens, policymakers, and regulatory agencies (Gugulothu et al. Citation2022). A study carried out by Kumari and Rani (Citation2014) showed that about 74% of groundwater samples were unsafe for domestic purposes as the WQI ranged from 89.09 to 146.67. Again, Nwankwoala and Amachree (Citation2020) reported that groundwater samples collected at the Khana area in Rivers State in Nigeria had WQI values ranging from 53.55 to 103.32, denoting poor water quality for consumption. Similarly, Armah, Luginaah, and Ason (Citation2012) reported that groundwater in mining areas in Tarkwa in Ghana was not fit for drinking as WQI values of groundwater samples were high, ranging from 100.36 to 4294. The WQI value of groundwater in a waste treatment facility (WTF) in Shama Municipality in Ghana, where there is a high possibility of groundwater contamination through leachate percolation can be like the findings of the studies shown above, hence needs to be investigated.
A WTF in the Shama Municipality in the Western Region of Ghana uses groundwater obtained through boreholes for bathing, washing, and waste treatment activities. Although the groundwater is not supposed to be used for drinking purposes, the possibility for some employees drinking the groundwater is high, especially when sachet water used for drinking purposes is in limited supply. In the latter part of the year 2020, it was found that the facility’s groundwater had odour. Odour from groundwater is an indicator of contamination, which may be due to the presence of hydrogen sulphide produced from microbial activities, especially when the groundwater is contaminated with faecal matter or organic sulphides produced from the decomposition of underground deposits of suphur-containing organic matter (Sharma and Nhattacharya Citation2017). Contaminated groundwater poses a health risk to groundwater users (Lapworth et al. Citation2017). Although all waste storage treatment activities were carried out in banded impermeable areas at the waste processing facility, there is still the possibility of groundwater contamination due to infiltration of leachate and spillages, produced from leakage of waste processing tanks, poor maintenance of waste processing equipment, and poor waste handling and storage procedures. Moreover, the discharge of improperly treated effluent has the potential to carry contaminants into the groundwater system through percolation (Hubbard et al. Citation2016; Abd-elhamid et al. Citation2021).
A search of available literature did not reveal any study conducted to evaluate the quality of groundwater in the WTF in the Shama Municipality and its environs. Data on groundwater quality in the WTF in Shama Municipality is limited. This study was carried out to fill the gap. This study applied the WQI model to evaluate the physicochemical quality of groundwater at effluent discharge and administration areas of a WTF in Shama Municipality in Ghana. Specifically, the study determined the levels of physicochemical and bacteriological quality parameters of groundwater. It also assessed the physicochemical quality of groundwater at different locations in a waste treatment facility using the WQI model.
2.0 Materials and Methods
2.1 Description of the study area
2.1.1 Study location
The study was carried out in a waste treatment facility in Shama Municipality in the Western Region of Ghana. Shama Municipality (4°55ʹ12” N, 1° 44ʹ24” W) covers an area of 193.8 km2 with a population density of 587.5/km2 (Ghana Statistical Service Citation2021). The WTF treats offshore-generated waste such as drilling cuttings, oily-based mud, oily water, bilge water, chemical waste and sanitary water. Wastewater such as oily water and bilge water contains high levels of dissolved salts. The maximum levels of TDS, EC and total phosphorus in wastewater treatment effluent produced at the WTF exceeded the Ghana EPA guideline values (Safo-Adu Citation2020), suggesting that the effluent water had high levels of dissolved salts and ions. About 24 m3 of effluent water was produced daily in the facility and discharged into the environment through the facility creek. Groundwater at the WTF is used for bathing, washing, cleaning, and waste treatment activities. The waste treatment facility has two boreholes. One is in the effluent discharge area (BH2) while the other is in the administration area (BH3). Each borehole has a depth of 80 metres.
2.1.2 Topography and land use
The Municipality is a low-lying area with an elevation in most parts less than 80 metres above sea level. The topography wobbles with a mean height of about 70 metres and with the highest elevation between 150 and 200 above sea level. The Municipality is endowed with streams and rivers such as the Pra River, which plunge into the sea at Shama. The main sources of drinking water in the area are pipe-borne water, hand dug wells and borehole water.
Agriculture is the major land use in the vicinity of the WTF, followed by manufacturing industries including tiles, ceramic and cement production. About 29.0% of the population in the Municipality are engaged in agricultural activities including fishing, livestock rearing, and crop production. Common crops produced include maize, rice, cassava and plantain.
2.1.3 Climate and geology
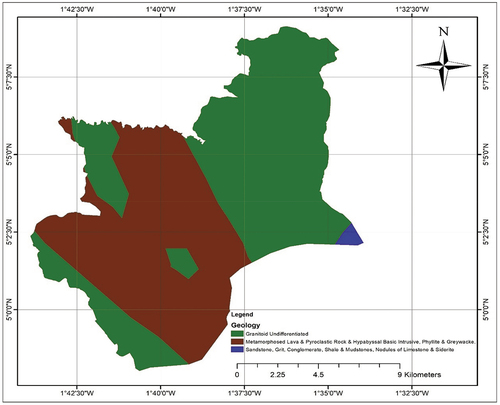
The Shama Municipality abides in a tropical climate zone and experiences two seasons. The rainy season occurs between March and July and between September and November. The dry season occurs between December and February. The highest, lowest, and average rainfalls in the study area are 170, 100, and 138 mm, respectively. The average annual rainfall is 129.53 mm. The area has a relatively mild temperature ranging between 22 and 28 °C (Ghana Statistical Service Citation2014). The geology of the coastal and non-coastal areas of the study area differs. The coastal area is dominated by shale, conglomerate, mudstone, and sandstones of various types reposed on a hard basement of granite, gneiss, schist, phyllite, quartzite, and marble. Nonetheless, the non-coastal areas have lower Birimian and granite soil minerals. There are two forms of granite in the study area. Namely, the Cape Coast granite complex and Dixcove granite.
is the geological map of the study area.
Figure 1. Geological map of the study area. Three geological features showing the different types of rocks and surficial deposits in the study area.
2.2 Sample collection
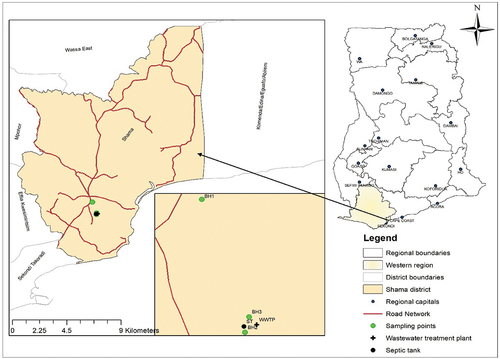
Standard methods of water sampling proposed by the American Public Health Association (Citation2005) were employed to collect groundwater samples through boreholes at three sampling locations. The groundwater sampling locations included the effluent discharge area (BH2) and administration area (BH1) of the WTF and the area located 1 km away from the waste treatment facility (BH3). The three boreholes were purposively selected as they were the only boreholes within the WTF and its immediate surroundings. Boreholes at BH1 and BH3 were located upgradient while BH2 was at downgradient. Groundwater flowed downhill in the direction of a low hydraulic gradient. is a map of the study area showing the sampling points. Borehole water samples were collected at a depth of 80 metres. One groundwater sample was collected once a week from each borehole between 06:00 and 07:00, starting from 16 November 2020 to 2 May 2021. The samples were put into 2.5 L stoppered polyethylene bottles, which has been earlier pre-treated with diluted HNO3 and distilled water. Before use, the bottles were rinsed with the sample twice. The samples were labelled and kept in an ice chest containing ice blocks. Afterward, the samples were transported to Ghana Water Company, Takoradi, for physicochemical and bacteriological analysis.
Figure 2. Map showing the sampling locations. A diagram showing the location of Shama Municipality, the waste treatment plant, and three sampling points.
2.3 Sample analysis
A total of 72 samples were analysed using standard methods and protocols for examining water suggested by American Public Health Association (Citation2005). The parameters analysed were pH, temperature, total dissolved solids (TDS), electrical conductivity (EC), turbidity, chemical oxygen demand (COD), total alkalinity (TA), total hardness, sodium ions (Na+), calcium ions (Ca2+), magnesium ions (Mg2+), ammonium ions (NH4+), potassium ions (K+), nitrate ion (NO3−), chloride ions (Cl−), sulphate ions (SO42-), fluoride ions (F−), phosphate ions (PO43-), bicarbonate ions (HCO3−), iron (Fe), zinc (Zn), copper (Cu), arsenic (As), lead (Pb), total coliform bacteria and Escherichia coli.
The EC, pH, TDS, and temperature were measured in-situ (200 ml) using HI 9829 multi-parameter (Hanna instrument, USA). Turbidity was measured using a 2100P turbidimeter (HACH model) while chemical oxygen demand (COD) and ammonium ions (NH4+) in groundwater samples were determined using HI 83224 multiparameter photometer (Hanna instrument, USA). Also, Atomic Adsorption Spectrophotometer (AAS, Perkin-Elmer NY, USA) was used to analyse Mg2+, K+, and Na+ ions including the heavy metals of the samples. Total alkalinity, Ca2+ ions, and total hardness were determined using titrimetric methods while anions (NO3−, Cl−, SO42-, F−, PO43-and HCO3−) in groundwater samples were analysed using Dionex DX 120 ion chromatography.
The Colony Forming Unit (CFU) was used to determine the presence of coliform bacteria in groundwater samples, where buffered peptone water was utilised as a reagent and chromocult coliform agar was utilised as a culture medium. The coliform determination protocol outlined by Niyoyitungiye, Giri, and Ndayisenga (Citation2020) was adopted in determining total coliform bacteria and Escherichia coli in groundwater samples in this study.
2.4 Water Quality Index calculation
Water Quality Index (WQI) is a rating that reflects the composite influence of different water quality parameters (Howladar, Numanbakth, and Faruque Citation2017). It is a value that numerically abridges many water quality parameters (Nwankwoala and Amachree Citation2020) and gives a gross evaluation of the water quality status in an area (Abadom and Nwankwoala Citation2018). Armah, Luginaah, and Ason (Citation2012) argued that WQI eradicates and abates the difficulty in describing the status of water quality. The WQI model proposed by Dhakad, Shinde, and Chaoudhary (Citation2008) was adopted in calculating the WQI of the groundwater in this study. This WQI model has been used to evaluate the physicochemical quality of groundwater in most studies (Nwankwoala and Amachree Citation2020; Abadom and Nwankwoala Citation2018; Saana et al. Citation2016).
In calculating the WQI, first, the quality rating of each parameter (Qi) was computed using equation (1). Secondly, the relative weight (Wi) was estimated using equation (2) and finally, the WQI was deduced by adding the product of quality rating (Qi) and its relative weight (Wi) as shown in equation (3).
Qi = (Va/Vs)100 (1)
Wi = ωi/∑ωI (2)
WQI = ∑(QiWi) (3)
Where Qi is the quality rating of each parameter; Va is the average level of each water quality parameter in the groundwater; Vs is the WHO (Citation2011) standard value for each parameter; ωi is the weight of each parameter and Wi is the relative weight.
In this study, 20 physicochemical parameters were used in computing the WQI as shown in . Each parameter was given a weight based on its health effects and the significance of the parameter on the quality status of the water for drinking purposes (Vasanthavigar et al. Citation2010). The highest weight allocated to toxic parameters was 5 while the minimum weight allocated to parameters that were non-toxic was 1 (). Based on the overall impact, other parameters were assigned values ranging from 1 to 5. Moreover, the minimum, mean, and highest values of physicochemical water quality parameters obtained in this study were used to calculate the minimum, mean, and highest WQI values, respectively. The quality of groundwater in the study area was evaluated by comparing the mean WQI value to the WQI values proposed by Chung et al. (Citation2015) for evaluating the quality of groundwater. According to Chung et al. (Citation2015), a WQI value less than 50 denotes excellent water quality, a WQI value ranging from 50 to 100 indicates good water quality, WQI >100 to 200 signifies poor water quality, WQI >200 to 300 indicates very poor water quality while WQI>300 indicates unsuitability of water for drinking purposes.
Table 1. Relative weights of groundwater quality parameters.
2.5 Data analysis
The data obtained in this study were input into R-software (version 4.0) for statistical analysis. Descriptive statistics were used to describe the data. Pearson product-moment correlation was utilised to analyse the association among water quality parameters while Principal Component Analysis (PCA) was utilised to identify factors controlling groundwater quality in the study area.
3.0 Results and Discussion
3.1 Physico-chemical characteristics of groundwater
Monitoring the physicochemical quality of water is tool for examining potential contamination and helping in assessing the validity of regulatory programmes (Sanaa et al., Citation2016). presents the descriptive statistics of physicochemical quality parameters of groundwater samples.
Table 2. Descriptive statistics of groundwater physicochemical parameters.
The pH of groundwater ranged from 7.00 to 7.60. This implies that the groundwater was neutral to slightly alkaline. The average pH values of groundwater collected at the three locations were within the WHO guideline range of 6.5 to 8.5 for drinking purposes. The pH range (7.00–7.60) of groundwater recorded in this study was different from a study carried out by Sanaa et al. (Citation2016) in the Upper West and Northern Regions of Ghana, where the pH of groundwater ranged from 6.14 to 7.50, suggesting that the groundwater was slightly acidic to neutral with a mean value of 6.87 ± 0.13. The difference in pH range could be attributed to differences in geology of the study areas as Sebiawu et al. (Citation2014) reported that the Upper West and Northern Regions of Ghana are subdued by crystalline silicate rocks and regolith, which give acidity to groundwater while Shama Municipality is dominated with gneiss, schist, and granite soil minerals.
The groundwater collected at BH2 recorded the highest average temperature (28.87 ± 079) oC, followed by groundwater collected at BH1 (26.87 ± 1.07) oC and that collected at BH3 (25.66 ± 0.25) oC. Unfortunately, the average temperature of groundwater collected at the three locations was higher than the WHO permissible guideline value of 25.00 °C for drinking water. A high temperature of potable water impacts the undesirable taste and odour and facilitates the growth of microorganisms, which affect water quality (WHO, Citation2011). The groundwater turbidity levels ranged from 1.02 to 1.88 NTU. On average, turbidity levels of groundwater collected at the three locations were below the WHO permissible limit of 5.00 NTU for drinking water, indicating that the groundwater resource has low levels of suspended particles and non-soluble metal oxides as Shigut et al. (Citation2017) reported that water with high turbidity has high inorganic particulate matter and non-soluble metal oxides.
COD content of groundwater ranged from 10.00 to 15.40 mg/L. Groundwater collected at BH2 recorded the highest average COD (15.21 ± 0.14), followed by groundwater collected at BH3 and BH1 with average COD levels of (10.60 ± 0.14) and (10.20 ± 0.14) mg/L, respectively. On average, the COD content of groundwater collected at the three locations exceeded the WHO drinking water permissible limit of 10.00 mg/L. From , the total alkalinity level of groundwater ranged from 110.00 mg/L (BH2) to 134.96 mg/L (BH1). On average, groundwater collected at BH1 (132.96 ± 0.82) mg/L had the highest level of total alkalinity, followed by groundwater collected at BH3 (117.60 ± 0.13) mg/L and BH2 (112.25 ± 0.98) mg/L. The average level of total alkalinity of groundwater collected at BH2 and BH3 was slightly lower than the WHO drinking water standard value of 120.00 mg/L. However, the average level of total alkalinity of groundwater collected at BH1 exceeded the WHO permissible drinking water standard.
From , the average EC and TDS of groundwater collected at the three locations were significantly higher than WHO permissible limits of 1000 µS/cm (EC) and 500 mg/L (TDS) for drinking purposes. According to Subba Rao et al. (Citation2021), TDS<1000 mg/L, TDS>1000 < 10,000 mg/L and TDS>1,00,000 mg/L indicates freshwater, saline and brine respectively. The levels of TDS in this study ranged from 1220.00 to 2360.00 mg/L suggesting that the groundwater was saline. Again, Subba Rao et al. (Citation2021) used EC to categorise groundwater into three types, namely, low enrichment of salts (EC<1500 µS/cm), medium enrichment of salts (EC≥1500 ≤ 3,000 µS/cm) and high enrichment of salts (EC>3,000 µS/cm). The average EC of groundwater samples collected at BH1 and BH3 is greater than 1500 but less than 3,000 µS/cm while that of BH2 is greater than 3,000 µS/cm, suggesting medium and high enrichment of salts respectively. The medium to high enrichment of groundwater with salts indicates the impact of anthropogenic sources on the groundwater system. Groundwater collected at BH2 recorded the highest level of EC (3933.25 ± 2.48 µS/cm) and TDS (2358.00 ± 1.44 mg/L), followed by groundwater collected at BH3 with EC and TDS levels of (2084.37 ± 2.69) µS/cm and (1190.48 ± 0.30) mg/L respectively. Groundwater collected at BH1 recorded the lowest EC (2037.58 ± 1.87 µS/cm) and TDS (1225.85 ± 5.78 mg/L) levels. The high levels of TDS in groundwater in the study area may increase the corrosive nature of the water and cause objectionable taste and gastrointestinal inflammation (Selvakumar et al. Citation2017). The finding of this study is different from the finding of a study carried out by Armah, Luginaah, and Ason (Citation2012) in Tarkwa in Ghana where the average levels of EC and TDS in groundwater were 241.8 (35.5–683) µS/cm and 152.8 (6.6–629) mg/L, respectively. The disparities in EC and TDS of groundwater could be attributed to the salinisation of groundwater in the Shama Municipality because of the long-term interaction between groundwater and geological formations.
The total hardness level of groundwater collected at the three locations ranged from 434.00 (BH1) to 1345 (BH3). On average, groundwater collected at BH2 had the highest level of total hardness (1343.00 ± 2.10), followed by groundwater collected at BH3 (450.47 ± 0.22) and BH1 (434.56 ± 0.63). The average total hardness of groundwater collected at BH2 was higher than the WHO drinking water guideline value of 500.00 mg/L, suggesting that groundwater collected at BH2 was not safe for drinking. The high level of total hardness of groundwater collected at BH2 can cause encrustation in water supply distribution systems. However, the average total hardness of groundwater collected at BH1 and BH3 was lower than the WHO drinking water standard value. According to Sawyer and McCarthy (Citation2017), water hardness can be categorised into four domains, which include soft (70 mg/L), moderately hard (>75–150 mg/L), and hard (>150–300 mg/L) and very hard water (>300 mg/L). Considering this water hardness categorisation scheme, groundwater in the study area was hard as the average total hardness levels of groundwater collected from the three boreholes exceeded 300 mg/L. Long-term consumption of hard water could lead to an increased incidence of urolithiasis, anencephaly, prenatal mortality, and cardiovascular disorders (Ilyas et al. Citation2019). In addition, hard water is known to leave scaly precipitate in pipes and reduce the cleaning potential of soap (Nas Citation2009). The finding of a study conducted by Chegbeleh, Akurugu, and Yidana (Citation2020) in the Talensi District in the Northern Region of Ghana revealed that groundwater had an average total hardness of 204.95 (72–412) mg/L. Similarly, the finding of a study carried out by Abadom and Nwankwoala (Citation2018) in Bayelsa State in Nigeria showed that groundwater had an average total hardness level of 43.64 (32.00–61.00) mg/L. These findings are different from the finding in this study as the average total hardness of groundwater recorded was 742.67 (434.00–1345.00) mg/L.
The average levels of cations such as Ca2+ (712.62 ± 2.03), Mg2+ (633.62 ± 2.16), and K+ ions (7.03 ± 0.01) mg/L in groundwater collected from BH2 were significantly higher than that recorded at BH1 and BH3. According to Hubbard et al. (Citation2016), poorly treated water infiltrates through the soil to contaminate groundwater systems. This suggests that the high levels of cations recorded in groundwater collected at BH2 could be attributed to the infiltration of chemical species in discharged wastewater treatment plant effluent into the aquifer of the waste treatment facility. The average levels of Ca2+ and Mg2+ of groundwater collected at the three locations exceeded the WHO drinking water permissible limit of 75.00 and 50.00 mg/L for Ca2+ and Mg2+ ions, respectively. However, the concentration of Na+ ions (210.47 ± 0.10) mg/L of groundwater collected at BH2 exceeded the WHO drinking water standard value of 200.00 mg/L while Na+ ion levels of groundwater collected at BH1 and BH3 were lower than the WHO drinking water guideline value. Furthermore, the concentrations of K+ and NH4+ ions in groundwater, which ranged from 5.01 to 7.05 mg/L (K+) and 0.01 to 0.08 mg/L (NH4+) were below the WHO drinking water standard values of 55.00 and 1.5 mg/L for K+ and NH4+ ions, respectively. The increasing order of concentration of cations in groundwater in the study area was NH4+ K+ <Na+ <Mg2+ <Ca2+.
The concentrations of chloride ions in groundwater collected at the three locations ranged from 495.00 mg/L (BH1) to 1486.00 (BH3), which were significantly higher than the WHO drinking water permissible limit of 250.00 mg/L. However, levels of F− (0.45–0.54), SO42-(100.00–128.00), NO3− (0.04–1.38), PO43-(0.50–0.80) and HCO3− (1.05–1.36) mg/L were lower than the WHO drinking water guideline values (). The levels of chloride ions were significantly higher than the levels of F−, SO42-, NO3−, PO43-, and HCO3− ions. The high levels of Cl- ions in this study may be due to the leaching of saline soil residues. The increasing order of concentration of anions of groundwater was NO3− F− < PO43-< HCO3-< SO42-< Cl−.
The levels of heavy metals such as iron (0.03–0.08) mg/L, zinc (0.02–0.38) mg/L, copper (0.14–0.36) mg/L, Arsenic (0.001–0.005) mg/L and lead (0.013–0.06) mg/L were lower than the WHO drinking water guideline value of 0.3 mg/L for iron, 5.00 mg/L for zinc, 2.00 mg/L for copper, 0.01 mg/L for Arsenic and 0.01 mg/L for lead.
Coefficient of variation (CV) was utilised to establish spatial variability among groundwater physicochemical parameters. CV< 10% indicates smaller spatial variation while 10%<CV<100% and CV>100% indicate medium and large spatial variations respectively (Zheng et al. Citation2017). From , the coefficient of variations of parameters ranged from 1.99 to 122.85. Total alkalinity, pH, SO42- and HCO3− had smaller spatial variations. Moreover, turbidity, EC, TDS, total hardness, Na+, Ca2+, Mg2+, K+, NO3−, Cl−, F−, PO43-, Fe, Cu, As, and Pb had medium spatial variations. The coefficient of variations of NH4+ and Zn was greater than 100%, indicating larger spatial variations. The coefficient of variations of groundwater physicochemical parameters was large except for total alkalinity, pH, SO42- and HCO3− ions. This implies that groundwater in the study area was adversely affected by landform, physiognomy, hydrology, and human activities.
A one-way analysis of variance (ANOVA) at 95% confidence level was performed to investigate the variations in physicochemical parameters of groundwater collected from the three boreholes. The ANOVA result () shows that statistically, there was a significant difference between the mean levels of physicochemical parameters of groundwater collected at the three locations. That is, the mean levels of physicochemical parameters of groundwater collected at the three locations significantly varied (p < 0.05). The null hypothesis that there is no statistically significant variation among the physicochemical parameters of groundwater collected at the three locations was rejected (p < 0.05). The finding of this study is in line with the finding of a study carried out by Getso et al. (Citation2018) in the Wudil Local Government Area in the Kano State of Nigeria, which revealed that there was a statistically significant difference in the mean physicochemical parameters of groundwater collected at three selected areas (p < 0.05). The finding of this study supports the assertion that the physicochemical quality of groundwater differs from one location to another (Getso et al. Citation2018; Taiwo et al. Citation2015).
Table 3. Analysis of variance (ANOVA) test results.
3.2 Bacteriological characteristics of groundwater
Coliform bacteria are the most common measured bacterial indicators used to determine the bacteriological characteristics of natural waters (Niyoyitungiye, Giri, and Ndayisenga Citation2020). presents the mean levels of total coliform and E-coli in groundwater samples.
Table 4. Bacteriological characteristics of groundwater samples.
From , groundwater collected at BH1 tested negative for total coliform and Escherichia coli. That is, groundwater collected at BH1 had no count of total coliform and E-coli. However, groundwater collected at BH2 and BH3 tested positive for total coliform bacteria and E-coli. Groundwater collected at BH3 recorded the highest average total coliform bacteria count of 30,200.0 ± 2.3(30,000.0–30,600.0) CFU/100 ml, followed by groundwater collected at BH2 with an average total coliform bacteria count of 20,100.0 ± 1.2(20,000.0–20,400.0) CFU/100 ml. Similarly, groundwater collected at BH3 had the highest average E-coli count of 25,000.0 ± 2.2 (24,500.0 -25,500.0) CFU/100 ml, followed by groundwater collected at BH2 with an average E-coli count of 11,800.0 ± 1.0 (11,600.0–11,900.0) CFU/100 ml. The average total coliform bacteria and E-coli counts recorded in groundwater collected at BH2 and BH3 did not meet the WHO (Citation2011) permissible drinking water limit of 0/100 ml, indicating that the water was not safe for drinking purposes. Niyoyitungiye, Giri, and Ndayisenga (Citation2020) assert that the presence of total coliform bacteria in groundwater indicates the potential for environmental contamination. This justifies that the presence of total coliform bacteria in groundwater samples collected at BH2 and BH3 denotes that the groundwater was microbiologically contaminated from an environmental source. Furthermore, Takal and Quaye-Ballard (Citation2018) opine that E-coli is one of the most specific indicators that give an indication of faecal pollution of water than any other indicator. This also justifies that the high level of E-coli in groundwater collected at BH2 and BH3, suggests groundwater contamination by faecal matter, possibly from infiltration of discharged wastewater and poorly treated wastewater into the aquifer. The finding of this study is in line with the finding of a study carried out by Takal and Quaye-Ballard (Citation2018), where groundwater samples collected through wells tested positive for total coliform bacteria and E-coli. Similarly, Attah (Citation2017) reported that borehole water samples in Owerri West of Southeastern Nigeria tested positive for total coliform bacteria and E-coli.
The groundwater samples collected from the waste treatment facility had a bad smell. This could be attributed to the presence of hydrogen sulphide produced because of the anaerobic decomposition of organic compounds by bacteria in the water as Murphy and Morrison (Citation2015) argue that the slow consumption of organic compounds by anaerobic bacteria in natural water produces hydrogen sulphide gas, which gives bad smell to the water.
3.3 Evaluation of groundwater quality using the WQI model
The WQI values of groundwater are shown in while presents WQI guideline values proposed by Chung et al. (Citation2015) for evaluating groundwater physicochemical quality.
Table 5. Water Quality Index of groundwater.
Table 6. Classification of water quality based on the WQI (Chung et al. Citation2015).
From , groundwater collected at BH1 recorded the lowest average WQI value of 79.05 (78.03 − 80.66). Groundwater collected at BH3 recorded an average WQI value of 82.99 (82.38–88.00). However, groundwater collected at BH2 recorded the highest average WQI value of 200.83 (198.68–204.43). Comparatively, groundwater collected at BH1 and BH3 had relatively low WQI values, while groundwater collected at BH2 recorded had significantly high WQI values. The high WQI values recorded in groundwater collected at BH2 could be attributed to the high levels of TDS and chloride ions. The average WQI values of groundwater collected at BH1 and BH3 fall within the 50 to 100 range of WQI values proposed by Chung et al. (Citation2015) for evaluating the groundwater quality, suggesting that the physicochemical quality of the groundwater was good. This implies that groundwater collected at BH1 and BH2 is physically and chemically safe for drinking. However, the average WQI value of 200.83 of groundwater collected at BH2 falls within the 200 to 300 range, indicating that the physicochemical quality of groundwater was very poor. This implies that groundwater collected at BH2 is physically and chemically unsafe for drinking.
The findings of this study are different from findings reported by other studies in which the same WQI model computation method was used. For instance, Chung et al. (Citation2015) reported that 86.0% of groundwater samples collected from wells had excellent physicochemical quality while 8.0% of groundwater samples were unsuitable for drinking. Also, Kumar et al. (Citation2015) showed that only 20.8% of groundwater samples collected from boreholes had excellent physicochemical quality.
3.4 Correlation matrix of groundwater quality parameters
Pearson’s correlation matrix of physical and chemical parameters is shown in .
Table 7. Correlation matrix of water quality parameters.
Correlation is significant at 0.05 (2–tailed)
The correlation matrix presented in shows that there was a weak positive correlation between pH and Ca2+, Mg2+, NH4+, F−, SO42+, ions (r < 0.5). However, pH moderately correlated with EC (r = 0.57), TDS (r = 0.55), TH (r = 0.59), Na+ (r = 0.55), NO3− and Cl− (r = 0.50) but strongly correlated with K+ (r = 0.62), indicating that the release or dissolution of K+, Na+, NO3−, and Cl− in solution changes with pH. There was a perfect positive correlation between EC and TDS (r = 0.99, p < 0.05), indicating that TDS accounted for the level of EC in groundwater. Also, the result shows that there was a strong positive correlation between TDS and major ions such as Na+, Ca2+, Mg2+, NO3−, Cl−, SO42-, F−, and K+ ions (r < 0.99, p < 0.05), hence these major ions contributed to the level of TDS of groundwater. Major ions such as Na+, Ca2+, Mg2+, NO3−, Cl−, SO42-, F−, and K+ ions contributed to the salinisation of groundwater in the study area. The salinisation of groundwater could be due to the long-term interaction between groundwater and geological formations (Marghade, Malpe, and Subba Rao Citation2019).
Total hardness correlated perfectly with Mg2+ (r = 1.00; p < 0.05) and strongly correlated with Ca2+ (r = 0.99; p < 0.05). This implies that Mg2+ and Ca2+ ions accounted for the level of total hardness in groundwater in the study area. There was a strong positive correlation among Mg2+ and Ca2+, K+, and Na+. This implies that these cations possibly originated from the same source. However, the levels of alkali earth (Ca2+ and Mg2+) are significantly higher than the alkali (Na+ and K+). Again, NH4+ ions moderately correlated with PO43- ions (r = 0.61, p < 0.05) while Na+ strongly correlated with and Cl- ions (r = 0.99; p < 0.05). This indicates that NH4+ and PO43- possibly originated from one source as well as Na+ and Cl− ions.
3.5 Principal component analysis (PCA)
Factor Analysis using PCA and rotated with Varimax rotation with Kaiser Normalisation using an Eigenvalue of 1 was used to identify which parameters significantly influence the water quality variations within and source apportionment. In all, a total of 24 principal components were extracted. However, the first two components cumulatively explained 90.373% of the total variance and were therefore retained in the model. These two principal components () whose eigenvalues were greater than one (>1) were selected as Bhat et al. (Citation2014), and Finkler et al. (Citation2016) reported that for PCA any factor with an eigenvalue greater than one (>1) is considered significant for further analysis. The remaining factors, which had eigenvalues less than one were considered insignificant, and hence were rejected. The first principal component (PC1) contributed 75.261% of the total variance and was highly loaded by turbidity, total hardness, COD, EC, TDS, Ca2+, Mg2+, NO3−, HCO3−, Cl−, SO42-, K+, F−, Na+ ions and heavy metals such as Fe, Zn, and Cu, indicating weathering and dissolution of plagioclase feldspars and wastewater treatment activities controlled the water quality. The second principal component (PC2) explained that 15.111% of the total variance was highly loaded by NH4+ ions, arsenic, and lead, which indicates that agricultural and waste treatment activities adversely affected the groundwater quality (Marghade, Malpe, and Subba Rao Citation2019).
Table 8. Summary of principal component analysis loading after Varimax rotation.
The study revealed that about 75.0% of the physicochemical parameters of groundwater collected at BH2 were relatively higher than the physicochemical parameters of groundwater collected at BH1 and BH3. In addition, the average levels of temperature, EC, TDS, COD, Ca2+, Mg2+, and Cl− ions of groundwater collected at the three locations exceeded the WHO drinking water permissible limits. However, the average total hardness and Na+ ions levels of groundwater collected 1 km away from the waste treatment facility (BH1) and administration area (BH3) of the waste treatment facility were below WHO drinking water guideline values while total hardness and Na+ ions levels of groundwater collected at effluent discharge area (BH2) of the treatment facility were above the WHO permissible limits. The distribution of cations in groundwater was in the order NH4+< K+ < Na+<Mg2+<Ca2+ while that of anion was NO3− − < PO43-< HCO3-< SO42-< Cl−. Groundwater collected at BH2 and BH3 tested positive for total coliform bacterial and E-coli while groundwater collected at BH1 tested negative. The WQI of groundwater collected at BH1 and BH3 ranged from 78.03 to 80.66 and 82.38 to 88.00, respectively, indicating that the groundwater physicochemical quality was good. However, the WQI of groundwater collected from BH2 was high, ranging from 198.68 to 204.43. Pearson’s correlation test results showed that total hardness correlated strongly with Mg2+ and Ca2+ ions (r < 0.98; p < 0.05). Similarly, TDS correlated strongly with Na+, Ca2+, Mg2+, NO3−, Cl−, SO42-, F− and K+ ions (r < 0.99; p < 0.05). PCA showed that weathering and dissolution of rock minerals and anthropogenic activities adversely affected groundwater quality.
4.0 Conclusions
The main conclusions drawn are summarised below:
The groundwater was neutral to alkaline, hard and saline in nature with medium to high enrichment of salts.
Groundwater collected at the treatment facility tested positive for total coliform bacteria and E-coli while groundwater collected 1 km away from the facility tested negative.
WQI classified groundwater samples collected at the effluent discharge area as poor water quality type. However, groundwater collected 1 km away and at the administration area of the treatment facility was of good physicochemical quality.
The levels of EC, COD, TDS, Ca2+, Mg2+and Cl− ions exceeded the WHO drinking water permissible limits. Major ions such as Na+, Ca2+, Mg2+, NO3−, Cl−, SO42-, F−, and K+ contributed to the level of TDS in groundwater (r < 0.99; p < 0.05). Mg2+ and Ca2+ ions accounted for groundwater hardness (r > 0.98; p < 0.05).
The null hypothesis that there is no statistically significant variation among the physicochemical parameters of groundwater collected at the three locations was rejected (p < 0.05).
The high positive loadings of turbidity, total hardness, COD, EC, TDS, Ca2+, Mg2+, NO3−, HCO3−, Cl−, SO42-, K+, F−, Na+, Fe, Zn, and Cu of PC1 revealed weathering and dissolution of rock minerals and human activities as contamination sources. The high loadings of NH4+ ions, As, and Pb of PC2 revealed agricultural and waste treatment activities as contamination sources in the study area.
Groundwater at the WTF was unsafe for use and should undergo vigorous treatment including disinfection before use.
There is the need for aquifer development and artificial recharge for sustainable development of the study area.
Acknowledgments
The author thanks Editor-in-Chief and anonymous reviewers for their valuable and constructive suggestions to improve the quality of the paper.
Data Availability Statement
The author confirms that the data supporting the findings of this study are available within the manuscript
Disclosure statement
The author declares that he has no known competing financial interests or personal relationships that could have appeared to influence the work reported in this paper.
Additional information
Notes on contributors
Godfred Safo-Adu
Godfred Safo-Adu is a Senior Lecturer in the Department of Environmental Science at the Faculty of Science Education of the University of Education, Winneba in Ghana. With his background in Chemistry, Environmental Science, and Engineering, he worked as a Process Plant Supervisor in an Integrated Oily Waste Treatment Facility in the Western Region of Ghana for eight years. He has published in reputable peer-reviewed journals at the local and international levels. His research interest includes Groundwater Quality Modelling, Aerosol Science and Modelling, Design of Indigenous Techniques for Wastewater Recycling, Environmental Risk Appraisal, Waste-to-Energy, Soil Chemistry, and Toxicology.
References
- Abadom, C. D., and H. O. Nwankwoala. 2018. “Interpretation of Groundwater Quality Using Statistical Techniques in Federal University, Otuoke and Environs, Bayelsa State, Nigeria.” World Scientific News 95: 124–148.
- Abd-elhamid, H. F., S. M. Abd-elmoneem, G. M. Abdelaal, M. Zele, Z. Vranayova, and I. Abd-Elaty. 2021. “Investigating and Managing the Impact of Using Untreated Wastewater for Irrigation on the Groundwater Quality in Arid and semi-arid Regions.” International Journal of Environmental Research and Public Health 18 (7485): 1–17. doi:10.3390/ijerph18147485.
- Akhtar, N., M. Izzuddin, S. Ishak, S. A. Bhawani, and K. Umar. 2021. “Various Natural and Anthropogenic Factors Responsible for Water Quality Degradation: A Review.” Water 13 (2660): 2660. doi:10.3390/w13192660.
- American Public Health Association. 2005. “Standard Methods for the Examination of Water and Wastewater Standard Methods for the Examination of Water and Wastewater.” APHA Publication 51(1). doi: 10.2105/AJPH.51.6.940-a.
- Armah, F., I. Luginaah, and B. Ason. 2012. “Water Quality Index in the Tarkwa Gold Mining Area in Ghana.” The Journal of Transdisciplinary Environmental Studies 11 (2): 1–15.
- Attah, U. E. 2017. “The Vulnerability of Underground Water Resources to Bacteriological Indicators in Parts of Owerri West of Southeastern Nigeria.” Journal of Environmental Analytical Chemistry 04 (3): 1–7. doi:10.4172/2380-2391.1000215.
- Bhat, S. A., G. Meraj, S. Yaseen, and A. K. Pandit. 2014. “Statistical Assessment of Water Quality Parameters for Pollution Source Identification in Sukhnag Stream: An Inflow Stream of Lake Wular(Ramsar Site), Kashmir Himalaya.” Journal of Ecosystem 1–19.
- Chegbeleh, L. P., B. A. Akurugu, and S. M. Yidana. 2020. “Assessment of Groundwater Quality in the Talensi District, Northern Ghana.” Scientific World Journal 2020. doi:10.1155/2020/8450860.
- Chung, S. Y., S. Venkatramanan, T. H. Kim, D. S. Kim, and T. Ramkumar. 2015. “Influence of Hydrogeochemical Processes and Assessment of Suitability for Groundwater Uses in Busan City, Korea.” Environment, Development and Sustainability 17 (3): 423–441. doi:10.1007/s10668-014-9552-7.
- Community Water & Sanitation Agency (2014). Framework of Service Delivery Indicators for Assessing and Monitoring Rural and Small Town Water Supply Services in Ghana. http://sanitationandwaterforall.org/partner_perspective/framework-of-service-delivery-indicators-for-assessing-and-monitoring-rural-and-small-town-water-supply-services-in-ghana/
- Dhakad, K., D. Shinde, and P. Chaoudhary. 2008. “Water Quality Index of Ground Water (Gwqi) of Jhabua Town, India.” Journal of Environmental Research and Development 2 (3): 443–446.
- Edokpayi, J., J. Odiyo, and O. Durowoju. 2017. “Impact of Wastewater on Surface Water Quality in Developing Countries: A Case Study of South Africa.” Water Quality 400–411.
- Finkler, N., A. Bortolin, J. Ccconi, L. Mendes, and V. Schneider. 2016. “Monitoring Stations Stations.” Ciência e Natura 38 (2): 577–587. doi:10.5902/2179-460X18168.
- Getso, B. U., A. Mustapha, M. M. Abubakar, and A. Tijjani. 2018. “Assessment of Borehole Water Quality for Domestic Use in Three Selected Wards in Wudil Local Government Area, Kano State.” Journal of Environmental Science Studies 1 (1): 1. doi:10.20849/jess.v1i1.394.
- Ghana Statistical Service. (2014). Population and Housing Census. District Analytical Report. GSS publishing.
- Ghana Statistical Service. (2021). Ghana 2021 Population and Housing Census. General Report Volume 3A. GSS Publication.
- Gugulothu, S., N. Subba Rao, R. Das, L. K. Duvva, and R. Dhakate. 2022. “Judging the Sources of Inferior Groundwater Quality and Health Risk Problems through Intake of Groundwater Nitrate and Fluoride from a Rural Part of Telangana, India.” Environmental Science and Pollution Research 29 (32): 49070–49091. doi:10.1007/s11356-022-18967-9.
- Howladar, M. F., A. A. Numanbakth, and M. O. Faruque. 2017. “An Application of Water Quality Index (WQI) and Multivariate Statistics to Evaluate the Water Quality around Maddhapara Granite Mining Industrial Area, Dinajpur, Bangladesh.” Environmental Systems Research 6(13. doi:10.1186/s40068-017-0090-9.
- Hubbard, L., S. Keefe, D. Kolpin, L. Barber, J. Duris, and P. Bradley. 2016. “Understanding the Hydrologic Impacts of Wastewater Treatment Plant Discharge to Shallow Groundwater: Before and after Plant Shutdown.” Environmental Science: Water Research & Technology. doi:10.1039/C6EW00128A.
- Igboama, W., O. Hammed, J. Fatoba, M. Aroyehum, and J. Ehiabhili. 2022. “Review Article on Impact of Groundwater Contamination Due to Dumpsites Using Geophysical and Physiochemical Methods.” Applied Water Science 12 (130): 1–14. doi:10.1007/s13201-022-01653-z.
- Ikem, A., O. Osibanjo, M. K. C. Sridhar, and A. Sobande. 2002. “Evaluation of Groundwater Quality Characteristics near Two Waste Sites in Ibadan and Lagos, Nigeria.” Water, Air and Soil Pollution 140 (1/4): 307–333. doi:10.1023/A:1020165403531.
- Ilyas, M., W. Ahmad, H. Khan, S. Yousaf, M. Yasir, and A. Khan. 2019. “Environmental and Health Impacts of Industrial Wastewater Effluents in Pakistan: A Review.” Reviews on Environmental Health 34 (2): 171–186. doi:10.1515/reveh-2018-0078.
- Kabila, A. 2010. “Domestic Water Supply, Sanitation and Health in Rural Ghana: Perspectives from Nkwanta District.” Ghana Journal of Geography 2: 164–193.
- Kayode, O. T., H. I. Okagbue, and J. A. Achuka. 2018. “Water Quality Assessment for Groundwater around a Municipal Waste Dumpsite.” Data in Brief 17: 579–587. doi:10.1016/j.dib.2018.01.072.
- Kumari, S., and J. Rani. 2014. “Assessment of Water Quality Index of Groundwater in Smalkkhan, Haryana.” International Journal of Latest Research in Science and Technology 3 (6): 169–172.
- Kumar, K., A. Logeshkumaran, N. S. Magesh, P. S. Godson, and N. Chandrasekar. 2015. “Hydro-geochemistry and Application of Water Quality Index (WQI) for Groundwater Quality Assessment, Anna Nagar, Part of Chennai City, Tamil Nadu, India.” Applied Water Science 5 (4): 335–343. doi:10.1007/s13201-014-0196-4.
- Kumar, R., S. Singh, R. Kumar, and P. Sharma. 2022. “Groundwater Quality Characterization for Safe Drinking Water Supply in Sheikhpura District of Bihar, India: A Geospatial Approach.” Frontiers in Water 4 (March): 1–13. doi:10.3389/frwa.2022.848018.
- Lapworth, D. J., D. C. W. Nkhuwa, M. E. Stuart, M. E. Stuart, M. E. Stuart, M. N. Tijani, and J. Wright. 2017. “Urban Groundwater Quality in sub-Saharan Africa: Current Status and Implications for Water Security and Public Health.” Hydrogeology Journal 25 (4): 1093–1116. doi:10.1007/s10040-016-1516-6.
- Lutterodt, G., M. K. Miyittah, B. Addy, E. D. O. Ansa, and M. Takase. 2021. “Heliyon Groundwater Pollution Assessment in a Coastal Aquifer in Cape Coast, Ghana.” Heliyon 7 (4): e06751. doi:10.1016/j.heliyon.2021.e06751.
- Marghade, D., D. Malpe, and N. Subba Rao. 2019. “Applications of Geochemical and Multivariate Statistical Approaches for the Evaluation of Groundwater Quality and Human Health Risks in a semi-arid Region of Eastern.” Environmental Geochemistry and Health 1.
- Masindi, V., and S. Foteinis. 2021. “Groundwater Contamination in sub-Saharan Africa: Implications for Groundwater Protection in Developing Countries.” Cleaner Engineering and Technology 2: 1–14. doi:10.1016/j.clet.2020.100038.
- Murphy, B., and R. Morrison. 2015. Introduction to Environmental Forensics. 2nd Edition. London: Elsevier.
- Nas, B. 2009. “Geostatistical Approach to Assessment of Spatial Distribution of Groundwater Quality.” Polish Journal of Environmental Studies 18 (6): 1073–1082.
- Nihalani, S., S. Behede, and A. Meeruty. 2022. “Groundwater Quality Assessment in Proximity to Solid Waste Dumpsite at Uruli Devachi in Pune, Maharashtra.” Water Science and Technology 85 (11): 3331–3342. doi:10.2166/wst.2022.172.
- Niyoyitungiye, L., A. Giri, and M. Ndayisenga. 2020. “Assessment of Coliforms Bacteria Contamination in Lake Tanganyika as Bioindicators of Recreational and Drinking Water Quality.” South Asian Journal of Research in Microbiology 6 (3): 9–16. doi:10.9734/sajrm/2020/v6i330150.
- Nwankwoala, H., and T. Amachree. 2020. “The Water Quality Index (WQI) and Hydrochemical Characterisation of Groundwater Resources in Hydrocarbon Polluted Sites in the Niger Delta.” Journal of Mining and Geology 56 (1): 69–84.
- Pandey, H. K., V. Tiwari, S. Kumar, A. Yadav, and S. K. Srivastava. 2020. “Groundwater Quality Assessment of Allahabad Smart City Using GIS and Water Quality Index.” Sustainable Water Resources Management 6 (28). doi:10.1007/s40899-020-00375-x.
- Saana, S. B. B. M., S. A. Fosu, G. E. Sebiawu, N. Jackson, and T. Karikari. 2016. “Assessment of the Quality of Groundwater for Drinking Purposes in the Upper West and Northern Regions of Ghana.” SpringerPlus 5 (1): 1–15. doi:10.1186/s40064-016-3676-1.
- Safo-Adu, G. 2020. “Assessment of an Oily Wastewater Treatment Plant in Nyankrom Industrial Area, Ghana: Physicochemical Quality of Effluent Water and Treatment Efficiency.” European Journal of Pure and Applied Chemistry 7 (1): 1–13.
- Sappa, G., F. Ferranti, S. Ergul, and G. Ioanni. 2013. “Evaluation of the Groundwater Active Recharge Trend in the Coastal Plain of Dar Es Salaam(Tanzania).” Journal of Chemical and Pharmaceutical Research 5 (12): 548–552.
- Sawyer, C., and P. McCarthy. 2017. Chemistry for Environmental Engineering and Science. 5 ed. New York: McGraw Hil.
- Sebiawu, G. E., S. A. Fosu, S. Bieranye, and M. Bayaa. 2014. “A physico-chemical and Bacteriological Analysis of Borehole Water Samples from the Wa Municipality of the Upper West Region, Ghana.” International Journal of Engineering Research and Technology 3 (5): 1959–1965.
- Seidu, J., and A. Ewusi. 2018. “Assessment of Groundwater Quality Using Hydrogeochemial Indices and Statistical Analysis in the Tarkwa Mining Area of Ghana.” Journal of Environmental Hydrology 26 (February): 1–14.
- Selvakumar, S., K. Ramkumar, N. Chandrasekar, N. S. Magesh, and S. Kaliraj. 2017. “Groundwater Quality and Its Suitability for Drinking and Irrigational Use in the Southern Tiruchirappalli District, Tamil Nadu, India.” Applied Water Science 7 (1): 411–420. doi:10.1007/s13201-014-0256-9.
- Sharma, S., and A. Nhattacharya. 2017. “Drinking Water Contamination and Treatment Techniques.” Applied Water Science 7 (3): 1043–1067. doi:10.1007/s13201-016-0455-7.
- Shigut, D., G. Liknew, L. Dejene, D. Irge, and T. Ahmad. 2017. “Assessment of physico-chemical Quality of Borehole and Spring Water Sources Supplied to Robe Town, Oromia Region, Ethiopia.” Applied Water Science 7 (1): 155–164. doi:10.1007/s13201-016-0502-4.
- Shivaraju, H. 2016. “Impact Assessment of Sewage Discharge on Underground Water Qualities around Municipal Sewage Treatment Plant, Mysore City, India.” International Journal of Research in Chemistry and Environment 1 (2): 28–35.
- Subba Rao, N., A. Dinakar, M. Sravanthi, and B. K. Kumari. 2021. “Geochemical Characteristics and Quality of Groundwater Evaluation for Drinking, Irrigation, and Industrial Purposes from a Part of Hard Rock Aquifer of South India.” Environmental Science and Pollution Research 28 (24): 31941–31961. doi:10.1007/s11356-021-12404-z.
- Taiwo, A. M., A. T. Towolawi, A. A. Olanigan, O. O. Olujimi, and T. A. Arowolo. 2015. “Comparative Assessment of Groundwater Quality in Rural and Urban Areas of Nigeria.” Research and Practices in Water Quality 180–190. doi:10.5772/59669.
- Takal, J. K., and J. A. Quaye-Ballard. 2018. “Bacteriological Contamination of Groundwater in Relation to Septic Tanks Location in Ashanti Region, Ghana.” Cogent Environmental Science 4 (1): 1–11. doi:10.1080/23311843.2018.1556197.
- Twinomucunguzi, F. R. B., P. M. Nyenje, R. N. Kulabako, S. Semiyaga, J. W. Foppen, and F. Kansiime. 2020. “Reducing Groundwater Contamination from on-site Sanitation in peri-urban Sub-Saharan Africa: Reviewing Transition Management Attributes Towards Implementation of Water Safety Plans.” Sustainability 12 (4210): 1–21. doi:10.3390/su12104210.
- Tyagi, S., B. Sharma, P. Singh, and R. Dobhal. 2020. “Water Quality Assessment in Terms of Water Quality Index.” American Journal of Water Resources 1 (3): 34–38. doi:10.12691/ajwr-1-3-3.
- Vasanthavigar, M., K. Srinivasamoorthy, R. Vijayaragavan, R. Ganthi, S. Chidambaram, P. Anandhan, R. Manivannan, and S. Vasudevan. 2010. “Application of Water Quality Index for Groundwater Quality Assessment : Thirumanimuttar sub-basin, Tamilnadu, India.” Environmental Monitoring and Assessment 171 (1–4): 595–609. doi:10.1007/s10661-009-1302-1.
- Vasanthi, P., S. Kaliappan, and R. Srinivasaraghavan. 2008. “Impact of Poor Solid Waste Management on Ground Water.” Environmental Monitoring Assessment 143 (1–3): 227–238. doi:10.1007/s10661-007-9971-0.
- World Health Organisation. 2011. Guidelines for Drinking Water Wuality. Geneva, Switzerland: WHO Publishers.
- Yisa, J., T. O. Jimoh, and O. M. Oyibo. 2012. “Underground Water Assessment Using Water Quality Index.” Leonardo Journal of Sciences 21: 33–42.
- Zheng, Q., T. Ma, Y. Wang, Y. Yan, L. Liu, and L. Liu. 2017. “Hydrochemical Characteristics and Quality Assessment of Shallow Groundwater in Xincai River Basin, Northern China.” Procedia Earth and Planetary Science 17: 368–371. doi:10.1016/j.proeps.2016.12.093.