
 ?Mathematical formulae have been encoded as MathML and are displayed in this HTML version using MathJax in order to improve their display. Uncheck the box to turn MathJax off. This feature requires Javascript. Click on a formula to zoom.
ABSTRACT
Zambia has recently faced prolonged load shedding due to reduced hydroelectricity generation caused by unfavourable rainfall patterns. To tackle this issue and satisfy increasing energy demands, the government aims to explore alternative energy sources like wind energy. However, the uncertainty surrounding the economic feasibility of implementing wind power projects in Zambia poses a significant challenge. This study evaluates the economic feasibility of eight proposed wind farm sites using net present value (NPV), simple payback period (SPP), internal rate of return (IRR), and levelized cost of electricity (LCOE). By examining energy yield analysis (EYA), wind speed, and financial indicators, the study identifies the most economically viable wind farm site(s). The results reveal that the Lusaka wind farm is the most economical, with an energy yield analysis of 386 GWh, wind speed of 8 m/s, NPV of USD 316 million, SPP of 2.9 years, IRR of 82%, and LCOE of 0.182 USD/kWh. An economic sensitivity analysis, varying the average electricity tariff, also points to Lusaka as the most financially viable site. Consequently, policymakers are advised to develop cost-reflective feed-in tariff (FiT) schemes and power purchase agreements to establish electricity tariffs that encourage investment from independent power producers in Zambia.
1. Introduction
Wind energy has gained significant popularity in recent years, driven by environmental concerns related to fossil fuel usage, the rising cost of fossil fuels, and the global push by both developed and developing nations to reduce reliance on foreign fuels. In addition to these external factors, the decreasing cost of wind-generated electricity has further supported the widespread adoption of wind energy (Ertürk Citation2012). Renewable energy is gaining increasing attention in the global energy market and society. The scientific community and political institutions have consistently emphasised the crucial role of energy and renewable energy systems as vital assets for sustainable global development. Wind energy is a relevant renewable energy source owing to its high conversion performance, especially in large-scale plants (Savino et al. Citation2017). The U.S. government has invested USD 3 billion in wind research since 1976, with research findings demonstrating substantial and positive returns associated with wind power development (Wiser and Millstein Citation2020). Technical feasibility, high economic competitiveness, and substantial emission reduction can be realised through the deployment of turbines. Therefore, clarity regarding the suitable sites and investment costs is essential (Wang et al. Citation2022).
The development and integration of renewable energy technologies into the national electricity generation mix has significant potential for reducing greenhouse gas (GHG) emissions, accounting for approximately 40% of global GHG emissions (Kumi and Mahama Citation2023). The considerable GHG emissions resulting from fossil fuel combustion and unmet energy demands have compelled the country to explore and embrace environmentally friendly and renewable alternatives to meet growing energy demands. Therefore, the government must prioritise renewable energy in future energy structures (Yang and Chen Citation2013). African countries, including Zambia, should learn from such initiatives and support wind research by empowering research and development (R&D) institutions to advance the wind energy sector.
Energy is one of the most critical factors for the socioeconomic development of any nation. Access to power undeniably enhances productivity and creates economic growth opportunities. The expansion of alternative energy sources, such as solar and wind power, presents a potential solution to the challenges posed by non-renewable resources (Manoo et al. Citation2023). The deployment of onshore wind power is crucial for mitigating climate change, despite the potential inconveniences for nearby residents, primarily due to noise pollution and visual effects (Lehmann, Reutter, and Tafarte Citation2023).
Operators have the potential to increase investment returns in existing wind parks (Zieglera et al. Citation2018). The notable economic benefits of wind energy to communities include increased gross domestic product (GDP) and local income. As an essential input for socioeconomic development, energy plays a significant role in the prosperity of nations (Almutairi et al. Citation2022). Developing a renewable energy project, such as wind and photovoltaic (PV) power plants, requires a deep understanding of the primary energy resources, such as wind speed and solar irradiation (Harrucksteiner et al. Citation2023). Renewable energy projects help to mitigate the release of greenhouse gases (GHG) into the atmosphere. The anticipated growth in offshore wind energy investments worldwide is foreseen in the upcoming decades, driven by advancements in technology, reduced costs, and growing political backing. The intricate nature, extensive scale, and diverse locations of these projects enhance the viability of international ownership and electricity export. In recent years, national governments have shaped the trajectory of wind energy initiatives through the formulation of policies, regulations, and energy targets (Kumi and Mahama Citation2023; Linnerud, Dugstad, and Rygg Citation2022).
Hybrid system studies have shown that wind is an environmentally friendly energy source that can be harnessed both onshore and offshore. Wind energy is a reliable, feasible, and efficient standalone system (Mwanza et al. Citation2022; Wimalaratna et al. Citation2022). Zambia aspires to become a prosperous middle-income country by 2030, and this will require an adequate supply of energy services to its people as an input to their productive activities. The market for renewable energy is gradually emerging, but many challenges limit its growth. The government acknowledges the challenges within the market and has collaborated extensively with stakeholders to establish a favourable market atmosphere. The National Energy Policy Citation2019 (NEP, 2019) builds upon earlier policies from 1994 to 2008 and aligns with the Seventh National Development Plan (7NDP) and Vision 2030. Although the fundamental objectives of the previous policy persist, notable changes have occurred in social, political, environmental, and economic landscapes (National Energy Policy Citation2023; Sim Citation2023). There is sufficient land for wind farm development in Zambia, and the proposed areas are far from residential buildings. Zambia has been exploring opportunities for electricity interconnection with other countries in the region to enhance energy cooperation, improve energy security, and facilitate electricity exchange. Regional electricity interconnections offer various benefits including the potential for shared energy resources, increased reliability, and economic development. Zambia’s electricity interconnection opportunities include the Southern African Power Pool (SAPP), the Zambia – Tanzania – Kenya Power Interconnector (ZTKPI), the Zambia-Angola power interconnector, and the Zambia-Zimbabwe power interconnector. The proposed wind farms were near the national grid, reducing connection costs. Given this background, Zambia needs to conduct economic feasibility studies of renewable energy sources to provide the sector with information that policymakers and independent power producers can use. Among other potential energy sources, wind energy is considered an energy source (Mutale et al. Citation0000). Possessing the ability to engage in more strategic planning will, in the end, reduce the levelized cost of electricity (LCOE) for projects, improve confidence in establishing long-term targets, and expedite their implementation (Krauland et al. Citation2023). Numerous researchers have embraced sophisticated scientific algorithms from pertinent domestic and international research literature to predict the costs of power engineering projects (Feng and Wencheng Citation2023).
Access to modern energy in the rural areas of Zambia needs improvement (Kaoma and Gheewala Citation2021b). Currently, wind energy does not contribute to the installed generation capacity in Zambia, whereas solar PV contributes approximately 3% (DNV Report Citation2023). The adoption rates of modern bioenergy systems in rural areas of Zambia are low, indicating shortcomings within existing institutional arrangements for a conducive enabling environment for their deployment (Kaoma and Gheewala Citation2021a). This status quo of access to modern energy in these areas shows the unlikelihood of attaining the 2030 rural electrification target of 51% (Wiser and Millstein Citation2020). Comprehensive studies on onshore wind technical and economic potential should be a priority for the country’s energy transition strategies. The economic feasibility of onshore wind energy for electricity generation is influenced by several factors, such as wind availability, initial investment costs, operating and maintenance costs, grid integration and storage, government policies and incentives, economies of scale, environmental and social impacts, market factors, technological advancements, and the lifetime of the project (Ohunakin et al. Citation2012; Wizelius Citation2009).
The purpose of this study is to assess the economic feasibility of eight proposed wind farm sites in Zambia. This evaluation is driven by recent difficulties in hydroelectricity generation and the government’s search for alternative energy sources due to prolonged load shedding. As the first economic feasibility study of its kind in Zambia, it aims to determine the most cost-effective structures for installing wind turbines at the eight sites listed in . Section 2 presents the literature on the economic feasibility of wind energy using various metrics. Section 3 outlines the materials and methods employed, Section 4 presents the results and discussions, and Section 5 concludes the paper.
Table 1. Adapted from World Bank. 2019. Wind resource mapping in Zambia: 24-month site resource report. Washington, DC, USA: World Bank. Renewable energy wind mapping for Zambia (Odoi-Yorke et al. Citation2022.).
2. Economic feasibility of wind energy
This literature review focuses on the various methods used to analyse the economic feasibility of wind energy. Several authors have applied the net present value (NPV), simple payback period (SPP), annual life cycle savings, internal rate of return, benefit – cost ratio, year-to-positive cash flow, and cost of electricity production (COE). Mohamadi et al. (Citation2021) applied the present value cost (PVC) and unit cost of electricity (UCE) to conduct an economic analysis of wind farms. The results showed that investment in wind farms in eastern Iran could be associated with high profitability. The same method was applied by Alham, Gad, and Ibrahim (Citation2023). Mostafaeipour et al. (Citation2014), and Feng et al (Feng and Wencheng Citation2023). Studies show that PVC and UCE will differ for each site or wind farm. Abdelhadya, Borelloc, and Santoric (Citation2015) only applied NPV. The results of the annual electricity generation from the selected wind turbines at the chosen sites were used to investigate the feed-in tariff (FiT) rates. The FiT must consider the contract length, interest rate, and number of operation hours at the rated capacity of the wind turbine. Alham, Gad, and Ibrahim (Citation2023) used a similar method, and the results showed that a unit energy cost of about 0.30 USD/kWh was more profitable for non-connected electrical and mechanical applications (water pumping and battery charging) than a diesel generator. With the NPV method, the annual income or expense that will occur for a specific number of years is given a value at a particular time, usually the day when the turbine starts to operate (Ohunakin et al. Citation2012).
This was reaffirmed by Ohunakin et al. (Citation2023). Barter et al. (Citation2023). Mardones (Citation2023), Quinna, Schepersb, and Bulder (Citation2016), and Langer et al. (Citation2022). The SPP method was used to evaluate the economic conditions for investment in a wind power project. It calculates the time taken to recover the invested money (Ohunakin et al. Citation2023). Hulio, Jiang, and Rehman (Citation2017). characterised a simple payback period as the duration during which the energy generated by the system surpasses the initial system costs. The obtained outcomes enable an assessment of the viability of the proposed system in terms of both energy and economic considerations. The proposed system attains a simple payback period of 13.3 years, positioning it at the profitability threshold.
A project becomes financially viable if its internal rate of return (IRR) surpasses the discount rate. The IRR signifies the highest discount rate at which a project remains economically feasible. The levelized cost of electricity (LCOE, €/kWh) represents the current value of producing one unit of electrical energy over the project’s lifespan (Hulio, Jiang, and Rehman Citation2017). Similar to Ali, Lee, and Jang (Citation2017). Himri et al (Himri et al. Citation2020). utilised RETScreen software version 7.0, estimating the energy output and assessing the economic feasibility of a wind farm, considering metrics such as simple payback period (SPP), internal rate of return, annual life cycle saving, net present value, year-to-positive cash flow, benefit-cost ratio, and the cost of electricity production (CEP). Applying the same approach, Odoi-Yorke et al (Odoi-Yorke et al. Citation2022) discovered that a feed-in tariff (FiT) below 0.15 USD/kWh was unprofitable for wind power development in Adafoah. Additionally, in the absence of financial incentives, the levelized cost of energy (LCOE) of a wind power plant is approximately 0.143 USD/kWh.
Sensitivity analysis is applied to a realistic worst-case scenario; this could be because the total power price will drop by 15 percent, and the power production will be 10 percent less than that calculated due to errors in calculations, climate change, grid failure, and different hub heights. Ali, Lee, and Jang (Citation2017) explained that the wind turbine hub height affects the economics of the wind turbine; therefore, the optimal hub height was estimated for each wind turbine model, which was also reaffirmed by Zhang et al. (Citation2022) and Satymov, Bogdanov, and Breyer (Citation2022) in the sensitivity analysis conducted.
This study analysed the economic feasibility of eight sites in Zambia to understand the cost structure of setting up wind power plants. The eight sites are located at the country’s provincial headquarters, making it easier to connect the power plant to the grid. The model created in this study identified equipment transportation to these sites as a differentiating factor in terms of cost structure owing to differences in distance. This study was motivated by the need for a more comprehensive research on the economic analysis of wind energy specific to Zambia. Based on a two-year data collection effort, DNV GL has assessed the wind conditions at various locations, examined the long-term wind patterns, and estimated energy production using a standard 4 MW wind turbine featuring a 140 m rotor and a hub height of 130 m (DNV Report Citation2023). This paper presents a comparative analysis of economic viability, employing metrics such as the net present value (NPV), simple payback period (SPP), internal rate of return (IRR), and levelized cost of electricity (COE). The outcomes not only contribute to the understanding of wind power in Zambia, but also support the country’s transition towards clean and sustainable energy. Moreover, these findings offer valuable insights for guiding the development of wind power projects in Zambia and other regions characterised by low to moderate wind speeds for the specified wind turbine model (National Energy Policy Citation2023).
3. Materials and methods
3.1. Site description and energy data
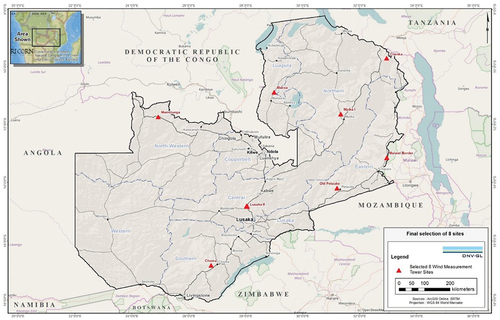
The masts involved in the ESMAP programme were strategically positioned across Zambia to support wind-mapping investigations. Wind regime measurements were conducted at eight meteorological (met) mast sites across the country, as depicted in . DNV GL has examined an initial layout comprising 25 turbines, each being a standard 4 MW wind turbine with a hub height of 130 m, to evaluate the potential energy output at each of these locations (DNV Report Citation2023).
Figure 1. Shows wind regime measurements conducted at eight meteorological (met) mast sites across the country.
lists the turbine model considered in this economic feasibility study.
Table 2. Proposed wind turbine model parameters (DNV Report Citation2023).
Wind farm developers should be approached early to seek acceptance of the proposed turbine layouts and assess the suitability of the turbines for each site. It is essential to evaluate the necessity of mitigating fatigue loads through wind sector management. Certain turbine models may offer enhanced energy capture, thereby improving the overall performance at sites. summarises the average turbine wind speeds at 130 m for eight sites (DNV Report Citation2023).
Table 3. Adapted from World Bank. 2019. Wind resource mapping in Zambia: 24 month site resource report. Washington, DC, USA: World Bank. Renewable energy wind mapping for Zambia.
The projected net energy production for each wind farm is presented in (DNV Report Citation2023). Energy production is crucial for economic feasibility calculations because it aids in analysing a project’s viability. Lusaka, which had the highest wind speed, exhibited the highest energy output of 386 GWh/annum with a capacity factor of 44%, whereas Petauke had the lowest at 291.5 GWh/annum and a capacity factor (33.2%. To make an informed decision regarding a wind power project, a thorough economic analysis is necessary. Wind turbines must generate income to ensure that investors or banks providing loans recoup their funds and receive reasonable returns on their investment. Therefore, an economic analysis should be followed by a sensitivity analysis that highlights the risks and opportunities associated with investment (Zhang et al. Citation2022).
Table 4. Adapted from World Bank. 2019. Wind resource mapping in Zambia: 24 month site resource report. Washington, DC: World Bank. Renewable energy wind mapping for Zambia.
3.2. Methodological approach
An economic evaluation methodology was developed to evaluate the economic feasibility using the present value of costs (PVC), simple payback period (SPP), internal rate of return (IRR), and levelized cost of electricity production (LCOE). shows the flowchart used in this study. The economic result calculation is based on the assumption of the price per kWh produced using the most likely price. This assumption is a critical factor for estimating the economic viability of a project (Earnest and Wizelius Citation2011). The developed model was analysed using MATLAB 2022. The electricity cost and sensitivity analysis results compared the current electricity cost for Zambia at 0.07 USD/kWh with the model results. Sensitivity analysis is a crucial aspect of financial modelling as it helps identify the impact of variations in key parameters on a project’s economic outcomes. This analysis is particularly important for assessing the robustness of a project under different scenarios. This comparison served as a benchmark for evaluating the economic feasibility of a project in relation to the existing cost structure in the region.
Figure 2. Methodology flow chart used to evaluate the economic feasibility of the wind farms.
Sensitivity analysis involves assessing how changes in certain variables (in this case, the electricity tariff) affect the outcomes of a model or project. In the context of wind farms, a sensitivity analysis for electricity tariffs would explore how variations in the price at which the generated electricity is sold influence the economic feasibility of the project. Different scenarios involving changes in electricity tariff rates may be tested to understand their impact on a project’s financial performance. The analysis involved evaluating how alterations in the costs associated with operating and maintaining each wind farm affect its economic viability. This could include factors such as maintenance costs, operational expenses, and other relevant costs. Feed-in tariffs are policies in which electricity producers pay a set rate for the electricity they generate. Cost-reflective feed-in tariffs aim to set these rates to reflect the actual costs of producing electricity. This involves establishing a pricing structure that considers the costs associated with electricity generation from wind farms. The goal is to ensure that the tariffs offered to producers align with the actual expenses incurred, thereby providing a fair and sustainable incentive for renewable energy projects.
The methodology flowchart in outlines the step-by-step process for conducting sensitivity analysis. This involves defining the variables under consideration (such as electricity tariff and cost of electricity), determining the range of values to be tested, and assessing the resulting impacts on financial metrics, such as net present value, internal rate of return, and payback period. Overall, this analysis aims to enhance decision making by providing insights into how variations in key factors could influence the financial performance and feasibility of wind farm projects. The focus is on creating robust financial models that can withstand changes in external conditions and uncertainty.
3.3. Economic feasibility analysis
Several methods have been applied to determine the economic feasibility of wind energy potential for electricity generation. In this study, the following methods were employed for the computations:
3.3.1. The cost of the wind turbine
The cost of the wind turbine, , can be estimated using Equation (Ali, Lee, and Jang Citation2017):
Where is the rated power of the wind machine in MW.
3.3.2. Net present value (NPV)
The NPV method is adopted in this work because (i) it considers the dynamic development of relevant economic factors, and (ii) it considers different occurrences of costs and income, regardless of whether the money has been or will be paid or received in the past or the future. This is achieved by deducting the accrued interest (discounting) of all payment flows to a standard reference time (Kaoga et al. Citation2016). The calculation was performed using the following equation (Alham, Gad, and Ibrahim Citation2023; Ali, Lee, and Jang Citation2017; Kaoga et al. Citation2016; Kaoma and Gheewala Citation2021c; Mohamadi et al. Citation2021; Ohunakin et al. Citation2012; Wizelius Citation2009):
Important factors considered when NPV is used to evaluate the costs of energy produced by turbines in kWh at the eight sites include the following:
US dollars (USD) were used for the calculations because of Zambian Kwacha (ZMW) fluctuations.
This study used the inflation rate values for Zambia from May 2022 to June 2023. The inflation rate (i) is 9.9 (Kaoga et al. Citation2016). Zambian banks charge interest rates (r) of 20 to 30%, which makes it difficult for developers to achieve a good return on investment (Bank of Zambia Citation2023). The minimum of 20% was used in this study.
Machine life (n) for turbines is 20 years.
Operational and maintenance (O&M) expenses constitute a significant portion of the overall annual costs associated with wind turbines. Operational costs are recurrent annually, covering routine wind farm operations. These costs are fixed and can be calculated deterministically in a straightforward manner (Kaoma and Gheewala Citation2021a, Citation2021c; Mohamadi et al. Citation2021; Ohunakin et al. Citation2012; Wizelius Citation2009). Conversely, maintenance costs are variable, not easily calculable, and are triggered by stochastic factors. They lack a specific value but are often derived from a range of values. Reports indicate that operation and maintenance costs (Com) typically range from 15 to 30% of the total initial cost, which includes the annual wind turbine cost and other initial expenses (Langer et al. Citation2022). In Zambia, which is a new market for wind power technology, the assumed operation and maintenance cost (Com) is 15% of the initial capital cost of the wind turbine installation system (system price/lifetime).
Most of the selected sites are located in rural areas. However, there is a challenge in terms of transportation. Therefore, costs will mainly be incurred on the transportation of turbines, civil work, and road construction to the site. This cost may be higher than anticipated compared with sites in cities such as Lusaka, the capital city. These were considered to be 10% of the turbine price and civil works; therefore, for remote places, they vary based on distance.
is all the gains within a specific year; revenue from electricity sales, depreciation, production tax credits (PTC), and investment tax credits (ITC) are encompassed in this context (Langer et al. Citation2022).
3.3.3. Internal rate of return (IRR)
A project is considered financially viable when the internal rate of return (IRR) exceeds the financial discount rate, serving as the upper limit for the project’s economic feasibility (Earnest and Wizelius Citation2011; Langer et al. Citation2022). The internal rate of return (IRR) functions as a financial measure to assess investment profitability. This signifies the discount rate at which the net present value (NPV) of the investment equals zero. The formula for the IRR calculation is as follows:
NPV is the net present value, which should be equal to zero when the IRR is calculated.
3.3.4. Levelized cost of electricity (LCOE)
Considering the duration of the project, the levelized cost of electricity (LCOE, USD/kWh) is the current value of the expense incurred to generate one unit of electrical energy. This computation was performed as described in (Langer et al. Citation2022; Zhang et al. Citation2022).
3.3.5. Simple payback period (SPP)
The simple payback period (SPP) denotes the duration required for the initial cash outflows of an investment to be recouped from subsequent cash inflows. This represents the most uncomplicated investment evaluation method, and is computed using the following equation:
summarises the other critical financial assumptions and estimates the wind turbine tower parameters.
Table 5. Summary of financial assumptions.
Table 6. Adapted from Techno-economic assessment of wind energy potential at three locations in South Korea using long-term measured wind data (Langer et al. Citation2022).
4. Results and discussion
4.1. Techno-economic analysis of eight sites
Given financial and time limitations, it is crucial to identify the most appropriate locations for renewable energy farms to meet the outlined goals for renewable energy production (Sim Citation2023). Among the pivotal factors influencing the economic aspects of wind farms, the turbine hub height stands out. Factors such as the electricity tariff (USD/kWh), discount rate (%), and corporate tax rate (%) also significantly affect the economics of wind farms. However, accurately predicting these three parameters is a complex task (Langer et al. Citation2022). provides the techno-economic parameters for the 4 MW generic wind turbine with a 130 m hub height across the eight sites, considering Zambia’s average electricity tariff of 0.07 USD/KWh.
Table 7. Techno-economic parameters for the eight sites using electricity tariff of 0.07 USD/KWh.
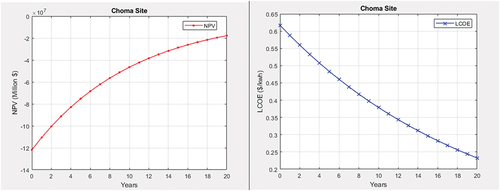
The results of the model showed negative NPV values for the 20 years. Towards the end of the turbine lifetime, the values approach a positive NPV, which can be explained by the negative payback period. This implies that it will take more than 20 years for the wind turbine at the Choma site to break even and start making a profit if the electricity tariff is maintained at 0.07 USD/kWh. The LCOE was at a minimum towards the end of the turbine lifetime. shows the NPV and LCOE results. According to Ali et al (Ali, Lee, and Jang Citation2017; Earnest and Wizelius Citation2011), the optimum hub height is defined as the hub height at which both the LCOE is at a minimum and the NPV is at a maximum, or the LCOE is at its minimum.
Figure 3. Wind turbine economics at 0.07 USD/kWh electricity tariff for Choma site.
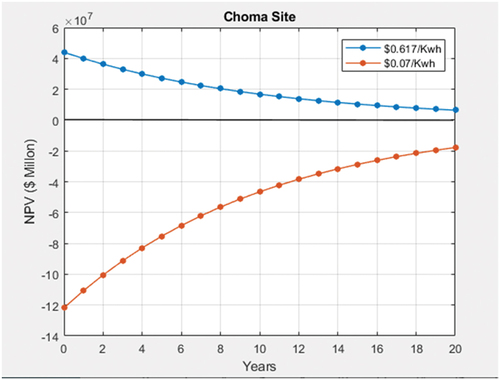
shows the results of the sensitivity analysis for the Choma plant. The highest value of LCOE was 0.617 USD/kWh, and the lowest was 0.232 USD/kWh. Using the LCOE for Lusaka, which is the lowest at 0.182 USD/kWh, as the average electricity tariff for the country, we have positive NPV values for 20 years at a 130 m hub height with an SPP of 5.1 years. The wind farm at a hub height of 130 m generates net profits with an NPV of USD 182 million. The LCOE will be as low as 0.232 USD/kWh (minimum) during the 20-year period. Independent power producers in the wind sector can consider investing in Choma if the electricity tariff is between USD 0.232 and USD 0.617/kWh.
Figure 4. Average electricity tariff (0.07 USD/kWh) and (0.617 USD/kWh) sensitivity analysis for the Choma site.
shows the techno-economic parameters at a 130 m hub height for the Mwinilunga site using Zambia’s average electricity tariff of 0.07 USD/kWh. The results of the model showed negative NPV values for the 20 years. Towards the end of the turbine lifetime, the values approach a positive NPV, which can be explained by the negative payback period. This means that it will take more than 20 years for wind turbines in Mwinilunga to break even and start making a profit if the electricity tariff is maintained at 0.07 USD/kWh. The LCOE was at a minimum towards the end of the turbine lifetime. shows the NPV and LCOE results.
Figure 5. Wind turbine economics at 0.07 USD/kWh electricity tariff for Mwinilunga site.
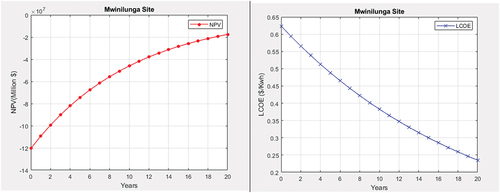
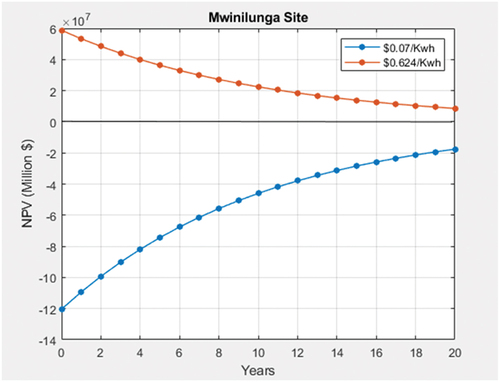
shows the results of the sensitivity analysis for the Mwinilunga plant. The highest value of LCOE was 0.624 USD/kWh, and the lowest was 0.235 USD/kWh. Using the electricity tariff of 0.182 USD/kWh, the lowest LCOE for Lusaka, we have positive NPV values for 20 years at a 130 m hub height, which can be explained by the payback period of 4.6 years. The wind farm, with a hub height of 130 m, generated net profits with an NPV of USD 200 million. The LCOE will be as low as 0.235 USD/kWh (the minimum) during the 20 year period. Independent power producers in the wind sector can consider investing in Mwinilunga if the electricity tariff is between USD 0.235 and USD 0.624/kWh.
Figure 6. Average electricity tariff (0.07 USD/kWh) and (0.624 USD/kWh) sensitivity analysis for Mwinilunga.
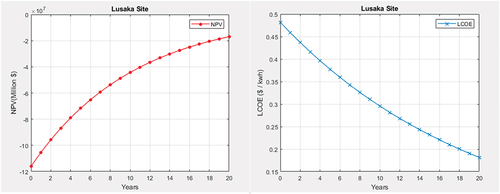
shows the techno-economic parameters at a 130 m hub height for the Lusaka site using Zambia’s average electricity tariff of 0.07 USD/kWh. The model results showed that Lusaka had the lowest NPV values for 20 years. Towards the end of the turbine lifetime, the values approach a positive NPV, which can be explained by the negative payback period. This means that it will take more than 20 years for wind turbines in Lusaka to break even and start making a profit if the electricity tariff is maintained at 0.07 USD/kWh. The LCOE was at a minimum towards the end of the turbine lifetime. shows the NPV and LCOE results.
Figure 7. Wind turbine economics at 0.07 USD/kWh electricity tariff for Lusaka site.
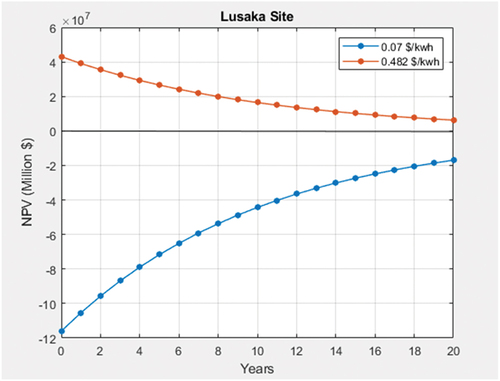
shows the sensitivity analysis results for the Lusaka plant. The highest value of LCOE was 0.482 USD/kWh, while the lowest was 0.182 USD/kWh. Using the average electricity tariff of 0.182 USD/kWh, we have positive NPV values for 20 years at a 130 m hub height; this can be explained by the payback period of negative 2.9 years. The wind farm, with a hub height of 130 m, generated net profits with an NPV of USD 316 million. The LCOE will be as low as USD 0.182/kWh (minimum) during the 20 year period. Independent power producers in the wind sector can consider investing in Lusaka if the electricity tariff is between USD 0.182 and USD 0.482/kWh.
Figure 8. Average electricity tariff (0.07 USD/kWh) and (0.482 USD/kWh) sensitivity analysis for Lusaka.
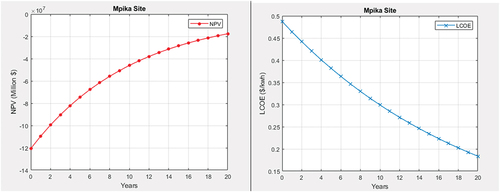
displays the techno-economic parameters at a 130 m hub height for the Mpika site using Zambia’s average electricity tariff of 0.07 USD/kWh. The model results showed negative NPV values for the 20 years. Towards the end of the turbine lifetime, the values approach a positive NPV, which can be explained by the negative payback period. This means that it will take more than 20 years for the wind turbines in Mpika to break even and profit if the electricity tariff is maintained at 0.07 USD/kWh. The LCOE was at a minimum towards the end of the turbine lifetime. shows the NPV and LCOE results.
Figure 9. Wind turbine economics at 0.07 USD/kWh electricity tariff for Mpika site.
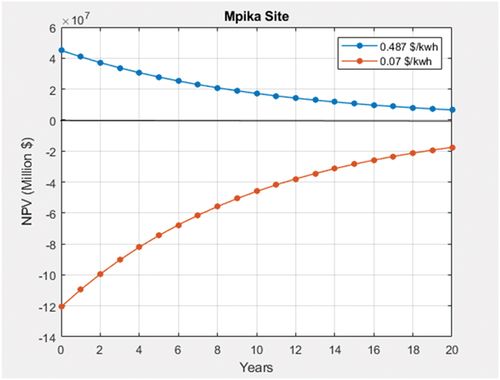
shows the sensitivity analysis results for the Mpika plant. The highest value of LCOE is USD 0.487 USD/kWh, and the lowest is USD 0.487 USD/kWh. Using the LCOE for Lusaka, which is the lowest at USD 0.182/kWh, as the average electricity tariff, we have positive NPV values for 20 years at a 130 m hub height, which can be explained by the payback period of 4.6 years. The wind farm, at a hub height of 130 m, generated net profits with an NPV of USD 201 million. The LCOE would be as low as USD 0.182/kWh (minimum) during the 20-year period. Independent power producers in the wind sector can consider investing in Mpika if the electricity tariff is between USD 0.182 and USD 0.487/kWh.
Figure 10. Average electricity tariff (0.07 USD/kWh) and (0.487 USD/kWh) sensitivity analysis for Mpika.
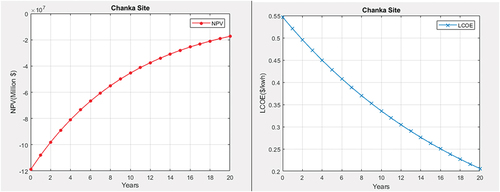
shows the techno-economic parameters at a 130 m hub height for the Chanka site using Zambia’s average electricity tariff of 0.07 USD/kWh. The results of the model showed negative NPV values for the 20 years. Towards the end of the turbine lifetime, the values approach a positive NPV, which can be explained by the negative payback period. This means that it will take more than 20 years for wind turbines in China to break even and start making a profit if the electricity tariff is maintained at 0.07 USD/kWh. The LCOE was at a minimum towards the end of the turbine lifetime. shows the NPV and LCOE results.
Figure 11. Wind turbine economics at 0.07 USD/kWh electricity tariff for Chanka site.
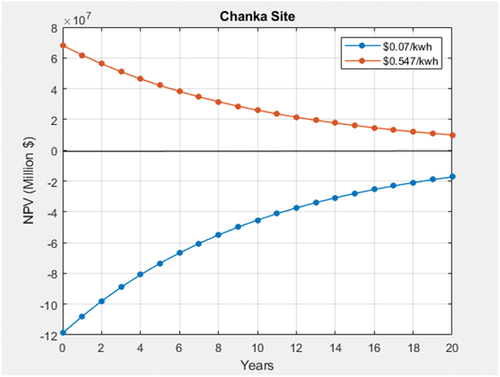
shows the sensitivity analysis results for the chanka plant. The highest LCOE value was 0.547 USD/kWh, whereas the lowest was 0.206 USD/kWh. Using the average electricity tariff of 0.182 USD/kWh as the average electricity tariff, we have positive NPV values for 20 years at a 130 m hub height, which can be explained by the payback period of 3.9 years. The wind farm, at a hub height of 130 m, generated net profits with an NPV of USD 235 million. The LCOE will be as low as USD 0.206/kWh (minimum) during the 20 year period. Independent power producers in the wind sector can consider investing in Chanka if the electricity tariff is between USD 0.206 and USD 0.547/kWh.
Figure 12. Average electricity tariff (0.07 USD/kWh) and (0.547 USD/kWh) sensitivity analysis for Chanka.
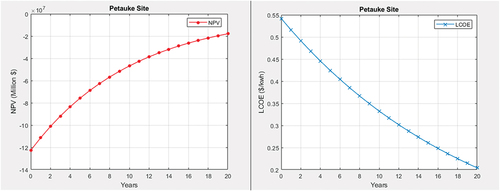
displays the techno-economic parameters at a 130 m hub height for the Petauke site using Zambia’s average electricity tariff of USD 0.07/kWh. The results of the model showed negative NPV values for the 20 years. Towards the end of the turbine lifetime, the values approach a positive NPV, which can be explained by the negative payback period. This means that it will take more than 20 years for wind turbines in Petauke to break even and start making a profit if the electricity tariff is maintained at 0.07 USD/kWh. The LCOE was at a minimum towards the end of the turbine lifetime. shows the NPV and LCOE results.
Figure 13. Wind turbine economics at 0.07 USD/kWh electricity tariff for Petauke site.
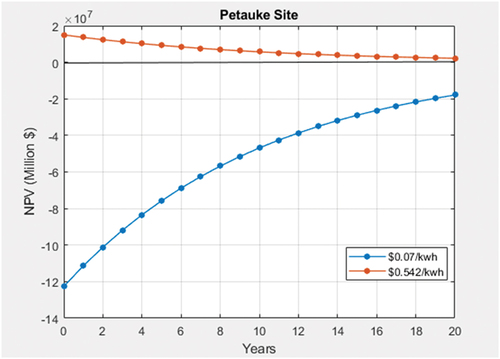
shows the sensitivity analysis results for the Petauke plant. The highest LCOE value was 0.542 USD/kWh, whereas the lowest was 0.204 USD/kWh. Using the average electricity tariff, the lowest LCOE of 0.182 USD/kWh for Lusaka, we have positive NPV values for 20 years at a 130 m hub height, which can be explained by the payback period of 5.7 years. The wind farm, at a hub height of 130 m, generated net profits with an NPV of USD 163 million. The LCOE will be as low as USD 0.204/kWh (minimum) during the 20 year period. Independent power producers in the wind sector can consider investing in Petauke if the electricity tariff is between USD 0.204 and USD 0.542/kWh.
Figure 14. Average electricity tariff (0.07 USD/kWh) and (0.542 USD/kWh) sensitivity analysis for Petauke.
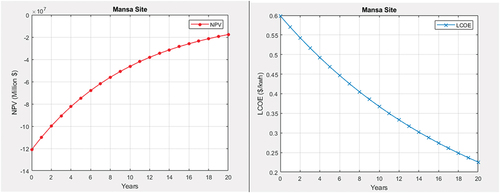
displays the techno-economic parameters at a 130 m hub height for the Mansa site using Zambia’s average electricity tariff of 0.07 USD/kWh. The results of the model showed negative NPV values for the 20 years. Towards the end of the turbine lifetime, the values approach a positive NPV, which can be explained by the negative payback period. This means that it will take more than 20 years for wind turbines in Mansa to break even and start making a profit if the electricity tariff is maintained at 0.07 USD/kWh. The LCOE was at a minimum towards the end of the turbine lifetime. shows the NPV and LCOE results.
Figure 15. Wind turbine economics at 0.07 USD/kWh electricity tariff for Mansa site.
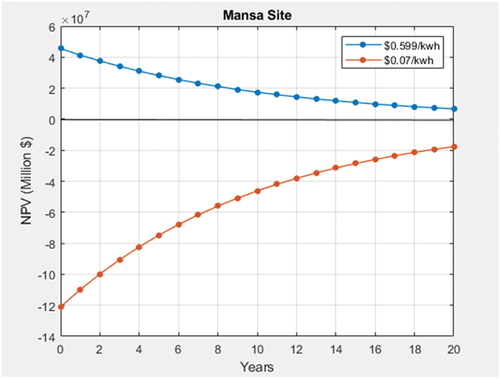
shows the sensitivity analysis results for the Mansa plant. The highest and lowest values of LCOE were 0.599 USD/kWh and 0.226 USD/kWh, respectively. Using the average electricity tariff, which is the LCOE of 0.182 USD/kWh for Lusaka, we have positive NPV values for 20 years at a 130 m hub height, which can be explained by the payback period of 4.9 years. The wind farm, at a hub height of 130 m, generated net profits with an NPV of $ 191 million. The LCOE will be as low as 0.226 USD/kWh (minimum) during the 20 year period. Independent power producers in the wind sector can consider investing in Mansa if the electricity tariff is between USD 0.226 and USD 0.599/kWh.
Figure 16. Average electricity tariff (0.07 USD/kWh) and (0.599 USD/kWh) sensitivity analysis for Mansa.
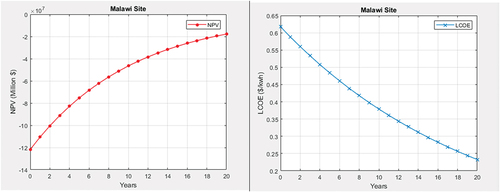
displays the techno-economic parameters at a 130 m hub height for the Malawi site using Zambia’s average electricity tariff of 0.07 USD/kWh. The results of the model showed negative NPV values for the 20 years. Towards the end of the turbine lifetime, the values approach a positive NPV, which can be explained by the negative payback period. This means that it will take more than 20 years for wind turbines in Malawi to break even and start making a profit if the electricity tariff is maintained at 0.07 USD/kWh. The LCOE was at a minimum towards the end of the turbine lifetime. shows the NPV and LCOE results.
Figure 17. Wind turbine economics at 0.07 USD/kWh electricity tariff for Malawi site.
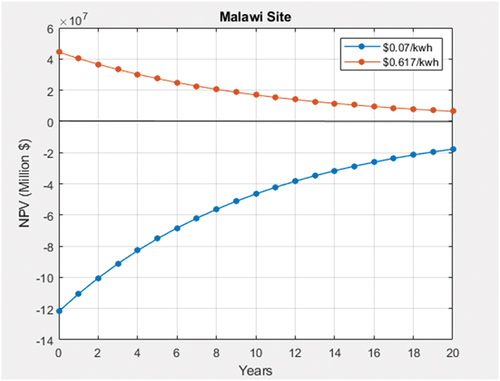
shows the sensitivity analysis results for the Malawi plant. The highest value of LCOE was 0.617 USD/kWh, and the lowest was 0.233 USD/kWh. Using the average electricity tariff of 0.182 USD/kWh, the lowest LCOE for Lusaka, we have positive NPV values for 20 years at a 130 m hub height, which can be explained by the payback period of 5.1 years. The wind farm, with a hub height of 130 m, generated net profits with an NPV of $ 180 million. The LCOE will be as low as 0.233 USD/kWh (the minimum) during the 20 year period. Independent power producers in the wind sector can consider setting up wind farms near the Malawi site if electricity tariffs are between USD 0.233/kWh and USD 0.617/kWh.
Figure 18. Average electricity tariff (0.07 USD/kWh) and (0.617 USD/kWh) sensitivity analysis for Malawi.
An average electricity tariff of 0.182 USD/kWh, representing the lowest LCOE for Lusaka, was utilised to analyse all eight sites. Other factors that may influence price include the company’s preferred profit margin, interest rates, taxes, government subsidies, and social and environmental factors. summarises the results for the economic feasibility of the onshore wind energy potential using the average electricity tariff of 0.182 USD/kWh for the eight sites.
Table 8. Techno-economic parameters using the average electricity tariff of 0.182 USD/kWh.
According to Boardman (Boardman Citation1991), energy is considered unaffordable for low-income families if it exceeds 10% of the average annual income. In the case of low-income Zambian households with an average annual income of USD 900 and electricity consumption of 600 kWh/yr, this results in an average tariff of USD 0.12/kWh (Bank of Zambia Citation2023; Energy Regulation Board, Zambia Electricity Cost of Service Study Citation2023). This amount represents approximately 10% of the annual income dedicated to electricity. It is important to note that although this is below the cost-reflective tariffs determined for the sites, it is higher than the subsidised tariff of USD 0.07. However, it is worth noting that the latter is subsidised by the Zambia Government through ZESCO Limited, even though they purchase electricity from independent power producers at cost-reflective production costs. Therefore, it is expected that low-income households can afford electricity if ZESCO Limited is the off-taker of wind-generated electricity. On the contrary, they may not be able to afford electricity if they buy it directly from independent power producers.
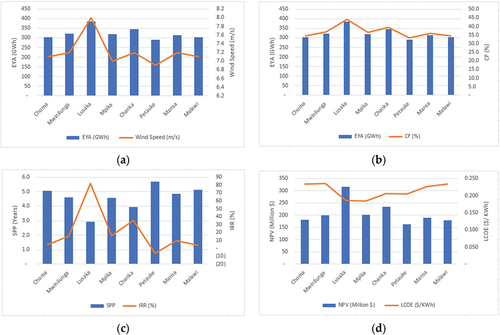
Wind energy technologies have experienced a significant decrease in cost over the last two decades, but the factors driving these cost reductions are not well understood (Elia et al. Citation2020; Hulio, Jiang, and Rehman Citation2017). illustrates parameter estimations of the sites. An economic assessment is crucial when making substantial investments in installing utility-scale wind turbines for wind power production. Initially, a site-specific analysis of wind characteristics was conducted. Subsequently, the selection of wind turbines was examined by considering the mechanical configuration suitable for the site (Gaddada and Kodicherla Citation2016; Mutale and Wang Citation2014).
Figure 19. Parameter estimations of the sites: (a) EYA and wind speed; (b) EYA and CF; (c) SPP and IRR; (d) IRR and PBP.
In recent years, the utilisation of renewable energy resources, particularly wind energy conversion systems (WECSs), for electricity generation has become more prevalent globally. However, there is a scarcity of studies in the literature focusing on the economic and energetic aspects of these systems (Gaddada and Kodicherla Citation2016). Economic evaluation relies on various assumptions, including the EYA and total power price. Worst-case scenarios, such as a potential decrease in power prices or EYA leading to company loss, were considered in the analysis. Risk assessment through a sensitivity analysis provides a clear understanding of this position. Cash flow analysis calculates the annual cash flow, annual revenues, maintenance costs, capital costs, and surplus.
In , the relationship between EYA and wind speed is depicted. The graph indicates that Lusaka, with its highest EYA of 386 GWh, had the highest wind speed of 8 m/s. Conversely, Petauke, having an EYA of 291.5 GWh, exhibited the lowest wind speed at 6.9 m/s. illustrates the connection between the EYA and the capacity factor. The results reveal that Lusaka, with the highest EYA, boasts the highest capacity factor at 44%, whereas Petauke records the lowest capacity factor at 33.2%. illustrates the relationship between EYA, SPP, and IRR. Lusaka demonstrates the lowest simple payback period (SPP) of 2.9 years and an internal rate of return (IRR) of 82%, indicating high profitability. Conversely, Petauke exhibits the highest SPP of 5.7 years and a negative IRR (−6%), making it the least profitable site due to lower EYA and wind speeds. The negative IRR in Petauke suggests an unviable investment. presents the connection between the net present value (NPV) and levelized cost of electricity (LCOE). Lusaka attained the highest NPV of approximately 200 million dollars, associated with the lowest LCOE of USD 0.182/kWh. Conversely, Petauke recorded the lowest NPV of 163 million dollars coupled with the highest LCOE of USD 0.235/kWh. This implies that Lusaka has the lowest production cost per kWh, whereas Mwinilunga has the highest. The extended distance from Lusaka to Mwinilunga (approximately 913.1 km) may have contributed to increased production costs per kWh, accounting for transportation and contingency costs.
Previous studies may have assessed the levelized cost of electricity (LCOE) and net present value (NPV) of wind energy projects in different regions or countries. Comparing the LCOE and NPV values obtained in this study with similar studies can help validate the economic feasibility of wind energy projects in Zambia (Mulugetta and Richard Citation2005; Söderholm and Pettersson Citation2011). The sensitivity analysis conducted in the study provides insights into how changes in key parameters, such as electricity tariff and hub height, affect the financial viability of wind energy projects. Similar studies on sensitivity analysis in renewable energy projects can be referenced to support the findings (Connolly et al. Citation2010; Ganjei et al. Citation2022; Juaidi Citation2019).
5. Conclusions
This article is the first comprehensive economic feasibility study of wind energy generation in Zambia. Its significance lies in its focused evaluation of the financial viability of wind power projects, taking into account Zambia’s unique energy challenges, geographical features, and renewable energy potential. The study addresses a critical gap in the existing literature by offering valuable insights into the feasibility of wind energy as a solution to Zambia’s energy needs. Additionally, it provides detailed policy recommendations based on the findings, such as reducing electricity tariff subsidies, developing feed-in tariff (FiT) schemes and green certificates, and establishing viable power purchase agreements to encourage investment in wind energy projects.
This study evaluated the economic feasibility of onshore wind energy for electricity generation at eight sites in Zambia. A comprehensive economic analysis was performed to determine the viability of these sites, each considering a 25-turbine layout with 4 MW generic wind turbines at a hub height of 130 metres. The economic assessment used net present value (NPV), simple payback period (SPP), internal rate of return (IRR), and levelized cost of electricity (LCOE) as indicators. The findings indicated that the Lusaka wind farm was the most economical, with an energy yield analysis (EYA) of 386 GWh, wind speed of 8 m/s, NPV of 316 million dollars, SPP of 2.9 years, IRR of 82%, and LCOE of USD 0.182/kWh. The other seven sites were also found to be economically feasible, with Petauke being the least viable, showing an EYA of 291.5 GWh, wind speed of 6.9 m/s, NPV of 163 million dollars, SPP of 5.7 years, and a negative IRR of 6%. Transportation costs have notably increased expenses, particularly for plants in remote locations.
The calculations of electricity costs and sensitivity analysis reveal a range of electricity costs compared to the current rate in Zambia, which is USD 0.07/kWh. This study shows that using the current average electricity tariff would make the projects unprofitable. Therefore, it is recommended to use the levelized cost of electricity (LCOE) as a benchmark for setting electricity tariffs at each location. Given the significant potential of wind power for electricity generation, this study suggests that the Government, Rural Electrification Authority (REA), and independent power producers use this data for energy policy formulation and wind project implementation.
6. Future Work
For future work, it is imperative to collect long-term wind data from the selected wind farm sites to enhance the accuracy of energy yield predictions and economic feasibility assessments. Long-term data collection would aid in better-comprehending wind patterns and variability, thereby reducing uncertainties in project planning and decision-making. Furthermore, there is a need to evaluate the potential impact of proposed policy interventions, such as reducing subsidies for electricity tariffs and implementing feed-in tariff (FiT) schemes, on the attractiveness of wind energy investments in Zambia. This assessment could entail modelling different policy scenarios and analysing their effects on project economics and investor incentives. Additionally, other studies should focus on conducting community engagement activities and social impact assessments to understand the perspectives, concerns, and preferences of local communities living near proposed wind farm sites. This could assist in addressing potential social and environmental challenges associated with wind energy projects and ensuring sustainable development.
Further studies can explore advancements in wind turbine technology that can be installed in Zambia, such as improved rotor designs, advanced control systems, and energy storage solutions, to enhance the efficiency and performance of wind power projects. Moreover, investigating innovative financing mechanisms, such as green bonds or public-private partnerships, to facilitate investment in renewable energy infrastructure is crucial. Furthermore, for future wind assessments and related studies in Zambia, it is recommended to employ computational fluid dynamics (CFD) for wind flow modelling to mitigate horizontal extrapolation uncertainties. Another area of research could involve exploring the potential for integrating wind energy with other renewable energy sources, such as solar photovoltaic (PV) systems or hydropower plants, to create hybrid energy systems. This holistic approach could optimise energy generation, enhance grid stability, and mitigate the variability of renewable energy sources.
Author contributions
S.M. drafted, wrote, reviewed, and edited the manuscript. A.B.: draft, writing, reviewing, and editing. J.Y.: Review and editing. T.A.: Review and editing. Y.W.: supervision, review, and editing. All the authors have read and agreed to the published version of the manuscript.
Nomenclature
| LCOE | = | Levelised Cost of Electricity |
| PV | = | Photovoltaic |
| RE | = | Renewable Energy |
| WACC | = | Weighted Average Cost of Capital |
| GHG | = | Greenhouse gases |
| IRR | = | Internal Rate of Return [%] |
| NPV | = | Net Present Value [$] |
| SPP | = | Simple Payback Period |
| UCE | = | Cost per kWh of electricity generated |
| O&M | = | Operation and Maintenance |
| CFD | = | Computational Fluid Dynamics |
| FiT | = | Feed-in tariff |
| AEP | = | Annual Energy Production |
| WECS | = | Wind Energy Conversion Systems |
| ESMAP | = | Energy Sector Management Assistance |
| EYA | = | Energy Yield Analysis |
| Bt | = | Benefits |
| Ct | = | Costs |
| r | = | Discount rate |
| It | = | Investment made in year |
| Dt | = | |
| Tl | = | |
| Com | = | |
| v | = | wind speed (m/s). |
| MWh | = | MegaWatt hour |
| MWh/yr | = | MegaWatt hour per year |
| GWh | = | Gigawatt hour |
| GWh/yr | = | GigaWatt hour per year |
| WTG | = | Wind Turbine Generator |
| Cp | = | Power Coefficient |
| KWh | = | KiloWatt hour |
| Cf | = | Capacity Factor |
Acknowledgments
This work was also supported by the School of New Energy, North China Electric Power University (Chinese Scholarship Council, 2020), and the University of Zambia (Staff Development Programme, Technology Development and Advisory Unit and School of Engineering).
Disclosure statement
No potential conflict of interest was reported by the author(s).
Data availability statement
The data that support the findings of this study are available from the corresponding author, S.M, upon reasonable request.
Additional information
Notes on contributors
Sydney Mutale
Sydney Mutale is a Researcher at North China Electric Power University. He is also a Researcher, Lecturer and Renewable Energy Expert at the University of Zambia.
Yong Wang
Yong Wang is a Professor in Renewable Energy and Clean Energy Expert at North China Electric Power University.
Jan Yasir
Jan Yasir is a Researcher in Renewable Energy and Clean Energy at North China Electric Power University.
Amos Banda
Amos Banda is a Researcher and Expert in Renewable Energy at the University of Zambia.
Traore Aboubacar
Traore Aboubacar is a Researcher in Renewable Energy and Clean Energy at North China Electric Power University.
References
- Abdelhadya, S., D. Borelloc, and S. Santoric. 2015. “Economic Feasibility of Small Wind Turbines for Domestic Consumers in Egypt Based on the New Feed-In Tariff.” Energy Procedia 75:664–670. https://doi.org/10.1016/j.egypro.2015.07.482.
- Alham, M. H., M. F. Gad, and D. K. Ibrahim. 2023. “Potential of Wind Energy and Economic Assessment in Egypt Considering Optimal Hub Height by Equilibrium Optimizer.” Ain Shams Engineering Journal 14:101816. https://doi.org/10.1016/j.asej.2022.101816.
- Ali, S., S. Lee, and C. Jang. 2017. “Techno-Economic Assessment of Wind Energy Potential at Three Locations in South Korea Using Long-Term Measured Wind Data.” Energies 10 (9): 1442. https://doi.org/10.3390/en10091442.
- Almutairi, K., S. S. H. Dehshiri, S. J. H. Dehshiri, A. Mostafaeipour, and K. Techato. 2022. “An Economic Investigation of the Wind-Hydrogen Projects: A Case Study.” International Journal of Hydrogen Energy 47 (62): 25880–25898. https://doi.org/10.1016/j.ijhydene.2022.05.070.
- Bank of Zambia. Accessed August 23, 2023. https://www.boz.zm/statistics.htm.
- Barter, G. E., L. Sethuraman, P. Bortolotti, J. Keller, and D. A. Torrey. 2023. “Beyond 15 MW: A Cost of Energy Perspective on the Next Generation of Drivetrain Technologies for Offshore Wind Turbines.” Applied Energy 344:121272. https://doi.org/10.1016/j.apenergy.2023.121272.
- Boardman, B. 1991. Fuel Poverty: From Cold Homes to Affordable Warmth, London, UK: Belhaven Press. Accessed January 17, 2023. https://www.sciencedirect.com/science/article/abs/pii/S0306261921013623.
- Connolly, D., H. Lund, B. V. Mathiesen, and M. Leahy. 2010. “A Review of Computer Tools for Analysing the Integration of Renewable Energy into Various Energy Systems.” Applied Energy 87 (4): 1059–1082.
- DNV Report. Accessed August 13, 2023. https://www.moe.gov.zm/wp-content/uploads/2022/06/Zambia-Wind-Measurements-24-month-report-May20191.pdf.
- Earnest, J., and T. Wizelius. 2011. Wind Power Plants and Project Development. New Delhi, India: PHI Learning Pvt. Ltd. ISBN:978-81-203-3986-6.
- Elia, A., M. Taylor, B. O. Gallachoir, and F. Rogan. 2020. “Wind Turbine Cost Reduction: A Detailed Bottom-Up Analysis of Innovation Drivers.” Energy Policy 147:111912. https://doi.org/10.1016/j.enpol.2020.111912.
- Energy Regulation Board, Zambia Electricity Cost of Service Study. Accessed August 30, 2023. https://www.erb.org.zm.
- Ertürk, M. 2012. “The Evaluation of Feed-In Tariff Regulation of Turkey for Onshore Wind Energy Based on the Economic Analysis.” Energy Policy 45:359–367. https://doi.org/10.1016/j.enpol.2012.02.044.
- Feng, R., and L. Wencheng. 2023. “LSSA-BP-based Cost Forecasting for Onshore Wind Power.” Energy Reports 9:362–370. https://doi.org/10.1016/j.egyr.2022.11.196.
- Gaddada, S., and S. P. K. Kodicherla. 2016. “Wind Energy Potential and Cost Estimation of Wind Energy Conversion Systems (WECSs) for Electricity Generation in the Eight Selected Locations of Tigray Region (Ethiopia).” Renewables 3 (1): 10. https://doi.org/10.1186/s40807-016-0030-8.
- Ganjei, N., F. Zishan, R. Alayi, H. Samadi, M. Jahangiri, R. Kumar, A. Mohammadian, and J. Lobato. 2022. “Designing and Sensitivity Analysis of an Off-Grid Hybrid Wind-Solar Power Plant with Diesel Generator and Battery Backup for the Rural Area in Iran.” The Journal of Engineering 2022:1–14. https://doi.org/10.1155/2022/4966761.
- Harrucksteiner, A., J. Thakur, K. Franke, and F. Sensfuß. 2023. “A Geospatial Assessment of the Techno-Economic Wind and Solar Potential of Mongolia.” Sustainable Energy Technologies and Assessments 55:102889. https://doi.org/10.1016/j.seta.2022.102889.
- Himri, Y., M. Merzouk, N. K. Merzouk, and S. Himrid. 2020. “Potential and Economic Feasibility of Wind Energy in South West Region of Algeria.” Sustainable Energy Technologies and Assessments 38:100643. https://doi.org/10.1016/j.seta.2020.100643.
- Hulio, Z. H., W. Jiang, and S. Rehman. 2017. “Technical and Economic Assessment of Wind Power Potential of Nooriabad, Pakistan.” Energy, Sustainability and Society 7 (1): 35. https://doi.org/10.1186/s13705-017-0137-9.
- Juaidi, A. 2019. “Urban Design to Achieving the Sustainable Energy of Residential Neighbourhoods in Arid Climate.” Journal of Cleaner Production 228:135–152. https://doi.org/10.1016/j.jclepro.2019.04.269.
- Kaoga, D. K., B. Bogno, M. Aillerie, D. Raidandi, S. D. Yamigno, O. Hamandjoda, and B. Tibi. 2016. “Assessment of Wind Energy Potential and Cost Estimation of Wind-Generated Electricity at Hilltops Surrounding the City of Maroua in Cameroon.” AIP Conference Proceedings 1758:020012. https://doi.org/10.1063/1.4959388.
- Kaoma, M., and S. H. Gheewala. 2021a. “Evaluation of the Enabling Environment for the Sustainable Development of Rural-Based Bioenergy Systems in Zambia.” Energy Policy 154:112337. https://doi.org/10.1016/j.enpol.2021.112337.
- Kaoma, M., and S. H. Gheewala. 2021b. “Sustainability Performance of Lignocellulosic Biomass-To-Bioenergy Supply Chains for Rural Growth Centres in Zambia.” Sustainable Production and Consumption 28:1343–1365. https://doi.org/10.1016/j.spc.2021.08.007.
- Kaoma, M., and S. H. Gheewala. 2021c. “Techno-Economic Assessment of Bioenergy Options Using Crop and Forest Residues for Non-Electrified Rural Growth Centres in Zambia.” Biomass and Bioenergy 145:105944. https://doi.org/10.1016/j.biombioe.2020.105944.
- Krauland, A. V., Q. Long, P. Enevoldsen, and M. Z. Jacobson. 2023. “United States Offshore Wind Energy Atlas: Availability, Potential, and Economic Insights Based on Wind Speeds at Different Altitudes and Thresholds and Policy-Informed Exclusions.” Energy Conversion and Management: X 20:100410. https://doi.org/10.1016/j.ecmx.2023.100410.
- Kumi, E. N., and M. Mahama. 2023. “Greenhouse Gas (GHG) Emissions Reduction in the Electricity Sector: Implications of Increasing Renewable Energy Penetration in Ghana’s Electricity Generation Mix.” Scientific African 21:e01843. https://doi.org/10.1016/j.sciaf.2023.e01843.
- Langer, J., S. Simanjuntak, S. Pfenninger, J. Quist, H. P. Rahayu, and K. Blok. 2022. “How Offshore Wind Could Become Economically Attractive in Low-Resource Regions Like Indonesia.” iScience 25 (9): 945. https://doi.org/10.1016/j.isci.2022.104945.
- Lehmann, P., F. Reutter, and P. Tafarte. 2023. “Optimal Siting of Onshore Wind Turbines: Local Disamenities Matter.” Resource and Energy Economics 74:101386. https://doi.org/10.1016/j.reseneeco.2023.101386.
- Linnerud, K., A. Dugstad, and B. J. Rygg. 2022. “Do People Prefer Offshore to Onshore Wind Energy? The Role of Ownership and Intended Use.” Renewable and Sustainable Energy Reviews 168:112732. https://doi.org/10.1016/j.rser.2022.112732.
- Manoo, M. U., F. Shaikh, L. Kumar, and M. Arıcı. 2023. “Comparative Techno-Economic Analysis of Various Stand-Alone and Grid Connected (Solar/Wind/Fuel Cell) Renewable Energy Systems.” International Journal of Hydrogen Energy 52:397–414. https://doi.org/10.1016/j.ijhydene.2023.05.258.
- Mardones, C. 2023. “Economic, Environmental, and Social Assessment of the Replacement of Coal-Fired Thermoelectric Plants for Solar and Wind Energy in Chile.” Journal Cleaner Production 411:137343. https://doi.org/10.1016/j.jclepro.2023.137343.
- Mohamadi, H., A. Saeedi, Z. Firoozi, S. S. Zangabadi, and S. Veisi. 2021. “Assessment of Wind Energy Potential and Economic Evaluation of Four Wind Turbine Models for the East of Iran.” Heliyon 7 (6): e07234. https://doi.org/10.1016/j.heliyon.2021.e07234.
- Mostafaeipour, A., M. Jadidi, K. Mohammadi, and A. Sedaghat. 2014. “An Analysis of Wind Energy Potential and Economic Evaluation in Zahedan, Iran.” Renewable and Sustainable Energy Reviews 30:641–650. https://doi.org/10.1016/j.rser.2013.11.016.
- Mulugetta, Y., and E. W. Richard. 2005. “The Dynamics of Renewable Energy Penetration in the UK: A LCOE Approach.” Energy Policy 33 (7): 893–902.
- Mutale, S., A. Banda, Y. Wang, and J. Yasir. “Capability of Zambian Industries to Manufacture Grid-Scale Wind Turbine Blades and Towers.” Preprints 2023:2023091621. https://doi.org/10.20944/preprints202309.1621.v1.
- Mutale, S., and X. Wang. 2014. “Levels of Automation in Quality Sampling and Analysis of Copper.” Industrial Engineering Letters 4 (4): 89–102.
- Mwanza, M., M. Kaoma, C. K. Bowa, M. Sumbwanyambe, J. Pretorius, and K. Ulgen. 2022. “Techno-Economic Analysis of Wind/PV Hybrid System for Sustainable and Clean Energy Production for Shang’ombo District of Zambia.” Proceedings of the 2022 International Symposium on Energy Management and Sustainability, Online, 9 April 2022, Cham, Switzerland. Springer. https://doi.org/10.1007/978-3-031-30171-1_46.
- National Energy Policy. 2023. “Ministry of Energy.” Lusaka, Zambia: Department of Energy. Accessed August 2, 2023. https://www.moe.gov.zm/?page_id=1606.
- Odoi-Yorke, F., T. F. Adu, B. C. Ampimah, and L. Atepor. 2022. “Techno-Economic Assessment of a Utility-Scale Wind Power Plant in Ghana.” Energy Conversion and Management: X 18:1424–1443. https://doi.org/10.1016/j.ecmx.2023.100375.
- Ohunakin, O. S., O. J. Matthew, M. S. Adaramola, O. E. Atiba, D. S. Adelekan, O. O. Aluko, E. U. Henry, and V. U. Ezekiel. 2023. “Techno-Economic Assessment of Offshore Wind Energy Potential at Selected Sites in the Gulf of Guinea.” Energy Conversion and Management 288:117110. https://doi.org/10.1016/j.enconman.2023.117110.
- Ohunakin, S. O., S. O. Joshua, S. B. Ogunsina, and R. R. Dinrifo. 2012. “Analysis of Cost Estimation and Wind Energy Evaluation Using Wind Energy Conversion Systems (WECS) for Electricity Generation in Six Selected High Altitude Locations in Nigeria.” Energy Policy 48:594–600. https://doi.org/10.1016/j.enpol.2012.05.064.
- Quinna, R., G. Schepersb, and B. Bulder. 2016. “A Parametric Investigation into the Effect of Low Induction Rotor (LIR) Wind Turbines on the Levelised Cost of Electricity for a 1 GW Offshore Wind Farm in a North Sea Wind Climate.” Energy Procedia 94:164–172. https://doi.org/10.1016/j.egypro.2016.09.213.
- Renewable Energy Strategy and Action Plan, Energy Regulation Board. Accessed August 23, 2023. https://www.erb.org.zm/renewable.
- Satymov, R., D. Bogdanov, and C. Breyer. 2022. “Global-Local Analysis of Cost-Optimal Onshore Wind Turbine Configurations Considering Wind Classes and Hub Heights.” Energy 256:124629. https://doi.org/10.1016/j.energy.2022.124629.
- Savino, M. M., R. Manzini, V. D. Selva, and R. Accorsi. 2017. “A New Model for Environmental and Economic Evaluation of Renewable Energy Systems: The Case of Wind Turbines.” Applied Energy 189:739–752. https://doi.org/10.1016/j.apenergy.2016.11.124.
- Sim, J. 2023. “An Economic Evaluation of Potential Offshore Wind Farm Sites in South Korea Using a Real Options Approach.” Energy Reports 10:29–37. https://doi.org/10.1016/j.egyr.2023.06.007.
- Söderholm, P., and M. Pettersson. 2011. “Offshore Wind Power Policy and Planning in Sweden.” Energy Policy 39 (2): 518–525. https://doi.org/10.1016/j.enpol.2010.05.065.
- Wang, Y., Y. Qin, K. Wang, J. Liu, S. Fu, J. Zou, and L. Ding. 2022. “Where Is the Most Feasible, Economical, and Green Wind Energy? Evidence from High-Resolution Potential Mapping in China.” Journal Cleaner Production 376:134287. https://doi.org/10.1016/j.jclepro.2022.134287.
- Wimalaratna, Y. P., H. N. Afrouzi, K. Mehranzamir, M. B. M. Siddique, S. C. Liew, and J. Ahmed. 2022. “Analysing Wind Power Penetration in Hybrid Energy Systems Based on Techno-Economic Assessments.” Sustainable Energy Technologies and Assessments 53:102538. https://doi.org/10.1016/j.seta.2022.102538.
- Wiser, R., and D. Millstein. 2020. “Evaluating the Economic Return to Public Wind Energy Research and Development in the United States.” Applied Energy 261:114449. https://doi.org/10.1016/j.apenergy.2019.114449.
- Wizelius, T. 2009. Developing Wind Power Project, Theory and Practice. London, UK: Routledge.
- Yang, J.; B. Chen. 2013. “Integrated Evaluation of Embodied Energy, Greenhouse Gas Emission and Economic Performance of a Typical Wind Farm in China.” Renewable and Sustainable Energy Reviews 27:559–568. https://doi.org/10.1016/j.rser.2013.07.024.
- Zhang, Y., C. Ma, Y. Yang, X. Pang, J. Lian, and X. Wang. 2022. “Capacity Configuration and Economic Evaluation of a Power System Integrating Hydropower, Solar, and Wind.” Energy 259:125012. https://doi.org/10.1016/j.energy.2022.125012.
- Zieglera, L., E. Gonzalezc, T. Rubertd, U. Smolkaa, and J. J. Meleroc. 2018. “Lifetime Extension of Onshore Wind Turbines: A Review Covering Germany, Spain, Denmark, and the UK.” Renewable and Sustainable Energy Reviews 82:1261–1271. https://doi.org/10.1016/j.rser.2017.09.100.