
 ?Mathematical formulae have been encoded as MathML and are displayed in this HTML version using MathJax in order to improve their display. Uncheck the box to turn MathJax off. This feature requires Javascript. Click on a formula to zoom.
ABSTRACT
The European Union (EU) has set ambitious recycling targets for plastic packaging waste of 50% and 55% by the end of 2025 and 2030, respectively. Austria’s recycling rate is currently below 30%, necessitating significant improvements in collection, sorting, and recycling efficiencies. To enhance the sorting efficiency, understanding the composition and condition of waste is crucial. Our study focuses on the identification of the recyclable content of polyethylene (PE) films in Upper Austrian waste streams for plastics recycling. This involved the manual sorting of three waste streams through various steps. As a result, the occurrences of monolayer PE films in the post-consumer waste streams were obtained. Based on the apprehended data, a circularity indicator (CI), which is a rough estimation of material circularity that takes into account the losses in both quantity and quality when reprocessing materials, together with a sensitivity analysis was calculated for Austria, which revealed that reducing demand and increasing the amount of recycled materials is more beneficial to the CI than improving energy efficiency. This research fills knowledge gaps on the availability of PE film waste in the various waste streams and can be used as a basis for enhancing the recycling rate in PE film recycling.
1. Introduction
From online purchases to cups to go, plastic packaging is almost everywhere. In the past, the consumption of plastic packaging has been increasing steadily. In the European Union (EU), plastic converters have used approximately 40% of the total plastics demand for packaging in recent years, which amounts to about 20 Mt of plastic (Plastics Europe AISBL Citation2022). When it comes to plastic packaging, flexible packaging cannot be ignored. Analysing the global landscape of plastic packaging demand in 2019, flexible plastics constituted approximately 58% of the total (Statista GmbH, Citation2022). Flexible packaging, encompassing films and bags, has gained considerable popularity due to its multifarious benefits and could be realised as multilayer or monolayer film. Its ability to reduce material usage facilitates convenient storage and transportation. The flexibility of this packaging protects the contents from external factors without causing dents or visual defects. Additionally, its adaptability to conform to product shapes and its cost-effectiveness compared to non-polymeric counterparts underscore its advantages (Barlow and Morgan Citation2013; FPA - Flexible Packaging Association Citation2023; Sawant Citation2022). Nonetheless, flexible packaging is not without its drawbacks, as exemplified by examples like single-use plastic bags, for which EU Member States should take measures to reduce their number according to Directive (EU) 2015/720 (European Parliament and the Council of the European Union Citation2015). Pervasive littering results in adverse environmental consequences including fauna mortality, pollution, obstruction of sewage systems and waterways, and transformation of landscapes. Notably, the extended decomposition period of plastic bags poses a significant environmental concern (Jalil, Mian, and Rahman Citation2013; Ujeh, Citationn.d.).
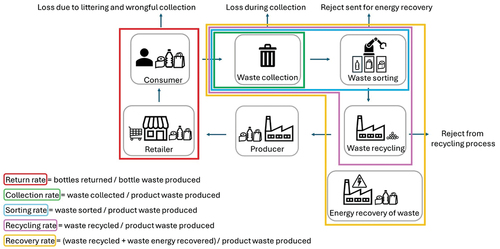
Predominant polymers employed in flexible film production encompass polyethylene low-density (PE-LD) and polyethylene linear low-density (PE-LLD). In the year 2021, the European plastics converters’ demand for these polymer types amounted to approximately 8.5 Mt. According to Plastics Europe (Plastics Europe AISBL Citation2022), the biggest plastics converters’ demand for PE-LD and PE-LLD is for packaging. However, after approximately one year, plastic packaging, and therefore flexible packaging, has reached its end of life. In Europe, only about 45% of flexible films are collected successfully (Plastics Recyclers Europe Citation2020; Wagner Citation2016). See for the definitions of the different rates within the value chain.
Figure 1. Graphical explanation and definitions of return rate, collection rate, sorting rate, recycling rate and recovery rate.
1.1. Best practice in Europe
Looking at the post-consumer plastics waste treatment in 2020, solely a handful of countries exceed recycling rates of 40%. Europe’s ‘best players’ include the Netherlands, Norway, Spain, and Germany, according to data from Plastics Europe (Plastics Europe AISBL Citation2022). This achievement has been made feasible through the implementation of specific strategies:
The Netherlands, leading in post-consumer plastics waste treatment, boasts a recycling rate of 45% and an energy recovery rate of 55% (Plastics Europe AISBL Citation2022). Landfilling plastic waste is not admissible due to landfill bans enacted in 1995, which have been progressively extended to encompass 64 waste categories (Scharff Citation2014). Such regulations emerged from the Netherlands’ struggle with landfill capacity shortages in the late 1980s (Rijkswaterstaat Ministry of Infrastructure and Water Management, Citationn.d.). Local municipalities manage recycling and waste collection, employing curbside collection for low-rise areas and drop-off collection for high-rise zones. The collected lightweight packaging is sorted into distinct categories including polyethylene terephthalate (PET) bottles, PE rigids, polypropylene (PP) rigids, flexible packages, mixed packages, and PET-tray-sorted products. The country also employs a deposit-refund system for PET water and soda bottles (Picuno et al. Citation2021). Considering post-consumer plastic packaging, the Netherlands achieved a recycling rate of 65% by 2020 (Plastics Europe AISBL Citation2022). According to van Velzen et al. the Netherlands reach a film recycling rate of about 50% (van Velzen et al. Citation2013).
Norway has achieved a 44% recycling rate for post-consumer plastics waste (as of 2020), with 54% being subjected to energy recovery and 2% ending up in landfills (Plastics Europe AISBL Citation2022). Norway’s plastic packaging waste system is characterised by two different separation systems. The first is waste being separated at source by households. Here waste collection practices vary at the municipality level, encompassing categories such as biodegradable waste, paper waste, plastic waste, hazardous and minor electrical waste, glass and metal waste, and residual waste (Relocation NO, Citationn.d.). The second system separates plastic packaging waste from mixed waste (residual waste) in material recovery facilities and sorts the packaging waste into different polymer types (Callewaert, Lerche Raadal, and Lyng Citation2023). The nation excels through a well-established deposit-refund system, where PET, polyethylene high-density (PE-HD), and metal beverage containers are returned by customers through a reverse vending process, attaining a return rate of about 93% (Tomra Collection, Citation2022). By the year 2020, Norway showed a post-consumer plastic packaging recycling rate of 49% (Plastics Europe AISBL Citation2022). Concerning the film recycling rate in Norway no data could be found.
Spain reports a recycling rate of 43% for post-consumer plastic waste, with 21% directed towards energy recovery and 36% being landfilled (Plastics Europe AISBL Citation2022). However, it’s important to note that despite seemingly high recycling rates, Spain predominantly relies on landfilling for waste disposal. According to Plastics Europe, Spain reached post-consumer plastic packaging recycling rate of 52% in 2020 (Plastics Europe AISBL Citation2022). Spain reaches a PE flexible packaging recycling rate of about 18% (Plastics Recyclers Europe Citation2019).
Germany reached a recycling rate of 42% in the year of 2020, 57% of the post-consumer plastics waste was treated in energy recovery facilities and 1% was landfilled (Plastics Europe AISBL Citation2022). Germany employs a commingled collection approach for packaging including plastics, metal, and cardboard. Both drop-off and curbside collections are operational. At sorting facilities, plastic packaging waste undergoes further segregation into 12 distinct fractions, including pure polymeric sorted products (PET, PE, PP, and polystyrene (PS)), film fractions, and mixed plastic sorted products. Additionally, Germany has instituted a deposit-refund system for PET bottles (Picuno et al. Citation2021). Germany achieved a post-consumer plastic packaging recycling rate of 55% by 2020 (Plastics Europe AISBL Citation2022). Furthermore, Germany boasts a recycling rate of PE flexible packaging of about 17% (Plastics Recyclers Europe Citation2019).
As stipulated by the Packaging and Packaging Waste Directive (Directive (EU) 2018/852) (European Parliament and the Council of the European Union Citation2018), the EU is tasked with achieving a recycling target for plastic packaging of 50% by the end of 2025 and a further target of 55% by the end of 2030. To calculate the correct recycling rate, it is relevant that everyone uses exactly the same point of calculation that considers also the rejects of the recycling process. The national recycling rates mentioned in the previous paragraphs are based on the old calculation scheme for recycling plastics, where recycling starts with the sorted materials sent for recycling (EU Directive 94/62/EC) (European Parliament and the Council of the European Union Citation1994). Under the new point of calculation, recycling starts with the materials entering extrusion and moulding processes (European Parliament and the Council of the European Union Citation2018). Therefore, Europe’s average recycling rate of 46% according to the old point of calculation would equal 32% under the new plastics recycling calculation scheme.
Austria, on the other hand, has rather low recycling rates compared. When comparing the above-mentioned average recycling rate of 46% for the EU with the recycling rate of 38% for Austria, a significant difference is evident (Plastics Europe AISBL Citation2022).
1.2. Current practice in Austria
Utilising the novel calculation scheme, Austria’s current recycling rate is approximately 25%, clearly deviating from the prescribed benchmarks outlined by the EU and its member states, as elucidated earlier (Altstoff Recycling Austria AG Citation2019). Austria houses 15 dedicated plastic waste sorting facilities, alongside an additional 25 facilities with a distinct emphasis on plastic waste recycling (Neubauer et al. Citation2021). The implementation of a landfill ban in Austria in 2008 (Bundesministers für Land- und Forstwirtschaft, Umwelt und Wasserwirtschaft Citation2022) has prompted the prevalent adoption of recycling and energy recovery mechanisms for plastic waste disposal. According to a 2020 study, approximately 4,500 tons of litter were found along highways, state and county roads, rail and subway lines, in and along waterways, and other access areas such as national parks in Austria (Stoifl and Oliva Citation2020).
Turning to Austria’s plastic waste landscape, the primary waste streams yielded an aggregate of roughly 980,000 tons of plastic waste in 2019, whereas 302,000 tons were plastic packaging waste. Within the total plastic waste fraction, pure plastic waste constituted around 17%, whereas plastic-incorporating waste represents approximately 80%. The remaining constituents included pigments, varnishes (both liquid and solid), plastic sludges, and plasticisers. Notably, the subset of pure plastic waste encompassed 28% in the form of plastic films. The category of plastic-containing waste exhibited a breakdown of 40% municipal and commercial waste, 18% lightweight fractions sourced from packaging collection, 15% unwieldy waste, and 2% construction site waste. Importantly, it is pertinent to acknowledge that all these waste streams potentially contain plastic films (Bundesministerium für Klimaschutz, Umwelt, Energie, Mobilitaet, Innovation und Technologie Citation2021).
1.3. Current practice in Upper Austria
The focus of this investigation pertains to Upper Austria, encompassing residential and small-scale commercial sectors. In the year 2021, plastic packaging derived from the yellow bag system contributed 27,200 tons, and plastic waste amassed from collection centres amounted to 12,900 tons, whereas 7,000 tons were plastic packaging waste (Altenhofer, Bräuer, and Reiner Citation2023). The waste management landscape within Upper Austria is characterised by the implementation of five distinct waste collection mechanisms (Altenhofer, Bräuer, and Reiner Citation2023):
Curbside collection: This operational paradigm involves the collection of recyclable materials and solid waste directly from households. In the Upper Austrian context, this pertains to paper waste (collected in red bins), packaging waste (collected in either yellow bins or yellow bags), and municipal waste (collected in black bins).
Collection centres and islands: Representing discrete collection points, these facilities allow for the separate collection of a diverse array of 80 distinct materials and substances.
Organic waste collection: This collection system has been instituted to enable composting and recycling of organic materials.
Communal container collection: Predicated on strategically positioned communal containers located within public spaces, this approach serves as a convenient means for the gathering of selected waste materials (e.g. glass containers).
Depot container collection: At dedicated depots, specific containers are furnished to streamline the process of efficient and segregated waste disposal, which represents another approach of collecting selected waste materials.
In Upper Austria, films are only collected separately at collection centres. Otherwise, they are sorted out of the yellow bin or yellow bag waste at sorting facilities.
1.4. State of the art
Similar to the research presented, only a limited body has delved into the intricate composition of waste streams. sums up and compares the investigated studies. Lahtela et al. (Lahtela, Hyvärinen, and Kärki Citation2019) centred their investigation on polymer identification within construction and demolition waste, as well as mechanically sorted plastic waste. Their objective was to discern the viability of employing plastic from these waste streams as a potential raw material for recycling applications. Using a handheld separation device based on near-infrared spectra, the study revealed varying polymer compositions in the plastic waste stream, with PP and PE dominating across all sources. Additionally, the study encountered numerous indeterminate and non-identifiable waste components. The authors found small amounts of PE in the form of film in both waste streams. They explained the small amounts by the fact that films have a large volume but a rather low weight.
Table 1. Summary and comparison of the state of the art literature research.
Furthermore, other European researchers investigated flexible packaging as well. Exploring the CEFLEX recycling process for post-consumer flexible packaging, Lase et al. (Lase et al. Citation2022) engaged in material flow analysis, supplemented by performance indicators encompassing quantity and quality. Their investigation showcased that this quality recycling process yielded regranulates of higher quality compared to conventional recycling methods. The study’s essence lay in the discernment that while yields exhibited a marginal increase, superior regranulate quality was attained through supplementary sorting and recycling procedures. Additionally, the study underscored the value of modular material flow analysis in predicting future recycling scenarios and facilitating decision-making.
To gain further insight into the Austrian waste management, the following research papers are summed up:
Other investigations, such as that conducted by van Eygen et al. (van Eygen, Laner, and Fellner Citation2018), adopted a material flow analysis approach to quantitatively and qualitatively scrutinise Austria’s plastic packaging waste management system, despite utilising data from 2013, which remains largely applicable. Their findings unveiled that the bulk of produced waste plastic packaging comprised large and small films, along with small hollow bodies including PET bottles. Notably, 58% ± 3% of the waste was collected separately, with 26% ± 7% of the total waste stream recuperated as regranulates, while the remainder underwent thermal recovery in waste-to-energy plants (40% ± 3%) and the cement industry (33% ± 6%). The authors found that a total amount of about 140,000 tons of small and large films entered the Austrian waste stream. Of these collected films, about 40,500 tons end up as regranulate and mixed regranulate after sorting and preparation. Approximately 16,000 tons end up as residue for industrial incineration after mechanical recycling. A novel calculation perspective, shifting from input to output, was proposed, and this transition was subsequently implemented.
Complementing van Eygen et al.‘s work, Schuch et al. (Schuch et al. Citation2023) employed material flow analysis to examine separate collection rates for plastic packaging in Austria. Their study encompassed different settlement patterns, target fractions, and service levels. Outcomes indicated superior performance in rural areas where plastic packaging waste was primarily collected via curbside collection, with augmented collection through collection centres further enhancing efficiency. Conversely, urban areas exhibited lower collection rates. The authors advocated a transition towards the ‘all plastic packaging’ target fraction to bolster separate collection efforts. The authors did not focus on differentiating between packaging types, product types, or polymers, hence no information is available on films. Nevertheless, the authors recommend extending their research to these fractions to further deepen the knowledge of the collection behaviour.
Koinig et al (Koinig et al. Citation2022). embarked on a hand-sorting trial pertaining to Austrian plastic packaging to unearth the latent recycling potential of multilayer films within the Austrian waste management context. Fourier-transformed infrared spectroscopy was employed to assess the composition of the located films. Their analysis revealed that 31% of the films comprised PE, 39% consisted of PP, 11% were PET composites, and 8% were PE-PP composites. Remarkably, 20w% were identified as multilayer films. By evaluating distinct scenarios entailing diverse sorting and recycling strategies for smaller films, the researchers concluded that substantial increments in recycling rates could be achieved through enhanced sorting processes.
Aligned with the previous research, the present study centres on identifying the recyclable content of PE films within the Upper Austrian waste streams. This endeavour involved manual sorting of three different waste streams, at three sorting levels. The primary objective was to determine the occurrence of monolayer PE films within post-consumer waste streams and to explore their recycling potential. Subsequently, the findings were then extrapolated based on a comprehensive literature review to inform and enrich the study’s findings. In addition, the Circularity Index by Cullen (Cullen Citation2017) was used to benchmark the identified recycling potential and highlight future ways for improvement.
2. Material and methods
2.1. Sample and description
Samples were provided by waste management partners for each of the three waste streams. For this investigation lab samples were gathered based on the quarter method described in LAGA PN 98 (Ministerium für Umwelt und Forsten Rheinland-Pfalz Citation2001). The first stream comprised residual splitting waste from the municipal waste collection process. In Austria, residual waste undergoes two primary treatment pathways, with (a) direct incineration in waste incineration plants or alternative thermal treatment facilities, collectively referred to as ‘energy recovery’, as well as (b) mechanical-biological treatment followed by incineration of residues. Direct incineration typically involves limited pre-sorting, whereas mechanical-biological treatment involves the mechanical separation of high calorific waste from other materials. The high calorific waste undergoes energy recovery, recyclable waste like metals are sent for recycling and low calorific waste gets landfilled (Neubauer et al. Citation2021). For this specific study, samples were sourced from the high calorific (lightweight) fraction of this waste stream which will be further called ‘residual splitting waste’.
The second stream encompassed mixed commercial waste in its pre-treatment state for conversion into refuse-derived fuel (RDF), a product designed to burn more efficiently than the first stream. This RDF undergoes processing that involves shredding, sorting, and other preparatory steps, and is utilised in industrial processes for the generation of heat and power, as required in industries like cement and lime production (Breeze Citation2018). This fraction will further be called ‘mixed commercial waste’.
The third stream is dedicated to plastic packaging, which represents the lightweight packaging waste collection system in Austria and will be further called ‘lightweight waste’. This stream was further subdivided into four distinct sub-streams, notably collection centre (CC) fractions comprising polyethylene low-density (PE-LD) films (‘CC – PE-LD films’) and mixed waste (‘CC – mixed waste’), as well as sorting plant (SP) fractions represented by DSD 310 (‘SP – DSD 310’) and DSD 830 (‘SP – DSD 830’). The two CC sub-streams originate from Upper Austrian collection centres under the administration of O.Ö. Landes-Abfallverwertungsunternehmen GmbH (LAVU). The SP sub-streams, however, emanate from different sorting plants. DSD 310 corresponds to the sorted film fraction, while DSD 830 corresponds to the mixed waste fraction according to the classification of Duales System Deutschland (DSD) GmbH.
2.2. Hand sorting analysis
The samples were examined and underwent three different sorting steps to gather as much information about the recycling potential as possible. The inspected sample masses can be seen in Table S1 in the Supplementary Materials.
The variations in collected mass result from their respective availability. The residual splitting waste, mixed commercial waste, lightweight waste, CC – mixed waste, and SP – DSD 310 categories were subject to manual selection and are represented by picked samples, while CC – PE-LD films and SP – DSD 830 were provided in baled form.
The samples were subjected to a sequence of three sorting levels: Initially, all seven categories underwent sorting based on PE films, polypropylene (PP) films, other films, and non-film items. In the subsequent sorting step, the PE-LD films were further classified into categories including natural coloured, coloured, and printed films. In the third sorting step, the CC – PE-LD films, as well as the PE natural coloured films from the CC – mixed waste, underwent an additional sorting phase based on size criteria (>1.5 m2, between 1.5 m2 and DIN A3, < DIN A3) and underwent no further distinction due to the lack of information. While the printed films were similar in size, they contained additional product information that allowed them to be segregated into distinct product classifications. The samples under examination were meticulously sorted into the mentioned categories, with each category quantified using a digital weighing scale.
2.3. FTIR measurements of the specimens
To discern unmarked specimens that could not be initially identified, the Fourier-transform infrared (FTIR) spectrometer Spectrum Two (Perkin Elmer Inc., Waltham, MA, USA) was employed for IR spectral analysis to ascertain their polymer type. The measurements encompassed wavenumbers ranging from 500 cm−1 to 4000 cm−1. In cases of multilayer films, identification involved a comparative analysis of both sides of the film. An example is depicted in . Precise polymer identification was achieved by juxtaposing the acquired infrared spectrum with relevant literature data. Based on the identified polymer type, the sample was sorted accordingly.
Figure 2. Exemplary sample for multilayer identification.
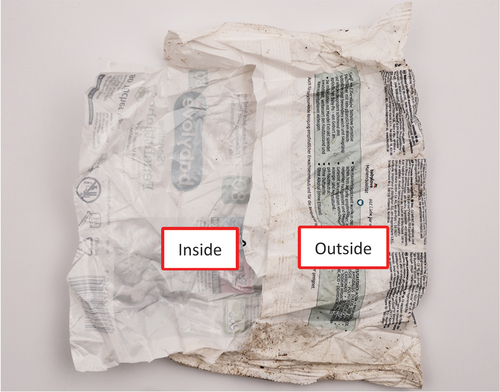
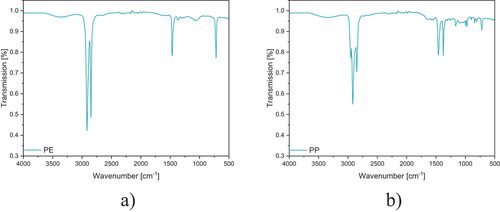
The spectra exemplified in represent measurements performed on the collected samples that lacked immediate identification. In this example, characteristic peaks of PE were evident on the Inside, while PP peaks were observed on the Outside. This sample was determined to be of multilayer film. Noteworthy spectral bands of the identified materials are documented in Table S2 and Table S3 in the Supplementary Materials.
Figure 3. IR spectra of the a) Inside (left PE) and the b) Outside (right PP) of the chosen exemplary sample of .
2.4. Calculation of circularity indications
In order to assess circularity, various measures exist. For a quick estimate the approach described by Cullen was used (Cullen Citation2017). He argues that the circularity index (CI) of a product can be described with a simple formula, see Equation 1. In Equation 2, is described as the quotient of waste recycled and products produced, in other words, the recycling rate.
is defined as shown in Equation 3.
Equation 1: The formula for the CI, as introduced by Cullen. Perfect circularity would result in a value of 1.
Equation 2: The formula used to describe in the CI.
Equation 3: The formula used to describe in the CI.
3. Results and Discussion
3.1. Occurrence of films and polymer types in the waste streams
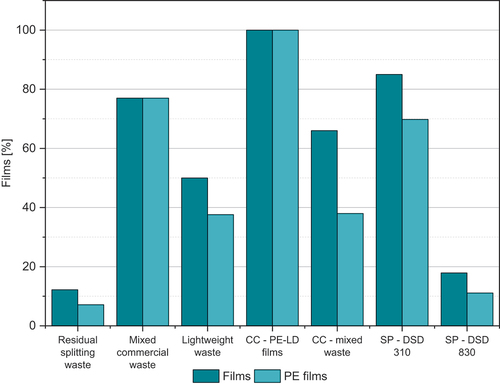
As previously discussed, all collected materials underwent initial categorisation into monolayer PE films, monolayer PP films, other films, and non-films. presents the two fractions films and PE films. The residual splitting waste fraction, amounting to 54.6 kg, comprised 3.9 kg of PE films, 0.3 kg of PP films, 2.7 kg of other films, and 47.7 kg of non-films. Within this fraction, a diverse range of items such as textiles, rigid plastic packaging, diapers, and shoes were present. This corresponds to roughly 12.2% of the residual splitting waste being composed of films, with PE films making up about 7.0%.
Figure 4. Contents of films and PE films in the different waste streams based on the first sorting.
A comparative analysis with various Austrian municipal waste assessments (Bundesministerium für Klimaschutz, Umwelt, Energie, Mobilität, Innovation und Technologie, 2021; Möllnitz et al. Citation2020) revealed that residual waste included approximately 6.2% plastic packaging, 3.0% other lightweight packaging, 3.9% plastic non-packaging, and around 8.0% 2D-plastic packaging. Similarly, the Upper Austrian waste analysis for 2018/2019 (Hietler, Pladerer, and Pulswerk GmbH Citation2019) indicated the presence of roughly 6.0% plastic packaging and 4.0% plastic non-packaging. Notably, our data demonstrated higher values, attributed to our input material being sourced from splitting plants. Our study utilised pre-treated input material, excluding heavier fractions, and allowing organic matter to decompose, resulting in the retention of solely the lightweight fraction. In contrast, the cited studies relied on waste collected through curbside collection, which is relatively fresher and untreated.
The mixed commercial waste fraction was sorted into monolayer PE films and non-films due to the absence of other polymer types. Among the 27.4 kg collected materials, approximately 21.2 kg constituted PE films, while 6.2 kg were non-films, indicating a predominant presence of around 77.0% PE films, with the remaining portion encompassing non-film components like straps or remnants from packaging. Our findings closely mirrored literature values (van Eygen, Laner, and Fellner Citation2018), where approximately 71.0% of examined mixed commercial waste streams were composed of large and small films. Nevertheless, other studies found smaller amounts of plastic in the mixed commercial waste of Austria, showing that the waste composition is strongly dependent on the origin of the waste (Möllnitz et al. Citation2020; Sarc and Pomberger Citation2022).
Considering the investigated lightweight waste fraction, of the 9.3 kg of samples collected, 3.5 kg were monolayer PE films, 0.5 kg were monolayer PP films, 0.6 kg were other films, and 4.6 kg were non-films such as rigid hollow bodies or polyethylene terephthalate (PET) bottles. This equates to approximately 50.0% films. This is consistent with literature findings such as those presented by Van Eygen et al (van Eygen, Laner, and Fellner Citation2018). and Koinig et al. (Koinig et al. Citation2022), who also identified approximately 55.0% of small and large films within this specific waste stream.
Regarding the remaining examined waste streams, precise numerical comparisons from literature sources were not attainable. The Upper Austrian collection centres serve as a disposal option for items also included in the lightweight packaging collection system and is preferably used for items that do not fit into the yellow bags and bins. The fractions from these centres are relatively clean due to the oversight of sorting by citizens and staff. In our study, the targeted fraction CC – PE-LD films amounted to 100%. The residual fraction CC – mixed waste from these centres, totalling 9.2 kg, encompassed 3.5 kg of monolayer PE films, 0.7 kg of monolayer PP films, 1.9 kg of other films, and 3.3 kg of non-films. Remarkably, approximately 66.0% of this fraction consisted of films. The remaining waste streams came from the post-consumer collection of lightweight packaging stemming from sorting facilities. The target fraction, designated as DSD 310, entails bales rich in PE film, adhering to standards set by the German licencing body Duales System Deutschland (DSD). The SP – DSD 310 bale sample weighed 27.4 kg, consisting of 16.0 kg of monolayer PE films, 0.9 kg of monolayer PP films, 4.6 kg of other films, and 5.9 kg of non-films, resulting in an overall film content of 85.0%. According to the DSD specification (Der Grüne Punkt Citation2023), the bale should exhibit a purity of 92.0% of post-consumer films larger than DIN A4, with at least 42.0% being natural coloured films of size larger than DIN A3. The total impurity content should not surpass 8.0%. Hence, the SP – DSD 310 sample investigated did not fulfil the DSD 310 specification. The examined residue fraction from the sorting plant, designated as DSD 830 according to Duales System Deutschland’s specification, should encompass a substantial portion of mixed plastic with a high film content. Our study revealed a total film weight of 25.8 kg out of 143.0 kg, including 15.9 kg of monolayer PE films, 3.9 kg of monolayer PP films, and 6.0 kg of other films.
3.2. PE film categorization in color, size, and product types
Previous investigations have already delved into the composition analysis of residual waste (Möllnitz et al. Citation2020) and yellow bag waste (Koinig et al. Citation2022). In our study, we expanded our focus to include the waste compositions originating from CC and SP. Following the initial sorting phase, the PE fraction of four predefined waste fractions underwent subsequent classification into natural coloured films, coloured films, and printed films, as depicted in . In a subsequent third sorting phase, the natural coloured films and printed films from the CC fraction were further categorised based on size or product type, outlined in .
Figure 5. Contents of natural coloured, coloured, and printed films in the PE film fractions based on the second sorting.
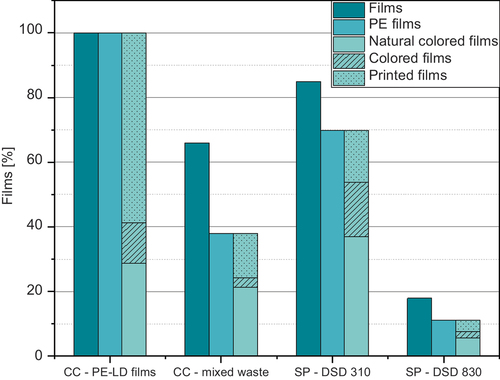
Table 2. Size distribution of natural colored films and categorisation of printed films of the CC – PE-LD films and the CC – mixed waste.
The exclusive PE-LD fraction obtained from collection centres (CC – PE-LD films) amounted to 104 kg. Within this bale, a total of 31.7 kg constituted of natural coloured films, partitioned as follows: 59.9% were larger than 1.5 m2, 25.7% were smaller than 1.5 m2 but larger than DIN A3, and 6.6% were smaller than DIN A3. However, 7.8% were stretch films. Stretch films, due to their crumpled and knotted state, precluded size distinction as opening them would lead to their destruction. The PE-LD fraction of printed films, accounting for 60.2 kg, was effectively categorised into non-food packaging (96.0%) and food packaging (4.0%). Seasonal variation was evident in non-food packaging, particularly in gardening products due to the onset of spring.
The film segment extracted from the mixed plastic waste fraction at the collection centre (CC – mixed waste) also underwent differentiation into natural coloured films and printed films (Table). Among the 1.6 kg of natural coloured films, 45.3% were larger than 1.5 m2, 21.4% fell within the intermediate size range, and 33.3% were smaller than DIN A3. The coloured portion constituted 7.7% of the entire film fraction. The printed subset, totalling 1.1 kg, comprised non-food packaging (73.0%) and food packaging (27.0%).
The DSD 310 fraction (SP – DSD 310) obtained from the sorting plant contained 58.4% of PE films that translated into 16.0 kg, categorised further into 52.2% natural coloured films, 23.9% coloured films, and 22.6% printed films. Notably, due to DSD specifications, the sizes predominantly adhered to the DIN A4 range. Therefore, no third sorting step was conducted.
Similarly, the DSD 830 fraction (SP – DSD 830) from the sorting plant consisted of 15.8 kg of PE films, distinguishable into 52,3% natural coloured films, 24,5% coloured films, and 23,2% printed films. Additionally, due to pretreatment processes like sack opening, the sorting procedure itself, and storage and transportation conditions at the sorting centres, many items could not be differentiated further. As a result, a third sorting step was omitted in this case.
3.3. Upscaling to film waste amounts in Upper Austria
In the preceding sections of this paper, only relative quantities have been presented. To gain a more tangible understanding of the potential quantities within Upper Austria, we conducted research into existing literature values and extrapolated the figures mentioned below. For the year 2021, a total of approximately 176,000 tons of residual waste were collected for energy recovery in Upper Austria (Altenhofer, Bräuer, and Reiner Citation2023). As Upper Austria does not treat residual waste in mechanical-biological treatment plants, no figures are available in this case. In Austria, at least 50% of the waste that ends up in mechanical-biological plants is used for energy recovery in the form of RDF (Neubauer and Öhlinger Citation2006). By analogy with the data collected above, about 88,000 tons would consist of high caloric fractions. Based on the data provided in this would correspond to approximately 10,560 tons of film waste and to 6,250 tons of PE-LD films.
Although exact figures for collected commercial waste in Upper Austria could not be determined, nationwide figures indicate that approximately 36,000 tons of commercial waste were sent to Austrian sorting plants in (van Eygen, Laner, and Fellner Citation2018; van Velzen et al. Citation2013). However, no figures could be found for commercial waste sent for energy recovery. Furthermore, it would be difficult to derive Upper Austrian data from national data, as Upper Austria is home to a large number of plastics companies, which means that more industrial and commercial plastic waste is generated there than in other federal provinces. Due to the lack of detailed data for Upper Austria, an upscaling of commercial waste is not possible.
Based on data from Altstoff Recycling Austria (ARA), an Austrian packaging collection and recovery entity and the federal environmental bureau (Umweltbundesamt) (Neubauer et al. Citation2021), approximately 30,000 tons of packaging waste were collected in Upper Austria in (Recycling Austria Ag Citation2021, Citation2021). Correlating this data with the results above suggest about 15,000 tons of plastic films can be found in yellow bags and bins, of which 11,280 tons are PE-LD.
According to the 2022 annual report from LAVU, approximately 46,000 tons of packaging were collected at collection centres. The CC – PE-LD films constituted 1,900 tons, with the CC – mixed waste totalling 2,270 tons. Extrapolating from our observations, the CC – mixed waste likely contains around 1,500 tons of films, of which 860 tons are PE-LD films.
In Upper Austria, all the lightweight packaging waste is collected in yellow bags or bins and in collection centres managed by LAVU. Summarising the calculated numbers, about 18,400 tons of films and therefore 14,040 tons of PE-LD films can be found in packaging waste. A summary of the upscaled numbers is depicted in .
Table 3. Upscaled PE-LD film waste amounts of the residual splitting waste, mixed commercial waste, and the lightweight waste in Upper Austria.
3.4. Circularity indications for Austria
As mentioned in the Introduction, the recycling rate was 25% in Austria in 2020 for plastic packaging, according to the federal environmental bureau (Umweltbundesamt) (Neubauer et al. Citation2023). Cullen provides a value for of 75% for plastics, which would result in a CI of 19% for Austrian plastic packaging, alike the 20% for the global aluminium production shown in Cullen’s work. This is interesting as aluminium is a material not exhibiting degradation issues during recycling and with a very high primary energy demand for virgin production (Cui and Roven Citation2010). Cascone et al. (Cascone et al. Citation2020) performed a life cycle assessment (LCA) and an energy analysis on agricultural PE-LD films and found values for the energy demand of primary and secondary PE-LD production, which would result in a
of 85% and ultimately a CI of 22% for Austria with the aforementioned
. Keeping in mind the extraordinary high value of plastic-containing waste being used as RDF, it was assumed that all plastics entering residual and commercial waste (hard-to-reach fractions) are currently energetically recovered, resulting in an
of 0 for the given amount. An incremental analysis was performed to deduct the implications of increased recycling rates for the hard-to-reach fractions, which were added to the material recycled from other waste fractions (see ).
Figure 6. The influence of an increased recycling rate for hard-to-reach fractions on the CI.
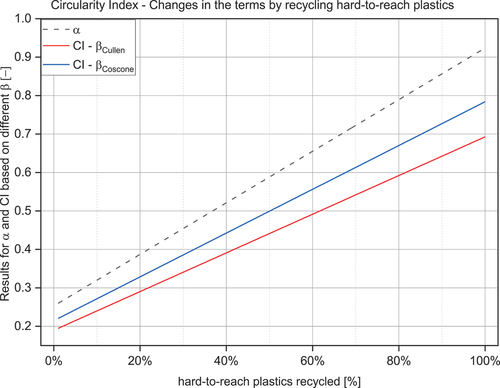
Due to the linear function, one finds that increases by 0.0067 for each percent of hard-to-reach fraction being recycled. Assuming 50% of hard-to-reach fractions would enter recycling, a CI of 44% or 50%, depending on the value for
, could be reached, indicating a plastics economy which would be ‘half-circular’. The slopes and intercepts of the graphs are listed in Table S4 in the Supplementary Materials.
Ultimately, a sensitivity analysis was performed iterating material demand, recycled amount of material as well as the primary and secondary energy demand in 10% steps. The results are shown in .
Figure 7. The results for the sensitivity analysis for both sources of values of .
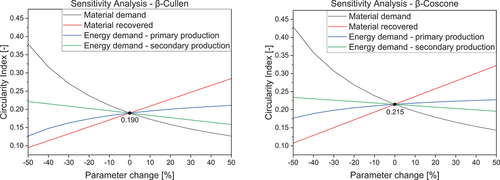
The sensitivity analysis shows clearly that manipulating levers such as reduced demand or an increased recycling rate leads to a higher increase in CI than dealing with energy efficiency for the primary and secondary production processes. While the energy demand differs considerably between the two sources, it seems improbable that 50% of energy demand can be reduced in an established and optimised process such as the production of PE films. Moreover, the CI does not indicate absolute sustainability, as it makes a tremendous difference whether the energy demand is met with renewable or fossil energy. This is why the CI should always remain a complementary analysis to a full environmental assessment by means of LCA. Nevertheless, it was shown that for an increased recycling rate a considerably higher CI can be achieved. Ultimately this might easily lead to reduced carbon dioxide equivalent emissions as mechanical recycling is mostly driven by electricity by now, which can easily be greened in comparison to the petrochemical industry, in which fossil powers are hard-to-abate. Nevertheless, Cullen’s approach should be met with care. The energy demand for secondary production likely correlates with the recycling rate, as contamination and efforts to bring hard-to-reach fractions into recycling are likely more energy intensive than clean fractions. Some waste fractions in this study exhibited visually a high degree of contaminations, which would increase the energy consumption by adapting the pre-treatment step (e.g. increase in washing temperature, necessity of detergent). Therefore, unless a ground-breaking new technology surfaces, the isolated parameter variation should be used with utmost diligence.
4. Conclusion
The study investigated the recyclable content of polyethylene (PE) films in Upper Austria’s waste streams, collecting samples from residual splitting waste, mixed commercial waste, and lightweight packaging waste. The lightweight packaging waste was further divided into four sub-categories, resulting in seven different fractions. In subsequent sorting steps, the fractions were categorised by film type, colour, print, and size. Large films dominated the categories, and printed films were mainly non-food packaging, showing seasonal variations. The study found that most plastic packaging film waste is incinerated or exported for sorting due to limited local recycling infrastructure. Only one recycling company operates in Upper Austria, and no established recycling processes exist for certain waste fractions, resulting in 20,000 tons of PE-LD films not being recycled. The results, combined with national data, were used to calculate the Circularity Index (CI), currently around 0.2. The CI could improve by 0.0067 for each percentage of hard-to-reach fraction recycled. Reducing demand and increasing recycled material use benefits the CI more than improving energy efficiency. Nevertheless, this is only an approximation, since the energy demand depends on the recycling rate and therefore on the amount of waste and the degree of contamination. Overall, it can be concluded that enhancing efficiency in collection, sorting, and recycling, along with educating the public on proper waste sorting, is essential for achieving recycling targets and preventing incineration of improperly sorted materials.
Declaration of generative AI in scientific writing
During the preparation of this work the authors used Grammarly and DeepL Write to paraphrase the text. After using this tool/service, the authors reviewed and edited the content as needed and take full responsibility for the content of the publication.
Author contributions statement
The authors confirm contribution to the paper as follows: study conception and design: J.L., L.Z., J.F.; data collection: J.L., L.Z.; analysis and interpretation of results: J.L., L.Z., J.F.; draft manuscript preparation: J.L., L.Z., J.F. All authors reviewed the results and approved the final version of the manuscript.
Disclosure statement
No potential conflict of interest was reported by the author(s)
Data availability statement
The data that support the findings of this study are available from the corresponding author, [J.L.], upon reasonable request.
Additional information
Funding
Notes on contributors
Johanna Langwieser
Johanna Langwieser is a Ph.D. candidate in Technical Sciences – Polymer Engineering at the Johannes Kepler University (JKU) Linz and a Research Scientist at Competence Center CHASE GmbH. She has received her Master’s degree in Polymer Technologies and Science and her Bachelor’s degree in Polymer Engineering at JKU Linz.
Lukas Zeilerbauer
Lukas Zeilerbauer is a Ph.D. candidate in Technical Sciences – Chemical Technologies at the JKU Linz and a Research Associate at Energieinstitut an der Johannes Kepler Universität Linz. He has received his Master’s degree in Management in Chemical Technologies and his Bachelor’s degree in Technical Chemistry at JKU Linz.
Joerg Fischer
Joerg Fischer is Associate Professor at the Institute of Polymeric Materials and Testing at JKU Linz and the Assistant Head of the Linz Institute of Technology (LIT Factory). His Habilitation was obtained in Polymer/Plastics Engineering (Mechanics of Polymeric Materials) at JKU Linz. His Ph.D. was obtained in Polymer Engineering and Science and his Master’s degree was acquired in Polymer Engineering and Science, both at Montanuniversität Leoben.
References
- Altenhofer, M., T. Bräuer, and B. Reiner. 2023. “Amt der Oö. Landesregierung Direktion Umwelt und Wasserwirtschaft Abteilung Umweltschutz. [Online]. Available at OÖ. Abfallbericht 2021. https://www.land-oberoesterreich.gv.at/files/publikationen/us_abfallbericht2021.pdf.
- Altstoff Recycling Austria AG. 2019. “Rohstoff Kunststoff: Ressourcen und Kreislaufwirtschaft neu denken und machen [Online]”. Accessed March 18, 2024. https://www.ara.at/uploads/Dokumente/EU-Kreislaufwirtschaftspaket/Kunststoffbroschuere/ARA_Kunststoffbroschuere.pdf.
- Barlow, C. Y., and D. C. Morgan. 2013. “Polymer Film Packaging for Food: An Environmental Assessment.” Resources, Conservation and Recycling 78:74–80. https://doi.org/10.1016/j.resconrec.2013.07.003.
- Breeze, P. A. 2018. Energy from Waste. London: Academic Press.
- Bundesministerium für Klimaschutz, Umwelt, Energie, Mobilität, Innovation und Technologie. 2021. Die Bestandsaufnahme der Abfallwirtschaft in Österreich - Statusbericht 2021. Vienna. https://www.bmk.gv.at/dam/jcr:04ca87f4-fd7f-4f16-81ec-57fca79354a0/BAWP_Statusbericht2021.pdf.
- Bundesministers für Land- und Forstwirtschaft, Umwelt und Wasserwirtschaft. 2022. “Verordnung des Bundesministers für Land- und Forstwirtschaft, Umwelt und Wasserwirtschaft über Deponien (Deponieverordnung 2008 – DVO 2008): DVO 2008 [Online].” https://www.ris.bka.gv.at/eli/bgbl/ii/2008/39/P0/NOR40232253.
- Callewaert, P., H. Lerche Raadal, and K.-A. Lyng. 2023. “How to Achieve Ambitious Recycling Targets for Plastic Packaging Waste? The Environmental Impact of Increased Waste Separation and Sorting in Norway.” Waste Management ( New York, N.Y.) 171:218–226. https://doi.org/10.1016/j.wasman.2023.08.037.
- Cascone, S., C. Ingrao, F. Valenti, and S. M. C. Porto. 2020. “Energy and Environmental Assessment of Plastic Granule Production from Recycled Greenhouse Covering Films in a Circular Economy Perspective.” Journal of Environmental Management 254:109796. https://doi.org/10.1016/j.jenvman.2019.109796.
- Cui, J., and H. J. Roven. 2010. “Recycling of Automotive Aluminum.” Transactions of Nonferrous Metals Society of China 20 (11): 2057–2063. https://doi.org/10.1016/S1003-6326(09)60417-9.
- Cullen, J. M. 2017. “Circular Economy: Theoretical Benchmark or Perpetual Motion Machine?” Journal of Industrial Ecology 21 (3): 483–486. https://doi.org/10.1111/jiec.12599.
- Der Grüne Punkt. 2023. Der Grüne Punkt - Systalen: 310_0_Kunststoff-Folien [Online]. Available at https://www.gruener-punkt.de/de/downloads.
- European Parliament and the Council of the European Union. 1994. European Parliament and Council Directive 94/62/EC of 20 December 1994 on Packaging and Packaging Waste: EU Directive 94/62/EC [Online]. Available at http://data.europa.eu/eli/dir/1994/62/oj.
- European Parliament and the Council of the European Union. 2015. Directive (EU) 2015/720 of the European Parliament and of the Council: Directive 2015/720 [Online]. Available at http://data.europa.eu/eli/dir/2015/720/oj.
- European Parliament and the Council of the European Union. 2018. Directive (EU) 2018/852 of the European Parliament and of the Council of 30 May 2018 Amending Directive 94/62/EC on Packaging and Packaging Waste: Directive (EU) 2018/852 [Online]. Available at http://data.europa.eu/eli/dir/2018/852/oj.
- FPA - Flexible Packaging Association. 2023. Advantages of Flexible Packaging [Online]. Available at Accessed June 29, 2023. https://www.flexpack.org/advantages.
- Hietler, P., C. Pladerer, and Pulswerk GmbH. 2019. Restabfallanalyse Oberösterreich 2018/2019. Amt der Oö. Landesregierung Abteilung Umweltschutz. https://www.land-oberoesterreich.gv.at/Mediendateien/Formulare/Dokumente%20UWD%20Abt_US/US_Restabfallanalye_OOE_2018_2019.pdf.
- Jalil, M. A., M. N. Mian, and M. K. Rahman. 2013. “Using Plastic Bags and Its Damaging Impact on Environment and Agriculture: An Alternative Proposal.” International Journal of Learning and Development 3 (4): 1. https://doi.org/10.5296/ijld.v3i4.4137.
- Koinig, G., B. Rutrecht, K. Friedrich, C. Barretta, and D. Vollprecht. 2022. “Latent Recycling Potential of Multilayer Films in Austrian Waste Management.” Polymers 14 (8): 1553. https://doi.org/10.3390/polym14081553.
- Lahtela, V., M. Hyvärinen, and T. Kärki. 2019. “Composition of Plastic Fractions in Waste Streams: Toward More Efficient Recycling and Utilization.” Polymers 11 (1): 69. https://doi.org/10.3390/polym11010069.
- Lase, I. S., A. Bashirgonbadi, F. van Rhijn, J. Dewulf, K. Ragaert, L. Delva, M. Roosen, M. Brandsma, M. Langen, and S. D. Meester. 2022. “Material Flow Analysis and Recycling Performance of an Improved Mechanical Recycling Process for Post-Consumer Flexible Plastics.” Waste Management ( New York, N.Y.) 153:249–263. https://doi.org/10.1016/j.wasman.2022.09.002.
- Ministerium für Umwelt und Forsten Rheinland-Pfalz. 2001. LAGA PN 98 Richtlinie für das Vorgehen bei physikalischen, chemischen und biologischen Untersuchungen im Zusammenhang mit der Verwertung/Beseitigung von Abfällen: Grundregeln für die Entnahme von Proben aus festen und stichfesten Abfällen sowie abgelagerten Materialien. https://www.laga-online.de/documents/m32_laga_pn98_1503993280.pdf.
- Möllnitz, S., K. Khodier, R. Pomberger, and R. Sarc. 2020. “Grain Size Dependent Distribution of Different Plastic Types in Coarse Shredded Mixed Commercial and Municipal Waste.” Waste Management( New York, N.Y.) 103:388–398. https://doi.org/10.1016/j.wasman.2019.12.037.
- Neubauer, C., A. Bernhardt, C. Brandstätter, C. Broneder, U. Kral, J. Oliva, M. Roll, and Bundesministerium für Klimaschutz, Umwelt, Energie, Mobilität, Innovation und Technologie. 2023. Die Bestandsaufnahme der Abfallwirtschaft in Österreich - Statusbericht 2023.
- Neubauer, C., and A. Öhlinger. 2006. “Ist-Stand der mechanisch-biologischen Abfallbehandlung (MBA) in Österreich, Bundesministeriums für Land- und Forstwirtschaft, Umwelt und Wasserwirtschaft. [Online]. Available at https://www.umweltbundesamt.at/fileadmin/site/publikationen/rep0071.pdf.
- Neubauer, C., B. Stoifl, M. Tesar, and P. Thaler. 2021. SORTIERUNG UND RECYCLING Sortierung und Recycling von Kunststoffabfällen in Österreich: Status 2019, Bundesministerium Klimaschutz, Umwelt, Energie, Mobilität, Innovation und Technologie [Online]. Available at Accessed March 18, 2024. https://www.umweltbundesamt.at/fileadmin/site/publikationen/rep0744_hauptteil.pdf.
- Picuno, C., E. van Eygen, M. T. Brouwer, K. Kuchta, and E. U. van Thoden Velzen. 2021. “Factors Shaping the Recycling Systems for Plastic Packaging Waste—A Comparison Between Austria, Germany and the Netherlands.” Sustainability 13 (12): 6772. https://doi.org/10.3390/su13126772.
- Plastics Europe AISBL. 2022. Plastics – the Facts 2022 [Online]. Available at https://plasticseurope.org/de/.
- Plastics Recyclers Europe. 2019. Flexible Polyethylene Recycling in Europe. Brussels: Plastics Recyclers Europe.
- Plastics Recyclers Europe. 2020. Flexible Film Market in Europe: State of Play. Brussels: Plastics Recyclers Europe.
- Recycling Austria Ag, A. 2021. ARA - Factsheets zur getrennten Sammlung [Online]. Available at Accessed July 27, 2023. https://www.ara.at/presse.
- Relocation NO. n.d. Recycling and Waste [Online]. Available at Accessed March 18, 2024. https://relocation.no/expat-communities/national-information/recycling-and-waste/.
- Rijkswaterstaat Ministry of Infrastructure and Water Management. n.d. Elements of Dutch Waste Management. Accessed March 18, 2024. https://rwsenvironment.eu/subjects/from-waste-resources/elements-dutch-waste/.
- Sarc, R., and R. Pomberger. 2022. ““ReWaste4.0”—Competence Centre on Waste Treatment & Management at AVAW, Montanuniversitaet Leoben.” Österreichische Wasser- Und Abfallwirtschaft 74 (1–2): 1–2, pp. 39–50. https://doi.org/10.1007/s00506-021-00814-9.
- Sawant, S. 2022. The Pros and Cons of Flexible Packaging Vs Rigid Packaging [Online]. Available at https://www.linkedin.com/pulse/pros-cons-flexible-packaging-vs-rigid-dr-sharayu-sawant/?trackingId=x4sv2eTBTqGXGiHjU5Dkeg%3D%3D.
- Scharff, H. 2014. “Landfill Reduction Experience in the Netherlands.” Waste Management( New York, N.Y.) 34 (11): 2218–2224. https://doi.org/10.1016/j.wasman.2014.05.019.
- Schuch, D., J. Lederer, J. Fellner, and C. Scharff. 2023. “Separate Collection Rates for Plastic Packaging in Austria - a Regional Analysis Taking Collection Systems and Urbanization into Account.” Waste Management ( New York, N.Y.) 155:211–219. https://doi.org/10.1016/j.wasman.2022.09.023.
- Statista GmbH. 2022. Global Plastic Packaging Industry [Online]. Available at Accessed June 29, 2023. https://www.statista.com/study/69030/global-plastic-packaging-industry/.
- Stoifl, B., and J. Oliva. 2020. Littering in Österreich. Vienna: Bundesministerium Klimaschutz, Umwelt, Energie, Mobilitaet, Innovation und Technologie.
- Tomra Collection. 2022. Norway’s Deposit Return Scheme Is world’s Recycling Role Model [Online]. Available at Accessed March 18, 2024. https://www.tomra.com/en/reverse-vending/media-center/feature-articles/norway-deposit-return-scheme.
- Ujeh, K. C. n.d. The Negative Environmental Effects of Plastic Shopping Bags [ Online], International Bar Association. https://www.ibanet.org/article/76F8D2A9-1A1D-4A2F-8A6F-0A70149FD4D5.
- van Eygen, E., D. Laner, and J. Fellner. 2018. “Circular Economy of Plastic Packaging: Current Practice and Perspectives in Austria.” Waste Management ( New York, N.Y.) 72:55–64. https://doi.org/10.1016/j.wasman.2017.11.040.
- van Velzen, U. T., H. Bos-Bouwers, J. Groot, X. Bing, M. Jansen, and B. Luijsterburg. 2013. Scenarios Study on Post-Consumer Plastic Packaging Waste Recycling. Wageningen: Wageningen UR Food & Biobased Research.
- Wagner, J. R. 2016. Multilayer Flexible Packaging. 2nd ed. Norwich: William Andrew Publishing. https://doi.org/10.1016/C2014-0-02918-8.