
ABSTRACT
Methionine oxidation is a common posttranslational modification (PTM) of monoclonal antibodies (mAbs). Oxidation can reduce the in-vivo half-life, efficacy and stability of the product. Peptide mapping is commonly used to monitor the levels of oxidation, but this is a relatively time-consuming method. A high-throughput, automated subunit mass analysis method was developed to monitor antibody methionine oxidation. In this method, samples were treated with IdeS, EndoS and dithiothreitol to generate three individual IgG subunits (light chain, Fd’ and single chain Fc). These subunits were analyzed by reversed phase-ultra performance liquid chromatography coupled with an online quadrupole time-of-flight mass spectrometer and the levels of oxidation on each subunit were quantitated based on the deconvoluted mass spectra using the UNIFI software. The oxidation results obtained by subunit mass analysis correlated well with the results obtained by peptide mapping. Method qualification demonstrated that this subunit method had excellent repeatability and intermediate precision. In addition, UNIFI software used in this application allows automated data acquisition and processing, which makes this method suitable for high-throughput process monitoring and product characterization. Finally, subunit mass analysis revealed the different patterns of Fc methionine oxidation induced by chemical and photo stress, which makes it attractive for investigating the root cause of oxidation.
| Abbreviations | ||
| CDR | = | complementarity-determining region |
| DP | = | drug product |
| DTT | = | dithiothreitol |
| FcRn | = | neonatal Fc receptor |
| HC | = | heavy chain |
| HIC | = | hydrophobic interaction chromatography |
| HPLC | = | high-performance liquid chromatography |
| IEX | = | ion-exchange chromatography |
| IgG | = | immunoglobulin G |
| LC | = | light chain |
| LC-MS | = | liquid chromatography-mass spectrometry |
| mAb | = | monoclonal antibody |
| MS | = | mass spectrometry |
| PTM | = | posttranslational modification |
| RP-UPLC | = | reversed phase-ultra performance liquid chromatography |
| RSD | = | relative standard deviation |
| scFc | = | single chain Fc |
Introduction
Oxidation is a common posttranslational modification (PTM) of monoclonal antibodies (mAbs). While oxidation of therapeutic antibodies can occur on tryptophan, lysine, cysteine, or histidine residues, methionine (Met) residues are often the most susceptible to oxidation. Oxidation in the complementarity-determining region (CDR) can reduce the antigen binding and potency of mAbs.Citation1 In addition, oxidation of heavy chain (HC) Met252 and HC Met428 residues in the Fc domain is known to affect the higher order structure,Citation2 thermal stability,Citation2,3 protein A binding,Citation4,5 and FcRn binding of mAbs,Citation2,4,6-8 which can lead to reduced serum half-life.Citation9
Traditional methods used for oxidation analysis have limitations. For example, peptide mapping with mass spectrometry (MS) analysis can provide multi-attribute analysis with residue-specific quantitation,Citation10-13 but requires lengthy sample preparation and complicated analysis.Citation14 Reversed phase liquid chromatography (RP-LC),Citation15-18 hydrophobic interaction (HIC)Citation19-21 and protein A chromatography,Citation22 or more recently, mixed-mode chromatography with size exclusion and HICCitation23 have also been used to monitor oxidation. Methionine oxidation located in the Fab domain has been also shown to be detectable by IEX-HPLC.Citation24 These techniques provide faster turnaround, but in some cases, lack the specificity or sensitivity for reliable quantitation of oxidation levels.
In recent years, middle-down LC-MS approaches using antibody fragments (light chain (LC), scFc and Fd’ subunits) generated by digestion with protease IdeS have gained popularity. Specific digestion of mAbs with IdeS generates smaller subunits (∼25 kDa), which allows high-resolution mass analysis and easier data interpretation.Citation25-30 These IdeS-based approaches facilitated development of more sensitive and specific methods for detecting and monitoring quality attributes of mAbs, including identity,Citation15,31-33 glycosylation,Citation26,32,34-37 glycation,Citation38 oxidation,Citation15,16 C-terminal lysineCitation26,39 and cysteinylation.Citation40 Studies also explored IdeS as a useful tool for quick and robust characterization of drug-to-antibody ratios in antibody-drug conjugates.Citation41,42
Although oxidation analysis using the subunit mass method has been explored in the past, the quantiation of oxidation levels relied mainly on chromatographic separation with UV-based quantitation.Citation15-18 As a result, gradient conditions need to be optimized for each product to ensure good resolution of the oxidized and non-oxidized forms. Direct quantiation of oxidation levels using mass spectrum remains a challenge due to the potential interference of water (+18 Da) and sodium (+23 Da) adducts. Here, we describe for the first time the development and qualification of a subunit mass analysis method that is capable of quantifying the oxidation levels based on mass spectrum alone. This platform method has higher throughput than peptide mapping, requires little sample preparation, which minimizes method artifacts, and can be used to measure oxidation of mAb products. Samples can be prepared and analyzed in 15 min, which makes it suitable for at-line process monitoring or product characterization support. More importantly, MS hardware and software used in this application are compliant with good manufacturing practices, which makes them suitable to use in a regulated environment.
Results
Analytical workflow for subunit mass analysis
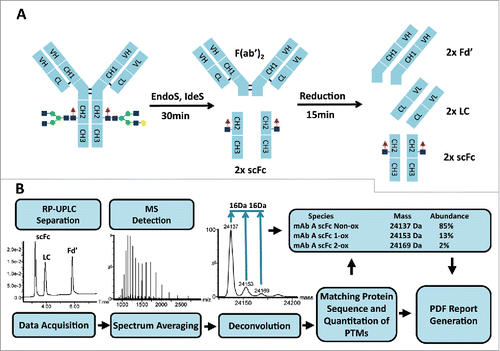
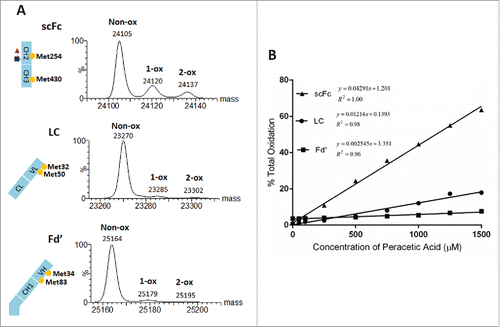
As shown in , samples were first treated with the EndoS and IdeS enzymes. IdeS cleaves mAbs in the lower hinge region between two glycine residues, creating a F(ab’)2 and two single chain Fc (scFc) domains.Citation28,43 EndoS cleaves between the first two N-acetylglucosamine residues of N-linked sugars on the heavy chain and eliminates the mass heterogeneity due to N-linked glycosylation.Citation44,45 Dithiothreitol (DTT) was then added to reduce the protein fragments and generate the three subunits (LC, Fd’ and scFc). Digested samples were analyzed by reversed phase-ultra performance liquid chromatography (RP-UPLC)/MS using Waters I-class ACQUITY UPLC coupled to Xevo G2-XS quadrupole time-of-flight mass spectrometer. Mass spectra were deconvoluted by the MaxEnt1 function using the Waters UNIFI software as shown in . The spectra collected across a chromatographic peak were summed, deconvoluted and centered using an automated workflow. Peaks were identified by matching the experimental masses with the theoretical masses for oxidized and non-oxidized subunits and quantitated from the peak height intensities of the deconvoluted and centroid spectra. To determine the percentage oxidation, results for the oxidized species were divided by the total peak intensities of oxidized and non-oxidized species using the following equation: % oxidation = (summed intensity of the oxidized species/summed intensities of the oxidized and non-oxidized species)*100. Summarized results can be presented in customized PDF reports using the UNIFI software.
Figure 1. Workflow for subunit mass analysis: sample preparation (A) followed by automated RP-UPLC-MS analysis (B).
Separation of mAb subunits by RP-UPLC
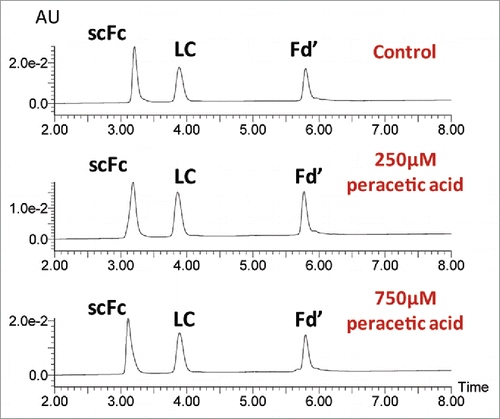
A quick and robust UPLC method was developed to separate the IgG subunits for routine mass analysis of methionine oxidation. As shown in , RP-UPLC could effectively separate the Fd’, scFc and LC subunits from IgG1, IgG2 and IgG4 antibodies. In each case, the scFc subunit eluted first, followed by the LC and Fd’ subunits. These results indicated that the same 15 min platform RP-UPLC method could be used for subunit mass analysis of mAbs from the three major IgG subclasses. Furthermore, high levels of oxidation had little effect on the elution profiles of three subunits. As shown in , the RP-UPLC elution profiles of an untreated mAb-A control sample and oxidized samples treated with 250 µM and 750 µM peracetic acids were very similar. Therefore, mass spectra for the oxidized and non-oxidized species can be averaged, deconvoluted and centered together in order to calculate the relative percentage of oxidation.
Figure 2. RP-UPLC analysis of IgG subunits from IgG1 (mAbs-A, B, and C), IgG4 (mAbs-D and E) and IgG2 (mAb-F).
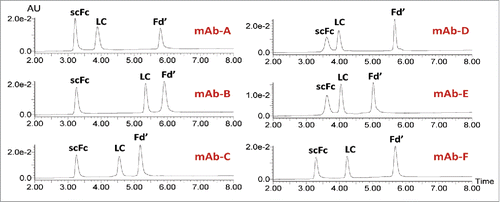
Figure 3. Impact of oxidation on the elution profiles of mAb subunits. UPLC profiles are presented for the mAb-A control sample and samples treated with 250µM and 750 µM peracetic acid for 2 hr at 30°C (top to bottom).
Subunit mass analysis to monitor methionine oxidation
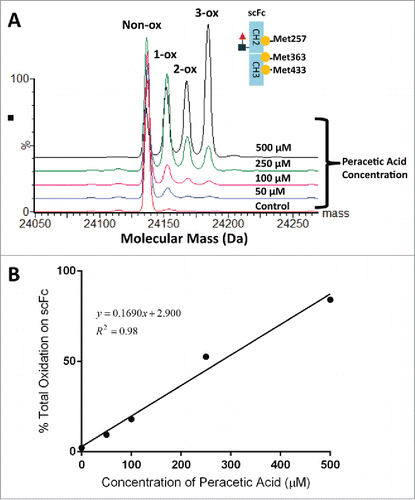
Methionine oxidation leads to a 16 Da mass increase, which can be easily resolved and detected using subunit mass analysis. To generate the oxidized samples for analysis, mAb-A was incubated for 2 hr at 30°C with increasing concentrations of peracetic acid (0-500 µM), which specifically oxidizes methionine residues. Peptide mapping experiments confirmed that only 3 methionines in the Fc region of mAb-A, Met257, Met363 and Met433, were susceptible to oxidation by peracetic acid (data not shown), similar to previous studies using H2O2 or tert-butyl hydroperoxide as the oxidizing reagent.Citation3,14,15,46,47 The chemically oxidized mAb-A samples were digested with IdeS and EndoS, reduced with DTT and analyzed by RP-UPLC-MS. Masses corresponding to the unmodified scFc subunit (scFc non-ox) and the scFc subunit with one oxidized methionine (scFc + 1-ox), two oxidized methionines (scFc + 2-ox) and three oxidized methionines (scFc + 3-ox), were detected after deconvolution of the mass spectrum for the scFc peak. The observed mass increases associated with oxidation of one methionine, two methionine and three methionine residues were 16 ± 2 Da, 32 ± 2 and 48 ± 2 Da, respectively. As shown in , the relative percentages of the 1-ox, 2-ox and 3-ox species increased with increasing concentrations of peracetic acid. Furthermore, there was a strong linear correlation (R2 of 0.98) between total oxidation of the scFc subunit measured by subunit mass analysis and the concentration of peracetic acid ().
Figure 4. Overlaid deconvoluted mass spectra of the scFc subunit from mAb-A treated with different concentration of peracetic acid (A). To generate oxidized samples for analysis, mAb-A was incubated for 2 hr at 30°C with increasing concentrations of peracetic acid (0–500 µM). The sum of 1-ox, 2-ox and 3-ox species shown in panel A was plotted as a function of peracetic acid concentration (B).
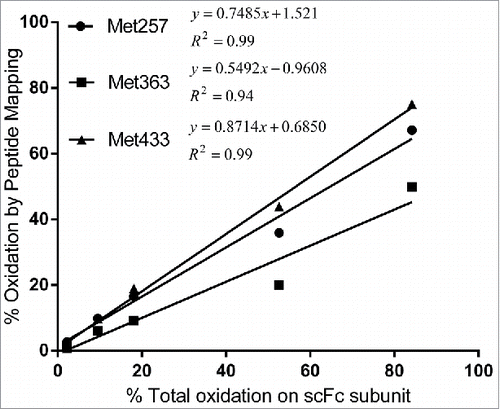
Importantly, total scFc oxidation measured by subunit mass analysis correlated well with the HC Met257, HC Met363 and HC Met433 oxidation measured by peptide mapping ().
Figure 5. Correlation of scFc oxidation results by peptide mapping and subunit mass analysis. Levels of Met257, Met363 and Met433 oxidation quantified by peptide mapping were plotted as a function of total oxidation on scFc quantified by subunit mass analysis.
The method worked equally well for measuring oxidation on the other IgG subunits. There are multiple methionine residues on all three subunits of mAb-B that were susceptible to oxidation by peracetic acid, and oxidized species were detected in all three subunits (). Using subunit mass analysis, we were able to establish strong correlations between the concentration of peracetic acid and the percentage oxidation on all three subunits (). Thus, results for oxidation of multiple residues on all three subunits can be obtained from a single experiment.
Figure 6. Three subunits of mAb-B with indicated methionine residues and corresponding deconvoluted mass spectra for the sample treated with 500µM peracetic acid (A). The sum of 1-ox and 2-ox species in Panel A was plotted as a function of peracetic acid concentration (B).
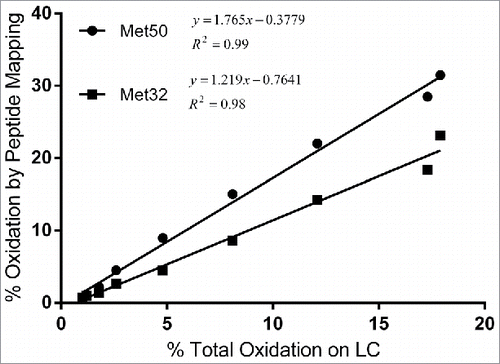
Similar to results presented in , subunit mass results for oxidation at multiple sites on the LC correlated well with peptide map results. As shown in , the total levels of LC oxidation measured by subunit mass analysis correlated well with the levels of LC Met32 and LC Met50 oxidation measured by peptide mapping.
Figure 7. Correlation between percent total oxidation on LC quantified using subunit mass analysis and percent oxidation on LC Met32 and MC50 by peptide mapping.
Qualification of the subunit mass analysis method for measuring oxidation
For routine usage, results obtained by subunit mass analysis should have good precision. As shown in , the relative standard deviation (RSD) for column-to-column, day-to-day and analyst-to-analyst variabilities were less than 10% and the overall intermediate precision of the method was only 8.4%. These results demonstrated that the subunit mass assay is a reliable assay for the routine quantitation of methionine oxidation.
Table 1. Summary of assay qualification results. The average results ± 3 SDs and the RSDs are presented from subunit mass experiments using two different columns performed on three different days by two different analysts.
Quantitation of methionine oxidation induced by photo and chemical stress
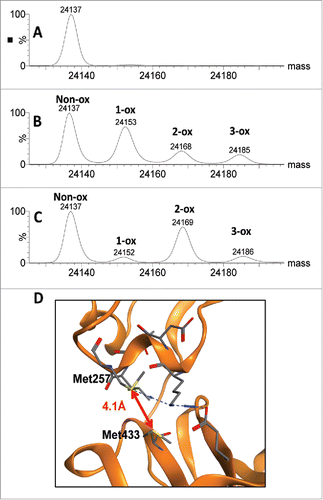
One unique advantage of the subunit mass method is that multiple modifications on the same IgG subunit can be monitored simultaneously. Such information cannot be obtained via peptide mapping analysis, since HC Met257 and HC Met433 are located on two different tryptic peptides. Consistent with previous reports,Citation15,48 scFc oxidation induced by chemical stress such as peracetic acid primarily produced scFc + 1-ox species (theoretical mass 24152 Da, observed mass 24153 Da) (), whereas oxidation induced by photo stress primarily produced scFc + 2-ox species (theoretical mass 24168 Da, observed mass 24169 Da) (). These results suggested that oxidation induced by peracetic acid occurred at both methionines independently, whereas oxidation induced by free radical–induced photo degradation at one site led to rapid oxidation of two adjacent methionine residues on the antibody HC ().
Figure 8. Comparison of scFc methionine oxidation induced by chemical and photo stress. Deconvoluted mass spectra for the scFc subunit of mAb-A are presented for the unstressed control (A), peracetic acid stressed sample (B) and photo stressed sample (C). Structural model of the CH2:CH3 interface showing close proximity of HC Met257 and HC Met433 in mAb-A (D).
The different pattern of scFc oxidation induced by chemical and photo stress suggested that subunit mass analysis can help to diagnose the root cause of methionine oxidation. In one case study, mAb-A drug product (DP) vials stored in the front rows of semi-translucent trays turned slightly yellow after extended storage in a lighted warehouse, whereas vials stored in the middle and back rows remained colorless. Visual inspection of the overlaid deconvoluted scFc subunit mass spectra () indicated that the front row sample had an oxidation profile similar to the photo stressed sample. This sample contained 8.8% 2-ox species and only 3.2% 1-ox species, which suggested that two methionine residues simultaneously oxidized under the photo stress condition due to excessive light exposure (). On the other hand, the oxidation profiles and oxidation levels of the middle and back row samples were similar to the unstressed control. These results indicated that DP oxidation and the associated color change was caused by excessive light exposure, useful information that could not be obtained directly from peptide mapping analysis. This finding was later confirmed by another analysis, which indicated the photo degradation as the root cause for protein oxidation and DP color change.
Figure 9. Deconvoluted spectra of mAb-A DP samples. Overlaid deconvoluted mass spectra of mAb-A scFc subunits are presented for samples collected from different positions in the vial tray along with results from photo and chemically stressed samples.
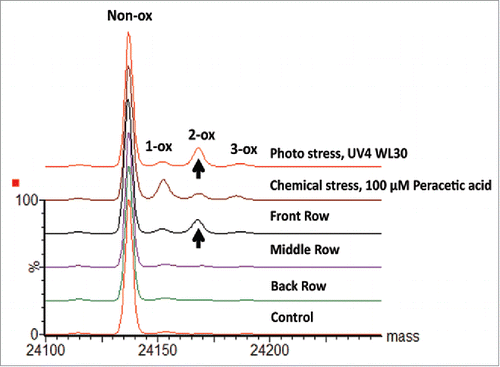
Table 2. Quantitation results of mAb-A DP samples. Results are presented for mAb-A samples collected from different positions in the vial tray along with results from photo and chemically stressed samples.
Discussion
A high-throughput and automated subunit mass analysis method was developed and qualified to monitor antibody oxidation. Automation of data acquisition combined with short sample preparation and chromatography steps allows the analysis of nearly 96 samples per day.
Although subunit-based oxidation analysis has been previously reported,Citation15-17 most of these methods relied on chromatographic separation of the oxidized species and UV-based quantitation. Mass spectrometry was mainly used for peak identification of the oxidized and non-oxidized species. These methods are effective, but lack the resolution and specificity of mass spectrometry, and the elution gradients to resolve the oxidized and non-oxidized species need to be optimized for each mAb. The subunit mass analysis method described here, provides direct quantitation of oxidation levels based on relative intensities of oxidized species in the deconvoluted mass spectra. In addition, deglycosylation using EndoS reduces scFc heterogeneity by removing N-linked glycosylation, which further improves method sensitivity. Importantly, results from subunit mass analysis correlated well with those from peptide mapping analysis.
The subunit mass analysis method has several other advantages compared with the alternative methods for measuring oxidation. This method is generally applicable to all IgG mAbs, and it can be used to simultaneously measure oxidation on all three IgG subunits (LC, Fd’ and scFc) with good precision and linearity. Moreover, subunit mass analysis can distinguish Fc methionine oxidation induced by chemical stress, such as hydrogen peroxide from those induced by photo stress. This is a unique advantage of the subunit analysis, since methionine residues are located in different tryptic peptides, and such correlation is lost during peptide mapping analysis. Finally, although developed as a platform method to quantify oxidation, this method can be extended to multi-attribute analysis of other critical quality attributes (glycosylation, glycation, C-terminal lysine clipping, N-terminal cyclization etc.) of mAb products.Citation49
Materials
Reagents
IdeS (FabRICATOR®) and EndoS (IgGZERO®) were purchased from Genovis. Trypsin was purchased from Promega. All other reagents were purchased from Thermo Fisher Scientific or Sigma-Aldrich unless stated otherwise. All reagents were analytical reagent grade or mass spectrometry grade and were used without further purification. All solutions were prepared with Milli-Q water. All IgGs (IgG1 (mAbs-A, B, and C), IgG4 (mAbs-D and E) and IgG2 (mAb-F)) were manufactured by Janssen Research & Development, LLC.
Methods
Sample preparations
Samples were diluted with 100 mM Tris buffer, pH 7.5 to a final concentration of 1 mg/mL. IdeS and EndoS enzymes were added (half unit / µg of protein) and the samples were incubated at 37°C for 30 min. The digested samples were reduced with 50 mM DTT at 37°C for 15 min in the dark and the reaction was quenched with 10% (v/v) of 1 M HCl.
RP-UPLC-MS for subunit mass analysis
One µg mAb sample was analyzed using Waters ACQUITY UPLC BEH C4 column (300Å, 1.7 μm, 2.1×50 mm) at 60°C on a Waters ACQUITY I-class UPLC. Proteins were eluted from the column with a 7 min linear gradient of 25–40% B at a flow rate of 200 µL/min. Mobile phase A was 0.1% formic acid in H2O. Mobile phase B was 0.1% formic acid in acetonitrile. Online MS analysis was performed on a Waters Xevo G2-XS mass spectrometer (Waters Corporation) in positive ion sensitivity mode. The capillary was set at 2.5 kV and the sampling cone at 40 V. The desolvation and source temperatures were set at 350°C and 100°C, respectively. Data were acquired in an m/z range of 800–3000. The Xevo G2-XS mass spectrometer was calibrated daily using a 1 mg/mL solution of cesium iodide in 50% acetonitrile/water. Mass/charge data collected across the chromatographic peaks were summed and then deconvoluted using the MaxEnt1 algorithm. Oxidation was quantitated using the peak height intensities of the deconvoluted and centered spectra.
Preparation of oxidized mAbs
Oxidized mAbs were prepared by chemical stress with peracetic acid or photo stress with UV and white light as described in the figure legends.
Peptide mapping
Oxidized mAbs samples were denatured with a solution of 6 M guanidine-HCl, 100 mM Tris, and 2.5 mM EDTA, pH 8.0. Proteins were then reduced with 1 M DTT at 37°C for 1h, followed by alkylation with 1 M sodium iodoacetate for 40 min in the dark. Reduced and alkylated proteins were buffer exchanged using NAP5™ column (GE Healthcare) into digestion buffer: 50 mM Tris, pH 8.0 (mAb-A) or 50 mM Tris, 1 mM CaCl2 pH 8.0 (mAb-B). Eluate from column was subsequently digested with Lys-C for 4 h at 37°C (mAb-A) or trypsin for 2 h at 37°C (mAb-B). The resulting peptides were analyzed by RP-HPLC-MS on an HPLC (Agilent) coupled to an ion trap mass spectrometer (Thermo Fisher Scientific). The RP-HPLC separation was performed using a gradient of 0.1% trifluoroacetic acid in water to 0.1% trifluoroacetic in acetonitrile at a flow rate of 0.2 mL/min on a BioSuite C18 2.1 mm × 250 mm column (Waters) at 40°C. Relative quantification was performed by using the total intensity of an extracted ion chromatogram of the peptides of interest. Post-translational modifications were calculated as a relative percent of the native peptide.
Disclosure of potential conflicts of interest
No potential conflicts of interest were disclosed.
Acknowledgment
The authors thank Maggie Huang for providing oxidized mAb materials and peptide mapping results. Dr. Qingrong Yan for providing the structure modeling figure. Authors also would like to thank Dr. Mehul Patel for his continuing support of exploring novel technologies for biopharmaceutical development.
References
- Dashivets T, Stracke J, Dengl S, Knaupp A, Pollmann J, Buchner J, Schlothauer T. Oxidation in the complementarity-determining regions differentially influences the properties of therapeutic antibodies. mAbs 2016; 8:1525-35; PMID:27612038; http://dx.doi.org/10.1080/19420862.2016.1231277
- Mo J, Yan Q, So CK, Soden T, Lewis MJ, Hu P. Understanding the impact of methionine oxidation on the biological functions of IgG1 antibodies using hydrogen/deuterium exchange mass spectrometry. Anal Chem 2016; 88:9495-502; PMID:27575380; http://dx.doi.org/10.1021/acs.analchem.6b01958
- Liu D, Ren D, Huang H, Dankberg J, Rosenfeld R, Cocco MJ, Li L, Brems DN, Remmele RL, Jr. Structure and stability changes of human IgG1 Fc as a consequence of methionine oxidation. Biochemistry 2008; 47:5088-100; PMID:18407665; http://dx.doi.org/10.1021/bi702238b
- Pan H, Chen K, Chu L, Kinderman F, Apostol I, Huang G. Methionine oxidation in human IgG2 Fc decreases binding affinities to protein A and FcRn. Protein Sci 2009; 18:424-33; PMID:19165723; http://dx.doi.org/10.1002/pro.45
- Gaza-Bulseco G, Faldu S, Hurkmans K, Chumsae C, Liu H. Effect of methionine oxidation of a recombinant monoclonal antibody on the binding affinity to protein A and protein G. J Chromatogr B Analyt Technol Biomed Life Sci 2008; 870:55-62; PMID:18567545; http://dx.doi.org/10.1016/j.jchromb.2008.05.045
- Bertolotti-Ciarlet A, Wang W, Lownes R, Pristatsky P, Fang Y, McKelvey T, Li Y, Li Y, Drummond J, Prueksaritanont T, et al. Impact of methionine oxidation on the binding of human IgG1 to Fc Rn and Fc gamma receptors. Mol Immunol 2009; 46:1878-82; PMID:19269032; http://dx.doi.org/10.1016/j.molimm.2009.02.002
- Zhang A, Hu P, MacGregor P, Xue Y, Fan H, Suchecki P, Olszewski L, Liu A. Understanding the conformational impact of chemical modifications on monoclonal antibodies with diverse sequence variation using hydrogen/deuterium exchange mass spectrometry and structural modeling. Analyt Chem 2014; 86:3468-75; PMID:24597564; http://dx.doi.org/10.1021/ac404130a
- Gao X, Ji JA, Veeravalli K, Wang YJ, Zhang T, McGreevy W, Zheng K, Kelley RF, Laird MW, Liu J, et al. Effect of individual Fc methionine oxidation on FcRn binding: Met252 oxidation impairs FcRn binding more profoundly than Met428 oxidation. J Pharm Sci 2015; 104:368-77; PMID:25175600; http://dx.doi.org/10.1002/jps.24136
- Wang W, Vlasak J, Li Y, Pristatsky P, Fang Y, Pittman T, Roman J, Wang Y, Prueksaritanont T, Ionescu R. Impact of methionine oxidation in human IgG1 Fc on serum half-life of monoclonal antibodies. Mol Immunol 2011; 48:860-6; PMID:21256596; http://dx.doi.org/10.1016/j.molimm.2010.12.009
- Beck A, Wagner-Rousset E, Ayoub D, Van Dorsselaer A, Sanglier-Cianferani S. Characterization of therapeutic antibodies and related products. Analyt Chem 2013; 85:715-36; PMID:23134362; http://dx.doi.org/10.1021/ac3032355
- Li X, Xu W, Wang Y, Zhao J, Liu YH, Richardson D, Li H, Shameem M, Yang X. High throughput peptide mapping method for analysis of site specific monoclonal antibody oxidation. J Chromatog A 2016; 1460:51-60; PMID:27432793; http://dx.doi.org/10.1016/j.chroma.2016.06.085
- Rogers RS, Nightlinger NS, Livingston B, Campbell P, Bailey R, Balland A. Development of a quantitative mass spectrometry multi-attribute method for characterization, quality control testing and disposition of biologics. mAbs 2015; 7:881-90; PMID:26186204; http://dx.doi.org/10.1080/19420862.2015.1069454
- Wang Y, Li X, Liu YH, Richardson D, Li H, Shameem M, Yang X. Simultaneous monitoring of oxidation, deamidation, isomerization, and glycosylation of monoclonal antibodies by liquid chromatography-mass spectrometry method with ultrafast tryptic digestion. mAbs 2016; 8:1477-86; PMID:27598507; http://dx.doi.org/10.1080/19420862.2016.1226715
- Houde D, Kauppinen P, Mhatre R, Lyubarskaya Y. Determination of protein oxidation by mass spectrometry and method transfer to quality control. J Chromatogr A 2006; 1123:189-98; PMID:16716331; http://dx.doi.org/10.1016/j.chroma.2006.04.046
- An Y, Zhang Y, Mueller HM, Shameem M, Chen X. A new tool for monoclonal antibody analysis: application of IdeS proteolysis in IgG domain-specific characterization. mAbs 2014; 6:879-93; PMID:24927271; http://dx.doi.org/10.4161/mabs.28762
- Leblanc Y, Romanin M, Bihoreau N, Chevreux G. LC-MS analysis of polyclonal IgGs using IdeS enzymatic proteolysis for oxidation monitoring. J Chromatogr B Analyt Technol Biomed Life Sci 2014; 961:1-4; PMID:24837162; http://dx.doi.org/10.1016/j.jchromb.2014.04.053
- Zhang B, Jeong J, Burgess B, Jazayri M, Tang Y, Taylor Zhang Y. Development of a rapid RP-UHPLC-MS method for analysis of modifications in therapeutic monoclonal antibodies. J Chromatog B Analyt Technol Biomed Life Sci 2016; 1032:172-81; PMID:27233581; http://dx.doi.org/10.1016/j.jchromb.2016.05.017
- Yang J, Wang S, Liu J, Raghani A. Determination of tryptophan oxidation of monoclonal antibody by reversed phase high performance liquid chromatography. J Chromatogr A 2007; 1156:174-82; PMID:17379231; http://dx.doi.org/10.1016/j.chroma.2007.01.140
- Valliere-Douglass J, Wallace A, Balland A. Separation of populations of antibody variants by fine tuning of hydrophobic-interaction chromatography operating conditions. J Chromatog A 2008; 1214:81-9; PMID:19012891; http://dx.doi.org/10.1016/j.chroma.2008.10.078
- Boyd D, Kaschak T, Yan B. HIC resolution of an IgG1 with an oxidized Trp in a complementarity determining region. J Chromatogr B Analyt Technol Biomed Life Sci 2011; 879:955-60; PMID:21440514; http://dx.doi.org/10.1016/j.jchromb.2011.03.006
- Haverick M, Mengisen S, Shameem M, Ambrogelly A. Separation of mAbs molecular variants by analytical hydrophobic interaction chromatography HPLC: overview and applications. mAbs 2014; 6:852-8; PMID:24751784; http://dx.doi.org/10.4161/mabs.28693
- Loew C, Knoblich C, Fichtl J, Alt N, Diepold K, Bulau P, Goldbach P, Adler M, Mahler HC, Grauschopf U. Analytical protein a chromatography as a quantitative tool for the screening of methionine oxidation in monoclonal antibodies. J Pharm Sci 2012; 101:4248-57; PMID:22899501; http://dx.doi.org/10.1002/jps.23286
- Pavon JA, Li X, Chico S, Kishnani U, Soundararajan S, Cheung J, Li H, Richardson D, Shameem M, Yang X. Analysis of monoclonal antibody oxidation by simple mixed mode chromatography. J Chromatogr A 2016; 1431:154-65; PMID:26774436; http://dx.doi.org/10.1016/j.chroma.2015.12.068
- Teshima G, Li MX, Danishmand R, Obi C, To R, Huang C, Kung J, Lahidji V, Freeberg J, Thorner L, et al. Separation of oxidized variants of a monoclonal antibody by anion-exchange. J Chromatogr A 2011; 1218:2091-7; PMID:21145555; http://dx.doi.org/10.1016/j.chroma.2010.10.107
- Beck A, Terral G, Debaene F, Wagner-Rousset E, Marcoux J, Janin-Bussat MC, Colas O, Van Dorsselaer A, Cianferani S. Cutting-edge mass spectrometry methods for the multi-level structural characterization of antibody-drug conjugates. Exp Rev Proteomics 2016; 13:157-83; PMID:26653789; http://dx.doi.org/10.1586/14789450.2016.1132167
- Chevreux G, Tilly N, Bihoreau N. Fast analysis of recombinant monoclonal antibodies using IdeS proteolytic digestion and electrospray mass spectrometry. Analyt Biochem 2011; 415:212-4; PMID:21596014; http://dx.doi.org/10.1016/j.ab.2011.04.030
- Cotham VC, Brodbelt JS. Characterization of therapeutic monoclonal antibodies at the subunit-level using middle-down 193 nm ultraviolet photodissociation. Analyt Chem 2016; 88:4004-13; PMID:26947921; http://dx.doi.org/10.1021/acs.analchem.6b00302
- Sjogren J, Olsson F, Beck A. Rapid and improved characterization of therapeutic antibodies and antibody related products using IdeS digestion and subunit analysis. Analyst 2016; 141:3114-25; PMID:27156477; http://dx.doi.org/10.1039/C6AN00071A
- Fekete S, Guillarme D, Sandra P, Sandra K. Chromatographic, electrophoretic, and mass spectrometric methods for the analytical characterization of protein biopharmaceuticals. Analyt Chem 2016; 88:480-507; PMID:26629607; http://dx.doi.org/10.1021/acs.analchem.5b04561
- Sorensen M, Harmes DC, Stoll DR, Staples GO, Fekete S, Guillarme D, Beck A. Comparison of originator and biosimilar therapeutic monoclonal antibodies using comprehensive two-dimensional liquid chromatography coupled with time-of-flight mass spectrometry. mAbs 2016; 8:1224-34; PMID:27362833; http://dx.doi.org/10.1080/19420862.2016.1203497
- Resemann A, Jabs W, Wiechmann A, Wagner E, Colas O, Evers W, Belau E, Vorwerg L, Evans C, Beck A, et al. Full validation of therapeutic antibody sequences by middle-up mass measurements and middle-down protein sequencing. mAbs 2016; 8:318-30; PMID:26760197; http://dx.doi.org/10.1080/19420862.2015.1128607
- Ayoub D, Jabs W, Resemann A, Evers W, Evans C, Main L, Baessmann C, Wagner-Rousset E, Suckau D, Beck A. Correct primary structure assessment and extensive glyco-profiling of cetuximab by a combination of intact, middle-up, middle-down and bottom-up ESI and MALDI mass spectrometry techniques. mAbs 2013; 5:699-710; PMID:23924801; http://dx.doi.org/10.4161/mabs.25423
- Formolo T, Ly M, Levy M, Kilpatrick L, Lute S, Phinney K, Marzilli L, Brorson K, Boyne M, Davis D, et al. Determination of the NISTmAb Primary Structure. Acs Sym Ser 2015; 1201:1-62; http://dx.doi.org/10.1021/bk-2015-1201.ch001
- Biacchi M, Gahoual R, Said N, Beck A, Leize-Wagner E, Francois YN. Glycoform separation and characterization of cetuximab variants by middle-up off-line capillary zone electrophoresis-UV/electrospray ionization-MS. Analyt Chem 2015; 87:6240-50; PMID:25970692; http://dx.doi.org/10.1021/acs.analchem.5b00928
- Kirley TL, Greis KD, Norman AB. Structural characterization of expressed monoclonal antibodies by single sample mass spectral analysis after IdeS proteolysis. Biochem Biophys Res Commun 2016; 477:363-8; PMID:27342663; http://dx.doi.org/10.1016/j.bbrc.2016.06.099
- Tran BQ, Barton C, Feng J, Sandjong A, Yoon SH, Awasthi S, Liang T, Khan MM, Kilgour DP, Goodlett DR, et al. Comprehensive glycosylation profiling of IgG and IgG-fusion proteins by top-down MS with multiple fragmentation techniques. J Proteom 2016; 134:93-101; PMID:26485299; http://dx.doi.org/10.1016/j.jprot.2015.10.021
- Upton R, Bell L, Guy C, Caldwell P, Estdale S, Barran PE, Firth D. Orthogonal assessment of biotherapeutic glycosylation: a case study correlating N-glycan core afucosylation of herceptin with mechanism of action. Analy Chem 2016; 88:10259-65; PMID:27620140; http://dx.doi.org/10.1021/acs.analchem.6b02994
- Saleem RA, Affholter BR, Deng S, Campbell PC, Matthies K, Eakin CM, Wallace A. A chemical and computational approach to comprehensive glycation characterization on antibodies. mAbs 2015; 7:719-31; PMID:26030340; http://dx.doi.org/10.1080/19420862.2015.1046663
- Wang B, Gucinski AC, Keire DA, Buhse LF, Boyne MT, 2nd. Structural comparison of two anti-CD20 monoclonal antibody drug products using middle-down mass spectrometry. Analyst 2013; 138:3058-65; PMID:23579346; http://dx.doi.org/10.1039/c3an36524g
- Kita A, Ponniah G, Nowak C, Liu H. Characterization of cysteinylation and trisulfide bonds in a recombinant monoclonal antibody. Analyt Chem 2016; 88:5430-7; PMID:27115984; http://dx.doi.org/10.1021/acs.analchem.6b00822
- Said N, Gahoual R, Kuhn L, Beck A, Francois YN, Leize-Wagner E. Structural characterization of antibody drug conjugate by a combination of intact, middle-up and bottom-up techniques using sheathless capillary electrophoresis - Tandem mass spectrometry as nanoESI infusion platform and separation method. Analyt Chim Acta 2016; 918:50-9; PMID:27046210; http://dx.doi.org/10.1016/j.aca.2016.03.006
- Wagner-Rousset E, Janin-Bussat MC, Colas O, Excoffier M, Ayoub D, Haeuw JF, Rilatt I, Perez M, Corvaia N, Beck A. Antibody-drug conjugate model fast characterization by LC-MS following IdeS proteolytic digestion. mAbs 2014; 6:273-85; PMID:24135617; http://dx.doi.org/10.4161/mabs.26773
- von Pawel-Rammingen U, Johansson BP, Bjorck L. IdeS, a novel streptococcal cysteine proteinase with unique specificity for immunoglobulin G. The EMBO journal 2002; 21:1607-15; PMID:11927545; http://dx.doi.org/10.1093/emboj/21.7.1607
- Sjogren J, Okumura CY, Collin M, Nizet V, Hollands A. Study of the IgG endoglycosidase EndoS in group A streptococcal phagocyte resistance and virulence. BMC microbiology 2011; 11:120; PMID:21619648; http://dx.doi.org/10.1186/1471-2180-11-120
- Sjogren J, Cosgrave EF, Allhorn M, Nordgren M, Bjork S, Olsson F, Fredriksson S, Collin M. EndoS and EndoS2 hydrolyze Fc-glycans on therapeutic antibodies with different glycoform selectivity and can be used for rapid quantification of high-mannose glycans. Glycobiology 2015; 25:1053-63; PMID:26156869; http://dx.doi.org/10.1093/glycob/cwv047
- Chumsae C, Gaza-Bulseco G, Sun J, Liu H. Comparison of methionine oxidation in thermal stability and chemically stressed samples of a fully human monoclonal antibody. J Chromatogrphy B Analyt Technol Biomed Life Sci 2007; 850:285-94; PMID:17182291; http://dx.doi.org/10.1016/j.jchromb.2006.11.050
- Stracke J, Emrich T, Rueger P, Schlothauer T, Kling L, Knaupp A, Hertenberger H, Wolfert A, Spick C, Lau W, et al. A novel approach to investigate the effect of methionine oxidation on pharmacokinetic properties of therapeutic antibodies. mAbs 2014; 6:1229-42; PMID:25517308; http://dx.doi.org/10.4161/mabs.29601
- Liu H, Gaza-Bulseco G, Zhou L. Mass spectrometry analysis of photo-induced methionine oxidation of a recombinant human monoclonal antibody. J Am Soc Mass Spectr 2009; 20:525-8; PMID:19103498; http://dx.doi.org/10.1016/j.jasms.2008.11.011
- Dong J, Migliore N, Mehrman SJ, Cunningham J, Lewis MJ, Hu P. High-throughput, automated protein a purification platform with multiattribute LC-MS analysis for advanced cell culture process monitoring. Analyt Chem 2016; 88:8673-9; PMID:27487007; http://dx.doi.org/10.1021/acs.analchem.6b01956