ABSTRACT
TL1A is an attractive therapeutic target for the treatment of mucosal inflammation associated with inflammatory bowel disease (IBD) and asthma. Blockade of the TL1A pathway has been shown to reduce inflammatory responses while leaving baseline immunity intact, and to be beneficial in animal models of colitis and asthma. Given the therapeutic potential of blocking this pathway in IBD and asthma, we developed C03V, a human antibody that binds with high affinity to soluble and membrane-bound TL1A. In an assay measuring apoptosis induced by exogenous TL1A, C03V was 43-fold more potent than the next most potent anti-TL1A antibody analyzed. C03V also potently inhibited endogenous TL1A activity in a primary cell-based assay. This potency was linked to the C03V-binding epitope on TL1A, encompassing the residue R32. This residue is critical for the binding of TL1A to its signaling receptor DR3 but not to its decoy receptor DcR3, and explains why C03V inhibited TL1A-DR3 binding to a much greater extent than TL1A-DcR3 binding. This characteristic may be advantageous to preserve some of the homeostatic functions of DcR3, such as TL1A antagonism. In colitis models, C03V significantly ameliorated microscopic, macroscopic and clinical aspects of disease pathology, and in an asthma model it significantly reduced airways inflammation. Notable in both types of disease model was the reduction in fibrosis observed after C03V treatment. C03V has the potential to address unmet medical needs in asthma and IBD.
Introduction
TL1A (also known as tumor necrosis factor superfamily member 15 [TNFSF15]) is a member of the TNF ligand superfamily and, like other members, is homotrimeric. It is a single-pass type II membrane protein that is cleaved by endogenous proteases to produce a soluble form. Both the membrane-bound and soluble forms are active. TL1A is expressed at low levels by endothelial cells under steady-state conditionsCitation1 and at higher levels by tissue macrophages, lamina propria lymphocytes, and CD11chigh dendritic cells under inflammatory conditions.Citation2,Citation3
TL1A has two known receptors: Death Receptor 3 (DR3, TNFRSF25) and Decoy Receptor 3 (DcR3, TNFRSF6b). DR3 is constitutively expressed at low levels on T, B and NK cells, and is upregulated upon cell activation.Citation4 Soluble TL1A is sufficient for activation of DR3.Citation5 Signaling through DR3 activates the NF-κB signaling pathway and is both costimulatory and anti-apoptotic on T cells.Citation1,Citation6 Additionally, DR3 contains a canonical TNF receptor family death domain and may be pro-apoptotic when NF-κB signaling is not activated.Citation7 DcR3 is a soluble decoy receptor that is also bound by other TNF superfamily members FAS ligand and LIGHT.
DR3 signaling is not a primary driver of immunity, but rather amplifies activation under certain conditions. It has been reported as amplifying Th1 responses by synergizing with interleukin (IL)-12,Citation2,Citation8 and Th17 responses by synergizing with IL-23.Citation9,Citation10 TL1A blockade in established, dextran sodium sulfate (DSS)-induced colitis mouse models reduced the pathology of disease and the generation of Th1 and Th17 cells.Citation10,Citation11 Neutralization of TL1A by a monoclonal antibody resulted in a reversal of colonic fibrosis to pre-inflammatory levels by lowering expression of connective tissue growth factors.Citation12 Likewise in an acute 2, 4, 6 –trinitrobenzenesulfonic acid (TNBS)-driven mouse model of colitis, which is dependent on interferon (IFN)-γ from Th1 cells, an antibody against TL1A prevented weight loss and histological signs of inflammation.Citation11 Many genome-wide association studies have identified polymorphisms in the TNFSF15 locus conferring genetic susceptibility to Crohn's disease and ulcerative colitis.Citation13
TL1A is important for sustained pathological Th2 responses, and blockade of TL1A with neutralizing antibodies reduced inflammation and levels of the cytokines IL-4, IL-5, and IL-13 in a murine model of ovalbumin-induced asthma.Citation14 TL1A signaling through DR3 also enhances Th9 cell pathogenicity in allergic responses.Citation15 Recently TL1A has been identified as a driver of group 2 innate lymphoid cell (ILC2) expansion and is able to induce upregulation of IL-5 and IL-13 production from this cell type.Citation16,Citation17 ILC2 have been identified as primary drivers of asthma-associated inflammation, both in animal modelsCitation18 and in human disease,Citation19 implying a significant role for TL1A in asthma induction.
Given the potential for TL1A blockade in the treatment of inflammatory diseases, such as asthma and inflammatory bowel disease (IBD), we developed an anti-TL1A monoclonal antibody termed C03V. Based on its high affinity, selectivity and potency both in vitro and in vivo, we conclude that C03V is an attractive candidate for clinical development.
Result
Characterization of antibody C03V binding to TL1A
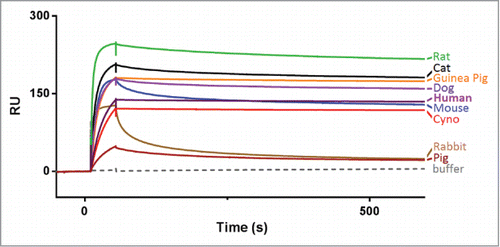
Anti-human TL1A antibody C03V was isolated from a human phage display library and converted to human IgG1 lambda (see Methods). Using surface plasmon resonance (SPR), C03V was tested for its ability to bind to TL1A from non-human species: dog, cynomolgus monkey, cat, pig, guinea pig, rabbit, rat and mouse (). In addition to human TL1A, C03V bound strongly to cynomolgus monkey, dog, cat, guinea pig, rat and mouse TL1A, and weakly to pig and rabbit TL1A.
Figure 1. Single kinetic analysis of anti-TL1A antibody C03V binding to TL1A from different species as measured using surface plasmon resonance. (RU – response units). Abbreviation: cyno = cynomolgus macaque.
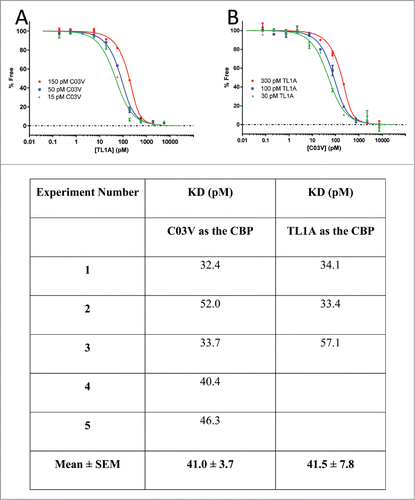
The affinity of C03V binding to human TL1A was determined using a Kinetic Exclusion Assay (KinExA). KinExA measures the free concentration of one of the binding partners without perturbing the equilibrium of the solution. The assay was performed with the antibody (), or TL1A (), as the constant binding partner (CBP). C03V is a high affinity antibody to TL1A with an equilibrium dissociation constant (KD) of 41 pM. Using SPR, C03V did not bind to other TNF ligand superfamily members, including TNF-α, GITR ligand, 4-1BB ligand, CD27 ligand, CD30 ligand, CD40 ligand, LIGHT, TRAIL, APRIL, BAFF, EDA-A1, EDA-A2, RANK ligand, OX40 ligand, lymphotoxin α, lymphotoxin β and FAS ligand (Supp. Figure 1A). TWEAK and CD27 were analyzed separately from the other family members as these required a different SPR assay format. C03V did not bind these family members either (Supp. Figure 1B and 1C).
Figure 2. The affinity of C03V for human TL1A was determined using KinExA. A: C03V/TL1A KD determination with C03V as the constant binding partner (CBP). Equilibrium curves were generated with 15, 50 and 150 pM C03V. B: C03V/TL1A KD determination with TL1A as the CBP. Equilibrium curves were generated with 30, 100 and 300 pM TL1A. Table: KD values were determined using n-curve analysis of the equilibrium curves and an average KD value determined for each experiment. Five separate experiments were performed using C03V as the CBP and 3 separate experiments using TL1A as the CBP.
Overall, C03V is a highly TL1A-selective monoclonal antibody with a very high affinity for human TL1A and strong binding to TL1A from a number of species useful for in vivo pharmacology such as cynomolgus monkey, rat, mouse and guinea pig.
C03V inhibits the binding of TL1A to DR3 and to a lesser extent to DcR3
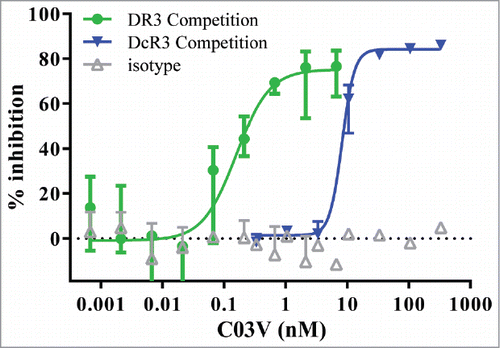
TL1A has been shown to induce pro-inflammatory effects through binding to DR3.Citation20 DcR3 is a decoy receptor for TL1A, FAS ligand and LIGHT.Citation21 The ability of C03V to neutralize TL1A binding to DR3 and DcR3 was measured using a competition ELISA. In 3 independent experiments, C03V neutralized human TL1A binding to DR3 with IC50 values between 0.06 and 0.30 nM and to DcR3 with IC50 values between 8 and 10 nM (). Thus C03V selectively inhibits TL1A binding to DR3 with 78-fold (mean value; n = 3) greater potency compared to DcR3. This mode of receptor-selective inhibition could have the advantage of dual TL1A-inhibitory actions: a direct antibody-mediated effect and the residual inhibition mediated by DcR3.
C03V binding to R32 on TL1A confers DR3 selectively
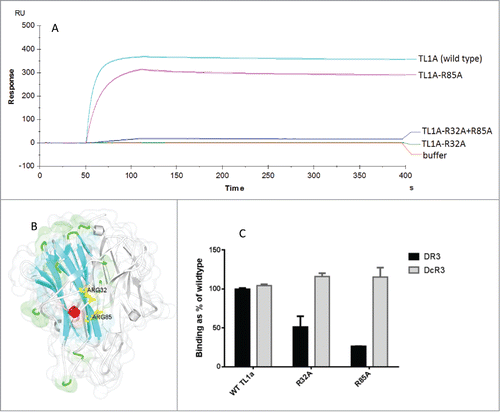
We generated a series of TL1A variants in which each residue predicted to be solvent-accessible was substituted to an alanine residue. When these variants were screened by SPR, variant TL1A-R32A no longer bound to C03V, and TL1A-R85 showed reduced binding to C03V (). Though distant in primary amino acid sequence, R32 and R85 are located in close proximity on the X-ray crystal structure of TL1A (). Both variants had reduced binding to DR3 in a receptor ELISA, but retained full binding to DcR3 ().
Figure 4. A) Kinetic analysis of anti-TL1A antibody C03V binding to variants of TL1A measured by SPR (duplicate runs shown) (RU – response units) B) The X-ray crystal structure of TL1A (PDB: 2RE9) showing ARG32 (R32) and ARG85 (R85) in yellow on one of the monomers in TL1A. Ribbon colors indicate secondary structure type, grey indicates other TL1A monomers in the trimeric TL1A structure; C) An ELISA measuring the binding of TL1A, TL1A-R32A and TL1A-R32A to DR3 and DcR3.
C03V is a potent inhibitor of TL1A in a cell-based assay
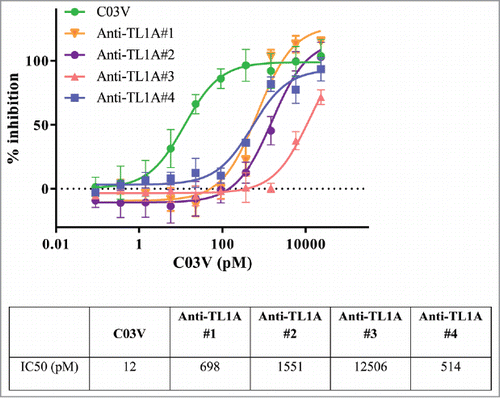
Recombinant human TL1A induces apoptosis of cycloheximide-treated human TF-1 cells. When C03V or four other disclosed, potent anti-TL1A antibodies were tested, C03V was 43-fold more potent than the next most potent anti-TL1A antibody (Antibody #4) (). As measured in this cell based assay, C03V is the most potent anti-TL1A antibody we tested.
C03V binds to primary human cell-expressed soluble and membrane-bound TL1A
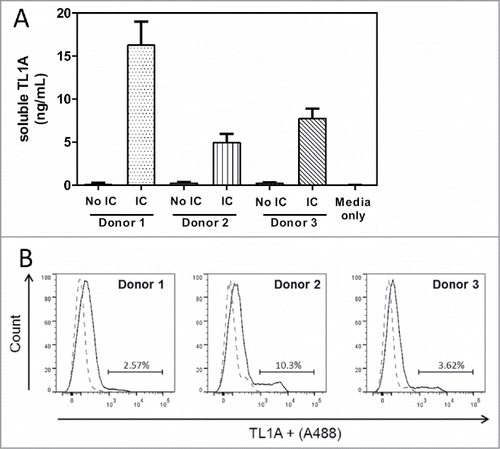
Experiments above demonstrated the binding of C03V to recombinant human TL1A. Here, binding was tested towards native TL1A, both soluble and membrane-bound, from primary human cells. In an ELISA using C03V as capture antibody, soluble TL1A was detected in cell culture supernatant from primary human cells stimulated with immune complexes (). Using C03V for detection, membrane-bound TL1A was detected on unstimulated primary human cells by flow cytometry (). Activated cells have lower levels of membrane-bound TL1A (data not shown). This result may be due to metalloproteinase cleavage of the TL1A to release soluble TL1A, which is highly elevated in immune complex-stimulated samples.
Figure 6. C03V binds to soluble and membrane-bound TL1A expressed by primary human peripheral blood mononuclear cells (PBMC). Soluble TL1A was detected by ELISA using C03V as a capture antibody. For binding experiments, C03V was conjugated to Alexa fluor® 488 and TL1A+ represents cells that bound to C03V. A) Secreted TL1A detected in cell culture supernatants of human PBMCs stimulated with immune complexes (n = 3 donors, mean + SEM). (B) Representative histogram of C03V binding (solid line) and isotype control (broken line) to membrane-bound TL1A on peripheral blood mononuclear cells isolated from human donors. Cells were analysed by gating for single, live cells (n = 3 donors corresponding to donors from (A)).
C03V inhibits endogenous TL1A activity in primary human cells
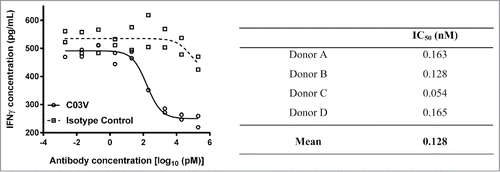
Stimulation of whole blood samples with immune complexes, IL-12 and IL-18 induces TL1A, which subsequently stimulates IFNγ production (). When tested with blood from four donors, C03V demonstrated potent, dose-dependent inhibition of TL1A-induced IFNγ with a mean IC50 value of 128 pM.
Figure 7. Blood samples from four human donors were analyzed for C03V inhibition of TL1A induced IFNγ production. Graph: C03V dose response curves were generated by plotting concentrations of IFNγ in pg/mL against the log of antibody concentrations. An isotype control antibody failed to inhibit IFNγ production more than 50% across the concentration range tested (2 technical replicates per donor, graph is representative of four donors). Table: C03V demonstrated a dose-dependent inhibition of IFN-γ production with IC50 values in the range of 0.054–0.165 nM.
C03V does not induce ADCC
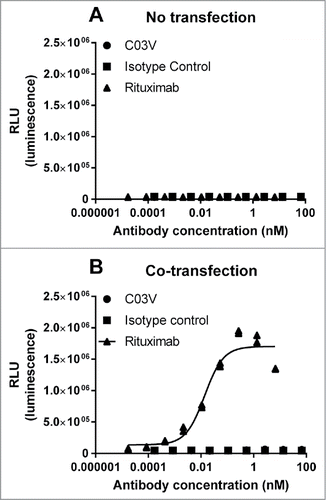
Because TL1A can be expressed in a membrane-bound form, it is possible that C03V could induce antibody-dependent cell-mediated cytotoxicity (ADCC) of TL1A-expressing cells. This was tested with target cells transiently transfected with TL1A and CD20 (as a positive control) using the ADCC Reporter Bioassay kit (Promega). Following transfection and immediately prior to the ADCC experiments, 33% of cells were positive for TL1A, as detected by C03V, and 44% for CD20, as detected by rituximab, compared to an isotype control by flow cytometry. Non-transfected cells did not show any induction of ADCC when treated with either C03V or rituximab (). ADCC was not induced on cells that were transfected with TL1A and CD20 and treated with C03V (), but was induced when the cells were treated with rituximab.
Figure 8. (A) Non-transfected EXPI293F cells did not show any induction of ADCC when treated with C03V or rituximab; (B) CO3V did not induce ADCC on cells co-transfected with TL1A and CD20 at any tested concentration but rituximab did induce ADCC activity on co-transfected EXPI239F cells. These results are representative of 3 independent experiments.
C03V potently ameliorates disease pathology in rat models of colitis
Because TL1A has a well-described role in gut pathology, C03V was tested in models of IBD. Based on binding of C03V to rat TL1A () and its potent inhibition of rat TL1A in the TF1 cell-based activity assay (IC50 of 559 pM, data not shown) but not mouse TL1A (IC50 of > 10,000 pM, data not shown), rat was selected as the pharmacological test species for these IBD (and asthma) models.
In a standard 7 day model of TNBS–induced colitis, animals were treated with either C03V or an isotype control antibody. Treatment with C03V significantly ameliorated the decrease in colon length, and the increase in colon weight, colon wall thickness and ulceration induced by TNBS. C03V also significantly reduced stricture severity and number of adhesions (). C03V treatment significantly reduced the overall clinical disease score compared to treatment with vehicle (p<0.0001) or isotype control (p<0.01) (). Treatment with isotype control antibody appeared to improve some disease parameters compared with vehicle, but these differences did not reach statistical significance. We have frequently observed some level of isotype control effect in colitis models in the rat, but these tend to be much less marked than the effects of targeted treatment.
Figure 9. Macroscopic (A-D) and microscopic (E-F) assessment of colons from TNBS-induced colitis rats 7 days after a single TNBS instillation. Rats exhibited significant colon thickening at site of instillation, with stricturing and multiple adhesions. Microscopically, extensive inflammation and intermediate fibrosis are seen. Treatment with C03V significantly ameliorated these disease parameters compared with either vehicle or isotype control. (• naïve; ▪ vehicle;; ♦ isotype; ▴ C03V plotted as individual replicates with mean±S.E.M indicated. P<0.05 taken as statistically significant. Kruskall-Wallis test; n = 8).
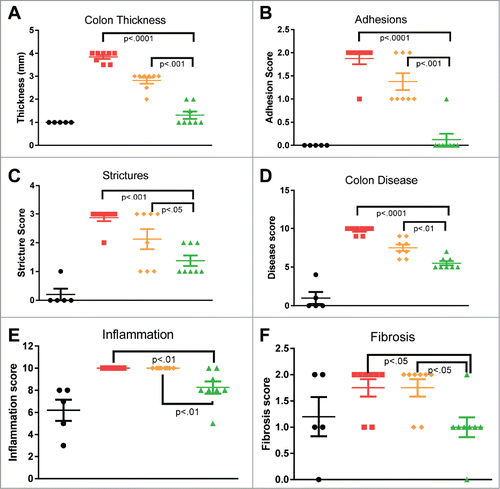
Additionally, histopathological assessment of colon sections revealed significant reduction in inflammatory infiltrate and fibrosis in animals treated with C03V ( and ).
In order to further investigate the effects of C03V on colonic ulceration and repair, a study was initiated using 2, 4-dinitrobenzenesulfonic acid (DNBS), which has lower chronic toxicity and a longer disease window than TNBS; cohorts of animals were observed out to both 7 and 14 days. In this model, weight loss was transient and animals rapidly gained weight after the initial loss without any differences observable between any groups including naïve animals. Similarly, induction of diarrhoea was transient and there were no statistically significant differences observable between any groups (data not shown). A significant shortening of colon length was observed for DNBS-induced animals treated with either vehicle (13.5±0.8 cm) or isotype control (14.7±0.9 cm) compared with naïve (16.5±1.7 cm). Treatment with C03V normalized colon length (16.0±0.9 cm).
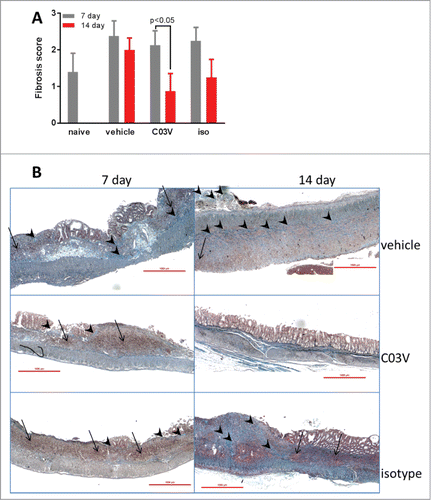
There was some fibrosis observed in naïve animals on day 7, attributable to the ethanol instillation. This effect may confound some of the 7 day results, but is gone by day 14. Although only a modest reduction in fibrosis was observed in C03V-treated animals after 7 days, this reduction was much more marked at 14 days, and C03V-treated animals showed evidence of reduced fibrosis induction and restored colonic epithelial architecture in the affected areas (). In contrast, although there was some effect from the isotype control between 7 and 14 days, this did not reach statistical significance and restoration of colonic architecture in affected areas was not apparent.
Figure 10. Ongoing colonic fibrosis and epithelial erosion is induced by a single instillation of DNBS. A. Fibrosis scoring at 7 and 14 days post-DNBS. The only significant effect was observed in the C03V treatment group which had reduced fibrosis after 14 days (compared to 7 days). (student's t-test; n = 8). B. Representative photomicrographs of Masson's trichrome staining of colon sections from ulcer (DNBS instillation) area. Vehicle and isotype control-treated rats had comparable degrees of epithelial erosion, inflammatory foci (arrows) and mild-moderate fibrosis (arrowheads) at both 7 and 14 days post-DNBS. In contrast, C03V = treated rats had significantly reduced fibrosis and restored epithelial architecture at 14 days.
C03V potently ameliorates disease in a rat model of asthma
Given the strong association between TL1A and various aspects of asthma pathology, C03V was tested in an ovalbumin (OVA)-induced asthma model in Brown Norway rats. Bronchoalveloar lavage fluid (BALF) was assessed for total and differential cell numbers. Lung histopathology was assessed from hematoxylin and eosin (H&E), Masson's trichrome (M-T, for assessment of fibrosis) and periodic acid-Schiff (PAS, for assessment of mucus production) stained sections. Animals were treated with either C03V or an isotype control antibody weekly from days 14 to 35 of the study.
Airways total cell and eosinophil numbers are used as indicators of inflammation in both human asthma and animal models.Citation22 OVA-challenged rats had significantly increased BALF total cells and eosinophils and these counts were significantly reduced by treatment with C03V (p<0.001). There was also some reduction observed in isotype control-treated animals, but this did not reach statistical significance (, ). There was no modulation of other cell types in the BALF by C03V.
Figure 11. Assessment of BALF total cells (A) and eosinophils (B), and interstitial fibrosis by Masson's trichrome staining (C). Treatment with C03V significantly reduced induction of total cells (p<0.01) and eosinophils (p<0.001) in BALF (Kruskall-Wallis test; n = 8), and abrogated the very mild induction of fibrosis. (• naïve; ▪ vehicle; ▴ C03V; ♦ isotype).
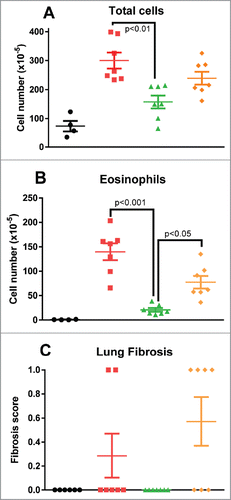
Overall, histology showed mild induction of airways pathology: parameters elevated in untreated animals by this asthma protocol were mucus production (score of 1.7 versus 0.5 in naïve), mucosal thickness (score of 1.7 versus 0 in naïve) and fibrosis (score of 0.7 versus 0 in naïve). There was no observable fibrosis in the C03V-treated group (), but the mucus production and mucosal thickening scores were indistinguishable from vehicle- and isotype control-treated groups (data not shown).
Discussion
Although biologics have profoundly advanced the treatment of inflammatory diseases in recent years, there is still significant unmet need for new therapies that address such aspects as therapy-nonresponsive populations, for pathologies not improved by existing drugs, e.g., fibrosis, and for reduced immunosuppression.
TL1A is an attractive target for multiple reasons: 1) its close association with mucosal immunology suggests blocking it may provide a potential benefit for inflammatory diseases involving mucosal surfaces, e.g., IBD and asthma; 2) its role as an immune amplifier suggests that it should be possible to dampen excess immune activation without affecting baseline immunity; 3) the TL1A-DR3 pathway has been specifically implicated in the fibrotic aspects of Crohn's disease, and TL1A blockade has been shown to be effective not only at inhibiting ongoing fibrosis, but also the higher hurdle of reversing established colonic fibrosis, as shown in the DSS-induced mouse model of Crohn's diseaseCitation12; and 4) the existence of the decoy receptor DcR3 raises the possibility that an antibody could be developed that blocks TL1A-DR3 cognate signaling without complete inhibition of TL1A-DcR3 engagement, thereby allowing some preservation of endogenous TL1A inhibition and yielding enhanced blockade. Given the utility of blocking the TL1A pathway in IBD and asthma, we sought to develop a neutralizing antibody to exploit these attractive features.
Here, we report the characterization of C03V, a human antibody, which binds with high affinity (41 pM) and selectivity, and neutralizes TL1A bioactivity. Affinity determination by KinExA measuring free analyte after interaction equilibrium allows accurate measurements of affinity even in circumstances where avidity contributes to the binding, such as in this instance where TL1A is trimeric and the antibody is dimeric. Selectivity evaluation by SPR showed that, despite the high homology between members of the TNF ligand superfamily, there was no binding observed to known TNF superfamily member ligands. C03V is thus a high affinity antibody with exquisite selectivity for TL1A.
Given the respective roles of the two TL1A receptors, DR3 in proinflammatory signaling and DcR3 as a natural antagonist of this system, an antibody that preferentially inhibits the TL1A-DR3 interaction while allowing the TL1A-DcR3 interaction would be highly desirable, effectively enabling dual modes of TL1A blockade. Based on the X-ray crystal structure of TL1A in complex with DcR3, Zhan et al. concluded that DR3 and DcR3 have distinct but overlapping binding sites on TL1A.Citation23 Despite this overlap, during our antibody discovery campaigns we were able to identify an antibody with preferential DR3 inhibition. We show that C03V is able to inhibit TL1A binding to DR3 to a greater extent than DcR3 (78-fold), and we have identified a site on TL1A to which the C03V antibody binds that preferably disrupts the DR3 interaction over the DcR3 interaction. This supports the hypothesis that, although DcR3 competes with DR3 for TL1A binding, the two do not share identical molecular footprints. Alanine scanning of the TL1A sequence identified TL1A-R32 as a critical residue for C03V binding. When substituted, this residue resulted in a 50% decrease in TL1A binding to DR3, but no decrease in DcR3 binding. Therefore, the epitope encompassing TL1A-R32 is a critical region involved in DR3 binding and confers on C03V a DR3>DcR3 selective inhibition profile. The residual DcR3 activity associated with this binding profile could contribute to homeostasis of TL1A and other DcR3 ligands FAS Ligand and LIGHT.
C03V, an antibody with high affinity and ability to preferentially block TL1A-DR3, was tested for functional activity in a TL1A-induced apoptosis assay using the TF-1 cell line. We compared the activity of C03V with antibodies publicly disclosed as inhibitors in this assay, including one that has progressed to clinical trial. With an IC50 value of 12 pM, C03V was the most potent antibody at inhibiting TL1A-mediated apoptosis, being 43-fold more potent than the next most potent anti-TL1A comparator.
Whereas recombinant TL1A was used to evaluate C03V in the TF-1 functional assays, primary human blood cells were used to confirm that C03V could recognize and inhibit native TL1A. Native TL1A was detected with C03V, both as a secreted form from stimulated cell culture supernatants, and as a membrane-bound form by flow cytometry on human PBMCs. Functional inhibition of endogenous TL1A activity was also demonstrated: IC50 was 128 pM for inhibition of TL1A-induced IFNγ production in human PBMC culture. This data indicates that C03V is capable of inhibiting TL1A in an ex vivo human system and provides support for the investigation of C03V in humans.
Because C03V is a human IgG1 antibody and TL1A exists in a membrane-bound form, it has the potential to mediate ADCC. However, C03V did not induce detectable ADCC on TL1A+ cells despite ADCC being readily inducible by a positive control anti-CD20 antibody. We have not ruled out the possibility that the mechanism causing lack of ADCC is rapid internalization of anti-TL1A/membrane TL1A complexes, as has been described for anti-TNF/membraneTNF complexes.Citation24
Furthermore, C03V did not induce complement-dependent cytotoxicity (CDC) on TL1A+ cells using human serum as the source of complement (data not shown). Therefore, it is unlikely that C03V would lead to direct antibody-mediated depletion of immune cell types expressing membrane-bound TL1A, and it is more likely that the primary mode of action is via inhibition of TL1A binding to DR3.
Given the strong association between TL1A and mucosal immunity, C03V was tested in models of both IBD and asthma. In these models, antibody dosing was “semi-therapeutic”, i.e., treatment commenced after disease induction but prior to the development of frank disease. We consider this similar to what would be expected for clinical use of these antibodies, whose role would be one of chronic prophylaxis rather than treatment of acute exacerbations. One of the limitations of using rat models is that it is not possible to examine the therapeutic potential of preferential blockade of DR3 over DcR3 by C03V as there is no evidence that rats (or mice) have DcR3.Citation25 Nevertheless, rodent models of IBD and asthma have been used extensively to assess TL1A-DR3 antagonists, as we described in the Introduction.
In colitis models C03V dosing commenced on day 2, where significant histopathology has been reported for this type of model,Citation26 and in asthma models treatment was commenced after antigen sensitization but prior to antigen challenge, a regime consistent with the clinical use of antibodies for asthma therapy.
Because existing literature has highlighted the potential for TL1A blockade to prevent and even reverse colonic fibrosis,Citation12 we focused on the macroscopic and microscopic aspects of colitis. In these colitis models, C03V significantly ameliorated multiple aspects of disease pathology. In addition to improvement in colon inflammation, there was evidence of a meaningful effect on both stricturing and fibrosis, two elements of inflammatory bowel diseases that have no effective therapy to date. The longer duration of the DNBS-induced colitis study (14 days vs 7 days for TNBS-induced colitis) provided a greater window to assess the possibility that C03V treatment could not only prevent the progression of fibrosis, but also reverse established fibrosis to some extent. Some isotype control effect was observed in these colitis models, although the effect was always less than observed for the targeted C03V and did not reach statistical significance for any measure. We have observed this phenomenon in multiple colitis studies with this and other isotype control antibodies. It is dose-related, i.e., the magnitude increases with antibody dose, and is conceivably a genuine therapeutic effect. Intravenous immunoglobulin therapy (IVIG) is a recognized treatment for IBDCitation27 and it is possible that in this context, the isotype control antibodies are having some level of IVIG-like effect.
The promising results in colitis models led us to further investigate the effects of C03V on mucosal inflammation of the respiratory system. In an ovalbumin-induced asthma model in rats, C03V significantly reduced airways inflammation. This was most readily observed in BALF, where a significant influx of eosinophils was seen for untreated and isotype control treated animals, but not for C03V-treated animals. As this is considered a model for eosinophilic asthma, reduction of lung eosinophil numbers to near-naïve levels is highly relevant to the disease state. The C03V treatment group showed no fibrosis, although it should be noted that the level of structural change in control-treated animals was relatively low.
In both types of disease model, the reduction in fibrosis observed after C03V treatment was notable. Although fibrosis induction was modest in the asthma model, robust fibrosis was induced in the colitis models, and C03V treatment demonstrated a reduction in fibrosis between 7 and 14 days post-induction. This supports the previously reported role of TL1A blockade as anti-fibrotic.Citation12
In conclusion, we identified a novel, human antibody, C03V, that binds to an epitope on TL1A allowing for highly potent and selective neutralization of DR3 signaling. We provide evidence for its utility in the treatment of diseases involving TL1A dysregulation, including disease with a fibrotic component. C03V has the potential to address unmet medical need in asthma and IBD, and other diseases in which TL1A contributes to pathology.
Materials and methods
Generation of TL1A and variants
The amino acid sequences of human, dog, cat, pig, cynomolgus monkey, guinea pig, rabbit, rat and mouse TL1A were obtained from UniProt (http://www.uniprot.org/).
TL1A was produced using the mammalian HEK293E/pTT5 expression systemCitation28 from an expression cassette encoding the extracellular domain of TL1A with N-terminally located HIS and FLAG tag. HEK293E cells were cultured in complete cell growth media (1 L of F17 medium (Thermo), 9 ml of Pluronic F68 (Thermo), 2 mM glutamine containing 20% (w/v) Tryptone NI (Organotechnie) with Geneticin™ (Thermo)) at 50 µl/100 ml culture. On the day before transfection, cells were harvested and resuspended in fresh media without Geneticin™. For transfection, DNA was mixed with FreeStyle MAX reagent and added to the culture drop-wise. The culture was incubated overnight at 37°C, 5% CO2 and 120rpm without Geneticin™. The next day 12.5 ml of Tryptone and 250 μl of Geneticin™ were added per 500 ml culture. The culture was incubated at 37°C, 5% CO2 and 120rpm for seven days, then the supernatants were harvested and purified.
Culture supernatant containing the secreted TL1A protein was harvested by centrifugation at 2000g for 10 min to remove the cells. The TL1A protein was purified from the supernatant using a HisTrap™ HP column following the manufacturer's instructions (GE Healthcare). The eluted protein was buffer-exchanged into phosphate-buffered saline (PBS) using a HiLoad 16/60 Superdex 200 preparatory grade column (GE Healthcare) and the ∼70kDa fraction was separated by gel filtration on a HiLoad 26/60 Superdex 200 prep grade column (GE Healthcare).
Variants of TL1A with single substitutions of solvent accessible residues identified from PDB:2RE9 were generated by gene synthesis and purified according to the methods described above. The amino acid position numbering of TL1A variants was that used by Jin et al.Citation29
Expression and purification of monoclonal antibody C03V and other anti-TL1A antibodies
The heavy and light chain variable regions of antibody C03V were isolated from a fully human phage display library. The heavy chain variable region was subcloned into a mammalian expression vector containing a human IgG1 constant region to produce a full-length antibody heavy chain. Similarly, the light chain lambda variable region was subcloned into a mammalian expression vector containing a human lambda light chain constant region. Antibodies were produced by co-transfecting antibody heavy and light chains into EXPI293® cells (Life Technologies, A14527) following the manufacturer's instructions. Cultures were harvested at approximately 72 h post-transfection by centrifugation at 3000g for 20 min, and supernatants were filtered using a 0.22 µm filter (Corning). The antibody was purified from supernatant using MABSELECT SURE® protein A resin (GE Healthcare) following manufacturer's instructions. Antibodies were desalted into Sørensen's PBS (59.5 mM KH2PO4, 7.3 mM Na2HPO4.2H2O, 145.4 mM NaCl (pH ∼5.8)) using PD-10 columns (GE Healthcare).
Other anti-TL1A antibodies were identified through a search of patent filings. Anti-TL1A #1 is antibody 1D1 1.31 as described in WO 2015/073580 A1 (VH is SEQ ID NO: 226; VL is SEQ ID NO: 22) and is the subject of a clinical trial (NCT01989143). Anti-TL1A #2 is humanized 1B4 as described in U.S. Pat. No. 8,263,743 (VH is SEQ ID NO: 74; VL is SEQ ID NO: 75). Anti-TL1A #3 is antibody VH5/VL1 from U.S. Publ. No. 2014/0308271 (VH is SEQ ID NO: 24; VL is SEQ ID NO: 17). Anti-TL1A #4 is antibody 1681N described in U.S. Pat. No. 8,642,741 (VH is SEQ ID NO: 18; VL is SEQ ID NO. 26). The variable regions were synthesized de novo and then subcloned into mammalian expression vectors, and expressed and purified as described above.
General methods for SPR analysis
Analysis was performed on a Biacore T200 (GE Healthcare). A CM5 Series S sensor chip (GE Healthcare) was coupled with 3000 RU of Protein A (Thermo) onto flow cell 1 (FC1) and 2 (FC2) or 3 (FC3) and 4 (FC4) using a standard amine coupling kit following the chip manufacturer's recommendations (GE Healthcare). A startup cycle was included at the beginning of each experiment. This included three injections of regeneration solution (10 mM glycine-HCl pH 2.0) for 30 sec at a flow rate of 30 µL/min. The surface was regenerated at the beginning of each cycle. HBS-EP+ running buffer (0.01 M HEPES, 0.15 M NaCl, 0.05% Surfactant P20, 3mM EDTA, pH 7.4; GE Healthcare) was filtered and degassed. Data was corrected for bulk shift and refractive index changes by subtraction of the signal from the reference FC1 from the active FC2. All data was exported to, and sensorgram plots generated by, GraphPad Prism®.
SPR binding of C03V to different species TL1A
The different species TL1A were diluted in running buffer to a final concentration of 2 µg/mL. C03V was diluted in running buffer to a final concentration of 2 µg/mL. All proteins were kept at 10°C during assay runs.
Antibody was captured onto a protein A surface on FC2 for 30 sec at a flow rate of 30 µL/min to a final response level of 450 RU. FC1 was used as a reference surface. TL1A was injected across FC1 and 2 at a concentration of 2 µg/mL for 45 s, and allowed to dissociate for 600 sec in running buffer. Finally, at the end of each cycle the chip was regenerated as described above.
SPR for TNF superfamily members
Eighteen TNF ligand superfamily member proteins were screened for binding to C03V. This approach used a CM5 sensor chip coated with protein A to capture antibody and subsequently screen against the various TNF superfamily members. In addition to TL1A, the following TNF superfamily members (all purchased from R&D Systems, unless specified) were screened in this format; TNF-α (210-TA), GITR ligand (6987-GL), 4-1BB ligand (2295-4L), CD30 ligand (1028-CL), CD40 ligand (6420-CL), LIGHT (664-LI), TRAIL (375-TL), APRIL (5869-AP), BAFF (2149-BF), EDA-A1 (3944-ED), EDA-A2 (922-ED), RANK ligand (390-TN), OX40 ligand (1054-OX), Lymphotoxin α (eBiosciences, BMS302), Lymphotoxin β (679-TX) and FAS ligand (126-FL). A Biacore T200 (GE Healthcare) using the running buffer 1X PBS (Hyclone) containing 0.1% bovine serum albumin (BSA) to reduce non-specific binding. Regeneration solution was 50 mM glycine-HCl pH 2.0. All buffers and solutions were filtered and degassed using 0.22 µm filter units before use. All proteins were diluted into assay running buffer. Antibody C03V was diluted to 2 µg/mL and TNF ligand superfamily member proteins were diluted to 5 µg/mL. Antibody C03V was captured onto the protein A surface of FC2 using a flow rate of 30 µL/min. The response was approximately 475 RU for all cycles. FC1 was used as a reference surface without antibody. Each TNF superfamily ligand was screened at a concentration of 5 µg/mL by injection across FC1 and FC2 for 30 sec with a dissociation phase of 60 s. At the end of each cycle, the ligand and antibody were stripped from the protein A surface with regeneration solution. Regeneration solution was injected for 60 sec at a flow rate of 30 µL/min across FC1 and FC2.
C03V interaction with TWEAK required the development of a separate assay due to non-specific interactions of TWEAK with the CM5 chip surface. This experiment involved the reversible capture of TWEAK (R&D Systems, 1090-TW) and TL1A through the poly-histidine tag using an NTA sensor chip (GE Healthcare). For this experiment the running buffer was HBS-P+ [10 mM HEPES, 150 mM NaCl, 0.05% P20 pH 7.4], and the regeneration solutions were 500 mM EDTA and 100 mM NaOH (Sigma-Aldrich). 500 µM nickel sulfate (Sigma-Aldrich) was used to recharge the chip between runs. TWEAK and TL1A capture proteins were diluted to 2 µg/mL, and C03V was diluted to 5 µg/mL, in running buffer. 500 µM nickel sulfate was injected over FC1 and FC2 at 10 µL/min for 60 s. TWEAK or TL1A (2 µg/mL) was injected over FC2 at 30 µL/min. C03V at 5 µg/mL or buffer blank was injected for 60 sec at 30 µL/min over FC1 and FC2, a dissociation time of 60s was followed by 30 sec injection of 500 mM EDTA pH 8.0 over FC1 and FC2 at 30 µL/min and 100 mM NaOH for 60 sec over FC1 and FC2 at 30 µL/min.
CD27 ligand-Fc (Enzo LS, ALX-522-029) was screened in a separate assay because it is expressed as a Fc construct and does not have a HIS tag. C03V was captured using an anti-lambda light chain antibody. Soluble CD27 ligand and TL1A in solution were screened across the captured C03V or isotype control antibody. A CM5 series S chip was immobilized with 10,000 RU of anti-human lambda light chain antibody (Sigma Aldrich, L1645) using a standard amine-coupling kit (GE Healthcare). The surface was blocked with ethanolamine-HCl then with a 5 min injection of 1% BSA (w/v) diluted into running buffer. Antibody C03V was diluted to 5 µg/mL and CD27 ligand and TL1A were each diluted to 10 and 1 µg/mL. C03V or isotype control was captured onto FC2 at 10 µL/min. CD27 ligand and TL1A were injected onto FC1 and FC2 at variable concentration for 60 sec association and 180 sec dissociation. FC1 and FC2 were regenerated with 15 sec injection of 10 mM Glycine-HCl pH 2.0.
SPR for binding to TL1A variants
Analysis of the variants TL1A-R32A, TL1A-R85A and double variant, R32A/R85A binding to C03V was performed using methods as described in the general methods section, except that 100 mM citric acid pH 2.0 was used for regeneration. C03V was captured on FC2 at 100 µg/mL to a capture level of 800 RU and the TL1A variants were injected over FC1 and FC2 at 5 µg/mL for 60 s, and allowed to dissociate for 300 s. Cycles were performed in duplicate and all sensorgrams were double reference subtracted.
KinExA analysis of C03V binding to human TL1A
Method with C03V as constant binding partner
Time to reach equilibrium with C03V as constant binding partner
First, the Kon rate for the C03V/TL1A interaction was measured. Briefly, a solution was prepared by mixing C03V and TL1A, and aliquots were removed at various time points over 3 h. Free C03V was captured by passing the solution over a column packed with Sepharose beads coated with 20 µg/mL TL1A. Captured C03V was detected with an Alexa Fluor® 647-conjugated anti-human antibody (0.5 µg/mL, Jackson ImmunoResearch, 109-605-003). The Kon rate was then used to estimate the time required to reach equilibrium at various concentrations of C03V using the theoretical binding curve tool provided on the Sapidyne website (www.Sapidyne.com).
KD determination with C03V as constant binding partner
C03V was diluted in assay buffer (DPBS supplemented with 1 mg/ml BSA) to final concentrations of 15, 50 and 150 pM. Human TL1A was diluted in assay buffer to create a concentration series from 0.1 to 3000 pM.
Using the time to reach equilibrium determined above, curves that contained either 50 or 150 pM C03V were allowed to equilibrate in a 25°C incubator for 2 days. Curves that contained 15 pM C03V were allowed to equilibrate in a 25°C incubator for 3 days. Following the equilibration period, the free fraction of C03V in each reaction was quantitated as described above. The KD values were determined using n-curve analysis of equilibrium curves generated with 15, 50 and 150 pM C03V.
Method with TL1A as constant binding partner
Time to reach equilibrium with TL1A as constant binding partner
The time to reach equilibrium in this orientation was estimated using the Kon for the C03V/TL1A interaction determined as described above. In this format, the free fraction of TL1A was captured by passing the solution over a column packed with PMMA beads coated with 30 µg/mL C03V. Captured TL1A was detected with an anti 6x-his DyLight 650 antibody (0.75 µg/mL, Pierce, MA1-21315-D650).
KD determination with TL1A as constant binding partner
Human TL1A was diluted in assay buffer to final concentrations of 30, 100 and 300 pM. The titrant, C03V, was diluted in assay buffer to create a concentration series from 0.05 to 5000 pM.
Using the time to reach equilibrium determined above, all concentrations were allowed to come to equilibrium in a 25°C incubator for 3 days. Following the equilibration period, the free fraction of TL1A in each reaction was quantitated as described above. The KD values were determined using n-curve analysis of equilibrium curves generated with 30, 100 and 300 pM TL1A.
Receptor neutralization assays
C03V and an isotype control antibody were assessed for their ability to inhibit binding of TL1A to its receptors in a competition ELISA. DR3-Fc (R&D Systems 943-D3) or DcR3-Fc (R&D Systems 142-DC) at 2 μg/ml was coated onto a 96-well plate (Maxisorp, Nunc) at 4°C overnight, and then next day plates were washed and blocked in a solution of PBS with 1% w/v BSA. Serially diluted antibodies were pre-incubated with single-site biotinylated human TL1A 1μg/ml for 30 min then added to the DR3-Fc or DcR3-Fc coated wells. Bound TL1A was detected using streptavidin-HRP (BD Biosciences 554066) 1:2000 and visualized with TMB liquid substrate (Sigma T0440). TMB reaction was stopped with 1 M hydrochloric acid after 5 min exposure in DcR3 assays and 15 min exposure in DR3 assays. The data were normalized by expression as a percentage of maximum binding of TL1A to receptor in the absence of C03V. A similar method was used for the determination of the binding of the variants TL1A-R32A and TL1A-R85A to DR3 and DcR3 with the omission of the antibody C03V.
TF-1 cell-based potency assays
Anti-TL1A antibodies were expressed (see above), and assessed for their ability to neutralize TL1A-induced apoptosis in cycloheximide-stressed TF-1 cells. TF-1 cells (ATCC CRL 2003) were plated at 30,000 cells/well in 96-well solid white polystyrene plates (Costar), and cycloheximide was added to achieve a final concentration of 66 nM. A titration of antibody was prepared by 4-fold dilution and added to the TF-1 cells with recombinant human TL1A at the EC50 concentration as determined on the same day. Plates were incubated for 6 h at 37°C in a humidified incubator with 5% CO2, then the Caspase 3 Activity Assay (Roche 12012952001) was used to detect apoptosis. Plates were read with the Envision plate reader (Perkin Elmer) for fluorescence using the filter settings recommended by the kit manufacturer. The data was analyzed using GraphPad Prism 7.01®.
Flow cytometric analysis of C03V binding to primary human cells
PBMCs were isolated from buffy coats by density centrifugation using Lymphoprep (Stemcell Technologies). Diluted buffy coats were layered over Lymphoprep and centrifuged at 450g for 30 min at room temperature with no brake, then PBMCs were removed from the blood-Lymphoprep interface. Cells were washed twice in PBS (1X Hyclone) with 2 mM EDTA (Thermo Fisher) before resuspension in 20mL MACS buffer (1 X PBS (Hyclone, 0.5% w/v BSA (Sigma Aldrich), 2 mM EDTA (Sigma Aldrich)).
Viable cell concentrations were determined by Trypan Blue exclusion using the TC20™ Automated Cell Counter (Bio-Rad) as per manufacturer's instructions, and the cell concentrations for each donor were adjusted to 1.25 × 10⁸ viable cells/mL in MACS buffer. The cells were incubated with CD14 microbeads (Miltenyi Biotech, 130-050-201) and washed according to manufacturer's protocol. Briefly, 20μL of CD14 microbeads were added per 107 total cells. Cells and microbeads were mixed well and incubated for 15 min at 4°C. After incubation, the cells were washed and positive magnetic separation was conducted using LS columns on the QuadroMACS separator (Miltenyi Biotech). CD14-enriched cells were collected and centrifuged at 300g for 5 min to remove MACS buffer. The cells were resuspended in 10mL of complete RPMI medium for cell counts and further downstream analysis.
Viable cell concentrations of CD14-enriched cells were determined as described above.
An aliquot of the cells from each donor was kept aside for flow cytometry analysis on the day of processing, and the remaining cells incubated on immune complex-coated plates for 24 h as described below, then harvested. The cells were used for flow cytometric analysis and the supernatants were assessed for soluble TL1A by ELISA (see below).
For flow cytometry, cells were added to 96-well round-bottomed plates and centrifuged at 400g for 5 min at 4°C. Cells were resuspended in 100 μL/well FACS buffer, and 100 μL/well of FcR blocking reagent (Miltenyi Biotech, 130-059-901) was added. Plates were incubated at 4°C for 10 min, then washed by centrifugation at 400 g for 5 min at 4°C.
C03V was conjugated in-house using an Alexa Fluor 488 (A488) protein labelling kit (Thermo Fisher Scientific). After conjugation, C03V-A488 was verified to bind to human TL1A via SPR analysis. Cells were stained with anti-CD14-Pacific Blue (BD Biosciences, 558121), 7AAD (BD Biosciences), C03V-A488, and C3-IgG1-A488 (an anti-KLH isotype control developed and produced in-house). The cells were incubated with the antibodies for 20 min at 4°C then centrifuged at 400g for 5 min at 4°C. Before sample acquisition, cells were resuspended in 100 μL/well FACS buffer. Samples were acquired on a FACS CantoII flow cytometer (BD Biosciences).
Stimulation of CD14-enriched primary human cells with immune complexes
To prepare immune complex-coated plates, 50 μl of human IgG (Jackson ImmunoResearch, 009-000-003) 25 μg/mL in PBS was added to each well of a 96-well flat-bottomed, tissue culture-treated plate and incubated for 2 h at room temperature. Plates were then washed twice in sterile PBS to remove any unbound antibody. Mouse anti-human IgG (Jackson ImmunoResearch, 209-005-082) was added 50μl/well at a concentration of 25 μg/mL. The plates were incubated for 1 h at room temperature and then washed in sterile PBS to remove unbound antibody.
CD14-enriched human cells were resuspended in RPMI medium at a concentration of 5 × 10⁴/ml and 200 μl/well added to the immune complex-coated plates. The plates were incubated at 37°C in a 5% CO2 incubator for 18–24 h. The supernatants were then harvested and assessed for soluble TL1A by ELISA using C03V as capture antibody.
ELISA for detection of soluble TL1A
C03V was generated with an AviTag™ biotin-acceptor peptide amino acid sequence on the C-terminus of the heavy chain and was biotinylated using BirA biotin-protein ligase bulk reaction kit (Avidity, LLC). The biotinylated C03V was verified via SPR to bind to human TL1A. Additionally, C03V was shown to be biotinylated by its binding to streptavidin-coated plates. C03V was diluted to 1 μg/mL in PBS (Hyclone) and 50 μL per well added to Maxisorp 96-well plates, which were incubated overnight at 4°C. The following day, the plates were washed three times in PBS containing 1 mL/L Tween-20 (Sigma Aldrich) and were blocked by adding 200 μL/well of blocking buffer (PBS, 1% w/v BSA) and incubating at room temperature for 1 h. Supernatant samples from unstimulated and immune complex-stimulated cells were added to wells and a standard curve generated using recombinant TL1A at concentrations from 1000ng/mL – 0.00095 ng/mL in assay diluent (PBS, 10 g/L BSA and 1 mL/L Tween-20). 50 µL of samples or standards were added to the wells of the blocked plates and incubated for 2 h at room temperature. The plates were then washed 3 times, biotinylated C03V was added at a concentration of 1 µg/mL in 50 µL of assay diluent, and the plates incubated for 1 h at room temperature. After washing, streptavidin-horseradish peroxidase (BD Biosciences, 554066) 1:2000 was added and incubated for 30 min. Plates were then washed and visualised using TMB liquid substrate (Thermo Fisher) detection. The reaction was stopped with 1M hydrochloric acid after 10 min of development. Plates were read on a Spectramax Plus 384 (Molecular Devices) at 450nM and data was analyzed using GraphPad Prism 7.01®.
Immune complex-induced TL1A activity assay using human whole blood
Human whole blood samples were collected in BD Vacutainer Sodium Heparin coated tubes (Becton Dickinson). Immune complex-induced TL1A activity was assessed on the basis of IFNγ production from stimulated whole blood culture.
For stimulation of human whole blood with immune complexes (IC), 96-well flat bottom tissue culture plates (Corning) were coated with 50 µL of purified human IgG (Jackson ImmunoResearch, 009-000-003) at 0.5mg/mL in PBS and stored overnight at 4°C. Plates were washed with PBS and 50 µL per well of purified mouse anti-human IgG (Jackson ImmunoResearch, 209-005-082) was added at 0.04 mg/mL in PBS and incubated for 2 h at 37 °C. Recombinant human IL-12 (R&D Systems, 219-IL) and IL-18 (R&D Systems, 9124-IL) were mixed with blood to a final concentration of 0.5 ng/mL and 5.0 ng/mL, respectively, and 95 µL of the blood/cytokine mixture added to each well of the IC coated plate. To assess the inhibitory potency of C03V, 5 µL of a titration of C03V or isotype control (effective concentration 200000 – 0.002 pM) were added to IC coated wells containing blood/cytokine mixture and incubated for 24 h at 37 °C and 5% CO2. Following incubation, blood cultures were centrifuged to harvest plasma for quantification of IFNγ using the Human IFNγ DuoSet ELISA kit (R&D Systems, DY285), according to the manufacturer's instructions. The optical density of each well was measured using a Spectramax Plus plate reader (Molecular Devices). Data summaries were prepared in Excel 2010 and analyzed using GraphPad Prism®.
ADCC assays
EXPI293® cells (Thermo Fisher) were transfected with DNA encoding full length TL1A and CD20 (as positive control) (Geneart) according to the manufacturer's instructions. Transfected cells were harvested 18–24 h after transfection and analyzed by flow cytometry using C03V and rituximab (Biovision, A1049) to detect TL1A and CD20, respectively. When cells were confirmed positive for TL1A and CD20 expression, they were used as target cells in the ADCC Reporter Bioassay Kit (Promega, G7018). Antibodies were used at concentrations of 66000 – 0.17 pM for C03V and 6667 – 0.0171 pM for rituximab. Target cells were harvested at 18–24 h post-transfection, washed with ADCC assay buffer, then resuspended to a final concentration of 1 × 10⁶ viable cells/mL in ADCC assay buffer. The effector cells were prepared according to manufacturer's instructions. Briefly, 3.6 mL of ADCC assay buffer was added to 630 μL of ADCC Bioassay effector cells in a 15 mL tube and mixed gently by pipetting. 25 μL of the effector cells were added per well to the assay plates containing target cells and antibody, giving a final ratio of 25,000 target cells to 75,000 effector cells per well. The plates were incubated for 6 h at 37°C in a humidified CO2 incubator then equilibrated to ambient temperature (22-25°C) on the bench for 15 min. 75 μL of Bio-Glo™ luciferase assay reagent was added per well and the plates were incubated for 15 min at ambient temperature. Luminescence was measured using GloMax Explorer (Manufacturer) with the preset protocol, “ADCC Reporter Bioassay” at an integration time of 0.5s/well.
In Vivo studies
All studies were carried out at Association for Assessment and Accreditation of Laboratory Animal Care International-accredited facilities and were approved by the facility Institutional Animal Care and Use Committee.
D/TNBS-induced colitis
Colitis was induced in Sprague-Dawley rats by a single intracolonic instillation of TNBS or DNBS on day 0 of study. Animals were treated with C03V or an isotype control antibody by intravenous injection at 5 mg/kg on days 2 and 6 of the TNBS-induced colitis study and in the 7 day cohort of the DNBS-induced colitis study, and on days 2, 6 and 10 in the 14 day cohort of the DNBS-induced colitis study. For the DNBS-induced colitis study, one cohort of animals was culled on day 7 and one on day 14.
Gross and histopathology assessment of colon samples was done blinded using a scoring scale as specified in . Adhesion, stricture, ulcer and wall thickness were assessed macroscopically on whole, transected colon, fibrosis was scored on Masson's trichrome-stained sections taken through the ulcerated area of colon.
Table 1. Scoring assessment scale used in the histopathological analysis for the TNBS/DNBS studies.
OVA-induced asthma
Asthma was induced in Brown Norway rats by intraperitoneal sensitization with chicken ovalbumin (OVA) on day 0 of study and daily challenge with aerosolized OVA on days 35–42. Animals were treated with C03V or an isotype control antibody (anti-KLH isotype IgG1 developed and produced in-house) at 3 mg/kg by intravenous injection on days 14, 21, 28 and 35 of study.
Abbreviations
| ADCC | = | antibody-dependent cell-mediated cytotoxicity |
| APRIL | = | a proliferation-inducing ligand |
| BAFF | = | B cell activating factor of TNF family |
| BALF | = | bronchoalveolar lavage fluid |
| CBP | = | constant binding partner |
| DcR3 | = | decoy receptor 3 |
| DR3 | = | death receptor 3 |
| DNBS | = | 2, 4 –dinitrobenzenesulfonic acid |
| DSS | = | dextran sodium sulfate |
| EDA | = | ectodysplasin A |
| FAS | = | first apoptosis signal |
| FC | = | flow cell |
| GITR | = | glucocorticoid-induced TNF receptor-related |
| IBD | = | inflammatory bowel disease |
| IC | = | immune complexes |
| IFN | = | interferon |
| ILC2 | = | group 2 innate lymphoid cell |
| IVIG | = | intravenous immunoglobulin therapy |
| KinExA | = | kinetic exclusion assay |
| LIGHT | = | CD258 |
| OVA | = | Ovalbumin |
| RANK | = | receptor activator of nuclear factor κB |
| RU | = | response units |
| SPR | = | surface plasmon resonance |
| TMB | = | tetramethylbenzidine |
| TL1A | = | TNF-like ligand 1A |
| TNBS | = | 2, 4, 6 –trinitrobenzenesulfonic acid |
| TNF | = | tumor necrosis factor |
| TRAIL | = | TNF-related apoptosis-inducing ligand |
| TWEAK | = | TNF-related weak inducer of apoptosis |
Disclosure of potential conflicts of interest
All authors are present or former employees of Teva Pharmaceuticals
KMAB_A_1440164_Supp_Mat.zip
Download Zip (417.6 KB)Acknowledgments
The authors would like to thank T. Domagala, B. Cooksey, M. Lindgren, S. Stewart, D. Rickards, K. Xu, C. Buhmann and H. Shorer for production of reagents used in these assays. Thanks to P. Meizlik, S. Nock and D. Wilson for review of the manuscript. We thank the Australian Red Cross Blood Service for provision of human buffy coat and whole blood samples.
References
- Migone TS, Zhang J, Luo X, Zhuang L, Chen C, Hu B, Hong JS, Perry JW, Chen SF, Zhou JX, et al. TL1A is a TNF-like ligand for DR3 and TR6/DcR3 and functions as a T cell costimulator. Immunity. 2002;16:479–92. doi:10.1016/S1074-7613(02)00283-2. PMID:11911831.
- Bamias G, Martin C 3rd, Marini M, Hoang S, Mishina M, Ross WG, Sachedina MA, Friel CM, Mize J, Bickston SJ, et al. Expression, localization, and functional activity of TL1A, a novel Th1-polarizing cytokine in inflammatory bowel disease. J Immunol. 2003;171:4868–74. doi:10.4049/jimmunol.171.9.4868. PMID:14568967.
- Bamias G, Mishina M, Nyce M, Ross WG, Kollias G, Rivera-Nieves J, Pizarro TT, Cominelli F. Role of TL1A and its receptor DR3 in two models of chronic murine ileitis. Proc Natl Acad Sci U S A. 2006;103:8441–6. doi:10.1073/pnas.0510903103. PMID:16698931.
- Screaton GR, Xu XN, Olsen AL, Cowper AE, Tan R, McMichael AJ, Bell JI. LARD: a new lymphoid-specific death domain containing receptor regulated by alternative pre-mRNA splicing. Proc Natl Acad Sci U S A. 1997;94:4615–9. doi:10.1073/pnas.94.9.4615. PMID:9114039.
- Bittner S, Knoll G, Füllsack S, Kurz M, Wajant H, Ehrenschwender M. Soluble TL1A is sufficient for activation of death receptor 3. FEBS J. 2016;283:323–36. doi:10.1111/febs.13576. PMID:26509650.
- Bittner S. & Ehrenschwender, M. Multifaceted death receptor 3 signaling-promoting survival and triggering death. FEBS Lett. 2017;591:2543–55. doi:10.1002/1873-3468.12747. PMID:28686297.
- Wen L, Zhuang L, Luo X, Wei P. TL1A-induced NF-κB Activation and c-IAP2 Production Prevent DR3-mediated Apoptosis in TF-1 Cells. J Biol Chem. 2003;278:39251–8. doi:10.1074/jbc.M305833200. PMID:12882979.
- Papadakis KA, Prehn JL, Landers C, Han Q, Luo X, Cha SC, Wei P, Targan SR. TL1A synergizes with IL-12 and IL-18 to enhance IFN-gamma production in human T cells and NK cells. J Immunol. 2004;172:7002–7. doi:10.4049/jimmunol.172.11.7002. PMID:15153521.
- Pappu BP, Borodovsky A, Zheng TS, Yang X, Wu P, Dong X, Weng S, Browning B, Scott ML, Ma L, et al. TL1A-DR3 interaction regulates Th17 cell function and Th17-mediated autoimmune disease. J exp med. 2008;205:1049–62. doi:10.1084/jem.20071364. PMID:18411337.
- Takedatsu H, Michelsen KS, Wei B, Landers CJ, Thomas LS, Dhall D, Braun J, Targan SR. TL1A. TNFSF15) regulates the development of chronic colitis by modulating both T-helper 1 and T-helper 17 activation. Gastroenterology. 2008;135:552–67. doi:10.1053/j.gastro.2008.04.037. PMID:18598698.
- Meylan F, Song YJ, Fuss I, Villarreal S, Kahle E, Malm IJ, Acharya K, Ramos HL, Lo L, Mentink-Kane MM, et al. The TNF-family cytokine TL1A drives IL-13-dependent small intestinal inflammation. Mucosal Immunol. 2011;4:172–85. doi:10.1038/mi.2010.67. PMID:20980995.
- Shih, DQ, Zheng L, Zhang X, Zhang H, Kanazawa Y, Ichikawa R, Wallace KL, Chen J, Pothoulakis C, Koon HW. Inhibition of a novel fibrogenic factor Tl1a reverses established colonic fibrosis. Mucosal Immunol. 2014;7:1492–503. doi:10.1038/mi.2014.37. PMID:24850426.
- Jostins L, Ripke S, Weersma RK, Duerr RH, McGovern DP, Hui KY, Lee JC, Schumm LP, Sharma Y, Anderson CA, et al. Host-microbe interactions have shaped the genetic architecture of inflammatory bowel disease. Nature. 2012;491:119–24. doi:10.1038/nature11582. PMID:23128233.
- Fang L., Adkins B, Deyev V, Podack ER. Essential role of TNF receptor superfamily 25 (TNFRSF25) in the development of allergic lung inflammation. J Exp Med. 2008;205:1037–48. doi:10.1084/jem.20072528. PMID:18411341.
- Richard AC, Tan C, Hawley ET, Gomez-Rodriguez J, Goswami R, Yang XP, Cruz AC, Penumetcha P, Hayes ET, Pelletier M, et al. The TNF-family ligand TL1A and its receptor DR3 promote T cell-mediated allergic immunopathology by enhancing differentiation and pathogenicity of IL-9-producing T cells. J Immunol. 2015;194:3567–82. doi:10.4049/jimmunol.1401220. PMID:25786692.
- Meylan F, Hawley ET, Barron L, Barlow JL, Penumetcha P, Pelletier M, Sciumè G, Richard AC, Hayes ET, Gomez-Rodriguez J, et al. The TNF-family cytokine TL1A promotes allergic immunopathology through group 2 innate lymphoid cells. Mucosal Immunol. 2014;7:958–68. doi:10.1038/mi.2013.114. PMID:24368564.
- Yu X, Pappu R, Ramirez-Carrozzi V, Ota N, Caplazi P, Zhang J, Yan D, Xu M, Lee WP, Grogan JL. TNF superfamily member TL1A elicits type 2 innate lymphoid cells at mucosal barriers. Mucosal Immunol. 2014;7:730–40. doi:10.1038/mi.2013.92. PMID:24220298.
- Neill DR, Wong SH, Bellosi A, Flynn RJ, Daly M, Langford TK, Bucks C, Kane CM, Fallon PG, Pannell R, Jolin HE. Nuocytes represent a new innate effector leukocyte that mediates type-2 immunity. Nature. 2010;464:1367–70. doi:10.1038/nature08900. PMID:20200518.
- Jia Y, Fang X, Zhu X, Bai C, Zhu L, Jin M, Wang X, Hu M, Tang R, Chen Z. IL-13+ Type 2 Innate Lymphoid Cells Correlate with Asthma Control Status and Treatment Response. Am J Respir Cell Mol Biol. 2016;55:675–83. doi:10.1165/rcmb.2016-0099OC. PMID:27314535.
- Meylan F, Davidson TS, Kahle E, Kinder M, Acharya K, Jankovic D, Bundoc V, Hodges M, Shevach EM, Keane-Myers A, et al. The TNF-family receptor DR3 is essential for diverse T cell-mediated inflammatory diseases. Immunity. 2008;29:79–89. doi:10.1016/j.immuni.2008.04.021. PMID:18571443.
- Wroblewski VJ, Witcher DR, Becker GW, Davis KA, Dou S, Micanovic R, Newton CM, Noblitt TW, Richardson JM, et al. Decoy receptor 3 (DcR3) is proteolytically processed to a metabolic fragment having differential activities against Fas ligand and LIGHT. Biochem Pharmacol. 2003;65:657–67. doi:10.1016/S0006-2952(02)01612-X. PMID:12566095.
- Possa SS, Leick EA, Prado, CM, Martins, MA, Tiberio IF. Eosinophilic inflammation in allergic asthma. Front Pharmacol. 2013;4:46. doi:10.3389/fphar.2013.00046. PMID:23616768.
- Zhan C, Patskovsky Y, Yan Q, Li Z, Ramagopal U, Cheng H, Brenowitz M, Hui X, Nathenson SG, Almo SC. Decoy strategies: the structure of TL1A:DcR3 complex. Structure. 2011;19:162–71. doi:10.1016/j.str.2010.12.004. PMID:21300286.
- Deora A, Hegde S, Lee J, Choi CH, Chang Q, Lee C, Eaton L, Tang H, Wang D, Lee D, et al. Transmembrane TNF-dependent uptake of anti-TNF antibodies. MAbs. 2017;9:680–95. doi:10.1080/19420862.2017.1304869. PMID:28323513.
- Hsieh SL, Lin WW. Decoy receptor 3: an endogenous immunomodulator in cancer growth and inflammatory reactions. J Biomed Sci. 2017;24:39. doi:10.1186/s12929-017-0347-7. PMID:28629361.
- Antoniou, E, Margonis GA, Angelou A, Pikouli A, Argiri P, Karavokyros I, Papalois A, Pikoulis E. The TNBS-induced colitis animal model: An overview. Ann Med Surg (Lond). 2016;11:9–15. doi:10.1016/j.amsu.2016.07.019. PMID:27656280.
- Merkley SA, Beaulieu DB, Horst S, Duley C, Annis K, Nohl A, Schwartz DA. Use of Intravenous Immunoglobulin for Patients with Inflammatory Bowel Disease with Contraindications or Who Are Unresponsive to Conventional Treatments. Inflamm Bowel Dis. 2015;21:1854–9. doi:10.1097/MIB.0000000000000456. PMID:25993689.
- Durocher Y, Perret S, Kamen, A. High-level and high-throughput recombinant protein production by transient transfection of suspension-growing human 293-EBNA1 cells. Nucleic Acids Res. 2002;30, E9. doi:10.1093/nar/30.2.e9. PMID:11788735.
- Jin T, Guo F, Kim S, Howard A, Zhang YZ. X-ray crystal structure of TNF ligand family member TL1A at 2.1A. Biochem Biophys Res Commun. 2007;364:1–6. doi:10.1016/j.bbrc.2007.09.097. PMID:17935696.

