
 ?Mathematical formulae have been encoded as MathML and are displayed in this HTML version using MathJax in order to improve their display. Uncheck the box to turn MathJax off. This feature requires Javascript. Click on a formula to zoom.
ABSTRACT
Here, we present the first case-study where microdialysis is used to investigate the pharmacokinetics of antibody in different regions of rat brain. Endogenous IgG was used to understand antibody disposition at steady-state and exogenously administered trastuzumab was used to understand the disposition in a dynamic setting. Microdialysis samples from the striatum (ST), lateral ventricle (LV), and cisterna magna (CM) were collected, along with plasma and brain homogenate, to comprehensively understand brain pharmacokinetics of antibodies. Antibody concentrations in cerebrospinal fluid (CSF) were found to vary based on the site-of-collection, where CM concentrations were several-fold higher than LV. In addition, antibody concentrations in CSF (CM/LV) were found to not accurately represent the concentrations of antibody inside brain parenchyma (e.g., ST). Elimination of CSF from CM was found to be slower than LV, and the entry and exit of antibody from ST was also slower. Pharmacokinetics of exogenously administered antibody revealed that the entry of antibody into LV via the blood-CSF barrier may represent an early pathway for antibody entry into the brain. Plasma concentrations of antibody were 247–667, 104–184, 165–435, and 377–909 fold higher than the antibody concentrations in LV, CM, ST, and brain homogenate. It was found that the measurement of antibody pharmacokinetics in different regions of the brain using microdialysis provides an unprecedented insight into brain disposition of antibody. This insight can help in designing better molecules, dosing regimens, and route of administration, which can in turn improve the efficacy of antibodies for central nervous system disorders.
Introduction
Many antibodies have been developed to treat central nervous system (CNS) disorders. However, to date there are no US Food and Drug Administration-approved monoclonal antibodies (mAbs) that show efficacy in the brain parenchyma following systemic administration.Citation1 This lack of clinical success could be attributed to our limited understanding of mAb disposition at the site-of-action within the brain. The brain is a dynamic multi-compartmental organ consisting of brain parenchyma and cerebrospinal fluid (CSF). While the site-of-action for most of the drugs lies within the parenchyma, mAb concentration in the interstitial fluid (ISF) of parenchyma is rarely measured. Instead, the CNS exposure of mAb is often determined by measuring whole brain homogenate concentrations during preclinical studies,Citation2–Citation5 and, in clinical studies, CSF collected from lumbar region is often used as a surrogate to measure brain mAb concentrations.Citation6–Citation9 However, these measurements cannot distinguish the pharmacokinetics (PK) of mAb in different regions of the brain,Citation10–Citation12 and do not provide a direct measurement of drug concentrations at the site of action. As such, there is a need for novel methods that can measure mAb concentrations directly at the site of action and allow one to establish a reliable quantitative relationship between mAb concentrations in plasma and different regions of the brain like ISF, CSF, and whole brain.
Microdialysis (MD) is a well-established technique for measuring small molecule concentrations in brain ISF and CSF with minimal invasion into live animals.Citation13 Since multiple MD probes can be implanted in the brain, the disposition of drug within different regions of the brain, such as ST, LV, and CM, can be simultaneously characterized.Citation14 However, the use of this technique to measure mAb concentrations in brain has been very limited. This is mainly due to the lack of availability of large molecular weight cutoff (MWCO) probes until recently and the need for a complicated push-pull system to perform MD with large pore probes (). Several studies have used MD to measure various endogenous peptides and proteins in human brain using probes with MWCO of up to 3000 kDa,Citation15–Citation19 while others have applied large pore MD in humans to measure brain ISF concentrations of interleukins (ILs).Citation20–Citation22 However, to the best of our knowledge, no one has studied the PK of mAbs in the brain using large pore MD probes. In fact, there is only one published study using large pore MD to investigate the PK of mAb in interstitial space of mouse tissues (e.g., liver, skin, kidney, and muscle); however, this study did not investigate the brain.Citation23 We believe that the use of MD to measure mAb concentrations in different regions of the brain can provide unprecedented insight into the pathways responsible for mAb disposition into the brain and the extent of mAb distribution within different regions of the brain. This insight can in turn help us design better molecules, dosing regimens, and route of administration that can improve the efficacy of mAbs for CNS disorders.
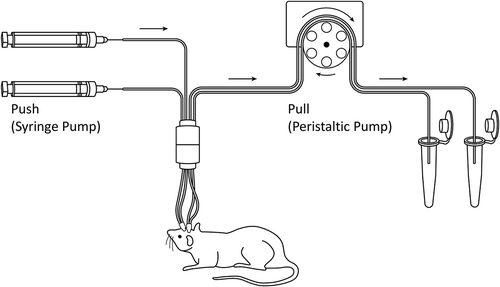
Figure 1. Illustration of the push-pull system used for large pore microdialysis. Two microdialysis probes were implanted into one animal to simultaneously collect microdialysates from two different regions of the brain. The syringe pump (left) pushes the perfusion fluid toward the animal, and the peristaltic pump (right) pulls the perfusion fluid from the animal.
Here, we have presented the application of large pore MD to measure antibody concentrations in rat ISF at ST (ISFST), CSF within LV (CSFLV), and CSF within CM (CSFCM). In addition, antibody concentrations in rat plasma and brain homogenate were also measured to obtain a comprehensive understanding of antibody PK in rat brain. Trastuzumab, which binds human epidermal growth factor receptor-2 (HER2) and is used clinically to treat brain metastases in HER2-positive breast cancer patients,Citation6,Citation7,Citation24 was used as a test compound to represent exogenously administered antibody. Trastuzumab has no cross reactivity against rat HER2. The endogenous rat immunoglobulin-G (rIgG) was used to understand the distribution of antibody in rat brain at steady-state.
Results
Validation of microdialysis probe placement in rat brain
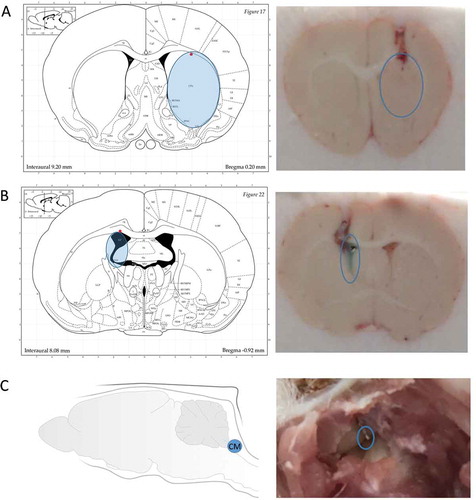
In order to validate the placement of MD probes at the predetermined coordinates for rat ST, LV, and CM (),Citation14 brain cryostat sections were obtained after probe implantation. As shown in , the representative coronal brain sections show that when compared with the rat brain atlas the instrumented MD guides reached the targeted regions for all three locations.Citation25 The injected methylene blue stain validates the implantation within the LV location. In addition, the placement within CM is visually evident following rat brain dissection.
Figure 2. Illustration of the coordinates for microdialysis guides and sampling regions. From left to right: probes were implanted at the striatum (left), the lateral ventricle (middle), and the cisterna magna (right), respectively. (Atlas Source: Paxinos, G. and Watson, C., 2013).
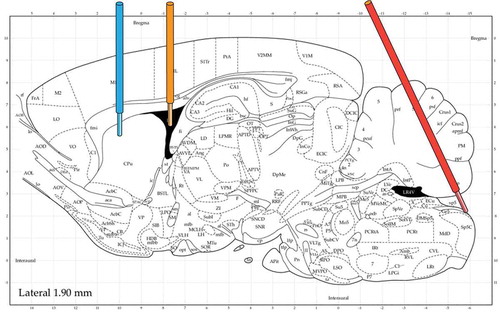
Figure 3. Validation of the placement of microdialysis probes. (A) Coronal brain section to validate the placement of the inserted microdialysis probe in the striatum. (B) Coronal brain section to validate the placement of the inserted microdialysis probe in the lateral ventricle. The dark area in the atlas is the space for the lateral ventricle. Blue stain in the section indicates the injected methylene blue dye via the microdialysis guide. It shows the microdialysis guide has accurately reached the targeted position. (C) The picture taken during initial step of rat brain dissection to expose the cisterna magna and the inserted microdialysis probe. The blue open circles show the position of the inserted microdialysis probes. (Atlas Source: Paxinos, G. and Watson, C., 2013).
Rat endogenous IgG concentrations in the brain
shows the observed rIgG concentrations in plasma, ISFST, CSFLV, CSFCM, and the brain homogenate. The plasma concentration of rIgG was found to be ~ 1000-fold higher (P < 0.001) than the whole brain homogenate concentration and ~ 500-fold higher (P < 0.001) than the ISFST and CSFLV concentration. The rIgG concentration in the CSFCM was found to be ~ 6 fold-higher (P < 0.01) than the CSFLV concentration. These results suggest that, at steady-state, the brain homogenate concentrations of mAb may be lower than ISF concentrations due to dilution by non-drug containing cellular components. The results also suggest that at steady-state the concentrations of mAb in CSF obtained from LV and CM can be different, where LV concentrations could be similar to ISF concentrations, and CM concentrations can be much more than LV and ISF concentrations.
Table 1. Rat endogenous IgG concentrations in plasma, ISF, CSF, and the whole brain.
In order to validate the observed higher concentrations of rIgG in CSFCM, we collected CSFCM samples using an orthogonal method of cisternal puncture. While the cisternal punctures were collected during terminal sampling on anesthetized animals (following terminal cardiac blood collection and rat brain perfusion) and MD samples were collected from freely moving animals, we hypothesized that the results from these methods can be comparable. As shown in , we found that, while the CSFCM concentrations obtained following cisternal puncture were still ~ 3-fold higher (P = 0.020) than CSFLV concentrations, these concentrations were ~ 2-fold lower (P = 0.037) than CSFCM concentration obtained using MD.
Pharmacokinetics of trastuzumab in rat plasma and brain
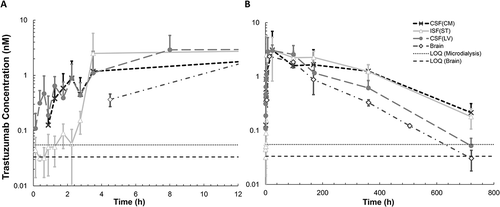
Plasma PK of trastuzumab following intravenous administration of 10 mg/kg dose is shown in . The plasma PK () was found to follow the PK of a typical non-target binding mAb in rat, as evident by superimposition of the observed PK profile over the simulated PK profile generated using a platform physiologically-based pharmacokinetic (PBPK) model for mAb in the rat.Citation26 PK of trastuzumab in the ISFST, CSFLV, CSFCM, and brain homogenate is shown in . The initial distribution phase of the PK profile () indicates that mAb first enters the LV space in the brain, as CSFLV concentration at the initial time points (up to 4h) was higher than ISFST concentration. The mAb showed delayed distribution to the CSFCM compartment, as CSFCM concentration was below the limit-of-quantification for the first hour, but after ~ 4h CSFCM concentration was similar to CSFLV concentration. Brain homogenate concentrations () were not measured until 4 h because terminal brain samples were not collected until completion of microdialysis. shows the full 30-day PK profiles of trastuzumab, and presents the non-compartmental analysis of these PK profiles. The exposure of mAb in brain homogenate was the lowest (), which was consistent with the observation made at steady-state using endogenous rIgG (). The exposure of mAb in CSFLV was higher than the brain homogenate exposure (, P = 0.0013), which was consistent with the observation made at steady-state using endogenous rIgG (). In addition, we found that overall exposure of mAb in ISFST was higher than CSFLV (, P = 0.0325), which was also consistent with the observation made at steady-state using endogenous rIgG (). Similarly, the overall mean exposure of mAb in CSFCM was found to be higher than CSFLV; however, it was not statistically significant (P = 0.309). The exposure of mAb in CSFCM was similar (rather slightly lower) (P = 0.514) to the exposure of mAb in ISFST (), which was opposite to what was observed with endogenous rIgG at steady-state (). In general, the elimination of mAb from LV ( was found to be faster than ST (
and CM (
(). The mAb accumulated and eliminated slower from the ST and CM compartments.
Table 2. Non-compartmental analysis of trastuzumab PK profiles.
Figure 4. Trastuzumab pharmacokinetic profile in rat plasma following intravenous administration of 10 mg/kg dose. Plasma samples were collected at 0.083, 4.5, 24, 48, 72, 96, 120, 173, 362, and 722 h after intravenous administration. The solid line represents the typical PK of an antibody in rat plasma simulated using the platform physiologically-based pharmacokinetic model for mAbs.
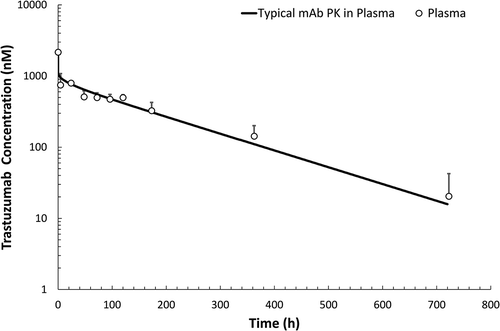
Figure 5. Trastuzumab pharmacokinetic profiles in the striatum, the lateral ventricle, the cisterna magna, and brain homogenate, following intravenous administration of 10 mg/kg dose. (A) The PK of trastuzumab during the initial time points after intravenous administration. Brain microdialysates were collected at 0–15, 15–30, 30–45, 45–60 min, 1–1.5, 1.5–2, 2–2.5, 2.5–3, and 3–4 h after dosing. The y-axis presents the average trastuzumab concentration, and the x-axis presents the mid-time point of each collection period. (B) Trastuzumab PK in rat brain up to 30 days after intravenous administration. Trastuzumab samples were collected at day 0, day 4, day 7, day 15, and day 30. Open triangles represent the interstitial fluid at the striatum; closed circles represent the cerebrospinal fluid within the lateral ventricle; cross marks represent the cerebrospinal fluid within the cisterna magna, and open diamonds represent the brain homogenate. Error bars represent the standard deviation.
Discussion
This investigation was designed to understand the disposition of antibody in different regions of brain (ISFST, CSFLV, CSFCM, and brain homogenate) using MD. In addition, we aimed to investigate how the blood-brain barrier (BBB) and blood-CSF barrier (BCSFB) restrict the entry of antibody into the brain after systemic administration and at steady-state. Exposure of endogenous rIgG in rat plasma, ISFST, CSFLV, CSFCM, and brain homogenate was used to understand the disposition of antibody in the brain at steady-state. Interestingly, we found that the concentrations of endogenous rIgG in the CSFCM were much higher than the concentrations in the CSFLV (). While this may seem unusual, a thorough review of literature reveals that a similar concentration gradient for endogenous proteins in different compartments of CSF has been reported in the clinic.Citation27,Citation28 In 1960, Hunter and SmithCitation27 reported that the concentration of endogenous proteins in CSFLV,CSFCM, and CSFLumbar compartments of near-normal patients is 150, 360, and 590 µg/mL, respectively. In addition, in 1978 Weisner and BernhardtCitation28 reported that the concentration of endogenous IgG in CSFLV, CSFCM, and CSFLumbar compartments of “non-diseased” persons was 9, 14, and 23 µg/mL, respectively. Based on the physiology of CSF circulation, these results suggest that, as one goes from the formation site of CSF in LV to CM, the endogenous rIgG levels increases. This may be due to additional input of antibody from the third and the fourth ventricle as CSF confluences from LV to CM. On the other hand, enhanced levels of endogenous rIgG in CM may also be due to lower clearance of large molecules from this region compared to other ventricles, as supported by the trastuzumab PK data (). In fact, Iliff et al.Citation29 have reported that following the administration of large molecules into the CM of mice, they showed minimal movement towards ISF space and were retained within the Virchow Robin space (VRS) around the arterioles following glymphatic circulation. Similarly, Ichimura et al. have reported slow and non-directional flow of fluorescently labeled albumin following microinjection into the subarachnoid space of rats.Citation30 Collectively, these observations suggest that the flow of CSF from the later compartments in the circulation system may be slow and non-directional, resulting in longer half-life of antibodies in these compartments.
Our results also suggest that the concentrations of antibody in CSFCM compartment may be higher than the concentrations in ISFST compartment (). This is an important finding as it brings into question the validity of using CSF samples from CM as surrogate for measuring antibody concentration at the site-of-action in ISF. However, it would be important to evaluate if this finding remains the same for other animal species. Since there are no other brain microdialysis studies for antibody reported in any other species or disease models, it is difficult to evaluate the translatability of this finding at present. However, Cirrito et al.Citation31 have reported similar findings for endogenous amyloid- (A
) peptide (4.5 kDa) in transgenic mice. Using MD and CM puncture experiments, the authors have shown that the CSFCM concentrations of endogenous
can be ~ 50-fold higher than the ISFST concentrations. In addition, Yadav et al. have reported that following multiple systemic injections in cynomolgus monkey the CSFlumber concentrations of anti-BACE1 mAb were ~ 10-fold higher than the concentration in brain slices.Citation32 However, it is important to note that the data generated using targeted antibodies that bind within the brain may not follow a similar trend. For example, using a targeted anti-LINGO-1 mAb (Li81), Pepinsky et al.Citation4 showed that CSFCM concentrations of systemically administered antibody can be much lower than the brain concentrations, which may be due to the binding and retention of antibody within certain brain regions compared to the CSF.
In our investigation, the concentrations of rIgG in CSFLV and ISFST compartments were found to be similar. This result is comparable to the findings from Herukka et al.,Citation33 who performed a clinical MD study using a 100 kDa cut-off probe to measure A concentrations in CSFLV and ISFST compartments of 11 patients with suspected idiopathic normal pressure hydrocephalus. Their results showed that the endogenous A
concentrations in LV (577 pg/mL) were very similar to the concentrations of endogenous A
in the ST (557 pg/mL). This suggests that at steady-state the antibody exposure in CSFLV can be similar to ISFST.
It is important to note that the translatability of our findings regarding brain disposition of endogenous IgG to other protein molecules, animal species, or disease states remains uncertain. Differences in the intrinsic properties of protein, such as molecular weight, net charge, and ability to interact with Fc-receptors, may alter the diffusion coefficient and disposition of large molecules within the brain.Citation34,Citation35 Differences in the size of the brain between different species may affect the penetration of antibodies in the brain parenchyma from the CSF region, resulting in steep concentration gradients for endogenous IgG across CSF-brain interface for larger species.Citation35 Such steep concentration gradient for mAb between the cortical layers (i.e., cortex) and the inner core of the brain parenchyma (i.e., putamen and globus pallidus) has been reported in monkeys following long-term intracerebroventricular infusion of mAb.Citation32 Limited brain penetration of IgG following intrathecal injection has also been reported in mice.Citation36 Differences in the integrity of the BBB and CSF turnover under Alzheimer’s disease (AD) and other neurodegenerative disorders can also alter brain disposition of proteins. It has been shown that changes in vascular transports due to AD may lead to reduced Aβ clearance and increased re-entry of Aβ in the brain, leading to brain accumulation of toxic Aβ species.Citation37 The effect of AD-related pathology on the ratio of CSF to serum protein concentrations remains controversial because both an increase and no change in the ratio of CSF to serum albumin levels has been reported in preclinical and clinical studies.Citation38–Citation42 As such, more data from MD experiments with various protein therapeutics in different animal and disease models are needed to understand how these factors affect brain PK of proteins.
We also investigated the PK of trastuzumab (a non-binding mAb) in brain following systemic administration to get more insight into the non-steady-state disposition of antibody in the brain. The PK of trastuzumab in CSFLV, CSFCM, and ISFST, at early time points provided interesting insight into the absorption phase of antibody in the brain (). We found that the concentration of trastuzumab in LV was higher than ST to begin with, and as the time progressed (at ~ 4h) the ST concentration increased to a level similar to LV. Based on brain anatomy and physiology these results suggest that antibody might be crossing BCSFB and entering LV first, and subsequently either the antibody is traveling from LV to ST or entering to ST directly after crossing BBB, which results in enhanced concentrations of antibody in ST. While until recently the movement of antibody from LV to ST was considered to be negligible, a recent investigation performed on monkeys supports the possibility of this movement.Citation32 We also observed a transient delay for antibody distribution to the CM compartment, which was not observed for the ST compartment. This observation suggests that the entry of antibody into the ISFST compartment via glymphatic circulation from the subarachnoid space may be highly unlikely.Citation43,Citation44 However, more mechanistic investigations must be done to validate these hypotheses.
The analysis of full PK profiles of trastuzumab () reveals that the elimination of antibody from LV compartment is relatively faster than CM and ST compartments. In addition, it was observed that brain homogenate concentrations declined in parallel with LV concentrations. When the relative exposure of trastuzumab in plasma, brain, and different regions of brain () was compared to endogenous rIgG exposures (), we found that, while several trends were similar, the relative exposure ratios were not the same. These differences can stem from many factors, such as the steady-state vs. dynamic nature of the system and rat vs. humanized nature of antibodies. Nonetheless, it was found that CSF concentrations of antibody in CM are on average higher than LV, and ST concentrations are on average higher than LV. While CM concentrations for antibody were higher than ST at steady-state, the exposure of antibody in these two regions was very similar following bolus administration. Brain homogenate concentrations for antibody were always the lowest ( and ), and the observed brain homogenate to plasma concentration ratio of 0.1–0.3% was similar to literature reported values (0.1%-1%).Citation1–Citation4,Citation34,Citation45 When interpreting the data for brain homogenate concentration of antibody, it is very important to understand that the presence of even a minute amount of residual blood can dramatically affect the observed concentrations. In our study, the PK of trastuzumab in partially perfused brain homogenate (Supplementary Figure 1) shows that the exposure of antibody in brain homogenate can be artificially several fold higher if the perfusion is not complete. As such, there is currently a need for a standardized quantitative marker (e.g., hemoglobin, albumin) that can help evaluate the quality of perfusion and minimize the risk of artifact when measuring brain homogenate concentrations of antibody.
It is also important to note that, while the use of large pore MD can provide very valuable insight into brain disposition of antibodies, successful implementation of this system requires substantial amounts of time, financial resources, and technical skills.Citation46 The MD membranes with large pore size may manifest ultrafiltration (i.e., leaking of microdialysis perfusion fluid from inner side of the probe to the outer side), and the drug molecules may be carried through the membrane via convection, resulting in altered probe recovery.Citation47 Therefore, it is important to minimize the pressure gradient between inner and outer regions of MD probe, and use an open vent system, like the one implemented in AtmosLM MD probes, to maintain a stable inner pressure in the tubing by constantly equilibrating the fluid pressure to outer atmosphere. In addition, while the push-pull MD system is designed to minimize the ultrafiltration, the flow rate of the peristaltic pump requires calibration and careful adjustment according to the fluid recovery experiments (described in the methods section) to ensure consistent recovery of the MD probe.
Another important issue that should be considered while performing MD studies with antibodies is the non-specific adsorption of antibody to MD tubing, MD probes, and sample collection tubes. Since the concentration of antibody in the samples tend to be very low (typically less than 25 ng/mL), the non-specific binding to experimental plastics can significantly alter the measured concentrations. In fact, as shown in Supplementary Figure 2, we tested 15 different conditions to find an optimal scenario that provided minimal binding of antibody to experimental plastics. We found that the use of low protein-binding microcentrifuge tubes for sample collection significantly improved in vitro probe recovery. In addition, when 0.15% bovine serum albumin (BSA) was spiked in the microdialysis perfusion fluid, it resulted in saturation of non-specific binding sites on the MD tubing. Following the use of optimal conditions, we observed that the low concentrations of trastuzumab and endogenous rIgG in the samples remained stable at −20 and 4
.
For our experiments, we used in vitro probe recovery as a surrogate for the in vivo condition, mainly because measurement of in vivo probe recovery for antibody via retrodialysis is challenging. The first challenge is the development of a very precise analytical method (with very low percent coefficient of variation) that can differentiate 3–5% changes antibody concentrations. The second challenge is the half-life of antibodies in the brain, which will require several weeks of washout period before the animal can be used again for the experiments. Nonetheless, Jadhav et al.Citation23 reported that in vitro recovery of antibody is similar to its in vivo recovery for the same probes we used in our investigation. We observed that the recovery of antibody for our probes was ~ 3%, and, as shown in , the recovery was not dependent on sample concentrations, which is consistent with the literature reports.Citation23 In addition, we found that if the flow of the system is not optimized, one can observe as much as 10-times increase in the probe recovery (i.e., ~ 30%) due to unidirectional convection (). We also observed that the recovery of our probe went down following single use (), which was consistent with some literature reports.Citation48 As a result, each probe was only used once in our studies, resulting in significant increase in the cost of the experiments. As such, it may be worth finding an optimal regeneration condition for these probes going forward.
Restoration of BBB integrity after the surgery and before conducting the microdialysis experiments is another key aspect of brain microdialysis technique. There are published studies that use systemic injection of Evan’s blue dye after the microdialysis surgery to examining the restoration of BBB integrity for protein permeability.Citation49–Citation51 These studies use histological evaluations and claim that the integrity of the BBB is restored 30 mins to 16 hours after the surgery. However, several other studies suggest that 2–7 day time period may be a more optimal to allow the recovery of BBB functionCitation52 and integrityCitation53-Citation57 after the surgery. Based on these investigations, we allowed 10-day recovery period after the surgery to start our microdialysis experiments. Nonetheless, the integrity of the BBB in our experimental animals should be verified to create more confidence in the mAb PK data presented here.
It is also very important to note that the low concentrations of antibody in the brain and the low volume of samples available from MD studies require the availability of a very sensitive analytical method for quantifying antibody exposure in the brain. In our investigation, we developed a series of 384-well plate ELISA methods that required much less sample volume (30 µL/well) compared to a typical 96-well plate ELISA (100 µL/well) (Supplementary Tables 2, 3). In addition, each ELISA method had to be optimized to achieve a very low limit of quantification (0.25 ng/mL). Thus, availability of a high throughput and very sensitive analytical method is essential for investigating the PK of antibody in the brain using MD.
In summary, here we presented the application of large pore MD to understand the PK of antibody in different regions of rat brain. We optimized the experimental conditions to assure accuracy of probe placement and concentration measurement. We also developed a sensitive ELISA method to enable accurate quantification of low antibody concentrations in MD samples. Using both endogenous rIgG and exogenously administered antibody, we showed that CSF from different regions of the brain can have different antibody concentrations. In addition, we have shown that the CSF concentrations of antibody may not be the same as the concentrations at the site-of-action (e.g., ISF). Our results indicate that the entry of antibody via BCSFB into the LV space may be an early pathway of entry for the exogenously administered mAbs into the brain. While our investigation provides an unprecedented insight into the disposition of endogenous and externally administered antibody across different regions of the brain using MD, this technique needs to be widely applied to enable comprehensive understanding of the determinants responsible for the disposition of antibody in the brain. With the increased interest in the development of antibody-based therapeutic for CNS disorders, better insight into the disposition of antibody in the brain can provide an opportunity to design better molecules, dosing regimens, and route of administration to achieve clinical success.
Materials and methods
Animals and surgery
The animal protocol was approved by Institutional Animal Care and Use Committee (IACUC) of University at Buffalo. 5-week-old male Sprague Dawley rats (Taconic Biosciences, USA) were housed individually under standard environmental conditions with ad libitum access to food and water before surgery. On the day of surgery, the rats were anesthetized by intraperitoneal administration of 75/10 mg/kg ketamine (Ketaset®)/xylazine (AnaSed® Injection), and placed in a dual-arm stereotaxic frame (Cat. # 51503, Stoelting Co., USA) at a flat head position (i.e., the bregma and the lambda are in the same horizontal plane). After the flat head position was fixed, a gas anesthesia mask with tubing was connected to the animal. The animals were then instrumented with two AtmosLM guide cannulas (PEG-x, Eicom, USA) in the following three different combinations of ST, LV, and CM: ST + LV, ST + CM, or LV + CM. The coordinates for each position were optimized based on Westerhout et al.,Citation14 and the placement of the cannula was validated using brain sections. For the ST, the coordinate of the microdialysis guide was: 1.0 mm anterior, 3.0 mm lateral, and 3.4 mm ventral relative to bregma. For the LV, the coordinate of the microdialysis guide was: 0.9 mm posterior, 1.6 mm lateral, and 2.9 mm ventral relative to the bregma. For the CM, the coordinate of the microdialysis guide was: 2.51 mm posterior, 2.04 mm lateral, and 8.4 mm ventral, at an angle of 25° from the dorsoventral axis (towards anterior) and 11° lateral from the anteroposterior axis relative to lambda. The ST and LV were instrumented with guide cannula (PEG-8, Eicom, USA) and dummy probes (PED-8, Eicom, USA) whose shaft length is 8 mm, whereas the CM was instrumented with guide cannula (PEG-12, Eicom, USA) and dummy probes (PED-12, Eicom, USA) that have a 12 mm long shaft. Four anchor screws (Cat. # CMA7431021, Harvard Apparatus, USA) were mounted on the surface of the skull, and a head-block tether (Cat. # M115S, Instech Laboratories, USA) as a connector to a multi-channel infusion swivels (Cat. # MCS/5A, Instech Laboratories, USA) was bonded to the skull with glass ionomer cement for permanent head attachment (Cat. # MGIG/AKIT2, Instech Laboratories, USA). The guide cannula, the anchor screws, and the head-block tether were secured together on the skull with the cement. After the surgery, 5 mg/kg carprofen (Rimadyl®) was given subcutaneously once per day for 48 h, and the animals were allowed to recover for 10 days before in vivo microdialysis experiments. One night prior to the experiment, the dummy probes were replaced by the AtmosLM microdialysis probes (PEP-x-1, 1000 kDa MWCO, membrane material: polyethylene 0.44 mm OD, shaft: 0.58 mm OD/0.5 mm ID, Eicom, USA) (Supplementary Figure 3).
Experimental setup for push-pull microdialysis
The experimental set-up is shown in and Supplementary Figure 3. CMA 402 syringe pump (Cat. # CMA8003100, Harvard Apparatus, USA) and 2.5 mL microsyringe (Cat. # CMA8309021 Harvard Apparatus, USA) were used to perfuse the artificial cerebrospinal fluid (aCSF) (150 mM sodium, 3 mM potassium, 1.4 mM calcium, 0.8 mM magnesium, 155 mM chloride, and 0.15% BSA) as a push pump system. Fluorinated ethylene propylene (FEP) tubing (Cat. # BFEP-T22Q, Instech Laboratories, USA) was used to connect the syringe pump to the AtmosLM microdialysis probe and subsequently to Harvard peristaltic pump P-70 (Cat. # 70–7000, Harvard Apparatus, USA). The peristaltic pump was equipped with 3-Stop PVC tubing (Cat. # 72–0654, Harvard Apparatus, USA). The connections were secured by 0.015 inch silicone tubing connectors (Cat. # MC015/10, Instech Laboratories, USA). Different from the conventional MD, a pull pump was required when using AtmosLM microdialysis probes, because the pushing pressure from the syringe pump needs to be released through an open vent to minimize the ultrafiltration and enhance the recovery of large molecules.
First, the syringe pump was calibrated and the flow rate was set to 1 µL/min. Then, the flow rate of the peristaltic pump was calibrated by measuring the output of the microdialysate. Subsequently, the probe was conditioned with ethanol and flushed with aCSF to remove the air bubbles, and connected to the calibrated push-pull system. Afterwards, the in vitro fluid recovery of the microdialysis probe was measured, as the ratio of the collected microdialysate volume over the perfused volume from syringe pump (Equation 1).Citation46
If the fluid recovery was higher than 103%, the flow rate of the peristaltic pump was reduced. If the fluid recovery was lower than 97%, the flow rate of the peristaltic pump was increased. Once the volumes of three consecutive 10-min microdialysis sample collections showed consistent values, the system was considered to be stabilized. The in vitro recovery of antibody was determined using a standard solution of 1000 ng/mL rat serum IgG (Cat. # I4131, Sigma, USA) prepared in aCSF, under the assumption that the recovery of all antibodies are similar. The in vitro recovery for each microdialysis probe was defined as the ratio of the concentration in the dialysate () over the concentration in the external medium (
) (Equation 2).Citation12
In vivo pharmacokinetic study of trastuzumab in rats
After 10-day recovery from the surgery, rats (250-350g) were anesthetized with isoflurane and dosed with 10 mg/kg trastuzumab (HERCEPTIN®) intravenously via tail vein injection (Supplementary Figure 3). Blood samples were collected via the submandibular vein at 0.083, 24, 48, 72, and 120 h after intravenous administration. Blood samples in EDTA pre-coated tubes were centrifuged at 4000 rcf for 10 minutes at 4°C, and plasma was collected and stored at −20 for further analysis. Brain microdialysates of ISFST, CSFLV, and CSFCM were collected using microdialysis (0–15, 15–30, 30–45, 45–60 min, 1–1.5, 1.5–2, 2–2.5, 2.5–3, 3–4, 96–100, 168–172, 360–364, and 720–724 h after intravenous administration). Each fraction of microdialysate was collected in a 1.5 mL siliconized microcentrifuge tube (Cat. #L250902, Laboratory Products Sales, USA) and was stored at −20
until analysis. After microdialysis, rats were anesthetized by intraperitoneal administration of 75/10 mg/kg ketamine/xylazine. Terminal blood samples were collected using cardiac puncture. Immediately after terminal blood sampling, the whole body was perfused with 30 mL cold 1X phosphate-buffered saline (PBS). Half of the brain was perfused via carotid artery with 2.5 mL cold 1X PBS. After perfusion, terminal CSF was collected using cisternal puncture. The half brain was kept in a 50 mL tube and frozen in liquor nitrogen. The brain tissue was weighed and stored at −80℃until homogenization.
Brain microdialysate concentrations were converted into brain ISF concentrations () or CSF concentrations (
) by dividing the microdialysate concentrations by the in vitro probe recovery of each microdialysis probe (Equation 3).
The observed plasma PK of trastuzumab was compared with a typical PK of antibody in rat simulated using the platform PBPK model for mAb in rat,Citation26 using the software Berkeley Madonna.
Brain cryostat sectioning to validate the placement of the inserted microdialysis probes
After the microdialysis experiment and terminal blood sampling, 2 µL of methylene blue was perfused into the brain compartments via the microdialysis guide cannula. Brain tissue was collected and placed in a small boat containing tissue-freezing medium (Cat. # TFM-5, General Data, USA). The small boat was gradually frozen using liquid nitrogen until the medium was completely hardened. The cube was stored at −80 overnight. Before cryostat section, the frozen brain in the hardened freezing medium was transferred to −20
freezer and kept for 1 h. Brain tissue was then sectioned using Microm HM 525 (Cat. # 956640, Thermo Fisher Scientific, Microm International GmbH, Germany).
Preparation of brain homogenate
The brain tissue was weighed and cut into pieces. The pieces of the rat brain were homogenized with RIPA buffer (Cat. # 89900, Thermo Fisher Scientific, USA) containing 1X Halt ™ protease inhibitor (Cat. # 78430, Thermo Fisher Scientific, USA) using BeadBug microtube homogenizer (Cat. # D1030, Benchmark, 3.0 mm beads, USA). The homogenate was further diluted with the RIPA buffer and was incubated on ice, shaken for 2 h. After incubation, the brain homogenate was centrifuged (15 mins, 4°C, 15000 rcf) to remove cell debris.
ELISA method to quantify human trastuzumab in rat plasma, brain homogenate, and microdialysate samples
Goat anti-human IgG-Fc fragment cross-adsorbed antibody (Cat. # A80-304A, Bethyl Laboratories, USA) was diluted to 5 µg/mL in 20 mM Na2HPO4 (no pH adjustment). Nunc® Maxicorp™ 384-well plates (Cat. # 142761, Thermo Fisher, USA) were then coated with 30 µL/well diluted anti-human IgG-Fc antibody and incubated at 4°C overnight. Plates were washed three times with 1X PBS-Tween (0.05% Tween-20 in 1X PBS, no pH adjustment), followed by three washes with distilled water using AquaMax2000 (Cat. # AQUAMAX 2K, Molecular Devices, Sunnyvale, CA). The plates were then blocked with 90 µL/well of ELISA blocking solution (Cat. # E104, Bethyl Laboratories, USA) and incubated at room temperature for 1 h on a plate shaker. The plates were washed to remove ELISA block solution. 30 µL/well of samples and the standards of trastuzumab were loaded in each well. The plates were then incubated for 2 h at room temperature on a plate shaker. After the incubation period was over, the plates were washed. 30 µL/well of the 1.4 ng/µL of goat anti-human IgG-F(ab’)2 cross-adsorbed F(ab’)2 conjugated with alkaline phosphatase (Cat. # A80-249AP, Bethyl Laboratories, USA) in 1X PBS-Tween was added to each well, and the plates were incubated at room temperature for 1 h. The plates were washed and 30 µL/well of p-nitrophenyl phosphate solution (1 mg/mL in 1x diethanolamine buffer) was added into each well. The change in absorbance was observed with time (dA/dt) at 405 nm for 45 mins using Filter Max F5 microplate analyzer (Cat. # F5, Molecular devices, Sunnyvale, CA).
ELISA method to quantify rat endogenous IgG in rat plasma, brain homogenate, and microdialysate samples
The rat endogenous IgG ELISA assay followed a similar protocol as described above. Briefly, 384-well plates were coated with 0.15 µg/30 µL/well goat anti-rat IgG-Fc antibody (CAT# A110-236A, Bethyl, USA) in 20 mM Na2HPO4. The coated plates were incubated at 4°C overnight. The plates were washed and then blocked with 90 µL/well of ELISA blocking solution. After 1 h incubation at room temperature on a plate shaker, the plates were washed to remove ELISA block solution. 30 µl/mL of samples and the standards of rat serum IgG (Cat. # I4131, Sigma, USA) were loaded into each well. The plates were then incubated for 2 h at room temperature on a plate shaker. The plates were then washed, and 30 µL/well of the 0.2 µg/mL goat anti-Rat IgG F(ab’)2 fragment cross-adsorbed antibody conjugated with alkaline phosphatase (Bethyl, Cat.# A110-240AP) was added to each well in 1X PBS-Tween. After 1 h incubation, the plates were washed, and 60 µL/well of p-nitrophenyl phosphate solution was added to each well. The dA/dt was measured at 405 nm for 30 mins with Filter Max F-5 microplate analyzer.
Data analysis
Areas under the concentration vs time curves (AUC0→t-last) for trastuzumab PK in plasma, ISFST, CSFLV, CSFCM, and brain homogenate were calculated using the linear trapezoidal rule. The standard deviations around mean AUC0→t-last values were calculated using the modified Bailer methodCitation58 implemented in WinNonlin 7.0 (Phoenix, Pharsight Corporation, Palo Alto, CA). Statistical significance was determined using Student’s t-test (two tailed), and the threshold for the significance was set at P value less than 0.05.
Supplemental data for this article can be accessed here.
Abbreviations
| Aβ | = | amyloid-β |
| aCSF | = | artificial cerebrospinal fluid |
| AD | = | Alzheimer’s disease |
| AUC0→t-last | = | areas under the concentration vs time curves from time zero to the last time point |
| BBB | = | blood-brain barrier |
| BCSFB | = | blood-cerebrospinal fluid barrier |
| BSA | = | bovine serum albumin |
| CCSF | = | the concentration in the cerebrospinal fluid |
| Cdial | = | the concentration in the dialysate |
| Cext | = | the concentration in the external medium |
| CM | = | the cisterna magna |
| = | the maximum concentration | |
| CNS | = | central nervous system |
| CSF | = | cerebrospinal fluid |
| CSFCM | = | cerebrospinal fluid within the cisterna magna |
| CSFLumbar | = | cerebrospinal fluid within the lumbar |
| CSFLV | = | cerebrospinal fluid within the lateral ventricles |
| FEP | = | fluorinated ethylene propylene |
| HER2 | = | human epidermal growth factor receptor-2 |
| IACUC | = | institutional animal care and use committee |
| ILs | = | Interleukins |
| ISF | = | interstitial fluid |
| ISFST | = | interstitial fluid at the striatum |
| LV | = | the lateral ventricles |
| Li81 | = | anti-LINGO-1 monoclonal antibody |
| mAb | = | monoclonal Antibody |
| MD | = | microdialysis |
| MWCO | = | molecular weight cutoff |
| PK | = | pharmacokinetics |
| PBPK | = | physiologically-based pharmacokinetic |
| rIgG | = | rat immunoglobulin-G |
| RT | = | room temperature |
| SD | = | standard deviation |
| ST | = | the striatum |
| = | Half-life in the terminal phase | |
| = | time to the maximum concentration | |
| VRS | = | Virchow Robin space |
Supplemental Material
Download Zip (13.7 MB)Acknowledgments
This work was supported by the Centre for Protein Therapeutics at University at Buffalo. D.K.S is supported by NIH grant GM114179 and AI138195. Authors would also like to thank Dr. Alexis C. Thompson (Research Institute of Addiction, University at Buffalo) for her invaluable help in optimizing the implantation of microdialysis probes.
Supplemental material
Supplemental data for this article can be accessed here.
Additional information
Funding
References
- Pardridge WM. CSF, blood-brain barrier, and brain drug delivery. Expert Opin Drug Deliv. 2016;13(7):963–975. doi:10.1517/17425247.2016.1171315.
- Garg A, Balthasar JP. Investigation of the influence of FcRn on the distribution of IgG to the brain. AAPS J. 2009;11:553–557. doi:10.1208/s12248-009-9129-9.
- Yu YJ, Zhang Y, Kenrick M, Hoyte K, Luk W, Lu Y, Atwal J, Elliott JM, Prabhu S, Watts RJ, et al. Boosting brain uptake of a therapeutic antibody by reducing its affinity for a transcytosis target. Sci Transl Med. 2011;3:84ra44. doi:10.1126/scitranslmed.3002230.
- Pepinsky RB, Shao Z, Ji B, Wang Q, Meng G, Walus L, Lee X, Hu Y, Graff C, Garber E, et al. Exposure levels of anti-LINGO-1 Li81 antibody in the central nervous system and dose-efficacy relationships in rat spinal cord remyelination models after systemic administration. J Pharmacol Exp Ther. 2011;339:519–529. doi:10.1124/jpet.111.183483.
- Abuqayyas L, Balthasar JP. Investigation of the role of FcgammaR and FcRn in mAb distribution to the brain. Mol Pharm. 2013;10:1505–1513. doi:10.1021/mp300214k.
- Pestalozzi BC, Brignoli S. Trastuzumab in CSF. J Clin Oncol. 2000;18:2349–2351. doi:10.1200/JCO.2000.18.11.2349.
- Stemmler HJ, Schmitt M, Willems A, Bernhard H, Harbeck N, Heinemann V. Ratio of trastuzumab levels in serum and cerebrospinal fluid is altered in HER2-positive breast cancer patients with brain metastases and impairment of blood-brain barrier. Anticancer Drugs. 2007;18:23–28. doi:10.1097/01.cad.0000236313.50833.ee.
- Rubenstein JL, Fridlyand J, Abrey L, Shen A, Karch J, Wang E, Issa S, Damon L, Prados M, McDermott M, et al. Phase I study of intraventricular administration of rituximab in patients with recurrent CNS and intraocular lymphoma. J Clin Oncol. 2007;25:1350–1356. doi:10.1200/JCO.2006.09.7311.
- Nau R, Sorgel F, Eiffert H. Penetration of drugs through the blood-cerebrospinal fluid/blood-brain barrier for treatment of central nervous system infections. Clin Microbiol Rev. 2010;23:858–883. doi:10.1128/CMR.00007-10.
- Villasenor R, Ozmen L, Messaddeq N, Gruninger F, Loetscher H, Keller A, Betsholtz C, Freskgård P-O, Collin L. Trafficking of endogenous immunoglobulins by endothelial cells at the blood-brain barrier. Sci Rep. 2016;6:25658. doi:10.1038/srep25658.
- Paris-Robidas S, Emond V, Tremblay C, Soulet D, Calon F. In vivo labeling of brain capillary endothelial cells after intravenous injection of monoclonal antibodies targeting the transferrin receptor. Mol Pharmacol. 2011;80:32–39. doi:10.1124/mol.111.071027.
- Moos T, Morgan EH. Restricted transport of anti-transferrin receptor antibody (OX26) through the blood-brain barrier in the rat. J Neurochem. 79;2001:119–129.
- Chefer VI, Thompson AC, Zapata A, Shippenberg TS. Overview of brain microdialysis. Current Protocols Neurosci. 2009. Chapter 7:Unit7.1. doi:10.1002/0471142301.ns0701s47.
- Westerhout J, Ploeger B, Smeets J, Danhof M, De Lange EC. Physiologically based pharmacokinetic modeling to investigate regional brain distribution kinetics in rats. AAPS J. 2012;14:543–553. doi:10.1208/s12248-012-9366-1.
- Winter CD, Iannotti F, Pringle AK, Trikkas C, Clough GF, Church MK. A microdialysis method for the recovery of IL-1beta, IL-6 and nerve growth factor from human brain in vivo. J Neurosci Methods. 119;2002:45–50.
- Winter CD, Pringle AK, Clough GF, Church MK. Raised parenchymal interleukin-6 levels correlate with improved outcome after traumatic brain injury. Brain. 2004;127:315–320. doi:10.1093/brain/awh039.
- Kofler M, Schiefecker A, Ferger B, Beer R, Sohm F, Broessner G, Hackl W, Rhomberg P, Lackner P, Pfausler B, et al. Cerebral taurine levels are associated with brain edema and delayed cerebral infarction in patients with aneurysmal subarachnoid hemorrhage. Neurocrit Care. 2015;23:321–329. doi:10.1007/s12028-015-0140-y.
- Maurer MH, Berger C, Wolf M, Futterer CD, Feldmann RE, Jr., Schwab S, Kuschinsky W. The proteome of human brain microdialysate. Proteome Sci. 2003;1:7 doi:10.1186/1477-5956-1-7.
- Mellergard P, Aneman O, Sjogren F, Saberg C, Hillman J. Differences in cerebral extracellular response of interleukin-1beta, interleukin-6, and interleukin-10 after subarachnoid hemorrhage or severe head trauma in humans. Neurosurgery. 2011;68:12–19. discussion 9. doi:10.1227/NEU.0b013e3181ef2a40.
- Sarrafzadeh A, Schlenk F, Gericke C, Vajkoczy P. Relevance of cerebral interleukin-6 after aneurysmal subarachnoid hemorrhage. Neurocrit Care. 2010;13:339–346. doi:10.1007/s12028-010-9432-4.
- Graetz D, Nagel A, Schlenk F, Sakowitz O, Vajkoczy P, Sarrafzadeh A. High ICP as trigger of proinflammatory IL-6 cytokine activation in aneurysmal subarachnoid hemorrhage. Neurol Res. 2010;32:728–735. doi:10.1179/016164109X12464612122650.
- Hutchinson PJ, O’Connell MT, Rothwell NJ, Hopkins SJ, Nortje J, Carpenter KL, Timofeev I, Al-Rawi PG, Menon DK, Pickard JD. Inflammation in human brain injury: intracerebral concentrations of IL-1alpha, IL-1beta, and their endogenous inhibitor IL-1ra. J Neurotrauma. 2007;24:1545–1557. doi:10.1089/neu.2007.0295.
- Jadhav SB, Khaowroongrueng V, Fueth M, Otteneder MB, Richter W, Derendorf H. Tissue distribution of a therapeutic monoclonal antibody determined by large pore microdialysis. J Pharm Sci. 2017;106:2853–2859. doi:10.1016/j.xphs.2017.03.033.
- Azim HA, Azim HA Jr. Systemic treatment of brain metastases in HER2-positive breast cancer: current status and future directions. Future Oncol. 2012;8(2):135–144. doi:10.2217/fon.11.149.
- Gaidica M, Paxions G, Watsons C Rat brain atlas; 2006 accessed 2018 Jan 18. http://labs.gaidi.ca/rat-brain-atlas/.
- Shah DK, Betts AM. Towards a platform PBPK model to characterize the plasma and tissue disposition of monoclonal antibodies in preclinical species and human. J Pharmacokinet Pharmacodyn. 2012;39:67–86. doi:10.1007/s10928-011-9232-2.
- Hunter G, Smith HV. Calcium and magnesium in human cerebrospinal fluid. Nature. 186;1960:161–162.
- Weisner B, Bernhardt W. Protein fractions of lumbar, cisternal, and ventricular cerebrospinal fluid. Separate Areas Reference J Neurol Sci. 1978;37:205–214. doi:10.1016/0022-510X(78)90204-6.
- Iliff JJ, Wang M, Liao Y, Plogg BA, Peng W, Gundersen GA, Benveniste H, Vates GE, Deane R, Goldman SA, et al. A paravascular pathway facilitates CSF flow through the brain parenchyma and the clearance of interstitial solutes, including amyloid beta. Sci Transl Med. 2012;4:147ra11. doi:10.1126/scitranslmed.3003748.
- Ichimura T, Fraser PA, Cserr HF. Distribution of extracellular tracers in perivascular spaces of the rat brain. Brain Res. 545;1991:103–113.
- Cirrito JR, May PC, O’Dell MA, Taylor JW, Parsadanian M, Cramer JW, Audia JE, Nissen JS, Bales KR, Paul SM, et al. In vivo assessment of brain interstitial fluid with microdialysis reveals plaque-associated changes in amyloid-beta metabolism and half-life. J Neurosci. 23;2003:8844–8853.
- Yadav DB, Maloney JA, Wildsmith KR, Fuji RN, Meilandt WJ, Solanoy H, Lu Y, Peng K, Wilson B, Chan P, et al. Widespread brain distribution and activity following i.c.v. infusion of anti-β-secretase (BACE1) in nonhuman primates. Br J Pharmacol. 2017;174(22):4173–4185. doi:10.1111/bph.14021.
- Herukka SK, Rummukainen J, Ihalainen J, Von Und Zu Fraunberg M, Koivisto AM, Nerg O, Puli LK, Seppälä TT, Zetterberg H, Pyykkö OT, et al. Amyloid-beta and tau dynamics in human brain interstitial fluid in patients with suspected normal pressure hydrocephalus. J Alzheimer’s Dis: JAD. 2015;46:261–269. doi:10.3233/JAD-142862.
- Li Z, Krippendorff B, Sharma S, Walz AC, Lavé T, Shah DK. Influence of molecular size on tissue distribution of antibody fragments. MAbs. 2015;8(1):113–119. doi:10.1080/19420862.2015.1111497.
- Wolak DJ, Pizzo ME, Thorne RG. Probing the extracellular diffusion of antibodies in brain using in vivo integrative optical imaging and ex vivo fluorescence imaging. J Control Rel. 2015;197:78–86. doi:10.1016/j.jconrel.2014.10.034.
- Martín-García E, Mannara F, Gutiérrez-Cuesta J, Sabater L, Dalmau J, Maldonado R, Graus F. Intrathecal injection of P/Q type voltage-gated calcium channel antibodies from paraneoplastic cerebellar degeneration cause ataxia in mice. J Neuroimmunol. 2013;261:53–59. doi:10.1016/j.jneuroim.2013.05.003.
- Sweeney MD, Sagare AP, Zlokovic BV. Blood–brain barrier breakdown in Alzheimer disease and other neurodegenerative disorders. Nat Rev Neurol. 2018;14:133–150. doi:10.1038/nrneurol.2017.188.
- Halliday MR, Pomara N, Sagare AP, Mack WJ, Frangione B, Zlokovic BV. Relationship between cyclophilin a levels and matrix metalloproteinase 9 activity in cerebrospinal fluid of cognitively normal apolipoprotein E4 carriers and blood-brain barrier breakdown. JAMA Neurol. 2013;70:1198. doi:10.1001/jamaneurol.2013.3841.
- Janelidze S, Hertze J, Nägga K, Nilsson K, Nilsson C, Wennström M, Morse CL, Zoghbi SS, Pike VW, Turner RS, et al. Increased blood-brain barrier permeability is associated with dementia and diabetes but not amyloid pathology or APOE genotype. Neurobiol Aging. 2017;51:104–112. doi:10.1016/j.neurobiolaging.2016.12.006.
- Skillbäck T, Delsing L, Synnergren J, Mattsson N, Janelidze S, Nägga K, Kilander L, Hicks R, Wimo A, Winblad B, et al. CSF/serum albumin ratio in dementias: a cross-sectional study on 1,861 patients. Neurobiol Aging. 2017;59:1–9. doi:10.1016/j.neurobiolaging.2017.06.028.
- Blennow K, Wallin A, Fredman P, Karlsson I, Gottfries CG, Svennerholm L. Blood-brain barrier disturbance in patients with Alzheimers disease is related to vascular factors. Acta Neurol Scand. 2009;81:323–326. doi:10.1111/j.1600-0404.1990.tb01563.x.
- Bowman GL, Kaye JA, Quinn JF. Dyslipidemia and blood–brain barrier integrity in Alzheimer’s disease. Curr Gerontol Geriatr Res. 2012;2012:184042. doi:10.1155/2012/184042.
- Hladky SB, Barrand MA. Mechanisms of fluid movement into, through and out of the brain: evaluation of the evidence. Fluids Barriers CNS. 2014;11:26. doi:10.1186/2045-8118-11-26.
- Brinker T, Stopa E, Morrison J, Klinge P. A new look at cerebrospinal fluid circulation. Fluids Barriers CNS. 2014;11:10. doi:10.1186/2045-8118-11-10.
- Shah DK, Betts AM. Antibody biodistribution coefficients - Inferring tissue concentrations of monoclonal antibodies based on the plasma concentrations in several preclinical species and human. MAbs. 2013;5(2):297–305. doi:10.4161/mabs.23684.
- Jadhav SB, Khaowroongrueng V, Derendorf H. Microdialysis of large molecules. J Pharm Sci. 2016;105:3233–3242. doi:10.1016/j.xphs.2016.08.016.
- Chu J, Hjort K, Larsson A, Dahlin AP. Impact of static pressure on transmembrane fluid exchange in high molecular weight cut off microdialysis. Biomed Microdev. 2014;16:301–310. doi:10.1007/s10544-013-9833-1.
- Rosenbloom AJ, Sipe DM, Weedn VW. Microdialysis of proteins: performance of the CMA/20 probe. J Neurosci Methods. 2005;148(2):147–153. doi:10.1016/j.jneumeth.2005.04.018.
- Dykstra KH, Hsiao JK, Morrison PF, Bungay PM, Mefford IN, Scully MM, Dedrick RL. Quantitative examination of tissue concentration profiles associated with microdialysis. J Neurochem. 1992;58(3):931–940.
- Caljon G, Caveliers V, Lahoutte T, Stijlemans B, Ghassabeh G, Abbeele JV, Smolders I, De Baetselier P, Michotte Y, Muyldermans S, et al. Using microdialysis to analyse the passage of monovalent nanobodies through the blood-brain barrier. Br J Pharmacol. 2012;165(7):2341–2353. doi:10.1111/j.1476-5381.2011.01723.x.
- Xie R, Bouw MR, Hammarlund-Udenaes M. Modelling of the blood-brain barrier transport of morphine-3- glucuronide studied using microdialysis in the rat: involvement of probenecid-sensitive transport. Br J Pharmacol. 2000;131:1784–1792. doi:10.1038/sj.bjp.0703759.
- Cooper PR, Ciambrone GJ, Kliwinski CM, Maze E, Johnson L, Li Q, Feng Y, Hornby PJ. Efflux of monoclonal antibodies from rat brain by neonatal Fc receptor, FcRn. Brain Res. 2013;1534:13–21. doi:10.1016/j.brainres.2013.08.035.
- Geiger BM, Frank LE, Caldera-Siu AD, Pothos EN. Survivable stereotaxic surgery in rodents. J. Vis. Exp. 2008;(20):e880. doi:10.3791/880.
- Hascup ER, Bjerkén SA, Hascup KN, Pomerleau F, Huettl P, Strömberg I, Gerhardt GA. Histological studies of the effects of chronic implantation of ceramic-based microelectrode arrays and microdialysis probes in rat prefrontal cortex. Brain Res. 2009;1291:12–20. doi:10.1016/j.brainres.2009.06.084.
- Krum JM, More NS, Rosenstein JM. Brain angiogenesis: variations in vascular basement membrane glycoprotein immunoreactivity. Exp Neurol. 1991;111(2):152–165.
- Rosenstein JM, Krum JM, Sternberger LA, Pulley MT, Sternberger NH. Immunocytochemical expression of the endothelial barrier antigen (EBA) during brain angiogenesis. Dev Brain Res. 1992;66(1):47–54.
- Samoto K, Ikezaki K, Yokoyama N, Fukui M. P-Glycoprotein expression in brain capillary endothelial cells after focal ischemia in rat. In: Ito U, Baethmann A, Hossmann KA, Kuroiwa T, Marmarou A, Reulen HJ, Takakura K, editors. Brain Edema IX. Acta Neurochirurgica. 1994;60:257–260.
- Nedelman JR, Gibiansky E, Lau DT. Applying Bailer’s method for AUC confidence intervals to sparse sampling. Pharm Res. 1995;12:124–128. doi:10.1023/A:1016255124336.