
ABSTRACT
Immunomodulatory monoclonal IgG1 antibodies developed for cancer and autoimmune disease have an inherent risk of systemic release of pro-inflammatory cytokines. In vitro cytokine release assays are currently used to predict cytokine release syndrome (CRS) risk, but the validation of these preclinical tools suffers from the limited number of characterized CRS-inducing IgG1 antibodies and the poor understanding of the mechanisms regulating cytokine release. Here, we incubated human whole blood from naïve healthy volunteers with four monoclonal IgG1 antibodies with different proven or predicted capacity to elicit CRS in clinic and measured cytokine release using a multiplex assay. We found that, in contrast to anti-CD52 antibodies (Campath-1H homolog) that elicited high level of multiple inflammatory cytokines from human blood cells in vitro, other IgG1 antibodies with CRS-inducing potential consistently induced release of a single tested cytokine, interferon (IFN)-γ, with a smaller magnitude than Campath. IFN-γ expression was observed as early as 2–4 h after incubation, mediated by natural killer cells, and dependent upon tumor necrosis factor and FcγRIII. Importantly, the magnitude of the IFN-γ response elicited by IgG1 antibodies with CRS-inducing potential was determined by donor FcγRIIIa-V158F polymorphism. Overall, our results highlight the importance of FcγRIIIa-dependent IFN-γ release in preclinical cytokine release assay for the prediction of CRS risk associated with therapeutic IgG1 antibodies.
Introduction
In the past two decades, the use of monoclonal antibodies as therapeutics for cancer and autoimmune diseases has substantially increased. Nonetheless, clinical toxicity has been associated with their administration, including cytokine release syndrome (CRS), infusion site reaction, and the development of anti-drug antibody. CRS, one of the most severe adverse events associated with monoclonal antibodies, is characterized by high levels of immune cell activation and rapid systemic release of proinflammatory cytokines. CRS has been observed with several antibodies, including TGN1412 (anti-CD28 superagonist), muromonab (anti-CD3), alemtuzumab (Campath-1H, anti-CD52), and rituximab (anti-CD20).Citation1 Importantly, preclinical models did not predict the potential for CRS. Consequently, in vitro cytokine release assays using human blood cells Citation2,Citation3 have been developed to predict and understand the mechanisms responsible for CRS.Citation4,Citation5
Two principal mechanisms are thought to cause CRS: 1) antibodies like TGN-1412 triggered cytokine release by activating T cells, and 2) IgG1 antibodies like alemtuzumab induced cytokine release from FcγR-expressing cells. To predict preclinically these different types of CRS, two different platforms are routinely used. The risk of cytokine release by direct T cell activation is best predicted by human peripheral blood mononuclear cell (PBMC) stimulation with plate-bound antibodies, while the CRS risk associated with IgG1 is best predicted by whole blood stimulation with soluble antibodies, perhaps because whole blood contains the full spectrum of FcγR-expressing cells (including neutrophils and platelets) and the complement.Citation6 In order to interpret the results derived from these cytokine release assays, cytokine levels are looked at in the context of positive and negative controls to take into account donor to donor variability.Citation2 Anti-CD52 antibody is the most commonly used positive control for the whole blood assay. Whether the cytokine release observed by anti-CD52 antibodies is truly representative of the response elicited by CRS-inducing IgG1 antibodies is, however, unclear.
Here, we compared the cytokine release triggered by four different IgG1 antibodies with CRS inducing potential in a whole blood cytokine release assay. Our study highlights key differences in the magnitude and extent of cytokine responses elicited by different IgG1 antibodies with CRS inducing potential. We identify interferon (IFN)-γ release as a key signature associated with CRS-inducing IgG1 antibodies in this preclinical assay and highlight some of the important mechanisms regulating the release of this cytokine.
Results
IFN-γ release signature to IgG1 therapeutic antibodies
A whole blood cytokine release assay is used to assess the CRS risk associated with IgG1 therapeutic monoclonal antibodies.Citation6 To assess the variability/range of response observed in this assay, the responses from blood cells derived from 11–12 naive healthy donors to four monoclonal IgG1 antibodies (anti-CD52, mAb1, mAb2, and mAb3) were tested. These antibodies were selected based on their varied target expression and rates of clinical or predicted cytokine release. Anti-CD52 (Campath-1H homolog) antibody binds to a membrane antigen abundantly expressed on the surface of lymphocytes and monocytes and is known to induce CRS in clinics. mAb1 recognizes a target expressed at low levels ubiquitously on all human blood cells and induced cytokine release in some patients in a first-in-humans study. mAb2 has not been tested in clinical studies, but targets a receptor highly expressed on myeloid cells and was predicted to have a higher risk for cytokine release. mAb3 recognizes a membrane antigen expressed on some tumor cells and did not trigger any serious adverse events or cytokine release when administered to humans.
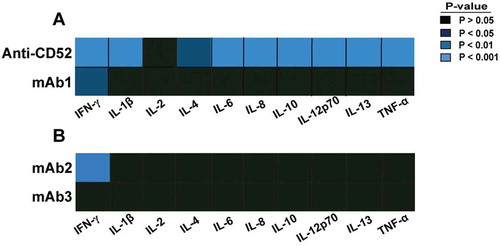
The response of 10 cytokines was assessed 24 h post stimulation by multiplex immunoassays, and cytokines significantly increased in whole blood treated with any of the four different IgG1 antibodies were identified by statistical analysis. In contrast to anti-CD52 antibodies that elicited a significant increase of 9 of the 10 cytokines, mAb1 and mAb2 only induced a significant elevation of IFN-γ (). No significant cytokine increase was detected following incubation with soluble mAb3 antibody () and with most IgG1 (rituximab, trastuzumab, infliximab) or therapeutic antibodies tested in this platform (Fig S1). Remarkably, mAb3 cross-linked by pre-incubation with anti-human Fc antibody triggered IFN-γ secretion in the whole blood assay (Fig S2).
Figure 1. Cytokine response to IgG1 antibodies with CRS-inducing potential in preclinical whole blood assay. Heat map representation of statistically significant increase of cytokines from whole blood stimulated for 24 h with (A) anti-CD52, mAb1, (B) mAb2, or mAb3. PBS buffer was used as negative control for donor baseline cytokine levels. The response of 10 cytokines was measured by multiplex cytokine analysis. P-values generated by one-way ANOVA followed by paired T-test of log 10 transformed concentrations of treated versus untreated samples. Significant response is only considered if the geometric mean of the fold change to the relative untreated sample is ≥ 2. Donor responses shown are n = 11 (A) and n = 12 (B).
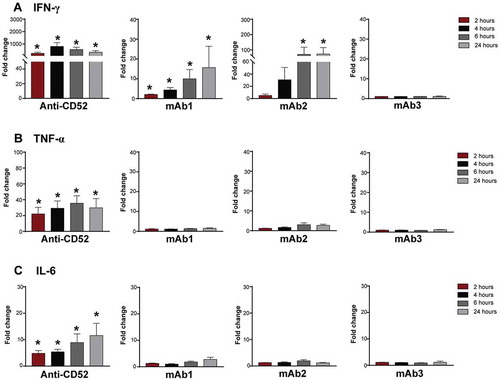
CRS associated with Campath-1H in clinics is characterized by elevated serum levels of IFN-γ, tumor necrosis factor (TNF), and interleukin (IL)-6.Citation4 We next compared the magnitude of IFN-γ, TNF, and IL-6 responses elicited by IgG1s in the whole blood assay. Anti-CD52 antibodies elicited robust release of all three cytokines in all donors ( and ), but the magnitude of the response varied widely between donors, ranging for IFN-γ from 370- to 1,823-fold change with respect to the untreated sample (, and ). In contrast, mAb1 and mAb2 elicited a more limited cytokine release. mAb1 triggered IFN-γ release in 50% of the donors, but did not elicit TNF or IL-6 release (, and ). mAb2 elicited a stronger IFN-γ response than mAb1, ranging from 3- to 117-fold change over untreated sample (, and ) and promoted TNF release in 33% donors and IL-6 release in 16% (). Overall, these results suggest that IFN-γ release by human IgG1 antibodies in a whole blood assay identify a potential risk for CRS in the clinic.
Table 1. Cytokine release profile of CRS-inducing IgG1 antibodies.
Figure 2. Magnitude of cytokine responses to IgG1 antibodies with CRS-inducing potential in preclinical whole blood assay. IFN-γ response was assessed with multiplex cytokine analysis after 24 h stimulation with (A) anti-CD52 or mAb1, (B) mAb2 or mAb3. PBS buffer was used as negative control for donor baseline cytokine levels. All IgG1 monoclonal antibodies were analyzed at 100 µg/ml except anti-CD52, which was analyzed at 10 µg/ml. Donor responses shown are n = 11 (A) and n = 12 (B). Median of donor responses is donated by horizontal bar. P-values generated by one-way ANOVA followed by paired T-test of log 10 transformed concentrations of treated versus untreated samples, (*p < 0.05, **p < 0.01, ***p < 0.001).
IgG1 antibodies with CRS-inducing potential triggered rapid IFN-γ release from NK cells
Cytokine release in clinics is observed within hours of injection. To better characterize the kinetics of the response induced by IgG1 antibodies in vitro, whole blood from four donors were incubated with anti-CD52, mAb1, mAb2, or mAb3 antibodies for 2, 4, 6, or 24 h and cytokine response assessed by multiplex assay. Anti-CD52 antibodies induced very rapid release of IFN-γ, TNF, and IL-6, reaching maximal levels at 4–6 h and either plateaued (IL-6, IFN-γ) or decreased (TNF) at 24 h (). mAb1 and mAb2 triggered a similar rapid IFN-γ release first detected 2–4 h post-stimulation (), but did not trigger a significant increase of TNF or IL-6 at any time points examined. (). In contrast, no significant elevation of any inflammatory cytokines was observed with mAb3 over this time course (). Hence, IgG1 antibodies with CRS-inducing potential triggered in vitro an early IFN-γ release from human whole blood.
Figure 3. Kinetics of cytokine secretion to IgG1 antibodies with CRS-inducing potential. Whole blood from 4–5 donors were stimulated with anti-CD52, mAb1, mAb2 or mAb3 for 2, 4, 6, or 24 h. (A) IFN-γ, (B) TNF, and (C) IL-6 responses were assessed by multiplex cytokine analysis. Bar graph represent the mean ± SEM fold-change in cytokine levels normalized to the untreated samples. P-values generated by one-way ANOVA followed by paired T-test of log 10 transformed concentrations of treated versus untreated samples, (*p < 0.05). One representative experiment out of 2–3 experiments is shown.
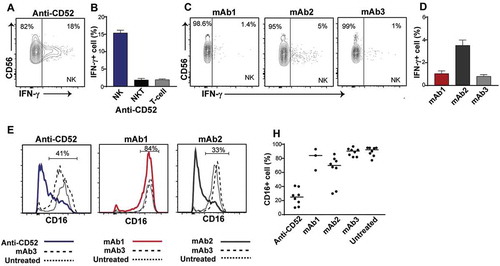
To assess the cell populations responsible for this IFN-γ release, we performed intracellular cytokine staining on permeabilized whole blood cells stimulated with anti-CD52, mAb1, mAb2, or mAb3. Flow cytometry was used to identify cell populations and to determine the percentage of each cell population secreting IFN-γ. No IFN-γ release was detected in T and natural killer (NK) T cells with any antibodies (). In contrast, a significant fraction of NK cells expressed IFN-γ in the presence of anti-CD52 antibodies () and mAb2 (). Consistent with the absence or low IFN-γ release observed in the multiplex assay, minimal intracellular IFN-γ was observed with mAb1 and mAb3 (). NK cell activation is associated with a rapid decrease in CD16 (FcγRIII) expression.Citation7 In agreement with the IFN-γ intracellular cytokine staining, anti-CD52 antibodies and, to a lower extent, mAb2, triggered CD16 downregulation in human NK cells (). Overall, these results suggest that IgG1 antibodies with CRS-inducing potential caused a rapid activation and IFN-γ release by NK cells in human whole blood.
Figure 4. Impact of IgG1 antibodies with CRS-inducing potential on NK cells in preclinical whole blood assay. Human whole blood were incubated with anti-CD52, mAb1, mAb2, or mAb3 for 24 h. (A-D) IFN-γ production by NK cells (CD3-CD56+) and (B) NKT cells (CD3+ CD56+) and T cells (CD3+ CD56-) in response to (A,B) anti-CD52, (C,D) mAb1, mAb2 and mAb3. (E-H) Analysis of CD16 expression on NK cells upon stimulation with (E,F) anti-CD52, (G,H) mAb1 and mAb2, or (E-H) mAb3. Bars are presented as mean ± SEM.
IFN-γ secretion induced by IgG1 antibodies is dependent on TNF and FcγRIII
We next investigated the molecular mechanisms regulating NK cell activation by therapeutic IgG1 antibodies in the whole blood assay. Previous studies suggested that TNF played an important role in cytokine-induced NK cell IFN-γ production.Citation8 To investigate the effect of TNF in IgG1-induced cytokine release, whole blood cells were incubated with blocking anti-TNF infliximab prior to stimulation with anti-CD52 or mAb2. Infliximab did not trigger any cytokine release in this assay (), but anti-TNF pre-treatment significantly inhibited the induction of IFN-γ by anti-CD52 IgG1 () and mAb2 () indicating that the IFN-γ release in response to IgG1 antibodies in whole blood culture is partially dependent on TNF.
Figure 5. Importance of TNF for IFN-γ release in response to IgG1 antibodies with CRS-inducing potential. IFN-γ release expressed in pg/ml was assessed using human whole blood pre-incubated with or without anti-TNF (infliximab) and then stimulated for 24 h with (A) anti-CD52, (B) mAb2, or (C) IgG1 isotype control. (D) IFN-γ release levels from untreated or infliximab treated whole blood. Significant results are denoted by asterisks. P-values generated by one-way ANOVA followed by paired T-test of concentrations of blocked versus control samples, (*p < 0.05). Donor responses shown are n = 7.
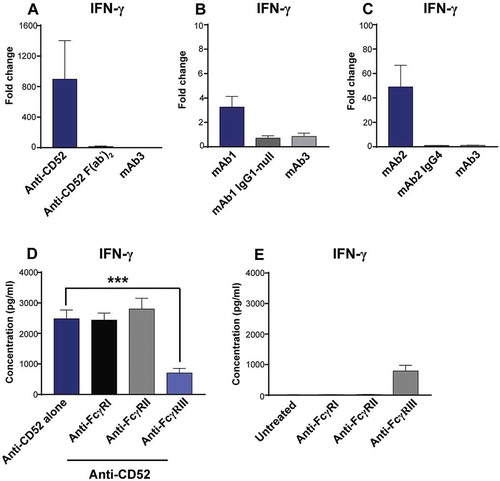
Triggering FcγRIIIa on NK cells is known to promote IFN-γ secretion.Citation9 To assess the contribution of the Fc region to IgG1-mediated NK cell IFN-γ response, we compared the response of whole blood cells to anti-CD52 full-length IgG or F(ab’)2. In contrast to anti-CD52 full-length IgG1, anti-CD52 F(ab’)2 failed to elicit IFN-γ secretion (). Similarly, no IFN-γ release was observed when mutations conferring an effector null IgG1 were introduced into mAb1 (), or when mAb2 heavy chain Fc region was switched from IgG1 to IgG4, which is known to have weaker binding to FcγR (). To further characterize the involvement of FcγR in IFN-γ response to IgG1 antibodies, whole blood cells pretreated with F(ab’)2 blocking FcγRI, FcγRII, or FcγRIII were stimulated with anti-CD52 antibodies for 24 h, and IFN-γ response was measured in plasma supernatant. Despite their intrinsic immunostimulatory activity (), only anti-FcγRIII F(ab’)2 inhibited the IFN-γ secretion to anti-CD52 antibodies (). Overall, our results suggest that IgG1 antibodies with CRS-inducing potential promote a TNF- and FcγRIII-dependent IFN-γ release from NK cells in whole blood culture.
Figure 6. Importance of FcγRIII for IFN-γ release in response to IgG1 antibodies with CRS-inducing potential. (A-C) IFN-γ release was assessed using human whole blood stimulated for 24 h with (A) anti-CD52, either full-length IgG1 or F(ab’)2, (B) mAb1 with either an IgG1 or an IgG1 effector-null backbone (C) mAb2 with either an IgG1 or an IgG4 backbone. Bar graph represent the mean ± SEM fold-change in cytokine levels normalized to the untreated samples. (D,E) IFN-γ release was assessed using human whole blood pre-incubated with blocking anti-FcγR F(ab’)2 (FcγRI, FcγRII, or FcγRIII) and then stimulated for 24 h with (D) anti-CD52 or without anti-CD52 (E). P-values generated by one-way ANOVA followed by paired T-test of concentrations of blocked versus control samples (*p < 0.05, **p < 0.01, ***p < 0.001). Bars are represented as mean ± SEM. Donor responses shown are (A) n = 4, (B-D) n = 6. One representative experiment out of 2–3 experiments is shown.
FcγRIIIa polymorphisms determine the magnitude of IgG1-dependent IFN-γ secretion
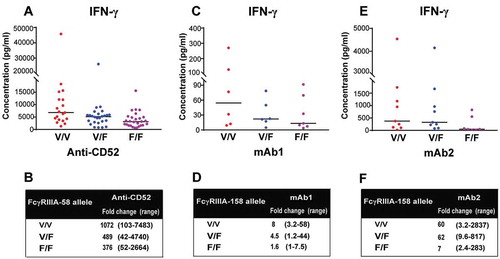
There are important polymorphisms in IgG receptors, including FcγRIIIa. FcγRIIIa from individuals with valine at position 158 has a higher infinity for IgG than FcγRIIIa from individuals with a phenylalanine at this position.Citation10 To determine the effect of FcγRIIIa 158V/F polymorphism on IFN-γ release by NK cells in whole blood culture, genotyping was performed on blood samples using a one step-PCR based method followed by Sanger sequencing, and the IFN-γ release in response to anti-CD52, mAb1 and mAb2 between the three different genotypes were analyzed. Individuals carrying the high affinity V/V alleles mounted stronger IFN-γ response to anti-CD52 antibodies in the whole blood assay than individuals bearing the low affinity F/F alleles (1072 versus 376 median fold-change with respect to untreated samples, respectively) (), while individuals carrying V/F alleles elicited intermediate response (489 median fold-change over untreated samples). Similar trends were observed when we compared the IFN-γ release by whole blood cells derived from V/V, V/F and F/F donors stimulated with mAb1 () and mAb2 (). Altogether, these results demonstrate that the importance of donor FcγRIIIa-V158F polymorphism for the magnitude of the IFN-γ response elicited by IgG1 antibodies with CRS-inducing potential.
Figure 7. FcγRIIIa polymorphisms determine the magnitude of IgG1-dependent IFN-γ secretion. (A,B) 73 donors were grouped by FcγRIIIa polymorphisms: (n = 26 V/F, 19 V/V, 28 F/F). IFN-γ release was assessed using FcγRIIIa-158 genotyped human whole blood stimulated for 24 h with anti-CD52. (C,D) 19 donors were grouped by FcγRIIIa polymorphisms: (n = 6 V/F, 6 V/V, 7 F/F). IFN-γ release was assessed using FcγRIIIA-158 genotyped human whole blood stimulated for 24 h with mAb1. (E,F) 25 donors were grouped by FcγRIIIa polymorphisms (n = 9 V/F, 9 V/V, 7 F/F). IFN-γ release was assessed using FcγRIIIa-158 genotyped human whole blood stimulated for 24 h with mAb2. The median of IFN-γ response for each genotype is denoted by a horizontal bar. (B,D,F) Median and range of IFN-γ response based on FcγRIIIa polymorphisms.
Discussion
IgG1 monoclonal antibodies are used as therapeutics for cancer and autoimmune diseases when immune effector functions are desired. However, their capacity to elicit excessive release of pro-inflammatory cytokines is an undesired property. Here, we identified IFN-γ release in the whole blood cytokine release assay as a signature associated with CRS-inducing IgG1 antibodies. This is in contrast to the complex cytokine response elicited by anti-CD52 antibodies (Campath-1H homolog), the most commonly used positive control for this assay. In addition to inducing high levels of IFN-γ we and others have shown that Campath also induced the release of IL-8, IL-6, IL-10, and TNF.Citation4,Citation11,Citation12 The unusual extent and magnitude of the cytokine response elicited by Campath may be caused by: 1) the high level of CD52 expression on the cell surface of immune cells, 2) the unusual target of this antibody (a glycoprotein of 12 amino acids anchored to glycosylphosphatidylinositol), and 3) the highly depleting activities of anti-CD52 antibodies in vivo that may involve not only antibody-dependent cell-mediated cytotoxicity (ADCC) involving NK cells and neutrophils,Citation13,Citation14 but also complement-dependent cytotoxicity Citation15 and direct induction of apoptosis.Citation16 Remarkably, polymorphisms in FcγRIIIa did not correlate with clinical response to alemtuzumab in chronic lymphocytic leukemia,Citation17 suggesting that its clinical mechanism of action is not limited to ADCC.
We have shown that IgG1 antibodies with CRS-inducing potential can be characterized by their capacity to induce IFN-γ release and CD16 downregulation from NK cells in whole blood derived from healthy volunteers. This is consistent with the recent report that obinutuzumab, anti-CD20 monoclonal antibody with higher incidence of CRS in humans than rituximab, induced robust IFN-γ release in the whole blood assay.Citation18 Remarkably, the three CRS-inducing IgG1 antibodies tested here, anti-CD52, mAb1, and mAb2 can trigger NK cell activation from human whole blood, but were unable to trigger NK cell activation and cytokine release when incubated with PBMCs (data not shown).Citation12 Similarly, tumor-targeting IgG1 antibodies, rituximab, trastuzumab, and obinutuzumab, also induced IFN-γ production by NK cells and CD16 down modulation by human PBMC, but only when the appropriate target tumor cells are co-cultured with PBMC.Citation19–Citation21 Although the mechanisms are not fully understood, the increased sensitivity of whole blood to IgG1 antibodies with CRS-inducing potential may be attributed to the presence of neutrophils or other FcγR-expressing cells.Citation13,Citation14
We have shown that TNF is an important modulator of NK cell activation IgG1 antibodies with CRS-inducing potential in the whole blood assay. Anti-CD52 and mAb2 induced a very rapid TNF production that peaked 4–6 h after incubation. This early TNF production in the whole blood assay has been previously reported for OKT3 Citation22 and Campath-1H.Citation4 Wing et al. identified NK cells as the cellular source of TNF, suggesting that NK cells are responsible for both TNF and IFN-γ response to IgG1 antibodies with CRS-inducing potential. However, the absence of cytokine release to IgG1 antibodies with CRS-inducing potential with human PBMCs suggest that the mechanisms regulating NK cell activation in the whole blood assay are complex and not fully understood.
We have found that FcγRIIIa is a strong predictor of the magnitude of the IFN-γ response elicited by IgG1 antibodies with CRS-inducing potential in the whole blood assay. This is consistent with previous work showing that anti-CD20 monoclonal antibody with enhanced affinity for CD16 activates NK cells at lower concentrations and more effectively than rituximab,Citation23 and that higher concentrations of rituximab are needed to induce NK cell activation from subjects with the lower affinity CD16 polymorphism.Citation20,Citation24 Population-based studies have shown that, among patients with select B cell malignancies treated with single-agent rituximab, those with high-affinity FcγRIIIa 158V have a better response rate than those with low-affinity FcγRIIIa 158F.Citation25 Our studies provide the first evidence of the importance of this polymorphism for preclinical cytokine release assays and their capacity to predict CRS.
In summary, the whole blood cytokine release assay is a useful preclinical screening tool for the prediction of CRS risk. While there are considerable differences in the magnitude and breadth of cytokine responses elicited by CRS-inducing IgG1 antibodies, they all have in common the capacity to trigger FcγRIIIa-dependent IFN-γ release by NK cells.
Materials and methods
Monoclonal antibodies and whole blood samples
Human IgG1 anti-CD52 (Campath-1H homolog), mAb1, mAb2, and mAb3 were supplied by Eli Lilly. Endotoxin levels of the antibodies and samples used in this study were measured and found to be within the assays acceptable levels. Whole blood samples were obtained in Na heparin vacutainer tubes from healthy donors after approved consent in accordance with ethical practice of Lilly research biological donation program (RBD) committee.
Ex-vivo whole blood assay with soluble monoclonal antibodies
Whole blood assay was performed to assess cytokine release risk in response to IgG1 monoclonal antibodies as previously described.Citation12,Citation26,Citation27 Briefly, heparinized whole blood was obtained from healthy donor population and used within two hours after donation. 225 μl of blood was added in duplicate into 96-well polypropylene round-bottom sterile plates (Corning Life Sciences, cat.no. 3879). IgG1 monoclonal antibodies were evaluated at final concentrations of 100 or 10 µg/ml. Monoclonal antibodies were diluted in sterile phosphate-buffered saline (PBS; Gibco, cat.no. 20,012,027) and added to the blood at 25 μl. Additionally, whole blood cells were treated with PBS buffer and used as donor baseline of cytokine levels. Following 24 h incubation at 37°C, 5% CO2, plates were centrifuged at 1,000 g and blood plasma supernatants were collected and stored at −80ºC
Multiplex cytokine analysis
Cytokine levels in plasma supernatants were detected using an MSD multiplex human pro-inflammatory panel assay (Meso Scale Discovery, cat.no. K15049D-2) following manufacture instructions. Duplicate plasma supernatants derived from whole blood assay were analyzed for the following cytokines: IFN- γ, IL-1β, IL-2, IL-4, IL-6, IL-8, IL-10, IL-12p70, IL-13, and TNF. Cytokine concentrations (pg/mL) in plasma supernatants were determined using MSD Discovery Workbench 4.0 and a 7-point standard curve with 4-fold dilution series. The standard curve fit was calculated using four parameter logistics regression (4PL).
For data analysis, the fold change was calculated by dividing the amount of cytokine detected in the treated sample by the PBS-only treated wells. A response was considered positive if the fold change was ≥ 2 above the baseline. Assay cut points were based on statistical analysis or the differential response observed to the PBS alone. Extensive assay development and previous studies have shown that this is the minimum signal to noise threshold allowing maximum sensitivity without detecting large numbers of false positive responses. The percentage of donors that responded (% donors responding) was calculated by taking the number of donors that had a positive fold change as a percentage of the total number of donors that were tested.
Kinetics of cytokine release in whole blood
To determine the kinetics of cytokine release to IgG1 antibodies, whole blood cells were incubated at 37°C, 5% CO2 for 2, 4, 6, and 24 h in the presence of anti-CD52, mAb1, mAb2 or mAb3. Cytokine release was assessed at the indicated timecourse post stimulation by multiplex analysis. Cytokine release to untreated samples (PBS buffer) was tested as a baseline control.
Intracellular cytokine staining
To detect intracellular expression of IFN-γ, whole blood cells were incubated with IgG1 antibodies for 16 h prior to the addition of 1 µg/ml of Golgi plug (BD Biosciences, cat.no. 555,029). After 4 h incubation, blood cells were stained for 30 minutes in dark with the following surface marker antibodies: anti-CD56-APC (Biolegend, cat.no. 555,518), anti-CD3 AlexaFluor700 (BD Biosciences, cat.no. 561,027), anti-CD16 PECy7 (BD Biosciences, cat. no. 557,744), anti-CD14 BV510 (Biolegend, cat.no. 301,841). Following surface marker staining, red blood cells were lysed with lysing buffer and stained with fixable viability stain 450 (BD Biosciences, cat.no. 562,247). Subsequently, blood cells were fixed using Cytofix/Cytoperm solution (BD Biosciences, cat.no. 554,714), washed with Perm/Wash buffer, and stained with anti-IFN-γ PE (BD Biosciences, cat.no. 561,056) for 30 minutes in dark. Cells were acquired on LSR Fortessa (BD Biosciences) and data was analyzed using FlowJo software (TreeStar).
TNF blocking
To evaluate the influence of TNF on IFN-γ release, whole blood cells were pre-incubated with 20 µg/ml of anti-TNF (infliximab, Janssen) for 1 h at 37°C. After the incubation, anti-CD52, mAb2, or IgG1 isotype control was added to the blocked blood cells and cytokine response was measured after 24 h.
Generation of anti-CD52 F(ab’)2
To determine if cytokine release by IgG1 monoclonal antibody is dependent on the Fc region, the anti-CD52 F(ab’)2 was generated using F(ab’)2 preparation kit (Pierce, cat.no. 44,988) following manufacture instructions. Briefly, 0.5 ml of anti-CD52 was added to Pierce spin column with immobilized pepsin and incubated for 5 h with mixing at 37°C. Following digestion reaction, the column was washed at 1,000 x g for 1 minute to separate digest from immobilized pepsin. Anti-CD52 F(ab’)2 was purified from the digest by passing through Pierce protein A column. The size of F(ab’)2 was assessed on SDS-PAGE gel.
Fcγ receptors inhibition
To determine which of the three FcγRs mediates cytokine release to IgG1 antibody, whole blood cells were pre-incubated with 10 µg/ml of blocking anti-FcγR F(ab’)2: anti-FcγRI (clone 10.1), anti-FcγRII (clone 7.3), or anti-FcγRIII (clone 3g8) from Ancell for 1 h at 37°C. 10 µg/ml anti-CD52 was then added and cytokine response measured after 24 h incubation.
FcγRIIIa 158- V/F genotyping
Genomic DNA from healthy donor populations was extracted from whole blood using QIAmp DNA blood mini kit (Qiagen) following the manufacturer’s instructions. The rs396991 (T/G) polymorphism was proven to be difficult to genotype accurately using Nested PCR or Taqman method, mainly because of the high degree of homology between the gene FcγRIIIa and FcγRIIIb.Citation28 Thus both Nested PCR and Taqman method were avoid in the current study; instead the genotyping of rs396991 (T/G) polymorphism was carried out with highly FcγRIIIa-specific one-step long range PCR followed by Sanger sequencing (data not shown). Briefly, a 2-kb PCR product containing the polymorphic site was amplified using forward primer 3A158-fwd and reverse primer 3A158-rev(T) and 3A158-rev(G) () and Taq polymerase(GoTaq® Green Master Mix, Promega). Subsequently, the PCR product was cleaned with ExoSAP-IT™ (Affymetrix, cat.no. 78,201.1.ML) and sequenced using primers Seq2 and 3A158-fwd to confirm the specificity and to identify FcγRIIIa 158 V/F allelic variants.
Table 2. Primer set used to identify FcγRIIIa 158 V/F alleles.
Statistical analysis
Bar graphs represent the mean ± SEM of the number of the experiment indicated in the figure legends. Statistical analysis was performed using one-way analysis of variance (ANOVA) followed by paired t-test of log transformed concentration.
Abbreviations
| CRS | = | Cytokine release syndrome |
| TNF | = | Tumor necrosis factor |
| mAb | = | Monoclonal antibody |
| PBMC | = | Peripheral blood mononuclear cell |
| IL | = | Interleukin |
| IFN | = | Interferon |
| NK | = | Natural killer |
Supplemental Material
Download Zip (97.4 KB)Acknowledgments
The authors would like to thank Payal Mehta and Meredith Steeves for useful discussion. We also thank Angela Markle and Christopher Moreland for participating in the experimental works.
Disclosure statement
Nada Alakhras, Jiabin Qiu, Guilherme Rocha, Derrick Witcher, Anja Koester, Jinsam You, David Schaer, Rikke Holmgaard, Kyla Driscoll, Jeffrey Willy, and Laurent Malherbe are employees of Eli Lilly and Company and may own Lilly stocks or stock options. The authors have no other relevant affiliations or financial involvement with any other organization or entity with a financial interest or conflict with the subject matter or materials discussed in the current manuscript.
Supplementary material
Supplemental data for this article can be access on the publisher’s website.
References
- Lee DW, Gardner R, Porter DL, Louis CU, Ahmed N, Jensen M, Grupp SA, Mackall CL. Current concepts in the diagnosis and management of cytokine release syndrome. Blood. 2014;124(2):188–195. PubMed PMID: WOS:000342618600011. doi:10.1182/blood-2014-05-552729.
- Finco D, Grimaldi C, Fort M, Walker M, Kiessling A, Wolf B, Salcedo T, Faggioni R, Schneider A, Ibraghimov A, et al. Cytokine release assays: current practices and future directions. Cytokine. 2014;66(2):143–155. PubMed PMID: WOS:000333729200008. doi:10.1016/j.cyto.2013.12.009.
- Brady JL, Harrison LC, Goodman DJ, Cowan PJ, Hawthorne WJ, O'Connell PJ, Sutherland RM, Lew AM. Preclinical screening for acute toxicity of therapeutic monoclonal antibodies in a hu-SCID model. Clin Transl Immunol. 2014;3(12):e29. PubMed PMID: 25587392; PubMed Central PMCID: PMC4282178. doi:10.1038/cti.2014.28.
- Wing MG, Moreau T, Greenwood J, Smith RM, Hale G, Isaacs J, Waldmann H, Lachmann PJ, Compston A. Mechanism of first-dose cytokine-release syndrome by CAMPATH 1-H: involvement of CD16 (FcgammaRIII) and CD11a/CD18 (LFA-1) on NK cells. J Clin Invest. 1996;98(12):2819–2826. PubMed PMID: 8981930; PubMed Central PMCID: PMC507749. doi:10.1172/JCI119110.
- Poirier N, Mary C, Dilek N, Hervouet J, Minault D, Blancho G, Vanhove B. Preclinical efficacy and immunological safety of FR104, an antagonist anti-CD28 monovalent Fab’ antibody. Am J Transplant. 2012;12(10):2630–2640. PubMed PMID: 22759318. doi:10.1111/j.1600-6143.2012.04164.x.
- Brennan FR, Kiessling A. In vitro assays supporting the safety assessment of immunomodulatory monoclonal antibodies. Toxicol Vitro. 2017. PubMed PMID: 28263892. doi:10.1016/j.tiv.2017.02.025.
- Romee R, Foley B, Lenvik T, Wang Y, Zhang B, Ankarlo D, Luo X, Cooley S, Verneris M, Walcheck B, et al. NK cell CD16 surface expression and function is regulated by a disintegrin and metalloprotease-17 (ADAM17). Blood. 2013;121(18):3599–3608. PubMed PMID: 23487023; PubMed Central PMCID: PMCPMC3643761. doi:10.1182/blood-2012-04-425397.
- Almishri W, Santodomingo-Garzon T, Le T, Stack D, Mody CH, Swain MG. TNFalpha Augments Cytokine-Induced NK Cell IFNgamma Production through TNFR2. J Innate Immun. 2016;8(6):617–629. PubMed PMID: 27560480. doi:10.1159/000448077.
- Anegon I, Cuturi MC, Trinchieri G, Perussia B. Interaction of Fc receptor (CD16) ligands induces transcription of interleukin 2 receptor (CD25) and lymphokine genes and expression of their products in human natural killer cells. J Exp Med. 1988;167(2):452–472. PubMed PMID: 2831292; PubMed Central PMCID: PMCPMC2188858.
- Koene HR, Kleijer M, Algra J, Roos D, von dem Borne AE, de Haas M. Fc gammaRIIIa-158V/F polymorphism influences the binding of IgG by natural killer cell Fc gammaRIIIa, independently of the Fc gammaRIIIa-48L/R/H phenotype. Blood. 1997;90(3):1109–1114. PubMed PMID: 9242542.
- Holgate RG, Weldon R, Jones TD, Baker MP. Characterisation of a Novel Anti-CD52 Antibody with Improved Efficacy and Reduced Immunogenicity. Plos One. 2015;10(9):e0138123. PubMed PMID: 26372145; PubMed Central PMCID: PMCPMC4570798. doi:10.1371/journal.pone.0138123.
- Vessillier S, Eastwood D, Fox B, Sathish J, Sethu S, Dougall T, Thorpe SJ, Thorpe R, Stebbings R. Cytokine release assays for the prediction of therapeutic mAb safety in first-in man trials - Whole blood cytokine release assays are poorly predictive for TGN1412 cytokine storm. J Immunol Methods. 2015. PubMed PMID: 25960173. doi:10.1016/j.jim.2015.04.020.
- Hu Y, Turner MJ, Shields J, Gale MS, Hutto E, Roberts BL, Siders WM, Kaplan JM. Investigation of the mechanism of action of alemtuzumab in a human CD52 transgenic mouse model. Immunology. 2009;128(2):260–270. PubMed PMID: 19740383; PubMed Central PMCID: PMCPMC2767316. doi:10.1111/j.1365-2567.2009.03115.x.
- Siders WM, Shields J, Garron C, Hu Y, Boutin P, Shankara S, Weber W, Roberts B, Kaplan JM. Involvement of neutrophils and natural killer cells in the anti-tumor activity of alemtuzumab in xenograft tumor models. Leuk Lymphoma. 2010;51(7):1293–1304. PubMed PMID: 20377308. doi:10.3109/10428191003777963.
- Crowe JS, Hall VS, Smith MA, Cooper HJ, Tite JP. Humanized monoclonal antibody CAMPATH-1H: myeloma cell expression of genomic constructs, nucleotide sequence of cDNA constructs and comparison of effector mechanisms of myeloma and Chinese hamster ovary cell-derived material. Clin Exp Immunol. 1992;87(1):105–110. PubMed PMID: 1339322; PubMed Central PMCID: PMCPMC1554244.
- Rowan W, Tite J, Topley P, Brett SJ. Cross-linking of the CAMPATH-1 antigen (CD52) mediates growth inhibition in human B- and T-lymphoma cell lines, and subsequent emergence of CD52-deficient cells. Immunology. 1998;95(3):427–436. PubMed PMID: 9824507; PubMed Central PMCID: PMCPMC1364410.
- Lin TS, Flinn IW, Modali R, Lehman TA, Webb J, Waymer S, Moran ME, Lucas MS, Farag SS, Byrd JC. FCGR3A and FCGR2A polymorphisms may not correlate with response to alemtuzumab in chronic lymphocytic leukemia. Blood. 2005;105(1):289–291. PubMed PMID: 15217834. doi:10.1182/blood-2004-02-0651.
- Herter S, Herting F, Muth G, van Puijenbroek E, Schlothauer T, Ferrara C, Brady K, Lang S, Bacac M, Mossner E, et al. GA101 P329GLALA, a variant of obinutuzumab with abolished ADCC, ADCP and CDC function but retained cell death induction, is as efficient as rituximab in B-cell depletion and antitumor activity. Haematologica. 2018;103(2):e78–e81. PubMed PMID: 29079598; PubMed Central PMCID: PMCPMC5792291. doi:10.3324/haematol.2017.178996.
- Parihar R, Dierksheide J, Hu Y, Carson WE. IL-12 enhances the natural killer cell cytokine response to Ab-coated tumor cells. J Clin Invest. 2002;110(7):983–992. PubMed PMID: 12370276; PubMed Central PMCID: PMCPMC151155. doi:10.1172/JCI15950.
- Bowles JA, Weiner GJ. CD16 polymorphisms and NK activation induced by monoclonal antibody-coated target cells. J Immunol Methods. 2005;304(1–2):88–99. PubMed PMID: 16109421. doi:10.1016/j.jim.2005.06.018.
- Capuano C, Pighi C, Molfetta R, Paolini R, Battella S, Palmieri G, Giannini G, Belardinilli F, Santoni A, Galandrini R. Obinutuzumab-mediated high-affinity ligation of FcgammaRIIIA/CD16 primes NK cells for IFNgamma production. Oncoimmunology. 2017;6(3):e1290037. PubMed PMID: 28405525; PubMed Central PMCID: PMCPMC5384385. doi:10.1080/2162402X.2017.1290037.
- Robinet E, Morel P, Assossou O, Revillard JP. TNF-alpha production as an in vitro assay predictive of cytokine-mediated toxic reactions induced by monoclonal antibodies. Toxicology. 1995;100(1–3):213–223. PubMed PMID: 7624879.
- Bowles JA, Wang SY, Link BK, Allan B, Beuerlein G, Campbell MA, Marquis D, Ondek B, Wooldridge JE, Smith BJ, et al. Anti-CD20 monoclonal antibody with enhanced affinity for CD16 activates NK cells at lower concentrations and more effectively than rituximab. Blood. 2006;108(8):2648–2654. PubMed PMID: 16825493; PubMed Central PMCID: PMCPMC1895597. doi:10.1182/blood-2006-04-020057.
- Veeramani S, Wang SY, Dahle C, Blackwell S, Jacobus L, Knutson T, Button A, Link BK, Weiner GJ. Rituximab infusion induces NK activation in lymphoma patients with the high-affinity CD16 polymorphism. Blood. 2011;118(12):3347–3349. PubMed PMID: 21768303; PubMed Central PMCID: PMCPMC3179401. doi:10.1182/blood-2011-05-351411.
- Treon SP, Hansen M, Branagan AR, Verselis S, Emmanouilides C, Kimby E, Frankel SR, Touroutoglou N, Turnbull B, Anderson KC, et al. Polymorphisms in Fc gamma RIIIA (CD 16) receptor expression are associated with clinical response to rituximab in Waldenstrom’s macroglobulinemia. J Clin Oncol. 2005;23(3):474–481. PubMed PMID: WOS:000226591000012. doi:10.1200/jco.2005.06.059.
- Bailey L, Moreno L, Manigold T, Krasniqi S, Kropshofer H, Hinton H, Singer T, Suter L, Hansel TT, Mitchell JA. A simple whole blood bioassay detects cytokine responses to anti-CD28SA and anti-CD52 antibodies. J Pharmacol Toxicol Methods. 2013;68(2):231–239. PubMed PMID: 23280407. doi:10.1016/j.vascn.2012.12.003.
- Wolf B, Morgan H, Krieg J, Gani Z, Milicov A, Warncke M, Brennan F, Jones S, Sims J, Kiessling A. A whole blood in vitro cytokine release assay with aqueous monoclonal antibody presentation for the prediction of therapeutic protein induced cytokine release syndrome in humans. Cytokine. 2012;60(3):828–837. PubMed PMID: WOS:000311248000035. doi:10.1016/j.cyto.2012.08.018.
- Mellor JD, Brown MP, Irving HR, Zalcberg JR, Dobrovic A. A critical review of the role of Fc gamma receptor polymorphisms in the response to monoclonal antibodies in cancer. J Hematol Oncol. 2013;6:10. PubMed PMID: WOS:000313957300001. doi:10.1186/1756-8722-6-1.