
 ?Mathematical formulae have been encoded as MathML and are displayed in this HTML version using MathJax in order to improve their display. Uncheck the box to turn MathJax off. This feature requires Javascript. Click on a formula to zoom.
ABSTRACT
Monoclonal antibody (mAb) candidates from high-throughput screening or binding affinity optimization often contain mutations leading to liabilities for further development of the antibody, such as aggregation-prone regions and lack of solubility. In this work, we optimized a candidate integrin α11-binding mAb for developability using molecular modeling, rational design, and hydrophobic interaction chromatography (HIC). A homology model of the parental mAb Fv region was built, and this revealed hydrophobic patches on the surface of the complementarity-determining region loops. A series of 97 variants of the residues primarily responsible for the hydrophobic patches were expressed and their HIC retention times (RT) were measured. As intended, many of the computationally designed variants reduced the HIC RT compared to the parental mAb, and mutating residues that contributed most to hydrophobic patches had the greatest effect on HIC RT. A retrospective analysis was then performed where 3-dimentional protein property descriptors were evaluated for their ability to predict HIC RT using the current series of mAbs. The same descriptors were used to train a simple multi-parameter protein quantitative structure-property relationship model on this data, producing an improved correlation. We also extended this analysis to recently published HIC data for 137 clinical mAb candidates as well as 31 adnectin variants, and found that the surface area of hydrophobic patches averaged over a molecular dynamics sample consistently correlated to the experimental data across a diverse set of biotherapeutics.
Introduction
Integrin α11 is a collagen-binding integrin known to be overexpressed in cancer associated fibroblasts (CAFs) in a non-small cell lung cancer model, where its upregulation induces extracellular matrix remodeling and provides a milieu for enhanced tumorigenesis.Citation1 Based on the hypothesized role of integrin α11 in disease, we generated a panel of antibodies to the receptor by cell-based panning of a phage library and identified a lead candidate with high affinity and function modulating activity, but poor biophysical properties.
As more biotherapeutics are entering pharmaceutical pipelines, early-stage developability assessment and optimization strategies for biotherapeutics are in high demand. To that end, both empirical and computational methods have been developed for assessing stability, aggregation, hydrophobic interaction, viscosity, and other liabilities.Citation2–Citation4 Successful efforts have also been made to use rational design to reduce aggregation and improve solubility by mutating hydrophobic surface regions derived from a crystal structure.Citation5–Citation7
In the absence of a crystal structure, homology models have been used to derive predictions for properties such as aggregation, viscosity and clearance,Citation8–Citation11 and structural surface hydrophobicity descriptors have been shown to correlate to HIC RT.Citation12–Citation14 More recently, multi-parameter protein quantitative structure-property relationship (QSPR) models have been developed to predict high-concentration viscosities of mAbs using surface hydrophobicity and charge descriptors from full antibody homology models and similar protein QSPR models have been reported for predicting chromatographic behavior, including HIC.Citation15–Citation17 The earlier work of building single-parameter hydrophobic patch predictors was validated appropriately using experimental data for fewer than twenty sequences.Citation8,Citation12 For the multi-parameter models that are being constructed and applied to experimental antibody property prediction,Citation10,Citation15,Citation16 large sets of sequences and experimental data are required for model building and validation. Ideally, such datasets would include negative data in order to robustly train predictive models and advance the field in the direction of data driven computational predictions, e.g., available protein thermostability benchmark datasets have allowed machine learning to be applied, resulting in accurate thermostability predictions.Citation18 Fortunately, data from multiple experiments for developability on 137 diverse mAbs in clinical trials or approved at the time of publication have been made available,Citation2 and a series of 31 adnectin variants with percent inclusion body data has recently been published.Citation19
In this work, a homology model of a lead integrin α11 binding mAb was generated and used for structure-guided optimization of HIC RT. Regions of significant hydrophobicity on the surface of the model were identified and experimental mutagenesis of the key residues involved in these hydrophobic patches was performed. Following small-scale expression, several variants had reduced HIC RT compared to the parent mAb and most showed retained binding to integrin α11 as assessed by flow cytometry. We provide the sequences and experimental data for this series of 97 integrin binding mAb variants (Supplementary Information), and present a retrospective analysis of the performance of the computational predictions on our dataset as well as the published datasets,Citation2,Citation19 with the goal to identify consistently useful descriptors for developability predictions on the diverse landscape of biotherapeutics.
Results
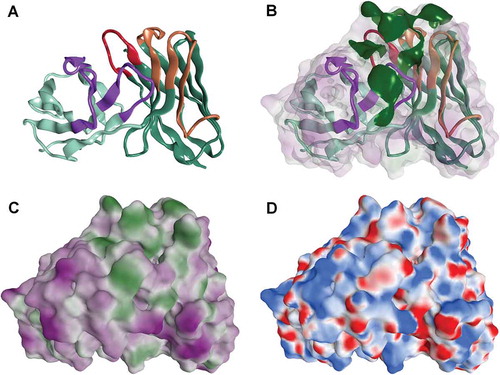
The integrin α11 antibody NB0268 was identified by whole cell selections using an antibody phage library.Citation20 The Fv region of NB0268 was modeled and its van der Waals surface was analyzed for hydrophobicity and electrostatics (). The log P hydrophobicity surface revealed hydrophobic regions on the complementarity-determining regions (CDRs) and polar regions on the framework surface. Protein patch analysis revealed a number of regions of significant surface hydrophobicity, especially on the CDRs and the electrostatic surface revealed a general lack of significant surface charged regions except for a small positively charged region on the surface of the framework of the light chain. When tested by HIC, NB0268 did not elute from the column during the 30 min method described herein. Thus, the high degree of CDR hydrophobicity identified by homology model analysis was confirmed empirically.
Figure 1. Homology model of the variable domains of the parental integrin binding antibody NB0268. The backbone of the Fv domain is depicted as ribbons with the CDRs highlighted (A) and hydrophobic patches are shown in green (B). The log P hydrophobicity surface is shown in (C) where green is hydrophobic and purple is polar. In (D), the electrostatic surface displays delta negative regions in red and positive regions in blue.
Rational design of mutants for improved developability
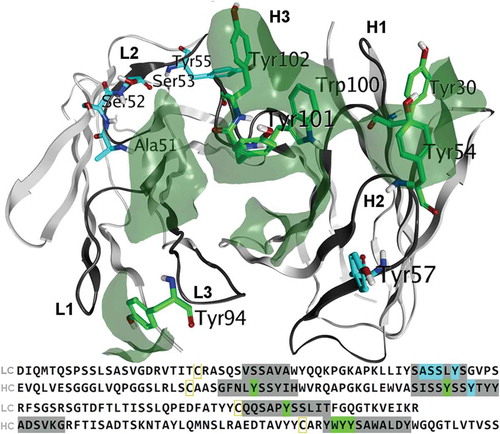
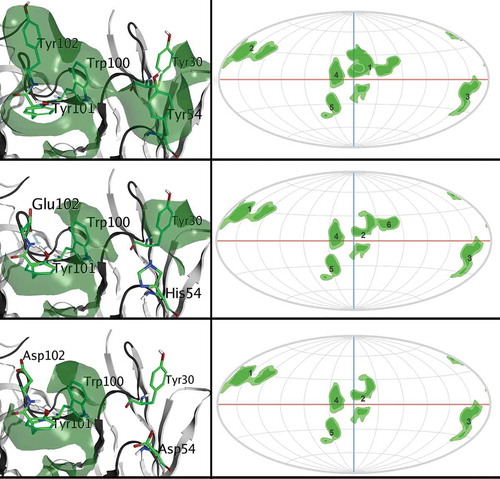
The binding and functional characteristics of NB0268 make it an attractive therapeutic candidate, but its significant hydrophobicity could lead to challenges in development, due to, for example, poor solubility and aggregation. Residues assumed to be contributing to CDR hydrophobicity (as determined by the homology model) were identified for site-directed mutagenesis. In addition, a few variants in CDR-L2 were chosen specifically based on a recent study.Citation21 In total, 39 single mutations were generated by mutating A51, S52, S53, Y55, and Y94 on the light chain (7 variants); and Y30, Y54, Y57, W100, Y101, and Y102 on the heavy chain (32 variants), replacing them with mostly polar and charged amino acids, e.g., His, Asp, Ser, Thr, Gln, Gly ().
Figure 2. Parental mAb residues selected for mutation. Atoms belonging to residues which contribute to a hydrophobic patch are colored green while others are colored blue, and these colors are mapped to the sequence at the bottom. CDRs, as defined by the Kabat scheme, are dark grey in the sequence as is the corresponding 3D backbone ribbon.
HIC and integrin binding results for the 97 variants tested
The 39 single mutants were analyzed for binding (flow cytometry) and HIC RT (Supplementary Information). The residues in CDR-H3 at the center of the largest hydrophobic patch were found to contribute significantly to the poor HIC RT of NB0268, as three of five W100 mutants (His, Asp, Gln) eluted, all of the seven Y101 mutants eluted, and six of seven Y102 mutants eluted. For mutations in the heavy chain positions Y30, Y54, Y57, only 3 of 11 eluted from the column. The likely reason for this is that Y30 is on the edge of a smaller hydrophobic patch along with Y54, and Y57 is not part of a patch. Of note, most of the mutants showed maintained binding to integrin α11, with loss of binding observed for only two of 39 single mutants.
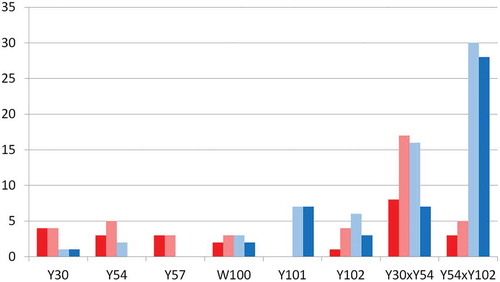
The Y54S mutant increased the integrin α11 binding signal; therefore, hydrophobicity in this region is not a requirement for binding. Building from this, 57 Y54 double mutants were expressed, of which 24 were in positions Y30 x Y54 and 33 were in positions Y54 x Y102. For Y30 x Y54 double mutants, 16/24 variants (67%) eluted, representing a modest improvement after eliminating a relatively small hydrophobic patch. For the Y54 x Y102 double mutants, 30/33 variants (91%) eluted from the column, some with quite favorable elution times. This is exemplified by Y54H x Y102E with a RT of 21.3 min, which is the lowest of all variants tested, and the integrin α11 binding is maintained for this double variant. The effect of mutating the heavy chain CDR residues on HIC RT is summarized in . Y101 and Y102 mutants have the greatest favorable impact, reducing the RT below 27.5 minutes for most variants. These residues also happen to have a large hydrophobic surface area at the center of the patches ()
Figure 3. Effect of mutating the heavy chain CDR residues on HIC RT. The number of variants for each position which do not elute from the column are shown in red, while the amount that elute more slowly than 27.5 minutes are shown in light red. The number of variants for each position which elute are shown in light blue, and the amount that elute faster than 27.5 minutes are shown in blue.
On the light chain, the A51D and S53D variants eluted, but with relatively high retention times (28.9 min and 29.1 min, respectively). The variant S52D did not elute, nor did Y55D. Furthermore, none of the Y94 mutants eluted. The light chain mutants either had relatively high HIC RT or did not elute; therefore, the effect was small when mutating residues that were not part of a large hydrophobic patch, and, overall, mutating residues that contribute to large surface hydrophobic patches was successful in reducing HIC retention times.
Structural protein property descriptor predictions of HIC RT
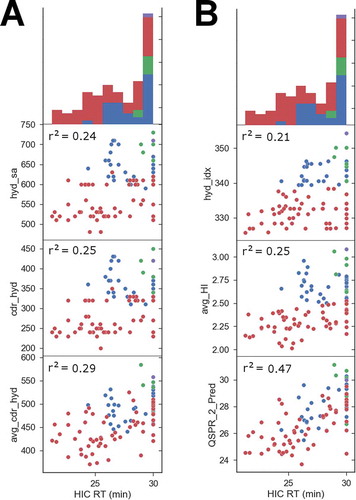
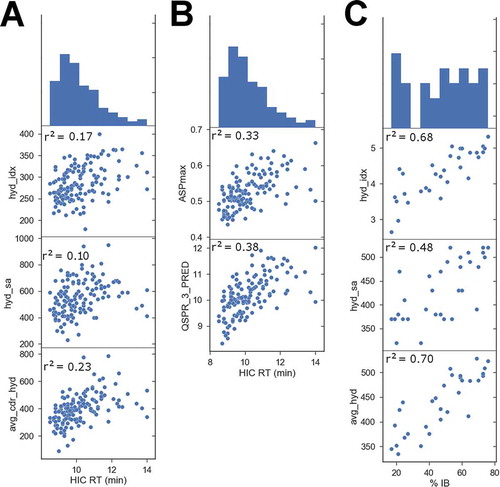
In order to further investigate the predictive ability of 3-dimentional (3D) protein properties for experimental hydrophobicity, we generated antibody antigen-binding fragment (Fab) homology models for all variants tested and calculated the total hydrophobic patch surface areas of the CDRs. We found that there is a trend where the higher the hydrophobic surface area of the CDRs, the higher the HIC RT (). More specifically, the higher the sum of the surface areas of hydrophobic patches, the higher the HIC RT, and, if we only count the CDR regions, the correlation is retained. Finally, if a LowModeMD ensemble is generated,Citation22 and average descriptor values are obtained from the sample, the correlation increases. The best correlation observed for a single descriptor is avg_cdr_hyd (r2 = 0.29), which is the sum of the surface areas of the hydrophobic patches at the CDRs averaged over a LowModeMD sample of conformations. In comparison, the Black and Mould sequence-based hydrophobic indexCitation23 has a Pearson correlation r2 of 0.21 to the HIC RT ().
Figure 4. Comparison of structural protein property descriptors to HIC RT for the 97 NB0268 variants tested (A). The HIC RT is the x-axis throughout, and its histogram is shown at the top. Antibodies that did not elute from the column were assigned an elution time of 30 minutes, representing the maximum value possible. The Pearson correlation r2 between the descriptor and the HIC RT is reported on each scatter plot. hyd_sa is the sum of the surface areas of all hydrophobic patches on the homology model. cdr_hyd is the same value but only calculated near the CDR regions. avg_cdr_hyd is the cdr_hyd value averaged over a LowModeMD generated sample of conformations. The parental integrin α11 mAb is colored purple throughout, light chain variants are green, heavy chain single mutants are blue, and double mutants are red. (B) Comparison of protein QSPR model performance to sequence-based hydrophobic index for the 97 mAb variants tested. hyd_idx is the Black & Mould hydrophobic index based on sequence alone. avg_HI is the hydrophobic imbalance descriptor, and QSPR_2_Pred is the 2-point protein QSPR model prediction.
Protein QSPR model predictions of HIC retention times
In an effort to generate a more predictive model with a greater correlation to HIC RT, partial least squares (PLS) regression QSPR models were generated and optimized for this system using a genetic algorithm to optimize multiple linear regression models (GA-MLR). This resulted in a 2-point QSPR (r2 = 0.47, see , and a leave-one-out cross validation correlation x2 = 0.44) including avg_HI, which is the hydrophobic imbalance value as described by Salgado et al., and avg_hyd_1, which is the surface area of the largest hydrophobic patch averaged over the LowModeMD ensemble.Citation12 The 2-point QSPR equation is shown below.
For the two measures of hydrophobicity, their coefficients are positive where the more hydrophobic, the higher the HIC RT, as one would expect from a biophysical perspective.
The hydrophobic patch descriptors were generally able to assign high values to non-eluting antibodies and low values to fast-eluting variants, such as Y54H x Y102E (see ). Twenty nine of the 30 (97%) top scoring variants from the QSPR model had a reduced HIC RT compared to the parent, and many with binding affinity maintained. This model would be useful for screening libraries of NB0268 mAb variants generated by experimental techniques, or by computational protein design for those with reduced HIC RT.
Figure 5. Parental mAb (top) compared to Y54H x Y102E (middle) and Y54D x Y102D (bottom). Y54H x Y102E is the fastest eluting variant due to the reduction in hydrophobic patch surface area. Y54D x Y102D is a false positive outlier in the HIC RT predictions which, despite having a significant reduction in hydrophobic surface area, does not elute. On the right side, 2D projections of the Fv domain surface patches are shown for each variant.
Hydrophobicity descriptor HIC RT predictions for antibodies in clinical development
In order to test if the protein property descriptors calculated can be predictive for a broader range of antibodies, we modeled the 137 mAbs in clinical development that have published HIC RT measurements.Citation2 Applying identical methods to model, sample, and calculate properties as used for the NB0268 variants, we found a similar trend where the more hydrophobic the CDR surface, the higher the HIC RT (). We found that the 3D descriptors were more predictive than the sequence-based method, but that their correlations to experimental HIC RT are generally weaker compared to the NB0268 variants. This is to some extent expected since the 137 mAbs are clinical candidates and have likely been selected based on optimal solubility behavior. This is apparent in the HIC RT histogram at the top of , compared to that of . It is more difficult to rank order such a narrow range of data points for HIC RT, and a relatively predictive descriptor again was avg_cdr_hyd, which is the sum of the surface areas of hydrophobic patches at the CDRs averaged over a LowModeMD sample of conformations.
Figure 6. Comparison of structural protein property descriptors to HIC RT for 137 diverse clinical candidate mAbs (A). The plots report the Pearson correlation r2 between the descriptor and experimental HIC RT, with the top-most plot being a histogram of the HIC RT values. hyd_idx is the Black & Mould hydrophobic index based on sequence alone. hyd_sa and avg_cdr_hyd are described in . (B) Comparison of protein QSPR model predictions of HIC RT for 137 diverse clinical candidate mAbs. ASPmax is the maximum average surface property (or hydrophobicity) descriptor and QSPR_3_Pred is a 3-point QSPR model fit to HIC RT for this series. (C) Comparison of structural protein property descriptors to inclusion body data available for 31 adnectin variants. The plots report the Pearson correlation r2 between the descriptor and the experimental % IB, whose histogram appears as the top plot. hyd_idx is described above, hyd_sa is the sum of the surface areas of all hydrophobic patches on the homology model. avg_hyd is the same value but calculated as an average over a LowModeMD generated sample of conformations.
A QSPR model was trained on this data using the GA-MLR method. This resulted in a 3-point QSPR (r2 = 0.38, see , and a leave-one-out cross validation correlation x2 = 0.34) including ASPmax, which is the maximum average surface property value as described by Salgado et al.,Citation13 avg_cdr_hyd (described previously), and the pro_dipole_moment, which is a measure of how strongly the charge of the protein is polarized. The 3-point QSPR equation is shown below:
For the two measures of hydrophobicity, their coefficients are positive where the more hydrophobic, the higher the HIC RT, as one would expect from a biophysical perspective. This QSPR model, trained on diverse IgG1 candidates, can be applied to roughly predict HIC RT for future IgG1 mAbs, although identical modeling methods would need to be used.
Performance of hydrophobicity descriptors on adnectin % IB prediction
There is an additional dataset available of 31 adnectin triple-mutant variant sequences, each having percent inclusion body data, a measure of insoluble protein aggregate formation.Citation19 This data was modeled in similar fashion to the two previous examples and the % IB is correlated to the sequence-based Black and Mould hydrophobic index and also to the 3D hydrophobicity descriptors calculated (see ).Citation23 The original publication reported that a sequence-based multi-parameter aggregation predictor, Zagg, achieved a correlation r2 = 0.61, and this is similar to what we observe simply for sequence-based hydrophobic index.Citation19 The avg_hyd is the hydrophobic patch surface area averaged over a LowModeMD generated ensemble of model conformations, and its correlation to % IB is r2 = 0.70. In this case, a QSPR model was not trained because the single sequence and hydrophobic patch descriptors are adequately predictive.
Discussion
This work has demonstrated that HIC RT can be reduced by mutating residues responsible for hydrophobic patches. We have observed that hydrophobic patch surface areas, and related descriptors, can be used broadly for HIC RT optimization, and that training a multi-parameter protein QSPR can enhance predictiveness for a given series of variants and experimental data. This method has also been validated on publicly available experimental data for a variety of biotherapeutics and we have contributed a new series of 97 mAb sequences with HIC RT and integrin binding data (Supplementary Information).
Applicability of structural protein property descriptors to HIC RT optimization
Consistent with recent work,Citation16 mutating CDR residues responsible for large hydrophobic patches proved successful for reducing HIC RT, and double mutants of these residues further reduced HIC RT. For the three residues primarily responsible for large CDR hydrophobic patches, W100, Y101, and Y102, 46 of 52 (88%) of their mutants eluted from the column. The vast majority of the Y101 and Y102 variants elute faster than 27.5 minutes (). These residues are at the center of the CDR patches and contribute greatly to the hydrophobic surface area, and this is likely the reason why their variants have the most dramatic favorable effect on HIC RT. Quantitatively, the correlation of the HIC RT to the hydrophobic patch surface area is more modest. However, if the avg_cdr_hyd descriptor is used as a filter eliminating the variants that are greater than 450 Å2, 30 of the 32 top-predicted variants elute, representing a prediction accuracy of 94%.
Adding charged residues in place of polar residues on the LC CDRs near the hydrophobic patches did not reduce HIC RT. Future work could include adding charges near the edges of the CDRs, as this strategy has been used to reduce aggregation.Citation5 It has been observed that differences in HIC retention times between variants of the same molecule can be the result of conformational change.Citation3 The QSPR model has an outlier, the HC Y54D x Y102D double mutant, which does not elute from the HIC column while having a remarkably low hydrophobicity score (shown in ). This is surprising because the single mutant Y102D and the double mutant Y54Q x Y102D both eluted with HIC RT of 26.6 min and 23.8 min, respectively. However, the single mutant Y54D did not elute either; therefore, it may be that Y54D variants are misfolding or causing some other anomaly, which also may account for the loss of binding of Y54D x Y102D (Supplementary Information).
The CDR-H2 sequence is SSYSS from position 52 to 56 and the nearest human germline (IGHV3-48) has SSSSS in this region. It could be that SSDSS, which is not seen in any germlines at this position, is electronegative enough to cause misfolding. Furthermore, Y102D is a second negatively charged residue added to the CDRs, likely reducing the isoelectric point of the antibody, and potentially causing aggregating interactions that would cause the protein to stick to the column. These are potential explanations for why the prediction outlier molecule, Y54D x Y102D, did not elute. Also, Y54D contains SSDSS and DS in the exposed, flexible region of CDR-H2 and would represent an isoaspartate formation motif; it is best avoided to prevent the risk of losing efficacy during long-term storage.Citation11 In general, during computational screening, one can increase prediction performance by avoiding radical mutations such as introducing two charged residues, proline, glycosylation sites, and can filter out potential degradation motifs, such as isomerization and oxidation and liabilities.
Knowledge gained from predictions on 137 clinical candidates and adnectins
Generally, clinical candidates and US Food and Drug Administration-approved antibodies have relatively low HIC RT, and data for other developability experiments such as stability and aggregation fall in appropriate ranges, as described recently.Citation2 Computationally, when engineering antibodies, one can compare a candidate and its 3D properties to those in this set of 137 candidates. Any candidates with unusually large CDR hydrophobic patch surface areas can be flagged for potentially slow HIC elution. Other properties such as charge and dipole moment can be used to profile candidates against clinical mAbs and liabilities can be identified early on, such as isoaspartate formation sites, glycosylation, and Met and Trp oxidation sites.Citation3,Citation11,Citation24,Citation25 A 3-point protein QSPR model with a stronger correlation to HIC RT was generated for this dataset, and it does correlate when applied to the independent set of 97 integrin mAbs; however, the correlation is not significantly stronger than that of the individual descriptors. The individual descriptors correlate across biotherapeutic classes and the QSPR models are best used for screening variants of the sequences on which they were trained. Future work is needed to develop global developability predictors using the experimental data available that can be applied during novel mAb discovery and optimization. In the case of the adnectin inclusion body data, the 3D descriptor performance is comparable to the sequence-based hydrophobic index;Citation23 however, this is likely due to the fact that only 3 residues were mutated, each having solvent-exposed sidechains. In the other two datasets, where there is more variation, the 3D methods clearly outperform the sequence-based hydrophobic index. A 3D protein QSPR model was not generated for this dataset because the single parameter predictors are providing an adequate correlation and any further training would likely be over-fit to variants of the 3 residues mutated, which were already well explored in the study. The single descriptor predictions are much more likely to successfully transfer to variants of other residue positions for this adnectin series.
Insights gained on biologics modeling and protein QSPR predictions
Antibodies can be modeled adequately for developability optimization with homology modeling. There are currently roughly 3,000 crystal structures of antibody variable domains in the Protein Data Bank (PDB). The Fab models produced in this study based on homologous framework and CDR grafting proved adequate for property calculations. The 137 clinical-stage mAbs were each expressed on the human IgG1 scaffold, as were the currently studied integrin α11 mAbs. Therefore, all mutations were within the variable domain and it was not necessary to model the Fc domain or full mAb tetramers. If the mutations for a given series are within the Fab region, then the methods described here should be applicable. If a given series of data for antibodies contains mutations on the hinge, or Fc domain, then these regions will need to be modeled, and the structural descriptors and protein QSPR could be applied for developability optimization.Citation10,Citation15 These methods may also present a challenge when working with unusual CDR loops either in sequence or in size. In such cases, obtaining a crystal structure of one of the candidate Fabs as a template for modeling the others is recommended. Antigen bound co-crystals are also very useful for determining mutants that are more likely to retain target binding while optimizing solubility.Citation7
Molecular dynamics sampling can rectify homology modeling errors when generating structural protein descriptors for experimental predictions. In earlier work on this topic, properties were averaged over molecular dynamics simulations.Citation8 In this study, LowModeMD with implicit solvation was used to generate variable sidechain and flexible loop ensembles of each homology model. LowModeMD focuses velocities on low frequency motions, and is a much faster method for conformational sampling than classical dynamics performed in explicit solvent. In each of the 3 datasets studied, the LowModeMD-averaged descriptors had a higher correlation to the experiment than that calculated using the homology models alone. The accuracy of homology modeling is highly dependent on the sequence similarity of the structural template(s) used, and for mAb variable domains, the framework modeling is generally successful (backbone RMSD < 1), as are the LC CDRs and HC CDRs 1 and 2. The CDR-H3 accuracy varies in homology modeling and this,Citation26,Citation27 as well as sidechain conformational variation, can explain why the MD averaging improves experimental predictions. The conformational ensemble produced by LowModeMD likely smoothes out sensitivity in homology modeling, reducing error, especially when template quality is poor. The more uncertain the homology model, the more flexible sampling is likely required. LowModeMD sampling takes approximately 1 minute of computation time per sample for a Fab structure; therefore, most researchers using a standard laptop could model up to 100 antibodies per day with this method. For larger libraries, high-performance computing is required for conformational sampling; however, static models can be used if they provide an adequate training set prediction, and if only small variations are being made (single and double mutants) in library generation.
In this work, PLS regression QSPR modeling was chosen, as opposed to machine learning or other more complex algorithms, because regression provides a human readable equation that can be used for biophysical model justification. The genetic algorithm optimizer to identify PLS models given several parameters was useful for finding small combinations of parameters on which to apply PLS fitting. Other methods such as machine learning techniques could be used to produce models with stronger correlations, but with a risk of over-fitting and a lack of biophysical explanation. Classifiers can assign mAbs as “slow” or “fast” eluters and one such method is Bayesian decision tree classification, which provides human readable rules given descriptors, which can be highly accurate and backed by biophysical meaning.
Modeling the integrin α11 parental mAb and applying rational design to identify and mutate residues largely responsible for CDR hydrophobic patches proved successful for reducing HIC RT. The hydrophobic patch surface area averaged over a LowModeMD sample consistently correlates to the HIC and % IB data studied across biotherapeutic classes. This single parameter should transfer well to other biologic optimization projects. Multi-parameter QSPR models can be used to increase the correlation and predictive power for a given series of sequences, as was demonstrated on the HIC data for 97 integrin α11 mAb variants. More large published experimental datasets on biotherapeutic developability are needed as is future work to generate more robust computational predictors.
Materials and methods
Phage selections
Fab-phage from Library FCitation20 were cycled through four rounds of binding selection using a parental cancer associated fibroblast (CAF) cell line as the background depleting step and an overexpressing CAF cell line as the target selection step. 10x10^6 cells were used for selections and were incubated for 2 hrs at 4C in 1 ml growth culture medium with a library of 3 × 10¹³ Fab-phage. Phage were eluted from cell-pellets using 0.1 M hydrochloric acid, incubated for 10 min at room temperature, and were subsequently neutralized with 1 M Tris buffer. Cell debris was removed from phage eluate by high speed centrifugation.
Antibody homology model generation
A homology model of the variable region of the parental mAb was created using the Antibody Modeler application in MOE Citation2016.0802.Citation28 Using the method described by Maier and Labute,Citation29 a homology search was performed and 2R8S was used as the framework template for both chains. For the CDRs, 4KZE, 4XVU, 4XVU were used as templates for light chain CDR1, 2, and 3, respectively, while 3PNW, 3S34, and 3AUV were used for the heavy chain CDR 1, 2, and 3, respectively. This chimeric template is 97% identical to the parent for the VL region and 90% identical for VH. For high-throughput antibody model generation of the datasets studied, the Bio MOE extension of MOE Citation2016.0802 was used to generate all Fab models. For each antibody, the best scoring Fv and CDR templates were used to build variable region models, and these were grafted onto the trastuzumab (Herceptin) Fab structure 1N8Z and energy minimized with the Amber10:EHT forcefield in MOE Citation2016.0802 for Fab model completion.Citation30 The first adnectin sequence was modeled with the Homology Model application in MOE Citation2016.0802 from the fibronectin template PDB 1FNF and the Automatic Homology Model application within Bio MOE was used to generate the 31 adnectin variant models studied.Citation31
Property calculations on 3D models
Hydrophobic patches were identified with the Protein Patch Analyzer application in MOE Citation2016.0802. Patches consist of regions where a hydrophobic potential equal to or greater than that of a methyl group persists over surface area greater than 50 Å2. The hydrophobic potential is determined using the SLogP method for each atom and mapping the result onto the surface. For averaged LowModeMD sample-based patch surface area calculations,Citation22,Citation32 the framework backbone atoms where restrained to 0.25 Å of their modeled positions, the alpha carbons of the H3 loops where restrained to 2 Å and the alpha carbons of the other CDRs to 1 Å. Averaged patch surface area calculations were performed on 50 samples for each structure using the Dynamic Property Sampling application within the Bio MOE extension of MOE Citation2016.0802 where the default Amber10:EHT forcefield and the reaction field solvation model was used. Other properties were calculated from the Protein Properties application in MOE Citation2016.0802 and the sequence-based hydrophobic index is calculated by a custom MOE implementation of the method.Citation23,Citation33 The protein QSPR calculations such as PLS fitting were performed with QSAR Model application in MOE Citation2016.0802 and the GA-MLR method within the AutoQSAR extension to MOE was used to identify PLS models.
Purification of IgGs
Transfections were performed using the ExpiFectamine 293 Transfection Kit according to manufacturer’s protocol and were cultured at 37 C for 6 days in a CO2 incubator. Cultures were centrifuged twice at 6000 g for 10 min each, followed by 0.45 um filtration to remove cells. Recombinant Protein A Sepharose was washed three times in 1x PBS pH 7.4. One mL of Sepharose was added to each sample and incubated on a rotator for 1 hour at room temperature. Samples were fed through separate poly prep columns to collect the Sepharose beads. Beads were washed with 1x PBS pH 7.4 for 10 column volumes and eluted with IgG elution buffer (Pierce). Eluate was neutralized immediately with Tris-Cl pH 8 upon elution. Peak fractions were pooled and dialyzed into 1x PBS pH 7.4. IgG concentrations were quantified using a nanodrop.
HPLC-HIC analyses
The HPLC-HIC analyses were performed with the Agilent 1290 Infinity LC system, including an Agilent 1290 Infinity Binary Pump, an Agilent 1290 Infinity Multisampler an Agilent 1290 Infinity, a Column Compartment, and an Agilent Infinity Diode Array Detector. To screen the mAbs hydrophobicity, 100 µL media sample was injected onto a 7.5 × 75 mm, 10 μm TSKgel Ether-5PW from Tosoh equilibrated with 1.5 M ammonium sulfate and 0.1 M sodium phosphate buffer, pH 6.5 (mobile phase A) at flow rate 1.0 mL/min. To elute the mAbs, a salt gradient was established from 100% mobile phase A to 100% mobile phase B (0.1 M sodium phosphate buffer, pH 6.5) in 30 min. The column was re-equilibrated with mobile phase A for 10 min before the next injection.
Binding screens by flow cytometry
CAF cells were stably transfected to overexpress integrin α11 and their parental cell lines were used to establish background levels of expression (integrin α11-negative).Citation34 Briefly, cells were dissociated from flasks using TrypLE express reagent for 4 min at 37 C. Cells were resuspended in 1x PBS + Ca/Mg (Thermo) and filtered to remove clumps before staining. Cells were then plated in 96-well V bottom plates at 300,000 c/ml and spun to remove any wash media. Antibodies were diluted to 100 nM and added to the cells for 1 hr at 4 C. After 2x washes, secondary antibody was added to cells (Gt anti Hu-Fc Alexa 647, Jackson ImmunoResearch) and incubated for 30 min at 4 C. Cells were then washed 2x before being resuspended in 200 uL FACS buffer for reading on Cytoflex (Beckman Coulter). Fold changes in MFI between CAF overexpressing cells relative to their parental MFI are listed in the supplementary information. Binding was considered to be ‘lost’ if it was below a 2-fold shift in signal on CAF cells or considered to be ‘increased’ if it was greater than two times the parental fold shift on CAF cells.
Abbreviations and Symbols
| mAb | = | Monoclonal antibody |
| HIC RT | = | Hydrophobic interaction chromatography retention time |
| Fv | = | Variable fragment |
| MOE | = | Molecular Operating Environment |
| GB/VI | = | Generalized Born/volume integral |
| RMSD | = | Root mean square distance |
| MD | = | Molecular dynamics |
| LowModeMD | = | Molecular dynamics focused on low frequency vibrations |
| CDR | = | Complementarity-determining region |
| Fc | = | Crystallizable fragment |
| log P | = | Logarithm of the octanol/water partition coefficient |
| GA-MLR | = | Genetic algorithm for optimizing multiple linear regression |
| QSPR | = | Quantitative structure-property relationship |
| PLS | = | Partial least squares |
| IB | = | Inclusion body |
| LC | = | Light chain |
| HC | = | Heavy chain |
| Fab | = | Fragment antigen binding |
| VL | = | Variable region of the light chain |
| VH | = | Variable region of the heavy chain |
| IgG | = | Immunoglobulin G |
| FACS | = | Fluorescence-activated cell sorting |
Supplemental Material
Download MS Excel (16.4 KB)Acknowledgments
The authors would like to thank Dr. Gino Gallo in the lab of Dr. Dev Sidhu for phage selections. Also, thanks to Dr. Robin Hallett, Peter Bayliss, and Olga Egorova at Northern Biologics for their efforts in lead antibody selection, and to colleagues at CCG for developing various applications and for helpful discussions for this research.
Disclosure statement
No potential conflict of interest was reported by the authors.
References
- Zhu C, Popova S, Brown E, Baryste-Lovejoy D, Navab R, Shih W, Li M, Lu M, Jurisica I, Penn L, et al. Integrin alpha11 regulates IGF2 expression in fibroblasts to enhance tumorigenicity of human non-small-cell lung cancer cells. PNAS. 2007; 104(28): 11754–11759.doi:10.1073/pnas.0703040104.
- Jain T, Sun T, Durand S, Hall A, Houston NR, Nett JH, Sharkey B, Bobrowicz B, Caffry I, Yu Y, et al. Biophysical properties of the clinical-stage antibody landscape. Proc Natl Acad Sci USA. 2017; 114(5): 944–949.doi:10.1073/pnas.1616408114.
- Haverick M, Mengisen S, Shameem M, Ambrogelly A. Separation of mAbs molecular variants by analytical hydrophobic interaction chromatography HPLC: overview and applications. mAbs. 2014;6:.852–858. doi:10.4161/mabs.28693.
- Kumar S, Singh SK, editors Developability of biotherapeutics: computational approaches. Boca Raton (FL): CRC Press; 2015.
- Perchiacca JM, Ladiwala AR, Bhattacharya M, Tessier PM. Aggregation-resistant domain antibodies engineered with charged mutations near the edges of the complementarity-determining regions. Protein Eng Des Sel. 2012;25:.591–601. doi:10.1093/protein/gzs042.
- Courtois F, Schneider CP, Agrawal NJ, Trout BL. Rational design of biobetters with enhanced stability. J Pharm Sci. 2015;104(8):2433–2440. doi:10.1002/jps.24520.
- Wu SJ, Luo J, O’Neil KT, Kang J, Lacy ER, Canziani G, Baker A, Huang M, Tang QM, Raju TS, et al. Structure-based engineering of a monoclonal antibody for improved solubility. Protein Eng Des Sel. 2010;23:643–651. doi:10.1093/protein/gzq037.
- Chennamsetty N, Voynov V, Kayser V, Helk B, Trout BL. Design of therapeutic proteins with enhanced stability. Proc Natl Acad Sci USA. 2009;106:.11937–11942. doi:10.1073/pnas.0904191106.
- Chennamsetty N, Helk B, Voynov V, Kayser V, Trout BL. Aggregation-prone motifs in human immunoglobulin G. J Mol Biol. 2009;391:.404–413. doi:10.1016/j.jmb.2009.06.028.
- Lauer TM, Agrawal NJ, Chennamsetty N, Egodage K, Helk B, Trout BL. Developability index: a rapid in silico tool for the screening of antibody aggregation propensity. J Pharm Sci. 2012;101:.102–115. doi:10.1002/jps.22758.
- Sharma VK, Patapoff TW, Kabakoff B, Pai S, Hilario E, Zhang B, Li C, Borisov O, Kelley RF, Chorny I, et al. In silico selection of therapeutic antibodies for development: viscosity, clearance, and chemical stability. Proc Natl Acad Sci USA. 2014;111:18601–18606. doi:10.1073/pnas.1421779112.
- Salgado JC, Rapaport I, Asenjo JA. Predicting the behavior of proteins in hydrophobic interaction chromatography 1: using the hydrophobic inbalance (HI) to describe their surface amino acid distribution. J Chromatogr A. 2006;1107:.110–119. doi:10.1016/j.chroma.2005.12.032.
- Salgado JC, Rapaport I, Asenjo JA. Predicting the behavior of proteins in hydrophobic interaction chromatography 2: using a statistical description of their surface amino acid distribution. J Chromatogr A. 2006;1107:.120–129. doi:10.1016/j.chroma.2005.12.033.
- Karkov HS, Krogh BO, Woo J, Parimal S, Ahmadian H, Cramer SM. Investigation of protein selectivity in multimodal chromatography using in silico designed Fab fragment variants. Biotechnol Bioeng. 2015;112:.2305–2315. doi:10.1002/bit.25642.
- Tomar DS, Li L, Broulidakis MP, Luksha NG, Burns CT, Singh SK, Kumar S. In-silico prediction of concentration-dependent viscosity curves for monoclonal antibody solutions. mAbs. 2017;9(3):476–489. doi:10.1080/19420862.2017.1285479.
- Robinson JR, Karkov HS, Woo JA, Krogh BO, Cramer SM. QSAR models for prediction of chromatographic behavior of homologous Fab variants. Biotechnol Bioeng. 2017;114:.1231–1240. doi:10.1002/bit.26236.
- Insaidoo F, Banerjee S, Roush D, Cramer SM. Computational modeling in bioprocess development. In: Staby A, Rathmore AS, Ahuja S, editors. Preparative chromatography for separation of proteins. Hoboken (USA): Wiley; 2017. doi:10.1002/9781119031116.ch6.
- Berliner N, Teyra J, Colak R, Garcia Lopez S, Kim PM. Combining structural modeling with ensemble machine learning to accurately predict protein fold stability and binding affinity effects upon mutation. PLoS ONE. 2014;9(9):e107353. doi:10.1371/journal.pone.0107353.
- Trainor K, Gingras Z, Shillingford C, Malakian H, Gosselin M, Lipovsek D, Meiering EM. Ensemble modeling and intracellular aggregation of an engineered immunoglobulin-like domain. J Mol Biol. 2016;428:.1365–1374. doi:10.1016/j.jmb.2016.02.016.
- Persson H, Ye W, Wernimont A, Adams JJ, Koide A, Koide S, Lam R, Sidhu SS. CDR-H3 diversity is not required for antigen recognition by synthetic antibodies. J Mol Biol. 2013;425(4):803–811. doi:10.1016/j.jmb.2012.11.037.
- Dudgeon K, Rouet R, Kokmeijer I, Schofield P, Stolp J, Langley D, Stock D, Christ D. General strategy for the generation of human antibody variable domains with increased aggregation resistance. Proc Natl Acad Sci USA. 2012;109:.10879–10884. doi:10.1073/pnas.1202866109.
- Labute P. LowModeMD—implicit low-mode velocity filtering applied to conformational search of macrocycles and protein loops. J Chem Inf Model. 2010;50:.792–800. doi:10.1021/ci900508k.
- Black SD, Mould DR. Development of hydrophobicity parameters to analyze proteins which bear post- or cotranslational modifications. Anal Biochem. 1991;193:.72–82. doi:10.1016/0003-2697(91)90045-U.
- Sydow JF, Lipsmeier F, Larraillet V, Hilger M, Mautz B, Molhoj M, Kuentzer J, Klostermann S, Schoch J, Voelger HR, et al. Structure-based prediction of asparagine and aspartate degradation sites in antibody variable regions. PloS ONE. 2014; 9(6): e100736.doi:10.1371/journal.pone.0100736.
- Yang R, Jain T, Lynaugh H, Nobrega RP, Lu X, Boland T, Burnina I, Sun T, Caffry I, Brown M, et al. Rapid assessment of oxidation via middle-down LCMS correlates with methionine side-chain solvent-accessible surface area for 121 clinical stage monoclonal antibodies. mAbs. 2017; 9(4): 646–653.doi:10.1080/19420862.2017.1290753.
- Almagro JC, Beavers MP, Hernandez-Guzman F, Maier J, Shaulsky J, Butenhof K, Labute P, Thorsteinson N, Kelly K, Teplyakov A, et al. Antibody modeling assessment. Proteins. 2011;79:3050–3066. doi:10.1002/prot.23130.
- Almagro JC, Teplyakov A, Luo J, Sweet RW, Kodangattil S, Hernandez-Guzman F, Gilliland GL. Second antibody modeling assessment (AMA-II). Proteins. 2014;82:.1553–1562. doi:10.1002/prot.24567.
- Molecular Operating Environment (MOE). Montreal (QC, Canada): Chemical Computing Group ULC.; 2016 August.
- Maier JKX, Labute P. Assessment of fully automated antibody homology modeling protocols in molecular operating environment. Proteins. 2014;82:.1599–1610. doi:10.1002/prot.24576.
- Cho HS, Mason K, Ramyar KX, Stanley AM, Gabelli SB, Denney DW Jr, Leahy DJ. Structure of the extracellular region of HER2 alone and in complex with the Herceptin Fab. Nature. 2003;421:.756–760. doi:10.1038/nature01392.
- Leahy DJ, Aukhil I, Erickson HP. 2.0 Å crystal structure of a four-domain segment of human fibronectin encompassing the RGD loop and synergy region. Cell. 1996;84(1):155–164. doi:10.1016/S0092-8674(00)81002-8.
- Wildman SA, Crippen GM. Prediction of physicochemical parameters by atomic contributions. J Chem Inf Comput Sci. 1999;39(5):868–873. doi:10.1021/ci990307l.
- Long WF, Labute P. Calibrative approaches to protein solubility modeling of a mutant series using physicochemical descriptors. J Comput Aided Mol Des. 2010;24:.907–916. doi:10.1007/s10822-010-9383-z.
- Navab R, Strumpf D, Bandarchi B, Zhu CQ, Pintilie M, Ramnarine VR, Ibrahimov E, Radulovich N, Leung L, Barczyk M, et al. Prognostic gene-expression signature of carcinoma-associated fibroblasts in non-small cell lung cancer. PNAS. 2011;108(17):7160–7165. doi:10.1073/pnas.1014506108.