
 ?Mathematical formulae have been encoded as MathML and are displayed in this HTML version using MathJax in order to improve their display. Uncheck the box to turn MathJax off. This feature requires Javascript. Click on a formula to zoom.
ABSTRACT
Identification of asparagine (Asn) sites that are prone to deamidation is critical for the development of therapeutic monoclonal antibodies (mAbs). Despite a common chemical degradation pathway, the rates of Asn deamidation can vary dramatically among different sites, and prediction of the sensitive deamidation sites is still challenging. In this study, characterization of Asn deamidation for five IgG1 and five IgG4 mAbs under both normal and stressed conditions revealed dramatic differences in the Asn deamidation rates. A comprehensive analysis of the deamidation sites indicated that the deamidation rate differences could be explained by differences in the local structure conformation, structure flexibility and solvent accessibility. A decision tree was developed to predict the deamidation propensity for all Asn sites in IgG mAbs based on the analysis of these three structural parameters. This decision tree will allow potential Asn deamidation hot spots to be identified early in development.
Introduction
Deamidation of neutrally charged asparagine (Asn) residues to negatively charged aspartate (Asp) or isoaspartate (isoAsp) residues is a common degradation pathway that occurs during the manufacturing and storage of monoclonal antibodies (mAbs). Deamidation of several Asn residues in the complementary-determining regions (CDRs) of IgG mAbs have been reported to affect antigen binding.Citation1–Citation4 Recent studies have also shown that changes in the charge distribution on the protein surface could alter mAb pharmacokinetics (PK) by affecting FcRn-IgG dissociation.Citation5,Citation6 Thus, the potential risk of deamidation at each site needs to be evaluated to ensure product stability.
The molecular mechanism of Asn deamidation has been well studied (Figure 1).Citation7–Citation9 In this degradation pathway, the side-chain carbonyl group of Asn is attacked by the deprotonated backbone NH group of the adjacent C-terminal residue to generate a cyclic succinimide intermediate. The cyclic succinimide is formed from an unstable tetrahedral intermediate and can be detected under low pH conditions. At neutral and basic pH, the succinimide intermediate is rapidly hydrolyzed at either of the carbonyl centers to form Asp or isoAsp. The ratio of Asp to isoAsp varies depending on the reaction buffer and local structural environment.Citation9,Citation10
A reliable model is needed to predict the propensity of Asn deamidation and design more robust protein therapeutics and develop a suitable control strategy to ensure product quality. Currently, potential deamidation “hot spots” are still commonly identified based on primary sequence motifs such as NG and NS that were derived from a pentapeptide model system.Citation11 However, the same primary sequence motifs can have different rates of Asn deamidation depending on the higher order structure and storage conditions of the protein. Some of these predicted “hot spots” have low or non-detectable levels of deamidation in reality because of geometric constraints imposed by secondary or tertiary structural elements in a fully folded antibody.Citation9,Citation12–Citation14
The difficulty in predicting deamidation propensity based on amino acid sequence motifs alone suggests that a more detailed structural analysis is needed. After evaluating many structural parameters of the peptide bond, the distance between the nucleophilic NH group of the adjacent C-terminal residue and the Cγ center of the Asn side chain (Cγ-N distance) was considered a key factor influencing the deamidation rate (Figure 1).Citation7 It was proposed that a Cγ-N distance of 1.89 Å was favorable for forming the succinimide intermediate, and this distance could be obtained if the dihedral psi (ψ) angle for rotation around the Cα-C bond was −120° and the chi1 (Χ1) angle for rotation around the Cα-Cβ bond was 120°. However, this ideal peptide geometry is rarely observed in known protein structures because of constraints imposed by secondary and tertiary structural elements. For example, the hydrogen bond network between the β-strands would constrain the flexibility of the Asn residue and limit its ability to adopt the above-mentioned conformation. In addition, if a backbone NH group is involved in a hydrogen bond, its ability to induce a nucleophilic attack on the Asn side chain is significantly reduced.Citation9 Based on Clarke’s theoretical model of Asn deamidation, Xie et al have suggested that the minimum distance for the formation of the Cγ-N bond for β-turn and loop structures ranges between 3.1 and 3.3 Å.Citation9 This distance is much longer than the typical C-N bond of 1.4–1.5 Å, suggesting that the deamidation rates for Asn residues within a folded protein would be much slower than the rates observed in less structured peptides.
Although a number of new methods combining primary and tertiary structural information to predict Asn deamidation sites have been presented,Citation15,Citation16 a more systematic analysis of protein structure dynamics is needed to improve the reliability of these predictions. Here, IgG mAbs were chosen as protein models to study the correlations between Asn deamidation rates and protein structural features. Forced degradation studies using a combination of high pH and heat stress were performed to experimentally identify the sensitive Asn deamidation sites in mAbs. The deamidation levels were quantified by liquid chromatography (LC)/mass spectrometry (MS) peptide mapping analysis and exponential first-order kinetics models were used to calculate the deamidation rate constants for each Asn site. The structural features that were responsible for different deamidation rates were then determined and a decision tree was constructed that can be used to identify Asn deamidation “hot spots”.
Results
Deamidation of IgG1 mAbs under normal and stressed conditions
Five therapeutic IgG1 mAbs were included in the deamidation analysis. All mAbs were fully human IgG1 mAbs except mAb2, which was a murine/human chimeric mAb with a human IgG1 constant region sequence. All mAbs were stored at −70ºC in an acidic formulation buffer (5.0 – 5.8) to minimize Asn deamidation. To induce deamidation, mAb samples were incubated at 37°C in the formulation buffer at pH 5.0 – 5.8 for up to 180 days and phosphate buffer at pH 8.5 for up to 30 days. The antibody samples incubated in phosphate buffer at pH 8.5 were dialyzed back to their original formulation buffers prior to analysis to avoid further degradation. Peptide mapping with LC/MS/MS analysis was used to identify and quantify Asn deamidation in all samples. The deamidation reaction kinetics followed exponential first-order kinetics and rate constants were calculated as described in the Methods and Materials section.
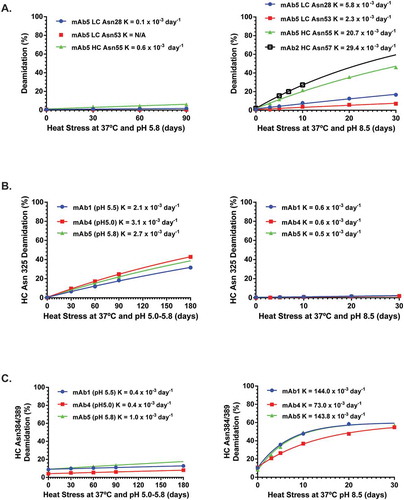
As shown in , only 6 of the 29 Asn residues in the fragment variable (Fv) region of unstressed mAbs had deamidation levels > 0.5% (heavy chain (HC) Asn57, light chain (LC) Asn93, HC Asn43, LC Asn28, LC Asn53 and HC Asn55). HC Asn43 was the most sensitive site, with >70% deamidation under normal, unstressed storage conditions. The levels of deamidation at the other 5 sites were <5%. Although the deamidation levels increased after heat stress in acidic formulation buffer, only LC Asn93, HC Asn43 and HC Asn55 had deamidation increase > 5% and all rate constants were less than 1.0 x 10⁻³ day−1 (, ). In contrast, HC Asn57, LC Asn28, LC Asn53 and HC Asn55 deamidation increased >5% after heat stress in phosphate buffer at pH8.5, with rate constants ranging from 2.3 x 10⁻³ day−1 to 29.4 x 10⁻³ day−1 (, ).
Table 1. Structural analysis of HC Asn325 from IgG1 and IgG4 Fc structural models in the PDB.
Table 2. Structural analysis of Asn deamidation in the Fc region.
Figure 1. Mechanism of Asparagine (Asn) Deamidation. Schematic representation of L-Asn deamidation, which can occur spontaneously by nucleophilic attack of the C-terminal adjacent peptide bond nitrogen atom on the side chain carbonyl group of L-Asn. This step leads to the formation of a tetrahedral intermediate, which quickly generates cyclic imide intermediate (succinimide). In the second step, succinimide undergoes hydrolytic attack at both carbonyl centers, leading to formation of Asp and isoAsp isoforms. The rate determining step for the deamidation process is the cyclization step leading to the succinimide intermediate, which is regulated by dihedral angles (Ψ and Χ1) and Cγ-N distance.
Figure 2. Kinetic profiles for Asn deamidation under stressed conditions. The symbols are experimental data points and the lines represent the data fitting with exponential kinetic models described in the methods. K (observed deamidation constant) was obtained from the model fitting.
In summary, HC Asn57, LC Asn93, HC Asn43, LC Asn28, LC Asn53 and HC Asn55 were identified as deamidation “hot spots” in the Fv region. These sites were all located in the complementarity-determining regions (CDRs) of the mAbs, and their deamidation rates were higher at pH 8.5 than pH 5–6, which were consistent with previous reports.Citation16–Citation18 These results imply that the conformation of Asn residues in the CDR loops were unique and more prone to deamidation than the Asn residues in other Fv regions.
As shown in , only 5 of the 10 Asn residues (glycosylation site Asn297 was excluded in this analysis) in the conserved Fc region of unstressed mAbs had deamidation levels ≥ 0.5%, HC Asn315, HC Asn325, HC Asn384/389, and HC Asn434. HC Asn315 and HC Asn 384/389 were the most sensitive sites, with >5% deamidation under normal, unstressed storage conditions. These results were consistent with previous reports.Citation19,Citation20 It should be noted that HC Asn315 is not considered a deamidation hot spot even though up to 8% deamidation was detected in unstressed mAbs because HC Asn315 contains the sensitive NG sequence motif and much of the deamidation detected at this site occurred during peptide map analysis (unpublished observations). Similar method related artifacts were also reported previously.Citation19
Table 3. Structural analysis of Asn deamidation in the Fv region.
Only HC Asn325 deamidation increased >5% after heat stress in acidic formulation buffer, with rate constants ranging from 2–3 x 10⁻³ day−1 (, ). However, its deamidation rate constants were reduced to ~ 0.5 x 10⁻³ day−1 at pH 8.5 (). The rate constant for HC Asn325 deamidation was further decreased at neutral pH (0.1 x 10⁻³ day−1, data not shown). The observation that the deamidation rate for HC Asn325 residue was much greater under heat stress in acidic pH than basic or neutral pH was opposite that for other Asn sites, which typically have increased deamidation in higher pH solutions.Citation17,Citation18 On the other hand, only HC Asn384/389 deamidation increased >5% after heat stress in basic phosphate buffer, with rate constants ranging from 73 x 10−3 day−1 to 144 x 10−3 day−1 (, Supplementary Table 4).
In summary, 6 Asn residues in the Fv region and 3 Asn residues in Fc region were sensitive to deamidation under normal storage or heat stress conditions. These results suggested that deamidation propensity cannot be determined from the sequence motif alone because only 4 of the 14 sites with an NG or NS sequence motif were sensitive to deamidation. In addition, LC Asn93 and LC Asn28 had NW and NI sequence motifs, which had very low deamidation rates in the pentapeptide model.Citation11 Thus, a comprehensive correlation between the deamidation rates and three-dimensional structures was performed in order to better understand the structural impact on deamidation rates
Structural analysis of Asn384/389 deamidation
HC Asn384 and Asn389 residues located in the PENNY peptide of the Fc region are well-known deamidation hot spots, especially under high pH stress conditions. As shown in , the deamidation rates increased significantly under heat stress at pH 8.5, with half-times ranging between 4 and 10 days for all three tested mAbs. Interestingly, the levels of deamidation plateaued after 10 days and never reached 100%. These results suggested that there may be two different rates for Asn384/389 deamidation, although more data points at the extended incubation time are needed to define a biphasic model. To compare deamidation rates with other sites, the HC Asn384/389 deamidation rate from the fast phase was determined by setting the maximal deamidation level at 60% in the exponential kinetic model. The Asn384/389 deamidation rate ranged from 70 ~ 144 x 10−3 day−1, which was the highest among all Asn sites.Citation1 The R square values for all three mAbs were >0.99.
To understand the molecular basis for the biphasic nature of HC Asn384/389 deamidation, peptide geometries for HC Asn 384 and HC Asn389 from over 20 human IgG1 Fc structures available in the RCSB Protein Database Bank (PDB) were analyzed, which revealed that both residues had a favorable and an unfavorable conformation for deamidation ( and Supplementary Table 5). Considering the orientation of side chain and distance between C-N bond (electrophile-nucleophile distance), the conformation of HC Asn384 in PDB 1FC1 with a ψ angle of −122.7º and a Cγ-N distance of 2.8Å was more favorable for deamidation than the one in PDB 4W4O with a ψ angle of 38.0º and a Cγ-N distance of 5.0Å (). For a similar reason, the conformation of HC Asn389 in PDB 4W4O with a ψ angle of −18.3º and a Cγ-N distance of 3.3Å was more favorable for deamidation than the one in PDB 4BYH with a ψ angle of 9.6º and Cγ-N distance of 5.0Å ().
Figure 3. Comparison of for HC Asn384 (A) and HC Asn389 (B) Conformations obtained from two different crystal structure models.
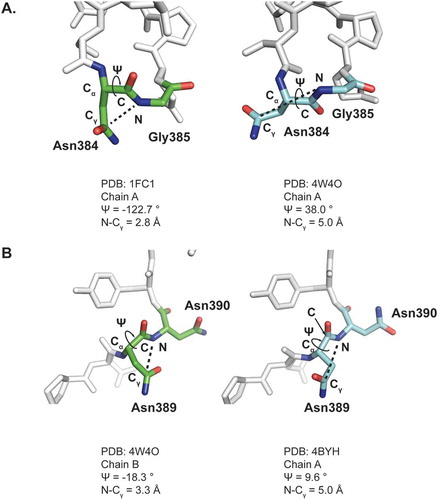
Two distinct peptide geometries for HC Asn 384 and HC Asn389 lead to four possible combinations: unfavorable deamidation conformations for both residues, favorable deamidation conformations for both residues, or combinations of unfavorable and favorable conformations for the pair. Unfavorable deamidation conformations were commonly observed for both residues in the deposited Fc crystals grown in acidic or neutral pH conditions, which explained their slow deamidation rates observed under acidic or neutral pH conditions. In contrast, the rate constants for HC Asn384/Asn389 deamidation increased over 100-fold under basic pH conditions, which suggested that a conformational change induced by basic pH conditions might have increased the rate of backbone NH group deprotonation and facilitated formation of the cyclic succinimide intermediate. In summary, HC Asn384 and HC Asn389 in the Fc region appear to have at least two possible conformations with different deamidation rates, which likely contributed to the biphasic rates of deamidation observed at basic pH.
Structural analysis of Asn325 deamidation
In contrast to HC Asn384/389, HC Asn325 was more sensitive to deamidation in slightly acidic solutions. HC Asn325 is located at a β-turn structure within the FG loop of the CH2 domain. As shown in , HC Asn325 forms hydrogen bonds that help connect the FG loop with the BC loop. Thus, HC Asn325 is buried between the FG and BC loops with a low level of solvent accessible surface area (SASA). Since water plays a critical role in the deamidation reaction,Citation7 possible correlations between HC Asn325 solvent accessibility and pH were investigated. Since IgG Fc structures reported in the PDB database were crystalized in buffers ranging from pH 4.0 to 7.0, the effect of pH on the local protein structure surrounding HC Asn325 could be evaluated by comparing the crystal structures obtained at the different pH values. To effectively compare the SASA of HC Asn325 in the different structural models, only IgG1 Fc crystal structures in the PDB with a resolution higher than 2.3 Å and clearly resolved backbone and sidechain structures in the 2Fo – Fc electron density maps were chosen for comparison.
Figure 4. pH induced conformational changes around HC Asn325 in the CH2 domain of an IgG. A) Ribbon diagram representation of the HC Asn325 structure environment (PDB: 4BYH). The hydrogen bonds are shown as yellow dashed lines. B) Plots of solvent accessible surface area (SASA) as a function of pH value. Each point represents a crystal structure model from the PDB. C) Overlay of the CH2 domains from 2DTS and 4BYH. D) Surface representation of the CH2 domains from 2DTS and 4BYH showing the SASA of HC Asn325. The sidechain N and O atoms of HC Asn325 were colored blue and the rest of the CH2 domains atoms were colored grey. Only solvent exposed sidechain N and O atoms were seen in the surface representations.
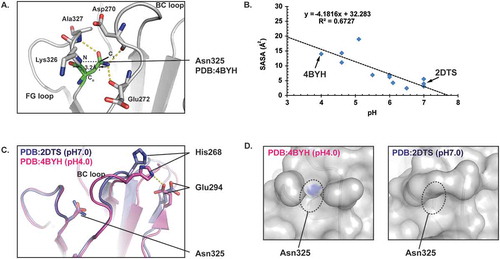
As shown in , there were no significant differences in distances between the Cγ of Asn325 and the backbone N atom of Lys326 in these Fc structural models. All distances were between 3.0 and 3.5 Å. However, there were large variations in the calculated SASA values for HC Asn325 in these structural models. As shown in and , the SASA values for HC Asn325 showed a negative correlation against the buffer pH used in crystallization. These results suggested that pH affected the local 3D structure near HC Asn325, and were consistent with the observed increase in deamidation in heat stressed samples at acidic pH.
Comparison between the PDB 4BYH and PDB 2DTS structural models further illustrated the effect of pH on the local protein conformation around HC Asn325. The crystals used for the PDB 4BYH structure model were grown at pH 4.0 and the calculated SASA value for HC Asn325 was 14.0 Å2. In contrast, the crystals used for the PDB 2DTS structure model were grown at pH 7.0 and the calculated SASA value for HC Asn325 in was only 3.9 Å2, which was about 28% of the value obtained at pH 4.0. An overlay of these two structure models revealed major conformational changes in the BC loop, which may have led to the significant differences in the SASA values (,). A comparison of these two structural models also suggested that HC His268 may help trigger the BC loop conformational change under different pH. Since the histidine sidechain imidazole ring has a pKa around 6.0, protonation of HC His268 in the 4BYH structural model at pH 4.0 may lead to the formation of a salt bridge with HC Glu294 (). In contrast, deprotonation of HC His268 at pH 7.0 could break the salt bridge in the 2DTS structural model and lead to the conformational changes in the BC loop and reduced solvent accessibility for Asn325. These results indicate that the solvent accessibility of HC Asn325 might be the major factor contributing to its low deamidation rate at neutral or basic pH.
Deamidation of Asn325 and Asn384/389 in IgG4 mAbs
IgG4 mAbs, which are one of four human IgG subclasses, share over 90% sequence identity with IgG1 mAbs in the constant region. Recent crystal structure studies of IgG4 mAbs had revealed significant conformational differences in the Fc regions between IgG1 and IgG4, which can explain their distinctive biological properties.Citation21 The three most sensitive Asn residues in the IgG1 Fc region, Asn325 and Asn384 and Asn389, are conserved in IgG4 mAbs with the same sequence motifs (N-K, N-G and N-N for Asn325, Asn384 and Asn389, respectively). To understand how the conformational changes may impact the deamidation kinetics of these three Asn residues, we quantified Asn325 and Asn384/389 deamidation levels of in five human IgG4 mAbs when incubated at 37ºC up to 90 days in acidic formulation buffer (pH 5.0 – 5.8). The deamidation rate constants were then calculated by fitting the experimental peptide mapping data with the exponential first-order kinetics model.
As shown in , the measured deamidation rate constants of Asn325 in five IgG4 mAbs were 2–3 fold lower than the rate constants for the three IgG1 mAbs. In contrast, there were no significant differences between the Asn384/389 deamidation rate constants for IgG4 and IgG1 mAbs. The higher deamidation rates for Asn325 in IgG1 mAbs were consistent with results from a recent published study, which demonstrated that the overall deamidation rates for IgG1 mAbs were faster than IgG4 mAbs with identical variable regions.Citation22
Figure 5. Comparison of Asn deamidation between IgG1 and IgG4 mAbs. A) Deamidation rate constants of Asn325 (left) and Asn384/389 (right) from five IgG4 and three IgG1 mAbs under heat stress and acidic formulation buffer storage conditions. B) Ribbon diagram representation of the crystal structure models of IgG1 and IgG4 CH2 domains. IgG1 (PDB 4BYH) and IgG4 (PDB 4C54) structures are colored by white and dark grey, respectively. A structure alignment of IgG1 and IgG4 CH2 domains is shown on the left panel. Positions of BC loops and FG loops in IgG1 and IgG4 structure models are highlighted. The right panel are zoomed-in view of Asn325 conformations in IgG1 and IgG4. The Cγ-N distances of Asn325 in IgG1 and IgG4 structure models are highlighted.
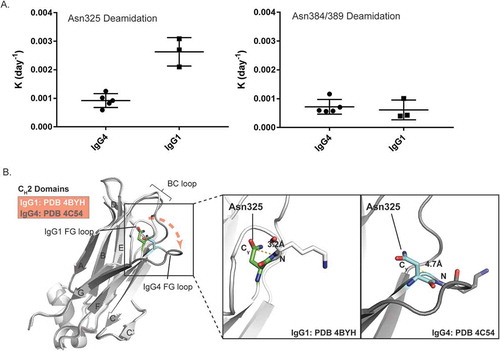
To understand the molecular basis for these different deamidation rates of Asn325 in IgG4, three IgG4 Fc crystal structure models available in the PDB database with a resolution higher than 2.4 Å were chosen for further structure analysis. Alignment of the IgG1 and IgG4 Fc structures revealed major conformational changes in the FG loop of the CH2 domain (). Compared to IgG1, the FG loop in IgG4 is further away from the BC loop, which increases the distances between Cγ of Asn325 and the backbone N atom of Lys326 from around 3.2 Å in IgG1 to 4.7 Å in IgG4 ( and ). This longer distance in IgG4 is predicted to decrease the chances for nucleophilic attack on the carbonyl carbon and would explain the slower rates of Asn325 deamidation observed in IgG4 mAbs.
Structural analysis of sensitive Asn deamidation sites in the Fv region
Deamidation of LC Asn28, LC Asn53, HC Asn55 and LC Asn93 in the Fv region was low under unstressed storage conditions, but increased significantly under high pH stress conditions. Structure analysis of those four sensitive sites revealed that the Asn residues were stabilized in unfavorable deamidation conformations by a few intra-molecular hydrogen bonds. In the cases of LC Asn53 and HC Asn55, the Cγ-N distances were >3.4 Å, which is longer than the proposed ideal conformation for deamidation. In the cases of LC-Asn28 and LC-Asn93, the Asn residues were buried and had low solvent accessibility. These analyses suggested that incubation of the mAbs under heat stress conditions at pH 8.5 might have induced conformational changes leading to a more favorable one for deamidation.
A decision tree for predicting Asn deamidation propensity
A decision tree was created to predict the deamidation propensity of Asn residues based on the observed experimental data and available structural models. There are more than 20 crystal structures of human IgG1 Fc regions in the PDB with almost identical back bone structures, except for a few differences in the flexible loop regions. One high resolution crystal structure of the IgG1 Fc region (PDB: 4W4O, resolution 1.8 Å) was chosen to calculate the structural parameters for all ten Asn residues in the Fc region. The PDB 4BYH and 1FC1 structures were used for the alternative conformations of HC Asn386 and HC Asn389. Crystal structures of mAb2 (PDB 4G3Y) and mAb5 and homology models of the mAb1, mAb3 and mAb4 Fab regions were used to calculate the structural parameters for the Asn residues in the Fv region.
As shown in , all Asn residues could be divided into four groups (Group I-IV) based on the observed deamidation rates and the three structural parameters: backbone flexibility, Cγ-N distance and solvent accessibility. These three structural parameters seemed to have a major impact on the observed deamidation rates and could be used to predict deamidation propensity of IgG1 mAbs. The propensity of Asn deamidation likely increases from group I to group IV due to increases in backbone flexibility, decreases in Cγ-N distance and increases in solvent accessibility.
Figure 6. Decision tree for predicting Asn deamidation hot spots. Three structure parameters, β-sheet structure, Cγ-N distance and SASA were used to assign Asn residues into 4 groups with increased deamidation propensities.
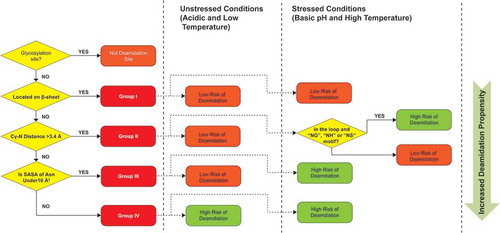
The Group I Asn residues are low risk deamidation sites under both unstressed and stressed conditions because of their relatively rigid β-sheet conformations. β-sheets are the major secondary structure component in IgG mAbs. It is stabilized by multiple hydrogen bonds between adjacent β-strands and the peptide backbone has a dihedral angle (ψ) of 135° that is far from the ideal angle (ψ) of −120° needed to form the succinimide intermediate. Both factors lead to rigid peptide geometry and inhibits deamidation reaction. Consistent with this hypothesis, there were no increases in deamidation of the β-sheets Asn residues under stressed conditions ( and ), further indicating that these are the least favorable deamidation sites in IgG1 mAbs.
Group II Asn residues are also considered to be low risk because the Cγ-N distances were too long to form a stable succinimide intermediate. Based on the empirical data and structure analysis presented in and , Asn residues with Cγ-N distance > 3.4 Å had a low deamidation propensity. The only exceptions were LC Asn53 and HC Asn55 from mAb5, which are located at flexible loop structures with a NS sequence motif, which could deamidate under high pH stress conditions.
Group III Asn residues have a Cγ-N distance (< 3.4 Å) short enough to form the succinimide intermediate, and thus could deamidate under high pH stress conditions. However, they do not deamidate at acidic pH due to low solvent accessibility (SASA < 10 Å).Citation2
Group IV Asn residues have Cγ-N distance < 3.4 Å and SASA values > 10 Å. These Asn residues are considered high risk deamidation sites under both unstressed and stressed conditions due to their ideal geometry for deamidation.
In most cases, the estimated deamidation risk derived from this decision tree matched very well to the experimental data. However, one exception is HC Asn57 from mAb2. Structure analysis suggested that this should be a high-risk residue in Group IV, but only 2% deamidation was detected in the unstressed mAb ().
To understand this discrepancy, the deposited mAb2 crystal structure (PDB: 4G3YCitation23) was examined carefully. Ramachandran plot analysis, which is used to calculate peptide ϕ and ψ angles, revealed that the backbone geometry of HC Asn57 was outside of the theoretically allowed region, which indicated that the structure model around HC Asn57 may have been built incorrectly.Citation19 As shown in , the backbone carbonyl of HC Asn57 in the original structure model did not match the calculated electron density map. The CDR-H2 loop structure model was refined by flipping the original HC Asn57 backbone carbonyl and then fitting the rest of the loop. The refined model appeared to match the electron density map much better and resulted in a peptide geometry that was within the allowed region. However, the moderate resolution (2.6 Å) of this crystal structure did not allow reliable modeling of this flexible loop. Therefore, Molecular Dynamic (MD) simulations were used to assess which of these two conformations was more stable.
Figure 7. Structural models for HC Asn57. The conformation of HC Asn57 from original crystal structure model (PDB: 4G3Y) is not energetically favorable. A) Structure overlays of CDR-H2 loops between the original crystal structure model and refined model. The electron density map (2Fo-Fc) was shown as grey mesh at a contour level of 1σ. B) Upper panel, overlays of instantaneous structures of CDR-H2 loops at 5 ns from molecular dynamic trajectories obtained. (Left) original model (Right) refined model. Lower panel, psi angels for Asn57 during the MD simulations for both original and refined structure models.
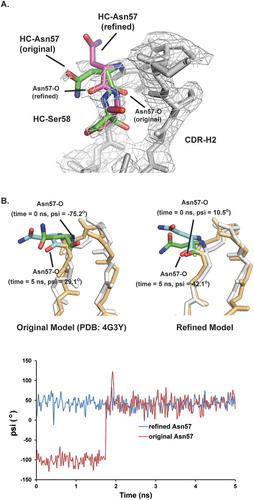
The stability of the HC Asn57 conformation was assessed by generating MD trajectories. The MD trajectories were initiated using two Fv structure models that were identical except for the conformation of the CDR-H2 loop. In the first trajectory, the conformation of CDR-H2 in the initial model was taken from the published crystal structure (4G3Y), whereas, in the second trajectory, the structure of CDR-H2 loop was taken from the refined model based on the deposited electron density map. For both starting models, trajectories lasting 5 ns were generated. As shown in , the trajectory with the refined HC Asn57 conformation was stable over the length of simulation. The psi angle of HC Asn57 oscillated around 42° for the trajectory with the refined HC Asn57 conformation. In contrast, the trajectory with the original HC Asn57 conformation was unstable. At the beginning of the simulation, the backbone carbonyl of HC Asn57 oscillated around −100°. Before the simulation time reached 2ns, the backbone carbonyl flipped positions and oscillated around 42°, which was within the same range as the refined structure model. In conclusion, the MD simulation results indicated that the refined HC Asn57 conformation model was more energetically favorable than the original model.
The HC Asn57 deamidation risk was then re-evaluated using the refined mAb2 structure. Following the decision tree, HC Asn57 was re-assigned to Group II because the Cγ-N distance increased from 2.9 Å in the original model to 4.4 Å in the refined structure model, which was outside the optimal range (3.4 Å). However, the deamidation risk for HC Asn57 is predicted to be high under stressed conditions because HC Asn57 is in a flexible loop region with NS sequence motif. Both predictions matched the experimental results ( and ). Taken together, the predicted deamidation propensities obtained from the decision tree for all Asn residues were consistent with the experimental results.
Discussion
Although the mechanism of deamidation has been well studied, a reliable method to predict Asn deamidation “hot spots” for IgG mAbs remains a challenge. As described here, correlations between the experimental deamidation results for IgG1 and IgG4 mAbs and three-dimensional protein structures indicated that the observed differences in Asn deamidation rates could be attributed to differences in the backbone flexibility, Cγ-N distance and solvent accessibility. This information was further utilized to establish a structure-based decision tree that can more accurately predict the Asn deamidation risk than using amino acid sequence motif alone. The decision tree can be utilized to predict the in vitro and in vivo stability of mAbs, or design molecules with increase stability. Although this structure-based decision tree was derived from IgG1 mAb analysis, the same principles are likely applicable to non-mAb protein therapeutics as well.
The structural analysis also helped to explain the unique deamination behavior of HC Asn325 in IgG1 mAbs. In contrast to other Asn residues, HC Asn325 was more susceptible to deamidation in acidic buffers, but remained stable at basic or neutral pH. Structural analysis indicated that deprotonation of the adjacent HC His268 at pH 7.0 and above would break the salt bridge between HC His268 and HC Glu294, which would trigger a change in the BC loop conformation and significantly reduce the solvent accessibility of HC Asn325. Comparison of IgG1 and IgG4 Fc structure models also reveals that conformational changes at the CH2 domain result in the longer Asn325 Cγ-N distance in IgG4 than that in IgG1, which would explain the slower rates of Asn325 deamidation in IgG4 mAbs.
Analysis of structural models also indicated that HC Asn389 and HC Asn394 had two distinct conformations for deamidation, with unfavorable conformations dominant under neutral or acidic conditions. This observation explained the low deamidation rates for these two residues under neutral or acidic conditions, and the biphasic deamidation curves observed in basic solutions.
Materials and methods
Preparation of stressed mAbs
Unstressed mAb samples were stored in the formulation buffer, pH 5.0 ~ 5.8, at −70ºC. For the heat stress studies, samples were incubated at 37°C for up to 180 days. For the high pH stress studies, samples were dialyzed to pH 8.5 phosphate buffer and incubated at 37°C for up to 30 days. Stressed samples were aliquoted out at individual time points and dialyzed back to their original formulation buffer and store at −70ºC prior to analysis.
Lys-C peptide mapping
0.2 mg mAb sample was denatured with 150 μL of 6 M guanidine hydrochloride, 50 mM Tris-HCl, 5 mM ethylenediaminetetraacetic acid, pH 8.0. Denatured protein was reduced with 1.5 μL of 1.0 M dithiothreitol (DTT) at 37°C for 1 hour and alkylated with 3.0 μL of 1 M sodium iodoacetamide at room temperature in the darkness for 1 hour. The reaction was quenched by adding 1.0 μL of 1.0 M DTT. The reduced and alkylated sample was then diluted with 750 μL of 50 mM Tris-HCl, pH 8.0 and digested with Lys-C at an enzyme/protein ratio of 1:25 (w/w) for 4 hours at 37°C. The reaction was quenched by adding 5 μL of trifluoroacetic acid (TFA), and the resultant peptides were separated by reverse-phase HPLC using a narrow bore C18 column (Vydac, 218TP5215, 2.1 mm x 150 mm) and a gradient of acetonitrile/water/0.1% TFA. LC/MS/MS analysis was performed using an Agilent 1100 HPLC coupled on-line with Orbitrap XL mass spectrometer (Thermo Electron) with an electrospray source. Deamidated was quantified by extracted ion current chromatograms, and percentage deamidation was expressed as the levels of modified peptides as percentages of total peptide peak areas (native + modified peptides).
Deamidation kinetics analysis
Observed deamidation rates followed exponential first-order kinetics as described previously.Citation20,Citation21 The observed first-order rate constants (K) were calculated by nonlinear least-squares regression analysis using the software Graphpad Prizm. The following equation was used for the fitting:
where A was the percentage of Asn deamidation at time t, A0 was the initial percentage of Asn deamidation at Time 0, A∞ was the maximal percentage of Asn deamidation. A∞ was set at 100 for all Asn residues except Asn384/389, which was set at 60.
Structure homology modeling
The homology structure models for the Fv region were generated and optimized by Discovery Studio, version 4.0 (Accelrys Software) “Model antibody”. The templates used for structure modeling were chosen based on sequence alignments. Templates for light, heavy and light-heavy interface framework were chosen independently.
Molecular dynamics simulation
The molecular dynamic simulations were performed with Discovery Studio, version 4.0. The starting structure for mAb2 was taken from Protein Data Bank (PDB) entry 4G3Y,Citation22 with all solvent molecules removed. Based on the deposited electron density maps, a refined model was built by flipping the original Asn57 backbone conformation. Hydrogen atoms were added to the models automatically, using Discovery Studio tool. All simulations were performed in 0.15 M NaCl and with a zero net charge of the system. For the imposition of periodic boundary conditions, protein models were centered in a rhombic dodecahedral box with a minimum distance to the edge of 10 Å. System energies were minimized using the steepest descent method. Equilibration was then conducted in two steps, with positional restraints applied to all non-hydrogen protein atoms. Unrestrained production trajectories were then generated for 5 ns, using the same NPT ensemble conditions. Three replicates of each simulation were generated using different sets of random initial velocities to start the NVT equilibration step of each replicate. Coordinates and energies were saved every 10 ps for analysis.
Abbreviations
| Asn | = | asparagine |
| Asp | = | aspartate |
| CDR | = | complementary-determining regions |
| DTT | = | dithiothreitol |
| Fv | = | fragment variable |
| HC | = | heavy chain |
| isoAsp | = | isoaspartate |
| LC/MS | = | liquid chromatography/mass spectrometry |
| LC | = | light chain |
| mAbs | = | monoclonal antibodies |
| MD | = | Molecular Dynamic |
| PDB | = | Protein Database Bank |
| PK | = | pharmacokinetics |
| SASA | = | solvent accessible surface area |
| TFA | = | trifluoroacetic acid |
Supplemental Material
Download MS Word (30.4 KB)Acknowledgments
We would like to thank Dr. Mehul Patel for his continuing support of exploring novel technologies for biopharmaceutical development, Dr. Jinquan Luo and Dr. Gary Gilliland for their support on the structural analysis, and Dr. Michael Nedved for many helpful discussions.
Disclosure statement
No potential conflict of interest was reported by the authors.
Supplementary data
Supplemental data for this article can be accessed here.
Additional information
Funding
References
- Haberger M, Bomans K, Diepold K, Hook M, Gassner J, Schlothauer T, Zwick A, Spick C, Kepert JF, Hienz B, et al. Assessment of chemical modifications of sites in the CDRs of recombinant antibodies: susceptibility vs. functionality of critical quality attributes. MAbs. 2014;6:327–339. doi:10.4161/mabs.27876.
- Huang L, Lu J, Wroblewski VJ, Beals JM, Riggin RM. In vivo deamidation characterization of monoclonal antibody by LC/MS/MS. Anal Chem. 2005;77:1432–1439. doi:10.1021/ac0494174.
- Yan B, Steen S, Hambly D, Valliere-Douglass J, Vanden Bos T, Smallwood S, Yates Z, Arroll T, Han Y, Gadgil H, et al. Succinimide formation at Asn 55 in the complementarity determining region of a recombinant monoclonal antibody IgG1 heavy chain. J Pharm Sci. 2009;98:3509–3521. doi:10.1002/jps.21655.
- Harris RJ, Kabakoff B, Macchi FD, Shen FJ, Kwong M, Andya JD, Shire SJ, Bjork N, Totpal K, Chen AB. Identification of multiple sources of charge heterogeneity in a recombinant antibody. J Chromatogr B Biomed Sci Appl. 752;2001:233–245.
- Bumbaca Yadav D, Sharma VK, Boswell CA, Hotzel I, Tesar D, Shang Y, Ying Y, Fischer SK, Grogan JL, Chiang EY, et al. Evaluating the use of antibody variable region (Fv) charge as a risk assessment tool for predicting typical cynomolgus monkey pharmacokinetics. J Biol Chem. 2015;290:29732–29741. doi:10.1074/jbc.M115.692434.
- Schoch A, Kettenberger H, Mundigl O, Winter G, Engert J, Heinrich J, Emrich T. Charge-mediated influence of the antibody variable domain on FcRn-dependent pharmacokinetics. Proc Natl Acad Sci USA. 2015;112:5997–6002. doi:10.1073/pnas.1408766112.
- Geiger T, Clarke S. Deamidation, isomerization, and racemization at asparaginyl and aspartyl residues in peptides. Succinimide-linked reactions that contribute to protein degradation. J Biol Chem. 262;1987:785–794.
- Stephenson RC, Clarke S. Succinimide formation from aspartyl and asparaginyl peptides as a model for the spontaneous degradation of proteins. J Biol Chem. 264;1989:6164–6170.
- Xie M, Schowen RL. Secondary structure and protein deamidation. J Pharm Sci. 1999;88:8–13. doi:10.1021/js9802493.
- Chu GC, Chelius D, Xiao G, Khor HK, Coulibaly S, Bondarenko PV. Accumulation of succinimide in a recombinant monoclonal antibody in mildly acidic buffers under elevated temperatures. Pharm Res. 2007;24:1145–1156. doi:10.1007/s11095-007-9241-4.
- Robinson NE, Robinson AB. Prediction of primary structure deamidation rates of asparaginyl and glutaminyl peptides through steric and catalytic effects. J Pept Res. 2004;63:437–448. doi:10.1111/j.1399-3011.2004.00148.x.
- Robinson NE, Robinson AB. Molecular clocks. Proc Natl Acad Sci USA. 2001;98:944–949. doi:10.1073/pnas.98.3.944.
- Xie M, Shahrokh Z, Kadkhodayan M, Henzel WJ, Powell MF, Borchardt RT, Schowen RL. Asparagine deamidation in recombinant human lymphotoxin: hindrance by three-dimensional structures. J Pharm Sci. 2003;92:869–880. doi:10.1002/jps.10342.
- Kosky AA, Razzaq UO, Treuheit MJ, Brems DN. The effects of alpha-helix on the stability of Asn residues: deamidation rates in peptides of varying helicity. Protein Sci. 1999;8:2519–2523. doi:10.1110/ps.8.11.2519.
- Robinson NE, Robinson AB. Prediction of protein deamidation rates from primary and three-dimensional structure. Proc Natl Acad Sci USA. 2001;98:4367–4372. doi:10.1073/pnas.071066498.
- Sydow JF, Lipsmeier F, Larraillet V, Hilger M, Mautz B, Molhoj M, Kuentzer J, Klostermann S, Schoch J, Voelger HR, et al. Structure-based prediction of asparagine and aspartate degradation sites in antibody variable regions. PLoS One. 2014;9:e100736. doi:10.1371/journal.pone.0100736.
- Capasso S. Estimation of the deamidation rate of asparagine side chains. J Pept Res. 55;2000:224–229.
- Peters B, Trout BL. Asparagine deamidation: pH-dependent mechanism from density functional theory. Biochemistry. 2006;45:5384–5392. doi:10.1021/bi052438n.
- Chelius D, Rehder DS, Bondarenko PV. Identification and characterization of deamidation sites in the conserved regions of human immunoglobulin gamma antibodies. Anal Chem. 2005;77:6004–6011. doi:10.1021/ac050672d.
- Zhang YT, Hu J, Pace AL, Wong R, Wang YJ, Kao YH. Characterization of asparagine 330 deamidation in an Fc-fragment of IgG1 using cation exchange chromatography and peptide mapping. J Chromatogr B Analyt Technol Biomed Life Sci. 2014;965:65–71. doi:10.1016/j.jchromb.2014.06.018.
- Davies AM, Sutton BJ. Human IgG4: a structural perspective. Immunol Rev. 2015;268:139–159. doi:10.1111/imr.12349.
- Neergaard MS, Nielsen AD, Parshad H, Van De Weert M. Stability of monoclonal antibodies at high-concentration: head-to-head comparison of the IgG1 and IgG4 subclass. J Pharm Sci. 2014;103:115–127. doi:10.1002/jps.23788.
- Liang S, Dai J, Hou S, Su L, Zhang D, Guo H, Hu S, Wang H, Rao Z, Guo Y, et al. Structural basis for treating tumor necrosis factor alpha (TNFalpha)-associated diseases with the therapeutic antibody infliximab. J Biol Chem. 2013;288:13799–13807. doi:10.1074/jbc.M112.433961.