
 ?Mathematical formulae have been encoded as MathML and are displayed in this HTML version using MathJax in order to improve their display. Uncheck the box to turn MathJax off. This feature requires Javascript. Click on a formula to zoom.
ABSTRACT
T-cell redirecting bispecific antibodies (bsAbs) or antibody-derived agents that combine tumor antigen recognition with CD3-mediated T cell recruitment are highly potent tumor-killing molecules. Despite the tremendous progress achieved in the last decade, development of such bsAbs still faces many challenges. This work aimed to develop a mechanism-based pharmacokinetic/pharmacodynamic (PK/PD) modeling framework that can be used to assist the development of T-cell redirecting bsAbs. A Target cell-Biologics-Effector cell (TBE) complex-based cell killing model was developed using in vitro and in vivo data, which incorporates information on binding affinities of bsAbs to CD3 and target receptors, expression levels of CD3 and target receptors, concentrations of effector and target cells, as well as respective physiological parameters. This TBE model can simultaneously evaluate the effect of multiple system-specific and drug-specific factors on the T-cell redirecting bsAb exposure–response relationship on a physiological basis; it reasonably captured multiple reported in vitro cytotoxicity data, and successfully predicted the effect of some key factors on in vitro cytotoxicity assays and the efficacious dose of blinatumomab in humans. The mechanistic nature of this model uniquely positions it as a knowledge-based platform that can be readily expanded to guide target selection, drug design, candidate selection and clinical dosing regimen projection, and thus support the overall discovery and development of T-cell redirecting bsAbs.
Introduction
Treating cancer by harnessing the potent tumor-killing capacity of T cells is one of the most exciting fields of immune oncology. The potential for bispecific antibodies (bsAbs) or antibody-derived agents to bring cytotoxic T cells in close proximity to malignant tumors has led to the development of T-cell redirecting bsAbs. Unlike conventional anti-tumor drugs used in chemotherapy or targeted therapy where the drugs are active moieties,Citation1 T-cell redirecting bsAbs themselves usually have a minimal tumor killing effect.Citation2,Citation3 Although varying substantially in protein format and architecture, all T-cell redirecting bsAbs work as adaptor molecules that bring effector cells (T cells) and target cells (tumor cells) close to each other by forming Target cell-Biologics-Effector cell (TBE) complexes. A sufficient amount of these complexes would induce the formation of a transient cytolytic synapse between the engaged effector cells and the target cells, which activates the engaged effector cell (e.g., cytotoxic T cells) in a T cell receptor-independent manner to induce membrane perforation and then granzyme-mediated apoptotic death of the engaged target cells (e.g., tumor cells) (Figure 1).Citation4–Citation6 The clinical success of blinatumomab (Blincyto®), a bispecific T-cell engager (BiTE®) directed against CD19 for B cell malignancies, has led to a substantial increase in the number of BiTEs and other T-cell redirecting bsAbs in clinical development to treat both hematological malignancies and solid tumors.Citation4,Citation5 Currently, there are more than 40 others in clinical development and hundreds more in discovery and preclinical development.Citation6
Despite the progress achieved in the past two decades, the development of T-cell redirecting bsAbs still faces considerable challenges. These bsAbs are designed to efficiently kill tumor cells while minimizing cytotoxicity to normal tissues. It is critical to identify suitable target receptors on tumor cells to achieve this goal. Ideally, tumor target receptors should be truly tumor-specific, i.e., abundantly and exclusively expressed on tumor cells. However, other than a few B cell tumor-associated antigens that are specific for B-cell lineage, receptors that are truly tumor specific are extremely rare. Many current T cell-redirecting bsAbs in development target receptors that are ‘overexpressed’ on tumor cells, but are expressed at a relatively lower levels on certain normal tissues, e.g., CD33, CD123, EGFR.Citation7–Citation9 Designing bsAbs against such receptors to selectively kill tumor cells while exhibiting limited or no cytotoxicity to non-targeted tissues with lower levels of target receptor expression remains a difficult endeavor.Citation10 In addition, the disposition of bsAbs at tumor sites of action, the numbers of tumor infiltrating T cells, the heterogeneous distribution of effector and target cells, and the possible immunosuppressive tumor microenvironment should all be taken into account when designing T-cell redirecting bsAbs, especially when treating solid tumors.Citation11
With advances in protein engineering, researchers have developed many new bsAb platforms that vary in size, structure, half-life, biodistribution, and valency to achieve the desired target product profiles.Citation4,Citation12 However, the activity of T-cell redirecting bsAbs is dependent on multiple interrelated factors, and the identification of the desired target product profiles remains a difficult task; past experience had shown that engineered bsAbs do not always result in enhanced anti-tumor activity or improved therapeutic windows.Citation13,Citation14 Factors to consider when optimizing the design and dosing regimen of T-cell redirecting bsAbs include the protein scaffold, binding affinities to receptors on effector cells (e.g., CD3) and target cells (e.g., CD19), selection of binding epitopes, the drug concentrations, receptor expression levels on effector and target cells, and the dynamic interplay between T-cell redirecting bsAbs and other forms of treatment. A holistic approach must consider all of the above factors, as well as the in vivo pharmacokinetic (PK) and pharmacodynamic (PD) characteristics of the bsAbs.Citation11
The complex mechanism of action for T-cell redirecting bsAbs demands an integrated analysis that can evaluate the effect of various critical physiological and pathological factors on T-cell redirecting bsAbs.Citation15 Mechanism-based PK/PD modeling and simulation approaches can incorporate and systematically analyze in vitro, preclinical, and clinical data to simultaneously assess the individual effect of, as well as the dynamic interactions among, various factors. Recently, three mechanistic PK/PD modeling analyses for bispecific biotherapeutics have been published to guide rational translational research and clinical study design for T-cell redirecting bsAbs.Citation16–Citation18 All three of these model analyses explored strategies to predict and translate in vivo pharmacodynamic and toxic effects (i.e., cytokine release) using in vitro data for T-cell redirecting bsAbs and physiological system measurements, and accounted for the concentration of the tri-molecular synapse between bsAb, T cell, and target tumor cell. These analyses pioneered the use of mechanism-based PK/PD modeling to characterize the critical steps that govern the pharmacological effects mediated by T-cell redirecting bsAbs. However, the analyses focused on characterizing the in vitro and in vivo data from one or two compounds, and did not provide a systemic evaluation of the impact of multiple critical factors that affect T-cell redirecting bsAb functioning, such as the desired protein architecture, optimal CD3 and target receptor binding affinities, target receptor expression levels, and effector-to-target (E:T) cell ratios, which should all be considered when formulating practical guidance on designing T-cell redirecting bsAbs.
The objective of this work was to develop a more comprehensive mechanism-based PK/PD model that uses data from in vitro, pre-clinical, and clinical studies to simultaneously evaluate the effect of various system-specific and drug-specific factors on the exposure–response relationship of T-cell redirecting bsAbs on a physiological basis. This proposed mechanism-based model, which goes beyond the conventional PK/PD approach, incorporated information on both system-specific parameters (e.g., CD3 and target receptor expression levels, T cell and target cell concentration, and T cell killing associated parameters, etc.) and drug-specific parameters (e.g., intrinsic engagement potency value of TBE complex, binding affinities of the bsAbs to both CD3 and target cell receptors, etc.). The model well captured the reported in vitro cytotoxicity data for multiple T-cell redirecting bsAbs under different experimental conditions, and predicted the effect of several key factors in in vitro cytotoxicity assays reasonably well.
The ability of this mechanism-based model to differentiate between system-specific and drug-specific parameters provides a method for the extrapolation of drug effects from in vitro and preclinical models to clinical systems. The model-predicted blinatumomab effects in humans agreed well with the clinical observations of blinatumomab, supporting the predictive value of the model. The ultimate goal of this modeling effort is to develop an integrated and knowledge-based platform that can guide the rational design and development of novel T-cell redirecting bsAbs.
Results
Development of the TBE complex-based cell killing model
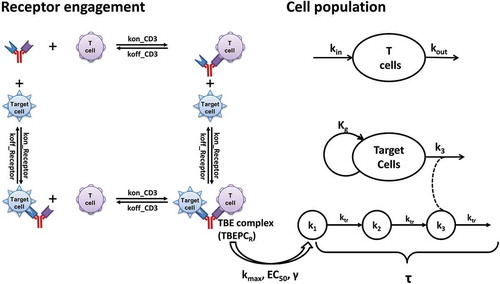
A schematic of the proposed TBE complex-based cell killing model (TBE model) is presented in . The TBE model was developed based on the known mechanisms of action for T-cell redirecting bsAbs, i.e., formation of the tri-molecular TBE complexes on the surfaces of target and effector cells drives the elimination of target (tumor) cells and other downstream PD effects. The CD3 and target receptor engagement processes were treated as independent binding events and they were determined by the expression levels of CD3 on T cells (DensityCD3), target receptor on target cells (DensityReceptor), and the binding affinities of bsAbs to both receptors (kon_CD3, koff_CD3, kon_Receptor, koff_Receptor). The killing of target cells is governed by the number of TBE complexes per target cell (TBEPC), the intrinsic engagement potency of the TBE complex (e.g., EC50, γ), and the killing potency of T cells (e.g., kmax, τ). Taken together, the killing of target cells is determined by concentrations of TBEPC, the ability of bsAbs to trigger activation of the engaged effector cells, and the cytotoxic activity of the engaged effector cells themselves. Under in vitro experimental conditions or in vivo scenarios, the observed elimination of target cells is also affected by the dynamics of effector cells (e.g., kin, kout, concentration of effector cells) and target cells (e.g., kg, concentration of target cells) and the E:T ratios. In order to compare T-cell redirecting bsAb-mediated serial killing of target cells by T cells across different experimental conditions, a reference system, where the concentrations of effector cells and target cells were both defined as 1000 cells per µL, was used to derive normalized TBEPCR and τreference values.
Figure 1. The structure of the TBE complex-based cell killing model, describing T cell redirecting bispecific agent (bsAb)-induced redirection of effector cells (T cells) for the elimination of target cells.
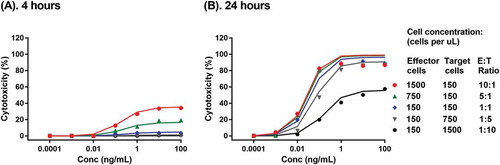
The TBE model was first developed with a set of published in vitro cytotoxicity data of blinatumomab across a wide range of T cell and Nalm-6 target cell concentrations and E:T ratios at two time points.Citation19 The proposed TBE model was able to simultaneously capture the reported blinatumomab-mediated lysis of CD19+ Nalm-6 cell line by a human T cell-clone at different E:T ratios (10:1 to 1:10) at 4 hr and 24 hr, respectively (). The estimated model parameters are summarized in . The model estimated maximum target cell killing rate constant of T cells (kmax) is 0.208 1/hour. The estimated EC50 is at 0.0395 TBE complex per tumor cell (TBEPCR) and the estimated γ value is at 0.953. The low EC50 value likely reflects the extremely high potency of blinatumomab.Citation19 Of note, TBEPCR was calculated based on the experimentally determined expression values of T cell CD3 and Nalm-6 cell CD19 and the reported blinatumomab binding affinities to CD3 and CD19 on cell surfaces following 45-minute incubations;Citation22,Citation23 any potential divergence between the assay measurements and true values of receptor density and binding affinity would affect the derivation of TBEPCR values and the estimation of EC50. The baseline killing in the absence of the drug (Base) was fixed at 0, based on the observed data.Citation19 Multiple in vitro cytotoxicity assays have showed that, within a reasonable range of E:T ratios (i.e., ≥ 1:80), the effector cells can kill nearly all target cells after a sufficient incubation period.Citation3,Citation19,Citation24 Accordingly, Emax was fixed at 100% in all TBE model analyses. The model-estimated transit time for observable cytotoxicity in the reference system (τreference) was 3.49 hours. Under in vitro experimental conditions, τ was further affected by the differences in effector cell concentrations between the experimental system and the reference system with an exponential constant kτ1 at −0.978, as well as the differences in concentrations between the target cells and effectors cells in the experimental system with an exponential constant kτ2 at 0.13 (see Methods). Based on the reported doubling time of leukemia cells in log phase culture at approximately 1.5 days,Citation20 kg was fixed at 0.02 1/hr for all in vitro cytotoxicity data when target cell growth information was unavailable. Based on the literature reported T cell turnover rate at 0.02 1/day,Citation21 kout of effectors cells was fixed as 0.000833 1/hour.
Table 1. Model estimated parameters for TBE model with in vitro cytotoxicity data of blinatumomab on Nalm-6 cells.Citation19
Figure 2. Development of the TBE model with blinatumomab in vitro cytotoxicity data on CD19+ Nalm-6 cells. Symbols and lines with corresponding color represent observed and model predicted Nalm-6 target cell depletion profiles by a human T cell-clone at different effector-to-target ratios in the presence of blinatumomab after 4 hours (a) and 24 hours (b) of incubation.Citation19
Similarly, the proposed TBE model was able to simultaneously capture the reported in vitro cytotoxicity time course of an extended half-life Dual Affinity Re-Targeting scaffold bispecific directed against CD3 and P-cadherin (P-cadherin LP-DART)-mediated P-cadherin+ HCT116 tumor cell killing by peripheral blood mononuclear cells (PBMCs) at various E:T ratios,Citation16 suggesting broader applications of the proposed TBE model. Results of the P-cadherin LP-DART modeling are provided in Supplement Materials (Table S1 and Figure S1). For this particular set of data, the developed model identified τreference to be 25.8 hours. Under the experimental conditions, τ was affected by the differences in effector cell concentrations between the experimental system and the reference system by an exponential constant kτ1 of −2.48, as well as by the differences in concentrations between the target cells and effectors cells in the experimental system by an exponential constant kτ2 of 0.192. However, EC50 and γ could not be identified with this set of data, possibly due to the lack of early time point data (the earliest time point available was 24 hours). The model estimated maximum target cell elimination rate constant of T cells was 0.179 1/hour/TBE complex.
Evaluation of TBE model on characterizing the effects of key determining factors
To evaluate whether the developed TBE complex-based cell killing model can characterize and predict the effect of key determining factors for T-cell redirecting bsAb-mediated target cell killing, independent in vitro cytotoxicity datasets under different conditions were examined.
Effect of target receptor expression
The ability of the TBE model to characterize and predict the effect of target cell receptor expression levels was first evaluated using the in vitro cytotoxicity data of AMG 330 ( and ), a BiTE molecule targeting CD33 and CD3, on depletion of engineered OCI-AML3 target cells with various CD33 target receptor expression levels.Citation3 This set of data was ideal for evaluating the effect of target receptor density because the target cells with various levels of CD33 expression were engineered from the same parental cell line, and thus should have similar sensitivity to T cell-mediated killing. For the TBE model with AMG 330, T cell-mediated killing associated parameters (i.e., kmax), the established relationship between τ and E:T ratio and T cell concentrations (i.e., kτ1, kτ2) were fixed to the values derived from the blinatumomab model with Nalm-6 target cells (). EC50 and τReference, the model parameters associated with the AMG330 and TBE complex, were re-estimated using AMG 330 in vitro cytotoxicity data with high CD33 expressing (10,000 receptors per cell) OCI-AML3 target cells at different E:T ratios (solid lines); these values were determined to be 0.0043 complex per cell and 24.2 hours, respectively (Table S2). The γ value was fixed at 5 to best characterize the observed steep dose-response relationship of the in vitro cytotoxicity data (Table S2).
Figure 3. Evaluation by the TBE model on characterizing the impact of key determining factors. The impact of target receptor expression level was evaluated with cytotoxicity profiles of OCI-AML3 target cells with different CD33 target receptor expression levels (500 – 10,000 receptors per cell) by T cells from healthy donors at E:T ratios of 10: 1 (a) and 1:1 (b), in the presence of AMG 330 after 48 hours of incubation.Citation3 The impact of binding affinity was evaluated with cytotoxicity profiles of FLT3+ REH cells by CD8 + T cells in the presence of FLT3xCD3 bsAbs with differentiated binding affinity to FLT3 after 8 hours of incubation (c),Citation25 and that of CD20 + B cells by CD3 + T cells in the presence of CD20xCD3 bsAbs with differentiated binding affinity to CD3 after 24 hours of incubation (d).Citation26 The impact of effector-to-target (E:T) ratio was evaluated with CD19+ Blin-1 cell cytotoxicity profiles by PBLs in the presence of blinatumomab after 4 hours of incubation (e),Citation27 and CD19+ Nalm-6 cell cytotoxicity profiles by purified human peripheral T cells in the presence blinatumomab after 24 hours of incubation (f).Citation23 Symbols represent observed in vitro cytotoxicity data; solid lines with corresponding color represent model estimation results; dashed lines with corresponding color represent model simulation results.
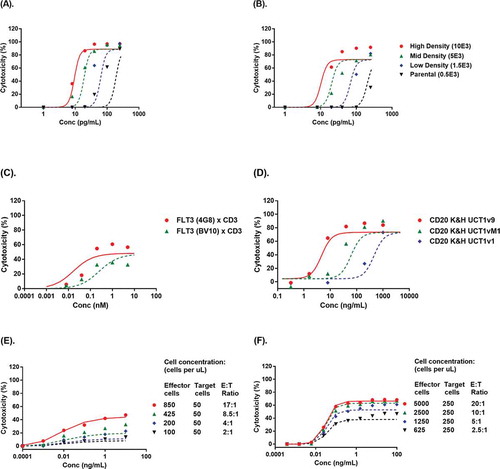
The established TBE model was subsequently used to predict the effect of CD33 receptor density on AMG 330 in vitro cytotoxicity. The CD33 receptor densities of OCI-AML3 cells transfected with medium and low levels of CD33 (5,000 and 1,500 CD33 receptors per cell, respectively) and of the parental OCI-AML3 target cell (500 CD33 receptors per cell) were used to simulate AMG 330 in vitro cytotoxicity at E:T ratios of 10:1 and 1:1, respectively. As shown in and (dashed lines), the model simulated in vitro cytotoxicity profiles agreed reasonably well with observed data.
Effect of target binding affinity
The ability of the TBE model to characterize and predict the effect of target binding affinity was evaluated using reported in vitro cytotoxicity data from anti-FLT3xCD3 bsAbs with differentiated binding affinities to FLT3 on the target cells Citation25 and anti-CD20xCD3 bsAbs with differentiated binding affinities to CD3 on the T cells.Citation26
The TBE model for anti-FLT3xCD3 bsAbs () was first established by fitting the reported in vitro cytotoxicity data with a high FLT3 affinity anti-FLT3 (4G8)xCD3 bsAb (KDFLT3 = 2 nM) (solid line). The model estimated EC50 and τReference to be 2.88 complexes per target cell and 5.78 hours, respectively (Table S2); all other parameters were fixed using the values established with blinatumomab in vitro cytotoxicity data with Nalm-6 cells(). The established model was then used to simulate the in vitro cytotoxicity of anti-FLT3 (BV10)xCD3 bsAb at a lower FLT3 binding affinity (KDFLT3 = 30 nM) for the same target cell. The results showed that the model simulation (dashed lines) agreed reasonably well with observed data.Citation25
Using the same strategy, the TBE model for anti-CD20xCD3 bsAbs ( and Table S2) was first established using an anti-CD20xCD3 bsAb with higher CD3 binding affinity (KDCD3 = 3 nM) (solid line), and then was used to simulate the in vitro cytotoxicity profiles of anti-CD20xCD3 bsAbs with lower CD3 binding affinities: CD20 K&H UCT1vM1 (KDCD3 = 40 nM) and CD20 K&H UCT1v1 (KDCD3 = 300 nM). The results showed that the model simulation (dashed lines) agreed reasonably well with observed data.Citation26
Effect of effector-to-target (E:T) ratios
The ability of the TBE model to characterize and predict the effect of E:T ratios and T cell concentrations was also evaluated using two sets of reported blinatumomab in vitro cytotoxicity data at various E:T ratios.Citation23,Citation27,Citation28 The established relationships between τ and T cell concentration and τ and E:T ratio were kept the same as those derived above using blinatumomab in vitro cytotoxicity data with human T cell clones and Nalm-6 target cells (). Since the sources of effector cells in these two datasets differed (human peripheral blood lymphocytes (PBLs) or purified human T cells vs. human T cell clone), the other parameters (e.g., kmax, EC50, γ and τreference) were re-estimated. The TBE model was first established with human PBLs-mediated Blin-1 cell depletion profiles after 4 hours of incubation with blinatumomab at the highest tested E:T ratio of 17:1 (, solid line). The model was then used to simulate the cytotoxicity profiles of Blin-1 cells at lower E:T ratios (from 2:1 to 8.5:1) from the same assay.Citation27 The simulations agreed reasonably well with the observed data ( dashed lines). The model estimated EC50, γ, kmax, and τreference values are summarized in Table S2. Similarly, the TBE model was first established with purified human T cell-mediated Nalm-6 cell depletion profiles after 24 hours of incubation with blinatumomab () at the highest tested E:T ratio of 20:1 (solid line), and the model was then used to simulate the cytotoxicity profiles Nalm-6 cells at lower E:T ratios (e.g., 2.5:1 to 10:1) from the same assay.Citation23 The results showed that the simulations (dashed lines) agreed reasonably well with the observed data. The model estimated EC50, γ, kmax, and τreference values are also summarized in Table S2.
Model application in design of T-cell redirecting bsAbs
A common question raised during the development of T-cell redirecting bsAbs is how to determine the desired CD3/target binding affinities for a given therapeutic target. To address this question, the target characteristics and intrinsic engagement potency of the drug molecule must be considered. The results above showed that the developed TBE model can quantitatively capture and predict the effect of target receptor density and CD3/target binding affinities on the activity of T-cell redirecting bsAbs. Therefore, the model can be used to assist the design of T-cell redirecting bsAbs by providing an integrated analysis of the key factors that may affect the killing potency of bsAbs. A sensitivity analysis of TBE complex formation on each target cell in a reference system (TBEPCR) () and the resultant relative target cell killing potency of T cells (represented by kel/kmax) () was conducted. The current sensitivity analysis focused on the effect of target receptor affinity, and the binding affinity of the CD3 binding arm (KD_CD3) was fixed at 15 nM for both bsAbs. If we fix the target receptor binding affinity and then vary the CD3 binding affinity, a very similar heatmap can be generated.
Figure 4. Sensitivity analysis for the impact of BsAb Concentration and Target Binding Affinity on the formation of TBE complex per target cell, expressed as TBEPCR (a–b), and relative target cell killing potency of T cells, expressed as kel/kmax (c–f). The top panel (a, c, e) shows the scenario with high target receptor expression (20,000 receptors per target cell) and the bottom panel (b, d, f) shows the scenario of low target receptor expression (2,000 receptors per target cell). kel/kmax was assessed using bsAbs with either high (EC50_A = 0.1 TBEPCR), (c-d) or low (EC50_B = 5 TBEPCR), (e-f) intrinsic engagement potencies. In (a) and (b), the curved solid and dashed lines stand for 0.1 and 5 TBEPCR, respectively. The vertical dotted line corresponds to BsAb concentration (Conc.) at 15 nM, which equals the KDE to CD3 used for this simulation.
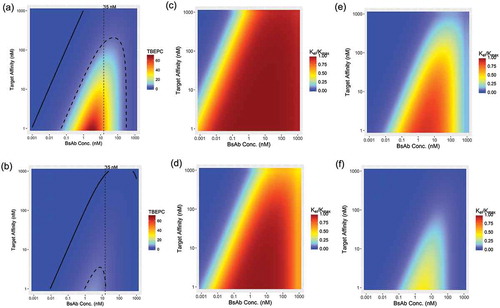
In , the sensitivity analysis results are depicted as heatmaps of model-predicted TBEPCR as a function of bsAb concentration (x-axis) and target receptor binding affinity (KDT, y-axis), generated under the assumption that the target receptor expression level is at 20,000 receptors per cell. Not surprisingly, at any given bsAb concentration, higher binding affinities (lower KDT values) are associated with higher TBE complex levels. Interestingly, at any given KDT, the TBE complex level first increases with bsAb concentrations, and then begins to plateau when the concentration of bsAbs start to approach the KD values of the arm with higher binding affinity – either KDT to the target receptor or KDE to CD3 (which is fixed at 15 nM in this simulation); the TBE complex level then begins to decline rapidly when the concentrations of bsAbs exceed the KD values of the arm with lower binding affinity. The decrease in TBE complex levels at high drug concentrations is due to the shift of binding preference from bivalent binding to monovalent binding.Citation29 This bell-shaped TBEPCR profile prediction is consistent with what was observed with anti-Her2xCD3 bsAb, where decreased bivalent co-binding was indeed observed at higher bsAb concentrations.Citation30 A similar heatmap of TBEPCR profiles was generated with the target receptor expression level set at 2,000 receptors per cell (). Identical trends of TBE complex formation are shown, except that the absolute TBEPCR levels were significantly lower on target cells with low receptor expression levels (), and the magnitude of difference was proportional to the receptor density.
Importantly, higher TBE complex levels do not necessarily translate to increased target cell killing (kel) because, in addition to TBE complex levels (TBEPCR), kel is also driven by the intrinsic engagement potency of the bsAb, as manifested by EC50, i.e., kel = (kmax x TBEPCRγ)/(EC50γ+ TBEPCRγ). In other words, the desired target receptor binding affinity, or the desired levels of TBEPCR, also depends on the potency of the bsAb. For simulation purpose, two hypothetical bsAbs with a 50-fold difference in intrinsic engagement potency (EC50 = 0.1 or 5 TBEPCR, γ = 1 for both cases) were used, based on the potency of reported bsAbs in literature.Citation31 Heatmaps of model-predicted relative target cell killing potency (kel/kmax) as a function of bsAb concentration and target binding affinity resultant are shown in , respectively. The model simulation results showed that when a bsAb has high intrinsic engagement potency (EC50 = 0.1 TBEPCR) and is against a highly-expressed target on target cells (receptor density = 20,000 receptors per cell), the near maximum target killing strengths of T cells (kel/kmax> 95%) can be achieved at even low target binding affinities (e.g., 1,000 nM) (). In this scenario, kel/kmax at higher bsAb concentrations (i.e., ≥ KD value of the lower affinity binding arm) does not decrease significantly () because the corresponding TBCPCR levels remain significantly higher than EC50. However, a bsAb with high intrinsic engagement potency (EC50 = 0.1 TBEPCR) would exhibit weaker killing potency against a lower expressed target on target cells (receptor density = 2,000 receptors per cell), and kel/kmax would decrease at higher bsAb concentrations (i.e., ≥ KD value of the lower affinity binding arm) (). The desired target binding affinity for target cells expressing lower levels of target receptors () would be higher (i.e., lower KD values) than that for cells expressing higher levels of target receptors (). For example, as depicted in , if KDT is > 100 nM, then the bsAb cannot stimulate the maximum kel/kmax at any drug concentration. Similarly, it was shown that bsAbs with lower intrinsic engagement potency (EC50 = 5 TBEPCR) need a relatively high target receptor binding affinity (i.e., KDT < 10 nM) to achieve the full target killing strength of T cells (kel/kmax> 95%), even for target cells that express higher levels of target receptors (receptor density = 20,000 receptors per cell, ). Furthermore, the concentration range associated with maximum kel/kmax is also much narrower (e.g., 1 – 10 nM) under such condition () compared to that of the high potency bsAbs (). On the other hand, the low potency bsAb (EC50 = 5 TBEPCR) was not potent enough to initiate > 50% kel/kmax on lower expressing target cells (receptor density = 2,000 receptors per cell) at any KDT or bsAb concentration ().
Taken together, these TBE model simulation results showed that the desired target receptor binding affinity depends on the intrinsic potency of the bsAb, the target receptor expression level, and the anticipated drug concentration at the site of action, and suggests that an integrated analysis of these interrelated factors is critical for rational design of bsAbs.
Projecting exposure-response relationships of blinatumomab in humans
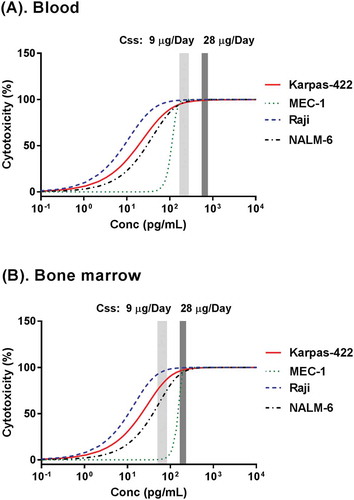
To examine the utility of the developed TBE model in human efficacious dose projection, the model was used to project the exposure-response relationship of blinatumomab in humans, and the results were compared with the reported blinatumomab clinical PK/PD data.Citation32 First, in vitro cytotoxicity data of blinatumomab with multiple representative human B-cell tumor cell lines (Karpas-422, MEC-1 and Raji) and human PBMCs were used to develop the TBE model (, Figure S2). These cell lines have varied CD19 receptor expression levels and different sensitivities to T cells.Citation33 In this step, some of the model parameters (e.g., EC50, γ and τReference) that are associated with the sensitivity of individual B-cell lines to T cell killing were re-estimated, while other parameter values (e.g., Kmax, Emax, kτ1, kτ2, Kg and Kout) were fixed to the ones established with blinatumomab and Nalm-6 cells using human T cell clone (). Using the established concentration-response relationships from Nalm-6, Karpas-422, MEC-1 and Raji cells ( and ), the TBE model was used to predict blinatumomab-mediated B cell depletion in human blood and bone marrow by replacing system-specific parameters, such as concentrations of the drug, effector cells, and target cells, with values obtained from patients with leukemia. Baseline T cell and B cell concentrations in the blood were assigned at 500 and 300 cells per µL, respectively, based on the most recently reported data in relapsed/refractory acute lymphoblastic leukemia (ALL) patients who received blinatumomab treatment;Citation34 baseline T cell and B cell concentrations in bone marrow were assigned at 2,000 and 20,000 cells per µL, respectively, based on multiple reported assessments of bone marrow lymphocyte subsets, which include patients with advanced ALL who received blinatumomab treatment.Citation35–Citation37 Other blinatumomab binding-associated parameters (e.g., KDCD3, KDreceptor_CD19) and compound and reaction system-associated parameters (e.g., EC50, γ, τreference, kτ1, kτ2) were assumed to be the same for in vitro and in vivo conditions. Since immune suppression is expected in patients with ALL, which may be associated with both upregulation of regulatory T cells and altered levels of cytokines,Citation38–Citation40 kmax for T cells from patients with relapsed or refractory ALL was assumed to be 1/3 of that from healthy T cells clone (0.0693 1/hr). Tumor doubling time in patients with ALL was assumed to be 33 days based on literature report,Citation20 and the derived kg was 0.00126 1/hr. The effect of T cell proliferation was not considered in the current simulation since it was reported that, on average, blinatumomab caused approximately a two-fold expansion of T cells in patients,Citation41 which would only lead to minor changes in τ. CD19 expression level on B cells was assigned at 20,000 receptors per cell based on literature report,Citation42 and this value was 2- to 5-fold lower than that of B cell lines used in vitro cytotoxicity assays (20,000 vs. 40,000 – 100,000 receptors per cell).Citation22,Citation33,Citation43–Citation45 The blood and bone marrow blinatumomab concentration-response curves predicted by the TBE model are shown in . Blinatumomab plasma drug concentration information following the approved dosing regimen, i.e., continuous intravenous infusion at a 9 µg/day priming dose for 7 days and then 28 µg/day full dose treatments, was obtained from multiple clinical PK studies in patients with either ALL or non-Hodgkin’s lymphoma.Citation32 Following the 9 µg/day priming dose, blinatumomab plasma concentrations at steady state ranged between 167 – 277 pg/mL; following the 28 µg/day full dose, blinatumomab plasma concentrations at steady state ranged between 552 – 771 pg/mL. Bone marrow concentrations of blinatumomab following blinatumomab administrations were assumed to be about 30% of that in the plasma based on literature report.Citation46 The model simulation suggested that following either the priming dose (9 µg/day) or the full dose (28 µg/day), blinatumomab is expected to cause near-complete or complete B cell depletion in blood (). Meanwhile, the model simulation results suggested that blinatumomab would induce incomplete depletion of B cells in bone marrow following the 9 µg/day priming dose, but that blinatumomab will lead to near complete depletion of bone marrow B cells following the 28 µg/day full dose, even at a relatively low baseline E:T ratio (assumed 1: 10 in the current simulation) (). This result of near-complete depletion of blasts in blood following the priming dose and of complete depletion following the full dose is consistent with the observed blinatumomab clinical data in ALL patients.Citation47 These results suggest that the TBE model’s estimated potency parameters based on in vitro cytotoxicity data are relevant to the activity of T-cell redirecting bsAbs in vivo.
Table 2. Model estimated parameters for TBE model with in vitro cytotoxicity data of blinatumomab on Karpas-422, Raji and MEC-1 cells.Citation33
Figure 5. Projection of exposure-response relationships of blinatumomab in blood (a) and bone marrow (b) for patients with acute lymphoblastic leukemia (ALL), using TBE model fitting results of in vitro cytotoxicity data from 4 different cell lines ( and ) and physiology & pathology information of ALL patients. Steady state plasma drug concentration information following the priming dose (9 µg/day light gray bar) and the full dose (28 µg/day, dark gray bar) was obtained from literature.Citation32 Steady state bone marrow drug concentrations following the priming dose (9 µg/day light gray bar) and the full dose (28 µg/day, dark gray bar) were projected under the assumption that drug exposure in bone marrow was about 30% of that in plasma.Citation46
Discussion
Engineered T-cell redirecting bsAbs that combine tumor antigen recognition with CD3-mediated T cell recruitment are highly potent tumor-killing molecules. Enormous efforts have been conducted in recent years to identify and to explore the effect of biological systems, protein scaffolds, and other drug characteristics on the anti-tumor activity of T cell directing bsAbs. However, rational target selection, drug design and dosing regimen optimization for such bsAbs have yet to become robust processes in the pharmaceutical industry.
The mechanism-based TBE complex-based cell killing model we developed described the characteristics of all three key players of T-cell redirecting therapy – the target cell (T), the biologics (B) and the effector cells (E) – with a single uniformed model structure. The model allows for the integrated analysis of multiple interrelated factors that impact the target cell killing effect, and can serve as a powerful tool to facilitate the discovery and development process of T-cell redirecting bsAbs. The mechanistic nature of the TBE model allows it to differentiate system-specific and drug-specific parameters, which enables the extrapolation of in vitro and in vivo data by replacing system-specific parameters. System-specific parameters include CD3 and target receptor expression levels, T cell and target cell concentrations, and T cell killing-associated parameters, such as kmax and τ. Drug-specific parameters, including the kon, koff, and KD values of the bsAbs to both CD3 and target cell receptors and the intrinsic engagement potency value of TBE complex (i.e., EC50), often remain similar across different in vitro and in vivo systems. We have collected the reported in vitro cytotoxicity datasets from multiple T-cell redirecting bsAbs and evaluated them with our model. The results showed that by using drug-specific parameters identified under one experimental condition, the model can reasonably predict the behavior of T-cell redirecting bsAbs under conditions with changes in system-specific or drug-specific parameters, such as a change in the binding affinity to the target receptor or CD3, in the receptor density on target cells, or in the concentration of target cells and effector cells. Importantly, the clinical efficacious dose of blinatumomab was reasonably projected by our model from its in vitro cytotoxicity data, human PK, and human physiology- and pathology-related parameters for ALL patients ().
Through analysis of in vitro cytotoxicity data from multiple sources, the similarities and differences of certain model-identified system-specific parameters offered insights into possible underlying mechanisms of action and key influencing factors for T-cell redirecting bsAbs. For example, the time course of target cell killing (τ) appears to be influenced by the sources of T cells used in the in vitro cytotoxicity experiments.Citation48 The TBE model analysis suggested that, although blinatumomab-mediated tumor cell killing shared similar EC50 values for both unstimulated and stimulated human peripheral T cells, the estimated τ values for stimulated T cells were about 50% lower than the estimated τ values for unstimulated T cells for all individual tumor cell types (Table S3). In other words, unstimulated and stimulated human peripheral T cells have comparable killing potency, but stimulated T cells can kill the target cells faster. This is consistent with our understanding of biology, i.e., upon sufficient TBE complex formation, it will take more time for unstimulated T cells than stimulated T cells to activate then start to kill target cells. Our model was also able to capture the in vitro cytotoxicity data at various E:T ratios using the same intrinsic potency value. In vitro cytotoxicity data from multiple studies have shown that T cells can conduct serial killing of target cells at lower E:T ratio conditions.Citation19 Meanwhile, instead of increasing the killing potency of T cells, higher E:T ratios appeared to only accelerate the T cell killing process.Citation19,Citation23,Citation49–Citation52 Consistently, the data we analyzed also suggested that the higher E:T ratios only accelerate the T cell killing process (τ), but do not affect the intrinsic potency value (EC50). Our model used two exponential functions to correlate both effector cell concentrations (kτ1) and target-to-effector cell ratios (kτ2) to τ. In doing so, our TBE model was able to capture the in vitro cytotoxicity data at various effector cell concentrations using one single intrinsic engagement potency value EC50 (, S1, and S2, , S2, and ), suggesting that the intrinsic engagement potency of a bsAb, i.e., the number of TBE complexes between one effector cell and one target cell sufficient to activate the engaged T cells, is a critical parameter for assessing T-cell redirecting bsAb-mediated target cell killing. The EC50 for a T-cell redirecting bsAb is expected to be determined by CD3 and target receptor binding epitopes,Citation53,Citation54 the bsAb architecture,Citation31 and the sensitivity of individual target cells to T cell killing ( and , and S2) .Citation2,Citation33,Citation53 The exact mechanism for how T-cell redirecting bsAbs trigger T cell activation and subsequent target cell killing has yet to be elucidated, but some bsAb architectures and epitopes appear to be more potent than others.Citation31,Citation53,Citation54 Taken together, these findings support the mechanistic nature and biological relevance of our TBE model.
Since formation of the TBE complex is the driving force of all downstream pharmacological effects, the CD3 and target binding affinity values used in the model should be evaluated with caution. When possible, the affinity values should be verified by examining the biologics’ binding to endogenous target cells and effector cells or cell lines expressing the endogenous target. Of note, in vitro studies have shown that the time it takes for a T cell to initiate killing of a target cell can be considerably shorter than the time required for some high affinity binding events to reach equilibrium.Citation19 Therefore, the binding kinetics relevant to the formation of TBE complex in the context of T cell killing kinetics, rather than the monovalent binding affinity at equilibrium, may need to be taken into consideration.
Our TBE model employs a large number of system-specific and drug-specific parameters to characterize bsAb-facilitated T cell killing of target cells. Nevertheless, given the limited data available for development of a fully mechanistic model, certain simplifications of biological processes were implemented during model development to avoid overparameterization. For example, the expansion of T cells as a result of activation was not considered, the T cells were assumed to have a first-order elimination of kout, and kout was fixed to a constant. This simplification was implemented partly because the in vitro cytotoxicity data that were available for model development and validation were all obtained within 96 hours of incubation, and no significant T cell proliferation is expected within 48–96 hours of incubation.Citation16,Citation55 In addition, an ex vivo cytotoxicity experiment using acute myeloid leukemia patient samples showed that, in patient samples with E:T ratios < 1:10, addition of either anti-programmed cell death 1 (PD-1) or anti- programmed cell death ligand 1 (PD-L1) antibodies significantly augmented AMG 330-induced target cell lysis. In patient samples with E:T ratios > 1:10, the enhancement effect of anti-PD-1 or anti-PD-L1 antibodies on AMG 330-induced target cell lysis was limited, suggesting that the upregulation of PD-1/PD-L1 may be minor at higher E:T ratios (e.g., > 1:10).Citation24 Since the E:T ratio of the in vitro assay data used in the current model analyses ranged from 20:1 to 1:10, the impact T cell exhaustion (i.e., upregulation of PD-1/PD-L1) was not considered in the current analysis. Multiple in vitro cytotoxicity assays have showed that, within a reasonable range of E:T ratios (i.e., ≥ 1:80), the effector cells can kill nearly all target cells after a sufficient incubation period,Citation3,Citation19,Citation24 so the Emax value for the TBE model was fixed at 100% for all model estimations. If we want to use this model to project in vivo effects of T-cell redirecting bispecific agents, especially following extended period of treatment, the validity of these simplifications should be carefully evaluated with in vivo data.
When the model input data contain sufficient information (e.g., multiple time points, or multiple E:T ratios, etc.),Citation3,Citation16,Citation19 the TBE model parameters can usually all be estimated with reasonable confidence. For compounds with insufficient in vitro cytotoxicity data to support development of the entire TBE model, some of the model parameters were fixed to values derived from other similar experiments. By fixing these model parameters, the other model paramters usually could be estimated with reasonable standard error values (, , S1). However, the standard error values (SE%) for some model estimated parameters were found to be 0 in several cases (Tables S, S3 and 2); these estimates appear to be associated with the limited number of observations and the fixation of most model parameters.Citation23,Citation25,Citation26,Citation33,Citation48
By providing an integrated analysis of key factors governing the killing capacity of bsAbs, this TBE model can be utilized to assist in the discovery and development of T-cell redirecting bsAbs, including drug design, candidate selection, and human dose projection. By incorporating information on the characteristics of the target receptor (i.e., target receptor expression level, bsAb accessibility at the site of action) and the anticipated intrinsic engagement potency of the compounds, TBE model-based sensitivity analyses can be performed to assist rational design of T-cell redirecting bsAbs. The model can simultaneously evaluate the effect of multiple factors to assess the suitability of target receptors, and guide the design and selection of the desired bsAb architecture, binding epitopes, and binding affinities for both the target cell receptor and the CD3 receptor. The therapeutic window of T-cell redirecting bsAbs can hopefully be expanded by carefully selecting compounds that can achieve complete depletion of target tumor cells at sites of action while minimizing cytotoxicity to normal tissues that express target receptors at lower levels.
The TBE model can also be used to facilitate translational research of T-cell redirecting bsAbs, and to assist in the design of clinical trials. This model reasonably projected the exposure-response relationship of blinatumomab in ALL patients by incorporating drug-specific parameters identified from in vitro cytotoxicity data and system-specific parameters based on human physiology and pathology (). This outcome suggests that the drug-specific parameters identified by TBE model may be extrapolated between in vitro and in vivo scenarios, and that the model has the potential to predict the efficacious dose range and dosing regimens for T-cell redirecting bsAbs in humans based on the properties of bsAbs (i.e. binding affinity, intrinsic engagement potency), the characteristics of diseases (i.e., exposure of bsAbs, distribution of effector cells and target cells, expressing level of target receptor), and patient conditions (i.e., variability in T cell activity).
Like all mechanism-based translational models, development of a mechanistic PK/PD model for T-cell redirecting bsAbs is expected to be an evolving process. Given our still limited understanding of the exact biological and physiological factors that govern the activity of such bsAbs, as well as the limited amount of available clinical data that would allow us to evaluate the performance of the model, the translational value of the current TBE model needs to be further examined. Fortunately, the mechanistic nature of the TBE model makes it especially amendable to new learnings.
Our planned next step is to connect the developed TBE model to a minimal physiologically-based pharmacokinetic (mPBPK) model structure.Citation56 The resulting mechanistic mPBPK/PD model would better incorporate our knowledge of human physiology and pathology to characterize target cell depletion profiles of bsAbs with longer in vivo half-lives and to possibly guide the optimization of dose level and dosing regimen based on information of different disease types and individual patient conditions.
In summary, we successfully developed a mechanistic modeling framework that simultaneously characterizes several key impact factors that determine bsAb facilitated T cell killing of target cells. This proposed TBE model represents a critical step forward in our understanding of relevant factors that affect the discovery and development of T-cell redirecting bsAbs, and it has been applied to support the discovery and development of such bsAbs. The model development process also highlights the importance of understanding the underlying biological processes in characterizing the dynamic interplay between biological system and T-cell redirecting bsAbs.
Methods
Data source
In vitro cytotoxicity assay data used for model development and evaluation was digitized from the literature; data included: depletion of CD19+ Nalm-6 target cells (150 – 1500 cells per µL) by a human T cell clone (150 – 1500 cells per µL) in the presence of blinatumomab, an anti-CD19xCD3 BiTE, after 4 and 24 hours of incubation;Citation19 depletion of CD19+ Blin-1 cells (50 cells per µL) by human PBLs (100 – 850 T cells per µL) in the presence of blinatumomab after 4 hours of incubation;Citation27 depletion of CD19+ Nalm-6 cells (250 cells per µL) by purified human peripheral T cells (625 – 5000 cells per µL) in the presence of blinatumomab after 24 hours of incubation;Citation23 depletion of CD19+ MEC-1, Nalm-6 and Raji cells (75 – 150 cells per µL) by un-stimulated or pre-stimulated isolated T cells (750 cells per µL) in the presence of blinatumomab after 18 hours of incubation;Citation48 depletion of P-cadherin+ HCT116 cells (15,000 – 80,000 cells per well, 75 – 400 cells per µL) by PBMCs (15,000 – 400,000 cells per well, 75 – 2000 cells per µL) in the presence of P-cadherin LP-DART after 24 – 96 hours of incubation;Citation16 depletion of CD33+ OCI-AML3 target cells (22.2 cells per µL) by purified human T cells (22.2 – 222 cells per µL) in the presence of AMG 330, an anti-CD33xCD3 BiTE, after 48 hours of incubation;Citation3 depletion of FLT3+ REH target cells (100 cells per µL) by activated CD8 + T cells (1000 cells per µL) in the presence of a series of anti-FLT3xCD3 Fabsc bsAbs after 8 hours of incubation;Citation25 depletion of CD20 + B cells (230 cells per µL) by human T cells (650 cells per µL) in the presence of a series of anti-CD20xCD3 bsAbs after 24 hours of incubation;Citation26 depletion of Karpas-422, MEC-1, or Raji target cells (150 cells per µL) by PBMCs (1500 cells per µL) in the presence of blinatumomab after 24 hours of incubation Citation33. The experimental condition associated parameters were either obtained from literature or leveraged from other studies.
Binding affinity (KD) values of the bsAbs to target cell receptors and T cell CD3 were obtained from literature. The binding affinity values of blinatumomab to CD3 and CD19 were 260 nM and 1.49 nM, respectively.Citation23 The binding affinity values of AMG 330 to CD3 and CD33 were 5.1 nM and 8.0 nM, respectively Citation57. The binding affinity values of P-cadherin LP-DART to CD3 and P-cadherin were 11.4 nM and 0.47 nM, respectively.Citation16 The binding affinity values of anti-FLT3 (4G8)xCD3 bsAb and anti-FLT3 (BV10)xCD3 bsAb to FLT and CD3 were obtained by binding kinetics fitting using digitized data.Citation25 The derived KD values of anti-FLT3 (4G8)xCD3 bsAb and anti-FLT3 (BV10)x CD3 bsAb to FLT3+ REH cells are 2 nM and 30 nM, respectively. The derived KD values of these two Fabsc-antibodies to CD3+ Jurkat cells are both 15 nM. The binding affinity values of anti-CD20xCD3 bsAbs CD20 K&H UCT1v9, CD20 K&H UCT1vM1 and CD20 K&H UCT1v1 to CD3 were 3, 40, and 300 nM, respectively.Citation26 The binding affinity of these anti-CD20xCD3 bsAbs to CD20 was obtained by binding kinetics fitting using digitized data, and the derived KD value was 7 nM.Citation26 In the current modeling exercise, the Kon values of all bsAbs to target cell receptors or T cell CD3 were derived using the equation kon = koff/KD under the assumption that koff values were 0.001 1/second to ensure that apparent binding equilibrium would be achieved within 1 hour after the start of incubation.
Expression levels of CD19 on Nalm-6, Blin-1, Raji, Karpas-422, and MEC-1 cell lines were assigned at 60,000, 60,000, 50,000, 50,000, and 100,000 receptors per cell, respectively, based on information from literature.Citation22,Citation33,Citation43,Citation44 CD19 expression levels on B cells was assigned at 20,000 receptors per cell based on data reported in the literature.Citation42 The expression level of CD33 on parental OCI-AML3 cells was 500, and the expression levels of CD33 on OCI-AML3 cells transduced with low, medium, and high levels of CD33 were 1,500, 5,000, and 10,000 receptors per cell, respectively, obtained by digitization.Citation3 The expression level of FLT3 on FLT3+ REH cells was assumed to be 50,000 receptors per cell, which is 100-fold higher than FLT3 expression level on normal CD14+ monocytes (about 500 receptors per cell) .Citation25 The expression level of CD20 on B cells was assigned at 100,000 receptors per cell, based on data reported in the literature.Citation42 CD3 expression level on T cells was assigned at 50,000 receptors per cell, based on internal data.
Structure of a TBE complex-based cell killing model
T-cell redirecting bsAbs mediate tumor killing by redirecting effector cells (e.g., T cells) to target tumor cells. The formation of tri-molecular TBE complexes via simultaneous binding of the bispecific biologic drug to the target receptor on a target cell and to the CD3 receptor on the effector cell is expected to be the driving force of all downstream pharmacological effects, including T cell activation and tumor cell killing (). A TBE complex-based cell killing model (TBE model) was proposed with the following assumptions and approximations: total amounts of target cell receptors and T cell CD3 are evenly distributed in a well-stirred system; bsAbs engage effector cells and target cells by simultaneously binding to the CD3 and target cell receptors; bsAb binding to T cell CD3 and the target cell receptor are treated as independent binding events; elimination of bsAb by binding to the CD3 or target cell recepotor is not considered. Since the current model can capture the observed data reasonably well, the potential effect of avidity by pulling the T cell and target cell close together to generate a higher local concentration gradient was not considered.Citation58 In order to compare T cell-mediated serial killing of target cells across different experimental conditions, the potency related parameters were normalized to a reference system where the concentrations of effector cells (ConcEffector cells_reference) and target cells were both defined as 1,000 cells per µL.
The formation of the TBE complex can be mathematically characterized using Equations 1–4:
where konCD3 and koffCD3 are the binding constants between biologics and CD3 on effector cells; konreceptor and koffreceptor are the binding constants between biologics and the target receptor on target cells; B = unbound biologics, E = unbound CD3 on effector cells, T = unbound receptor on target cells, BE = biologics-effector cell CD3 complex, TB = target cell receptor-biologics complex, and TBE = target cell receptor-biologics-effector cell CD3 complex. ConcTarget cells and ConcEffector cells represent the concentrations of target cells and effector cells in the matrix, respectively. The total concentration of CD3 on effector cells, represented as the sum of E, BE and TBE complex, is equal to ConcEffector cells multiplied by CD3 expression level of the effector cell (DensityCD3). The total concentration of target receptors on target cells, represented as a sum of T, TB and TBE complex, is equal to Conctarget cells multiplied by the receptor expression level of the target cell (DensityReceptor).
Effector cell (T cell)-mediated serial killing of target cells was described using a signal distribution model with three transit compartments using Equation 5–11.Citation21 The killing of target cells is driven by TBE complex per target cell (TBEPC). The concentrations of T cells and target cells were different across the datasets used for model development. In order to compare the intrinsic killing potency of TBEPC, a reference system was used to derive normalized values, where the concentrations of effector cells and target cells were both defined as 1,000 cells per µL.
TA, TAControl, and EF represent populations of target cells in the treatment group, target cells in the control group, and effector cells, respectively. Their initial values at Target(0) and Effector(0) represent the initial concentration of target cells and effector cells in the reaction system, respectively. Target cells proliferate with a growth rate constant kg. The target cell killing rate of T cells at any bsAb concentration is kel, which is determined by kmax, TBEPCR, EC50, and the Hill factor γ. kmax represents the maximum target cell killing rate of T cells; TBEPCR represents the theoretical number of TBE complexes formed on each target cell, which was normalized to the reference system. EC50 represents the TBEPCR associated with 50% of maximum target cell killing rate, which reflects the intrinsic engagement potency of the engaged T cell and bsAb to kill the target tumor cell. Three transit compartments (k1 – k3) are employed in this model to characterize the time course of target cell killing; however, only 1 parameter is used to describe transit kinetics (ktr), and the total transit time (τ) was defined as ktr = 3/τ. Compared to the target cell killing transit time in the reference system (τreference), the τ values under other experimental conditions were correlated exponentially with both the fold-difference between the experimental effector cell concentration and that of the reference system (1,000 cells per µL) with an exponent kτ1, and fold-change between the experimental target-to-effector cell ratio and that of the reference system (1:1) with an exponent kτ2. For the in vitro cytotoxicity concentration-response curve, %Cytotoxicity represent the model predicted cytotoxicity effect at any given bsAb concentration. Emax and Base represent the maximal and minimal cytotoxicity effect, respectively, of the cytotoxicity curve. In the current analysis, Emax was fixed at 100%, since multiple in vitro cytotoxicity assays have showed that, within a reasonable range of E:T ratios (i.e., ≥ 1:80), the effector cells can kill nearly all target cells after a sufficient incubation period.Citation3,Citation19,Citation24 Base was either estimated or fixed, depending on individual data sets. The dynamics of effector cells (EF) was described with an indirect response model, where kin and kout represent the production and elimination of T cells, respectively. kin was defined as EF(0) x kout. Note that the expansion of T cells was not considered in the current analysis, as the in vitro cytotoxicity data used for model development and validation were all obtained within 96 hours of incubation, and literature has shown that no significant T cell proliferation is expected within 48–96 hours of incubation.Citation16,Citation55
The difference between observed and model-predicted values was modeled with a combined additive and proportional error model for %Cytotoxicity:
Where ε1 and ε2 represent the proportional and additive residual errors, with means of zero and variance σ2, between the jth observation in the ith individual (YObs) and its prediction (YPred).
Software
The PK/PD analysis was performed in NONMEM 7.2 (Icon Development Solutions, Ellicott City, MD) using the first-order conditional estimation with interaction (FOCEI) method and the ADVAN 13 subroutine, Pearl-speaks-NONMEM(PsN)Citation59 tool kit and Pirana 2.9.0.Citation60 GraphPad Prism7 (GraphPad Software, Inc., San Diego, CA) and R (http://www.r-project.org) were used for graphic model assessment. In vitro cytotoxicity data points from cited observed studies were digitized using GetData Graph Digitizer software version 2.26.0.20 (http://getdata-graph-digitizer. com).
Disclosure of Potential Conflicts of Interest
No potential conflict of interest was reported by the authors.
Abbreviations
| ALL | = | acute lymphoblastic leukemia |
| BiTE | = | bispecific T-cell engager |
| bsAbs | = | bispecific antibodies |
| E:T | = | effector-to-target |
| LP-DART | = | extended half-life Dual Affinity Re-Targeting scaffold |
| mPBPK | = | minimal physiologically-based pharmacokinetic |
| PBLs | = | peripheral blood lymphocytes |
| PBMCs | = | peripheral blood mononuclear cells |
| PD | = | pharmacodynamic |
| PD-1 | = | programmed cell death 1 |
| PD-L1 | = | programmed cell death ligand 1 |
| PK | = | pharmacokinetic |
| TBE | = | Target cell-Biologics-Effector cell |
Supplemental Material
Download MS Word (853.8 KB)Supplementary Material
Supplemental data for this article can be accessed here.
Additional information
Funding
References
- Urruticoechea A, Alemany R, Balart J, Villanueva A, Vinals F, Capella G. Recent advances in cancer therapy: an overview. Curr Pharm Des. 2010;16:3–10.
- Sun LL, Ellerman D, Mathieu M, Hristopoulos M, Chen X, Li Y, Yan X, Clark R, Reyes A, Stefanich E, et al. Anti-CD20/CD3 T cell-dependent bispecific antibody for the treatment of B cell malignancies. Sci Transl Med. 2015;7:287ra70. doi:10.1126/scitranslmed.aad3106.
- Laszlo GS, Gudgeon CJ, Harrington KH, Dell’Aringa J, Newhall KJ, Means GD, Sinclair AM, Kischel R, Frankel SR, Walter RB. Cellular determinants for preclinical activity of a novel CD33/CD3 bispecific T-cell engager (BiTE) antibody, AMG 330, against human AML. Blood. 2014;123:554–561. doi:10.1182/blood-2013-09-527044.
- Satta A, Mezzanzanica D, Turatti F, Canevari S, Figini M. Redirection of T-cell effector functions for cancer therapy: bispecific antibodies and chimeric antigen receptors. Future Oncol. 2013;9:527–539. doi:10.2217/fon.12.203.
- Zhukovsky EA, Morse RJ, Maus MV. Bispecific antibodies and CARs: generalized immunotherapeutics harnessing T cell redirection. Curr Opin Immunol. 2016;40:24–35. doi:10.1016/j.coi.2016.02.006.
- Trivedi A, Stienen S, Zhu M, Li H, Yuraszeck T, Gibbs J, Heath T, Loberg R, Kasichayanula S. Clinical pharmacology and translational aspects of bispecific antibodies. Clin Transl Sci. 2017;10:147–162. doi:10.1111/cts.12459.
- Laszlo GS, Estey EH, Walter RB. The past and future of CD33 as therapeutic target in acute myeloid leukemia. Blood Rev. 2014;28:143–153. doi:10.1016/j.blre.2014.04.001.
- Testa U, Pelosi E, Frankel A. CD 123 is a membrane biomarker and a therapeutic target in hematologic malignancies. Biomark Res. 2014;2:4. doi:10.1186/2050-7771-2-4.
- Pu YS, Huang CY, Kuo YZ, Kang WY, Liu GY, Huang AM, Yu HJ, Lai MK, Huang SP, Wu WJ, et al. Characterization of membranous and cytoplasmic EGFR expression in human normal renal cortex and renal cell carcinoma. J Biomed Sci. 2009;16:82. doi:10.1186/1423-0127-16-82.
- Klein C, Neumann C, Fauti T, Weinzierl T, Freimoser-Grundschober A, Waldhauer I, Fahrni L, Herter S, van Puijenbroek E, Colombetti S, et al. Abstract 3629: Engineering a novel asymmetric head-to-tail 2+1 T-cell bispecific (2+1 TCB) IgG antibody platform with superior T-cell killing compared to 1+1 asymmetric TCBs. Cancer Research. 2017;77:3629. doi:10.1158/1538-7445.AM2017-3629.
- Yuraszeck T, Kasichayanula S, Benjamin JE. Translation and clinical development of bispecific t-cell engaging antibodies for cancer treatment. Clin Pharmacol Ther. 2017;101:634–645. doi:10.1002/cpt.651.
- Kontermann RE, Brinkmann U. Bispecific antibodies. Drug Discov Today. 2015;20:838–847. doi:10.1016/j.drudis.2015.02.008.
- Chiu ML, Gilliland GL. Engineering antibody therapeutics. Curr Opin Struct Biol. 2016;38:163–173. doi:10.1016/j.sbi.2016.07.012.
- Cao Y, Axup JY, Ma JS, Wang RE, Choi S, Tardif V, Lim RK, Pugh HM, Lawson BR, Welzel G, et al. Multiformat T-cell-engaging bispecific antibodies targeting human breast cancers. Angew Chem Int Ed Engl. 2015;54:7022–7027. doi:10.1002/anie.201500799.
- Lum LG, Thakur A. Targeting T cells with bispecific antibodies for cancer therapy. BioDrugs. 2011;25:365–379. doi:10.2165/11595950-000000000-00000.
- Chen X, Haddish-Berhane N, Moore P, Clark T, Yang Y, Li H, Xuan D, Barton HA, Betts AM, Barletta F. Mechanistic projection of first-in-human dose for bispecific immunomodulatory P-Cadherin LP-DART: an integrated PK/PD modeling approach. Clin Pharmacol Ther. 2016;100:232–241. doi:10.1002/cpt.393.
- Hosseini I, Gadkar K, Stefanich E, Li CC, Sun L, Chu YW, Ramanujan S. Systems pharmacology modeling to support clinical development of anti-CD20/CD3 T-cell dependent bispecific antibody. The eighth American Conference on Pharmacometrics; 2016; Seattle, WA.
- Campagne O, Delmas A, Fouliard S, Chenel M, Chichili GR, Li H, Alderson R, Scherrmann JM, Mager DE. Integrated pharmacokinetic/pharmacodynamic model of a bispecific CD3xCD123 DART(R) molecule in nonhuman primates: evaluation of activity and impact of immunogenicity. Clin Cancer Res. 2018;24:2631–2641. doi:10.1158/1078-0432.CCR-17-2265.
- Hoffmann P, Hofmeister R, Brischwein K, Brandl C, Crommer S, Bargou R, Itin C, Prang N, Baeuerle PA. Serial killing of tumor cells by cytotoxic T cells redirected with a CD19-/CD3-bispecific single-chain antibody construct. Int J Cancer. 2005;115:98–104. doi:10.1002/ijc.20908.
- Skipper HE, Perry S. Kinetics of normal and leukemic leukocyte populations and relevance to chemotherapy. Cancer Res. 1970;30:1883–1897.
- Westera L, Drylewicz J, Den Braber I, Mugwagwa T, van der Maas I, Kwast L, Volman T, van de Weg-Schrijver EH, Bartha I, Spierenburg G, et al. Closing the gap between T-cell life span estimates from stable isotope-labeling studies in mice and humans. Blood. 2013;122:2205–2212. doi:10.1182/blood-2013-03-488411.
- Haso W, Lee DW, Shah NN, Stetler-Stevenson M, Yuan CM, Pastan IH, Dimitrov DS, Morgan RA, FitzGerald DJ, Barrett DM, et al. Anti-CD22-chimeric antigen receptors targeting B-cell precursor acute lymphoblastic leukemia. Blood. 2013;121:1165–1174. doi:10.1182/blood-2012-06-438002.
- Dreier T, Lorenczewski G, Brandl C, Hoffmann P, Syring U, Hanakam F, Kufer P, Riethmuller G, Bargou R, Baeuerle PA. Extremely potent, rapid and costimulation-independent cytotoxic T-cell response against lymphoma cells catalyzed by a single-chain bispecific antibody. Int J Cancer. 2002;100:690–697. doi:10.1002/ijc.10557.
- Krupka C, Kufer P, Kischel R, Zugmaier G, Lichtenegger FS, Kohnke T, Vick B, Jeremias I, Metzeler KH, Altmann T, et al. Blockade of the PD-1/PD-L1 axis augments lysis of AML cells by the CD33/CD3 BiTE antibody construct AMG 330: reversing a T-cell-induced immune escape mechanism. Leukemia. 2016;30:484–491. doi:10.1038/leu.2015.214.
- Durben M, Schmiedel D, Hofmann M, Vogt F, Nubling T, Pyz E, Bühring HJ, Rammensee HG, Salih HR, Große-Hovest L, et al. Characterization of a bispecific FLT3 X CD3 antibody in an improved, recombinant format for the treatment of leukemia. Mol Ther. 2015;23:648–655. doi:10.1038/mt.2015.2.
- Chen X, Dennis MS, Ebens AJ, Junttila TT, Kelley RF, Mathieu MA, Sun LL. Anti-cd3 antibodies and methods of use. Google patent: Genentech, Inc, South San Francisco, CA; 2015.
- Loffler A, Kufer P, Lutterbuse R, Zettl F, Daniel PT, Schwenkenbecher JM, Riethmüller G, Dörken B, Bargou RC. A recombinant bispecific single-chain antibody, CD19 x CD3, induces rapid and high lymphoma-directed cytotoxicity by unstimulated T lymphocytes. Blood. 2000;95:2098–2103.
- Loffler A, Gruen M, Wuchter C, Schriever F, Kufer P, Dreier T, Hanakam F, Baeuerle PA, Bommert K, Karawajew L, et al. Efficient elimination of chronic lymphocytic leukaemia B cells by autologous T cells with a bispecific anti-CD19/anti-CD3 single-chain antibody construct. Leukemia. 2003;17:900–909. doi:10.1038/sj.leu.2402890.
- Harms BD, Kearns JD, Iadevaia S, Lugovskoy AA. Understanding the role of cross-arm binding efficiency in the activity of monoclonal and multispecific therapeutic antibodies. Methods. 2014;65:95–104. doi:10.1016/j.ymeth.2013.07.017.
- Labrijn AF, Meesters JI, de Goeij BE, van den Bremer ET, Neijssen J, van Kampen MD, Strumane K, Verploegen S, Kundu A, Gramer MJ, et al. Efficient generation of stable bispecific IgG1 by controlled Fab-arm exchange. Proc Natl Acad Sci U S A. 2013;110:5145–5150. doi:10.1073/pnas.1220145110.
- Wuellner U, Klupsch K, Buller F, Attinger-Toller I, Santimaria R, Zbinden I, Henne P, Grabulovski D, Bertschinger J, Brack S. Bispecific CD3/HER2 targeting FynomAb induces redirected T cell-mediated cytolysis with high potency and enhanced tumor selectivity. Antibodies. 2015;4:426. doi:10.3390/antib4040426.
- Zhu M, Wu B, Brandl C, Johnson J, Wolf A, Chow A, Doshi S. Blinatumomab, a bispecific T-cell engager (BiTE((R))) for CD-19 targeted cancer immunotherapy: clinical pharmacology and its implications. Clin Pharmacokinet. 2016;55:1271–1288. doi:10.1007/s40262-016-0405-4.
- d’Argouges S, Wissing S, Brandl C, Prang N, Lutterbuese R, Kozhich A, Suzich J, Locher M, Kiener P, Kufer P, et al. Combination of rituximab with blinatumomab (MT103/MEDI-538), a T cell-engaging CD19-/CD3-bispecific antibody, for highly efficient lysis of human B lymphoma cells. Leuk Res. 2009;33:465–473. doi:10.1016/j.leukres.2008.08.025.
- Zhu M, Kratzer A, Johnson J, Holland C, Brandl C, Singh I, Wolf A, Doshi S. Blinatumomab pharmacodynamics and exposure-response relationships in relapsed/refractory acute lymphoblastic leukemia. J Clin Pharmacol. 2018;58:168–179. doi:10.1002/jcph.1006.
- Szabolcs P, Park KD, Reese M, Marti L, Broadwater G, Kurtzberg J. Absolute values of dendritic cell subsets in bone marrow, cord blood, and peripheral blood enumerated by a novel method. Stem Cells. 2003;21:296–303. doi:10.1634/stemcells.21-3-296.
- Horny HP, Wehrmann M, Griesser H, Tiemann M, Bultmann B, Kaiserling E. Investigation of bone marrow lymphocyte subsets in normal, reactive, and neoplastic states using paraffin-embedded biopsy specimens. Am J Clin Pathol. 1993;99:142–149.
- Kantarjian H, Stein A, Gokbuget N, Fielding AK, Schuh AC, Ribera JM, Wei A, Dombret H, Foà R, Bassan R, et al. Blinatumomab versus chemotherapy for advanced acute lymphoblastic leukemia. N Engl J Med. 2017;376:836–847. doi:10.1056/NEJMoa1609783.
- Wu CP, Qing X, Wu CY, Zhu H, Zhou HY. Immunophenotype and increased presence of CD4(+)CD25(+) regulatory T cells in patients with acute lymphoblastic leukemia. Oncol Lett. 2012;3:421–424. doi:10.3892/ol.2011.499.
- Nicholas NS, Apollonio B, Ramsay AG. Tumor microenvironment (TME)-driven immune suppression in B cell malignancy. Biochim Biophys Acta. 2016;1863:471–482. doi:10.1016/j.bbamcr.2015.11.003.
- Vilchis-Ordonez A, Contreras-Quiroz A, Vadillo E, Dorantes-Acosta E, Reyes-Lopez A, Quintela-Nunez Del Prado HM, Venegas-Vàzquez J, Mayani H, Ortiz-Navarrete V, López-Martínez B, et al. Bone marrow cells in acute lymphoblastic leukemia create a proinflammatory microenvironment influencing normal hematopoietic differentiation fates. Biomed Res Int. 2015;2015:386165. doi:10.1155/2015/386165.
- Bargou R, Leo E, Zugmaier G, Klinger M, Goebeler M, Knop S, Noppeney R, Viardot A, Hess G, Schuler M, et al. Tumor regression in cancer patients by very low doses of a T cell-engaging antibody. Science. 2008;321:974–977. doi:10.1126/science.1158545.
- Ginaldi L, de Martinis M, Matutes E, Farahat N, Morilla R, Catovsky D. Levels of expression of CD19 and CD20 in chronic B cell leukaemias. J Clin Pathol. 1998;51:364–369.
- Weng WK, Jarvis L, LeBien TW. Signaling through CD19 activates Vav/mitogen-activated protein kinase pathway and induces formation of a CD19/Vav/phosphatidylinositol 3-kinase complex in human B cell precursors. J Biol Chem. 1994;269:32514–32521.
- Wolf ML, Weng WK, Stieglbauer KT, Shah N, LeBien TW. Functional effect of IL-7-enhanced CD19 expression on human B cell precursors. J Immunol. 1993;151:138–148.
- Benjamin JE, Stein AS. The role of blinatumomab in patients with relapsed/refractory acute lymphoblastic leukemia. Ther Adv Hematol. 2016;7:142–156. doi:10.1177/2040620716640422.
- Sgouros G, Stabin M, Erdi Y, Akabani G, Kwok C, Brill AB, Wessels B. Red marrow dosimetry for radiolabeled antibodies that bind to marrow, bone, or blood components. Med Phys. 2000;27:2150–2164. doi:10.1118/1.1288393.
- Zhu M, Kratzer A, Johnson J, Holland C, Brandl C, Singh I, Wolf A, Doshi S. Pharmacokinetics/pharmacodynamics of blinatumomab in patients with relapsed/refractory B-precursor acute lymphoblastic leukemia. American Society of Clinical Oncology 2015 annual meeting; 2015; Chicago, IL.
- Molhoj M, Crommer S, Brischwein K, Rau D, Sriskandarajah M, Hoffmann P, Kufer P, Hofmeister R, Baeuerle PA. CD19-/CD3-bispecific antibody of the BiTE class is far superior to tandem diabody with respect to redirected tumor cell lysis. Mol Immunol. 2007;44:1935–1943. doi:10.1016/j.molimm.2006.09.032.
- Zhang L, Hou Y, Zhang J, Hu J, Zhang K. Cytotoxicity of cytokine-induced killer cells targeted by a bispecific antibody to gastric cancer cells. Oncol Lett. 2013;5:1826–1832. doi:10.3892/ol.2013.1281.
- Hipp S, Tai YT, Blanset D, Deegen P, Wahl J, Thomas O, Rattel B, Adam PJ, Anderson KC, Friedrich M. A novel BCMA/CD3 bispecific T-cell engager for the treatment of multiple myeloma induces selective lysis in vitro and in vivo. Leukemia. 2017;31:1743–1751. doi:10.1038/leu.2016.388.
- Al-Hussaini M, Rettig MP, Ritchey JK, Karpova D, Uy GL, Eissenberg LG, Gao F, Eades WC, Bonvini E, Chichili GR, et al. Targeting CD123 in acute myeloid leukemia using a T-cell-directed dual-affinity retargeting platform. Blood. 2016;127:122–131. doi:10.1182/blood-2014-05-575704.
- Hammond SA, Lutterbuese R, Roff S, Lutterbuese P, Schlereth B, Bruckheimer E, Kinch MS, Coats S, Baeuerle PA, Kufer P, et al. Selective targeting and potent control of tumor growth using an EphA2/CD3-Bispecific single-chain antibody construct. Cancer Res. 2007;67:3927–3935. doi:10.1158/0008-5472.CAN-06-2760.
- Root A, Cao W, Li B, LaPan P, Meade C, Sanford J, Macy Jin, Cliona O’Sullivan, Emma Cummins, Matthew Lambert, et al. Development of PF-06671008, a highly potent anti-P-cadherin/Anti-CD3 bispecific DART molecule with extended half-life for the treatment of cancer. Antibodies. 2016;5:6. doi:10.3390/antib5010006.
- Li J, Stagg NJ, Johnston J, Harris MJ, Menzies SA, DiCara D, Clark V, Hristopoulos M, Cook R, Slaga D, et al. Membrane-proximal epitope facilitates efficient T cell synapse formation by Anti-FcRH5/CD3 and is a requirement for myeloma cell killing. Cancer Cell. 2017;31:383–395. doi:10.1016/j.ccell.2017.02.001.
- Nguyen XD, Eichler H, Dugrillon A, Piechaczek C, Braun M, Kluter H. Flow cytometric analysis of T cell proliferation in a mixed lymphocyte reaction with dendritic cells. J Immunol Methods. 2003;275:57–68.
- Cao Y, Balthasar JP, Jusko WJ. Second-generation minimal physiologically-based pharmacokinetic model for monoclonal antibodies. J Pharmacokinet Pharmacodyn. 2013;40:597–607. doi:10.1007/s10928-013-9332-2.
- Friedrich M, Henn A, Raum T, Bajtus M, Matthes K, Hendrich L, Wahl J, Hoffmann P, Kischel R, Kvesic M, et al. Preclinical characterization of AMG 330, a CD3/CD33-bispecific T-cell-engaging antibody with potential for treatment of acute myelogenous leukemia. Mol Cancer Ther. 2014;13:1549–1557. doi:10.1158/1535-7163.MCT-13-0956.
- Zheng S, Moores S, Jarantow S, Pardinas J, Chiu M, Zhou H, Wang W. Cross-arm binding efficiency of an EGFR x c-Met bispecific antibody. MAbs. 2016;8:551–561. doi:10.1080/19420862.2015.1136762.
- Lindbom L, Pihlgren P, Jonsson EN. PsN-Toolkit–a collection of computer intensive statistical methods for non-linear mixed effect modeling using NONMEM. Comput Methods Programs Biomed. 2005;79:241–257. doi:10.1016/j.cmpb.2005.04.005.
- Keizer RJ, van Benten M, Beijnen JH, Schellens JH, Huitema AD. Pirana and PCluster: a modeling environment and cluster infrastructure for NONMEM. Comput Methods Programs Biomed. 2011;101:72–79. doi:10.1016/j.cmpb.2010.04.018.