
ABSTRACT
The successful development and regulatory approval of originator and biosimilar therapeutic proteins requires a systems approach to upstream and downstream processing as well as product characterization and quality control. Innovation in process design and control, product characterization strategies, and data integration represent an ecosystem whose concerted advancement may reduce time-to-market and further improve comparability and biosimilarity programs. The biopharmaceutical community has made great strides to this end, yet there currently exists no pre-competitive monoclonal antibody (mAb) expression platform for open innovation. Here, we describe the development and initial expression of an intended copy of the NISTmAb using three non-originator murine cell lines. It was found that, without optimization and in culture flasks, all three cell lines produce approximately 100 mg mAb per liter of culture. Sodium dodecyl sulfate polyacrylamide gel electrophoresis, size-exclusion chromatography, nuclear magnetic resonance spectroscopy, intact mass spectrometry, and surface plasmon resonance were used to demonstrate that the products of all three cell lines embody quality attributes with a sufficient degree of sameness to the NISTmAb Reference Material 8671 to warrant further bioreactor studies, process improvements and optimization. The implications of the work with regard to pre-competitive innovation to support process design and feedback control, comparability and biosimilarity assessments, and process analytical technologies are discussed.
Introduction
The United States biotherapeutic monoclonal antibody (mAb) market generates over $100 billion in yearly revenueCitation1. In addition, almost 3,000 candidate biotherapeutics, many of them mAbs, are in some stage of clinical development. Development of biosimilar alternatives is also accelerating because patent protection for many biotherapeutic mAbs expires by 2019Citation2. The US Food and Drug Administration (FDA) has approved seven mAb biosimilar alternatives as of December 2017Citation3. Therapeutic mAbs are large, complex proteins that contain multiple functional domains, and vary in post-translational modification (PTM). They are often produced in mammalian cells, and differences in growth conditions, such as media composition (i.e., nutrient concentration), media conditions (i.e., pH), and growth time, can affect the yield, structure, PTMs, and function of the expressed mAb. In addition, even if expressed in the same cell type, clonal variation can affect protein characteristics. A pre-competitive, industrially relevant expression system would accelerate development of originator and follow-on products as a collaborative test case to develop innovative process technology, such as continuous manufacturing, process intensification strategies, and process analytical technologies. Advancements demonstrated with such a reference cell line could then be adopted by biopharmaceutical manufacturers and may result in improvements in the ability to prepare and define product quality attributes (PQAs), predict and tune PQAs through process control, and quantitatively correlate structural elements responsible for biological activity, among others.
The National Institute of Standards and Technology (NIST) mAb (NISTmAb) is a publicly available IgG1κ antibody performance standard useful for evaluation/development of state-of-the-art and emerging analytical measurement technologiesCitation4,Citation5. The material has been used extensively to evaluate current best practices and develop innovative analytical technologiesCitation6-Citation9. The NISTmAb was expressed by its originator using a proprietary cell line and process. Preliminary characterization was performed on a single production lot, NISTmAb Primary Sample 8670 (PS 8670), currently reserved as the NIST in-house primary standard. Additional lots were pooled and vialed at 10 mg/mL by NIST as the publicly available NISTmAb Reference Material 8671 (RM 8671)Citation4. The physicochemical reference values for RM 8671 were assigned using qualified test methods representative of industry best practices and demonstrated to be homogeneous and stableCitation5. A detailed comparison of the two lots using a variety of analytical techniques was recently publishedCitation5. PS 8670 is utilized herein as the comparator molecule (i.e., reference product) for nuclear magnetic resonance spectroscopy (NMR) measurements due to its formulation at higher concentration, whereas the RM 8671 is used as the comparator for all other assays.
Keeping in mind that NISTmAb is not intended for clinical use, a non-originator cell line expressing the same nominal sequence as the NISTmAb would serve as a pre-competitive test case for upstream and downstream innovative technology development much as the material itself has done for analytical characterization. A series of non-originator NISTmAb cell lines that encode for the same primary amino acid sequence, but are not the cell line used for production of the NISTmAb, were developed in an attempt to meet this need. Three non-originator NS0 expression cell lines (referred to as NS0-59, NS0-60, and NS0-66) were developed and further evaluated for protein expression. Each of the cell lines was shown to be capable of moderate expression titer in a T-flask without any process optimization. In addition, analytical characterization demonstrated that many of the salient features were maintained when compared to NISTmAb, indicating the cell lines are promising candidates for additional process optimization and use in pre-competitive bioprocess research. The implications of the work and future direction of the study are discussed in the context of advancements made possible by these cell lines toward pre-competitive innovation in process development and adaptation of new process analytical technologies.
Results
Development of Cell Lines
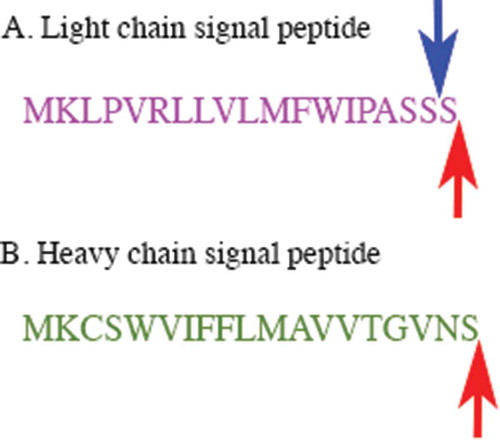
The amino acid sequence of the NISTmAb was verified and reported using LC-MS/MS peptide mappingCitation10,Citation11. The DNA construct encoded in the cell lines developed herein was constructed to directly encode the same primary amino acid sequence, although the specific codons used for the NISTmAb were unknown. Therefore, the codons were optimized for mouse expression as described in Materials and Methods and are given in Supplementary Figure S1. NISTmAb has an N-terminal pyroglutamate residue on the heavy chain and a N-terminal aspartic acid on the light chain. Processing of a mAb expressed in murine suspension culture involves the clipping of an N-terminal signal peptide upstream of these penultimate residues. In development of the non-originator cell lines, the signal peptide used for expression of NISTmAb was unknown; therefore, murine signal peptides were selected as described in Materials and Methods. Under complete processing of the signal peptide, the entire sequence depicted in will be cleaved, resulting in expression of non-originator products with the same terminal amino acid sequence as NISTmAb ( red arrows). However, in a small percentage of product an additional Ser residue was identified [See mass spectrometry (MS) characterization below], which may be a result of promiscuous cleavage at the three Ser stretch of the light chain signal peptide ( blue arrow)Citation12.
Figure 1. The amino acid sequences of the signal peptides encoded in the non-originator cell lines for the light and heavy chains.
A. The signal peptide of the light chain is shown. The red arrow shows the expected cleavage site and the blue arrow shows the alternate cleavage site, resulting in an additional Ser residue on a small proportion of the mAb. B. The signal peptide of the heavy chain is shown. The red arrow shows the expected cleavage site.
Cell Growth and mAb Expression
Initial growth of each of the cell lines was performed as described in Materials and Methods and cell density and viability were monitored using Vi-Cell XR (Beckman Coulter). The cells were harvested using centrifugation and the mAbs were purified from the supernatants on Protein-A columns. The purified proteins were shown to be virtually clean of any nucleic acid contamination (Peter Vallone, NIST, personal communication). Protein-A affinity chromatography is the industry standard for purification of mAbs, and has been shown to decrease host cell protein levels in excess of 98%Citation13. Specific evaluation of such process impurities was not the focus of this initial report; therefore, additional purification was not conducted.
Eluent from the Protein-A affinity chromatography column was further buffer exchanged into 12.5 mmol/L L-histidine, 12.5 mmol/L L-histidine HCl, pH 6.0; the formulation buffer of NISTmAb RM 8671 and PS 8670. The protein yield was assessed using UV-Visible absorption at 280 nm as described in Materials and Methods. While cell lines NS0-59 and NS0-60 yielded about 100 mg purified mAb per liter of culture, NS0-66 yielded 150 mg/L. The reasons for the difference in mAb production between NS0-66 and the other two cell lines are not clear, but may be due to the integration site in the mouse genome, as all three cell lines were generated using random integration. It should be noted that no optimization for protein production was performed, which may increase mAb production yield in one or more of the cell lines.
Sodium Dodecyl Sulfate Polyacrylamide Gel Electrophoresis (SDS-PAGE)
SDS-PAGE analysis of the NISTmAb RM 8671 showed a single intact protein band in the unreduced form and two well resolved bands in the reduced form, consistent with the previously reported pattern ( lanes 2 and 3, respectively).Citation14 Overall, the three non-originator proteins result in major bands consistent with the RM 8671 in unreduced ( lanes 4, 6, and 8) and reduced ( lanes 5, 7, and 9) conditions. The only clear difference between the three non-originator mAbs and RM 8671 is the presence of several smaller protein bands when unreduced conditions were used (; compare lanes 4, 6, and 8 to lane 2). These smaller bands are likely due to an alternative oligomeric state (e.g. HC:HC:LC) or alternative disulfide bond formation rather than host cell protein impurities because the additional bands are not observed when the proteins are analyzed under reducing conditions ( lanes 5, 7, and 9). Overall, the SDS-PAGE analysis of each of the NS0-59, NS0-60, and NS0-66 mAbs resembles that of RM 8671, and therefore all were subjected to further analytical analysis.
Figure 2. SDS-PAGE analysis of NISTmAb RM 8671, NS0-59, NS0-60, and NS0-66.
SDS-PAGE analysis was used to evaluate the RM 8671, NS0-59, NS0-60 and NS0-66 antibodies in the presence (lanes 3, 5, 7, and 9) or absence (lanes 2, 4, 6, and 8) of 700 mmol/L BME. Protein samples (1.25 μg) were separated on a 4–20% gradient SDS-PAGE followed by staining with GelCode Blue Safe Protein Stain. Lane 1, molecular weight marker (kDa); lanes 2 and 3, RM 8671; lanes 4 and 5, NS0-59; lanes 6 and 7, NS0-60; lanes 8 and 9, NS0-66. mAb, full length antibody; HC, heavy chain; LC, light chain.
Size-Exclusion Chromatography (SEC)
SEC is an efficient method for monitoring low molecular weight (LMW) fragments and higher order aggregates such as dimers, trimers, and tetramers. SEC is a seemingly simple, yet critical and informative assay regarding product quality because increased high molecular weight (HMW) species content has been associated with the potential for immunogenicityCitation15,Citation16. A SEC method was previously qualified during RM 8671 value assignment, which yielded a typical mAb profile consisting of a dominant monomer peak, low abundance LMW and HMW species, and a void volume peak arising from the L-histidine buffer (elution time ≈ 6.25 minutes)Citation17. Chromatograms for RM 8671 and each of the non-originator materials are shown in . Each non-originator material demonstrated an increase in the multiplicity and relative abundance of HMW species (ranging from ≈ 4% to ≈ 9%, Supplementary Table S1), as well as a decrease in the LMW species originally identified in RM 8671 (peak at ≈ 5 min was decreased from ≈ 0.2% in RM 8671 to < 0.1% in the non-originator materials). The monomer peak demonstrated increased tailing as evident from the increased peak asymmetry (from ≈ 1.3 to 1.5, Supplementary Table S1). The increased peak tailing is likely due to the presence of relatively large fragments and/or disulfide variants that are unresolved by SEC, and is consistent with the low abundance species identified in SDS-PAGE (). Lastly, a new species was identified migrating at approximately 5.9 minutes. Preliminary evaluation of cell-free media subjected to downstream processing indicate the peak arises only in the presence of active cell expression. Additional fraction collection and MS analysis will be pursued in the future to conclusively identify this impurity; it was not included in relative abundance calculations in Supplementary Table S1. Differences in the SEC profile are therefore duly noted and considered herein when interpreting NMR, MS, and bioactivity data collected for the three non-originator materials.
Figure 3. Size-exclusion chromatograms of non-originator and RM 8671. A, NS0-59; B, NS0-60; C, NS0-66; D, RM 8671. HMW, high molecular weight; LMW, low molecular weight.
NMR Analysis
Therapeutic proteins are complex molecules that require maintenance of their higher order structure (HOS) (i.e., secondary, tertiary, and quaternary folds) for safety and efficacy. Biophysical tools are commonly used to characterize therapeutic proteins and evaluate their structure and stability, which informs a risk-based development strategy. Representative tools include the use of differential scanning calorimetry (DSC), which provides conformational stability data; circular dichroism and Fourier transform infrared spectrophotometry (FTIR), which informs on secondary structural elements; and tools that evaluate colloidal stability such as dynamic light scattering (DLS), SEC, and analytical ultracentrifugation (AUC)Citation18. An emerging tool for HOS characterization and similarity assessment is the use of two-dimensional (2D) NMRCitation19. NMR has the distinct advantage that it can simultaneously provide information on protein primary, secondary, and tertiary structure. While a comprehensive analytical similarity exercise would incorporate each of these techniques, among others, in this study we used NMR spectroscopy as an initial “catch all” evaluation method to determine the HOS of NISTmAb and the non-originator clone materials.
It has been previously demonstrated that acquiring high-resolution 1H-13C methyl NMR spectra on intact antibodies is feasible using PS 8670Citation20,Citation21. The RM 8671 is formulated at 10 mg/mL, a concentration that is too low for NMR analysis; therefore, spectral comparison was conducted versus PS 8670, which is available in higher concentrations. Accordingly, to assess the HOS of the NS0-59, NS0-60, and NS0-66, the protein samples from each cell line were analyzed using 1H-13C methyl NMR and compared to PS 8670 (). All three spectra displayed well dispersed, sharp resonances, which is characteristic of a folded protein in dynamic conformational equilibrium. Visual comparison of the spectra with that of a previously acquired reference spectrum on PS 8670 did not reveal any obvious differences in cross peak positions, suggesting that the production lots adopt the same major conformation as that of PS 8670 material.
Figure 4. 1H-13C gs-HSQC methyl spectra of PS 8670, NS0-59, NS0-60, and NS0-66.
NMR data were collected at 50°C on a 900 MHz spectrometer with a cryogenically cooled HCN triple resonance probe equipped with a z-axis gradient system as described in Materials and Methods. A, PS 8670; B, NS0-59; C, NS0-60; D, NS0-66.
A more in-depth comparison by direct point-to-point linear regression analysis of the spectral intensity matricesCitation6,Citation21 between the three NS0-produced antibodies gave a pairwise correlation coefficient range of 0.960–0.984. The correlation coefficient range of the three NS0- produced antibodies compared to PS 8670 was found to be on the same order, but slightly lower (0.949–0.973). 2D NMR has the capacity to define this structural heterogeneity with a greater degree of detail upon the resonance assignment of each peak. While not feasible with the current unlabeled samples, this is a future endeavor made possible by the availability of the current expression systems (see Discussion section below). In order to evaluate the chemical structural heterogeneity of the current samples in more detail, intact mass spectrometry was employed.
Intact Mass Spectrometry
High resolution intact mass spectrometry (HRMS) represents one of multiple orthogonal measurements of protein primary structureCitation10. It provides a rapid method for determining the average mass of a mAb, in addition to identifying moderate to high abundance PTMs and degradation products. Intact mass has the advantage over other middle down and peptide mapping approaches in that no sample preparation is required, thus allowing proteoform heterogeneity to be assessed at the intact level. It has been applied during clonal selection, process optimization, and as a component of analytical similarity assessmentsCitation22-Citation24. HRMS was therefore selected as an efficient method to compare the RM 8671 and the non-originator products with respect to major glycoforms and moderate to high abundance primary sequence modifications.
Deconvoluted intact HRMS spectra for RM 8671 and each of the non-originator materials are shown in . The “noise hump” (which was minimized with source/ion optics optimization for RM 8671) appears relatively high in the non-originator samples compared to RM 8671; however, closer examination of the Y-axis intensity reveals they are on the same order. The same protein load (based on A280) was analyzed for all four samples, and the lower apparent signal to noise is thought to be a result of increased heterogeneity in the non-originator samples, as will be discussed in more detail below. Peak identifications were made by comparing the measured zero-charge state mass to theoretical values based on purported amino acid/glycan compositions and calculated using the NIST Mass and Fragment calculator (Citation25) (Software available at https://www.nist.gov/services-resources/software/nist-mass-and-fragment-calculator-software).
Figure 5. Deconvoluted intact mass spectra of non-originator NISTmAbs and RM 8671.
Peaks marked with a * indicated the presence of a C-terminal lysine on the previous glycoform. Peaks with a number of 1-5 indicate the presence of a partially uncleaved Ser of the signal peptide (see ). A, NS0-59; B, NS0-60; C, NS0-66; D, RM 8671.
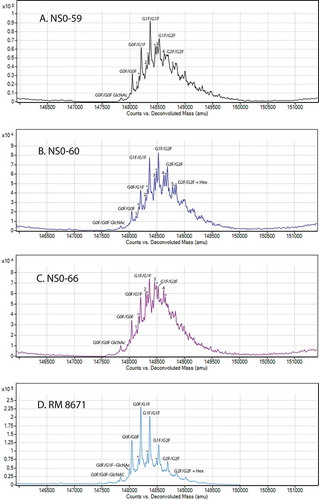
Previous studies of PS 8670 identified 3 major glycoforms as G0F/G0F, G0F/G1F, and G1F/G1F, each of which were consistent with 2 light chains, 2 heavy chains, the expected 16 disulfide bonds, N-terminal pyroglutamic acid on both heavy chains, and no C-terminal lysine on either heavy chainCitation10. A series of low to moderate abundance proteoforms were also identified that were consistent with the addition of C-terminal lysine and/or hexose residuesCitation10. Each of the assignments for RM 8671 in and is consistent with proteoforms previously observed for PS 8670Citation10 and was measured to within 50 ppm of the theoretical values ( and Supplementary Table S2).
Table 1. Measured molecular mass values for NISTmAb RM 8671 and non-originator lots NS0-59, NS0-60, and NS0-66.
The three main glycoforms (G0F/G0F, G0F/G1F, and G1F/G1F) are also present in each of the NS0-59, NS0-60, and NS0-66 non-originator lots. This commonality between the protein lots indicates the non-originator cell lines are producing a substantial quantity of proteoform consistent with that of RM 8671, including 2 heavy chains, 2 light chains, 16 disulfide bonds, and pyroglutamic acid at the N-terminus of both heavy chains. There is, however, a significant shift toward higher galactose content for each of the non-originator cell lines, the most dominant glycoform being G1F/G1F or G1F/G2F compared to the G0F/G1F in RM 8671. A series of proteoforms consistent with the addition of one C-terminal lysine are also observed in RM 8671 and all non-originator materials. Once again, these + Lys forms are present in higher relative abundance than observed for RM 8671 based on the HRMS measurements. Lastly, new peaks not present in RM 8671 were also observed. As discussed in the cell line development section above, these peaks likely correspond to an alternative cleavage site of the light chain signal peptide, which resulted in the addition of a serine residue on all of the non-originator lots. The addition of this residue can be seen on all major glycoforms of lots NS0-59, NS0-60, and NS0-66, as indicated by the numeric value of 1–5 represented in .
A decrease in relative peak intensity for all main “target” glycoforms was observed in each of the non-originator lots due to the altered glycoprofile, increase in %C-terminal lysine, and new alternative signal peptide cleavage peaks. In NS0-59 and NS0-60 the target proteoforms still have a high relative peak intensity, yet in NS0-66 the altered primary sequence variants begin to dominate. In this mass range, it is also possible that additional unresolved PTMs differ between the samples, including oxidation, deamidation, unpaired cysteines, and/or various combinations of glycoforms. This may have contributed to the lower signal to noise and the lower mass accuracy observed for some of the non-originator peaks.
Surface Plasmon Resonance (SPR) Binding Assays
Analytical characterization using SDS-PAGE, SEC, NMR, and intact mass spectrometry demonstrate the structural attributes of the non-originator materials resemble those of the NISTmAb, albeit with moderate differences. The degree to which these combined differences affect “biological activity” is a residual uncertainty, i.e., whether the non-originator molecules maintain some degree of functional capability. Receptor and antigen binding assays are commonly employed as a first-line readout that can be related, at least to some degree, to both functional activity and HOS. Two SPR assays were therefore developed to evaluate whether, despite these differences, the non-originator materials maintained the ability to bind known NISTmAb-binding receptors. The first assay utilized a peptidic epitope (NSELLSLINDMPITNDQKKLMSNN) known to bind with high-affinity to the NISTmAb complementarity-determining regionsCitation26. The second assay utilized a double-capture approach to immobilize the neonatal Fc receptor (FcRn), an interaction known to involve the Fc region and critical to pharmacokineticsCitation27. In both cases RM 8671 or non-originator materials were used as the mobile analyte.
Representative SPR sensorgrams for the peptidic epitope binding assay and FcRn binding assay are given in Supplementary Figures S2 and S3, respectively, along with steady state fit for RM 8671 and NS0-59, NS0-60, and NS0-66 non-originator materials. As given in , the equilibrium constant (Kd) of the non-originators NISTmAb to the peptide epitope was within the same order of magnitude as RM 8671, demonstrating only slightly weaker binding affinities. The Kd of RM 8671 was calculated to be 66 nmol/L while the non-originator clones ranged from 80 to 87 nmol/L, less than a 1.4 fold difference. FcRn binding affinity, which has been shown to correlate directly to biological half-life, is also shown in . The Kd for RM 8671 was calculated to be 212 nmol/L, while the non-originator clones ranged from 190 to 197 nmol/L, less than a 1.1 fold difference. Each of the non-originator clones are therefore capable of expressing functionally relevant molecules within the context of biological Fab and Fc binding activity.
Table 2. In vitro SPR binding data for NISTmAb RM 8671 and non-originator lots NS0-59, NS0-60, and NS0-66. (n = 3).
Discussion
Expression and Characterization
Expression using the non-originator cell lines was conducted in a shaker flask mode, which affords little process control capability other than the starting media, growth conditions, and cell density. This form of expression represents the earliest stage of bench-scale expression, and is reported herein to document the full lifecycle of the non-originator cell line development. Under these conditions, each of the NS0 clones were capable of expressing > 100 mg of antibody per L of culture. A series of analytical assays were then employed to characterize the non-originator materials and directly compare them to the NISTmAb. Each of the analytical assays employed revealed some level of structural difference, including increase in HMW aggregates, minor alterations in HOS, and an increase in the type and relative abundance of various sequence modifications and PTMs. These structural differences are not unexpected considering the use of non-originator expression systems and a different downstream purification process compared to the NISTmAb. Importantly, however, intact mass spectrometry demonstrated that the major NISTmAb proteoforms are also expressed in all corresponding non-originator lots. The integrity of the HOS is also largely consistent between the non-originator materials and the NISTmAb based on NMR. Finally, the non-originator materials have the capability to bind the NISTmAb peptidic epitope as well as the FcRn receptor. The collective analytical characterization is sufficient to demonstrate that, while analytical differences do exist, each of the non-originator clones is able to produce material with a reasonable degree of sameness to the NISTmAb and are suitable for further process optimization.
Outlook and Implications
The use of bioreactors capable of monitoring online process controls, such as dissolved oxygen, feed content, aeration and stir rates, are intended as the next stage of development to impart a more stringent level of process control. Requisite control parameters such as critical feed components and bioreactor settings may be identified and optimized via design of experiments studies. For example, a Placket-Burman design of experiments screened the contribution of 11 process variables to identify cell culture temperature and non-essential amino acids supplementation effects on glycan identity of an IgG3Citation28. An emerging field of process/product attribute correlation and more informative real-time feedback show promise for improved predictability of optimum conditions and reduces the risk for out of specification batchesCitation29. The NS0 cell lines described herein afford the opportunity to perform similar process/product correlation screenings and apply novel process sensors and feedback control systems on a pre-competitive test system. This has far-reaching implications for development of process control strategies and identification of effectors in an industry-relevant mAb model, affording a model test case to push the boundaries of process capabilities. Furthermore, advances in continuous processing and process analytical technology continue to grow. The future availability of the non-originator cell lines described herein offer a mechanism to invent, evaluate, and compare such technologies in the same manner as the RM 8671 is used for analytical technologies.
While the non-originator cell lines are primarily intended as an open innovation test case for upstream and downstream technology innovation, the obvious implications toward biosimilar-driven research warrant discussion. The FDA guidance on scientific considerations for demonstrating biosimilarity recommends a stepwise approach in which each milestone indicates sufficient similarity to proceed, with any residual uncertainty being resolved through a hierarchy of measurementsCitation30. In general, these steps can include demonstration of similarity with regard to structure and binding activity (analytical similarity), animal toxicity, human pharmacokinetics, and clinical safety and efficacyCitation30. Ultimately an intended biosimilar is granted biosimilar status upon demonstration that the “biological product is highly similar to the reference product notwithstanding minor differences in clinically inactive components” considering the totality of evidenceCitation31.
The NISTmAb and non-originator materials described herein are not intended for clinical use; therefore, they are most relevant to the analytical similarity stage of biosimilar development. Currently, the “goalpost” for analytical similarity is defined by the historical performance of the originator’s process and process changes/improvements via characterization of multiple commercial drug product lots to form an analytical target profile (ATP)Citation22,Citation23,Citation30,Citation32. The RM 8671 ATP is that of a single homogenized batch. Therefore, the target profile of the requisite product quality attributes will likely be small in comparison to a product whose lifecycle includes inevitable process changes. Such a system provides an analytical similarity challenge as the target is narrowed to the capability of current-state-of-the-art analytical characterization methods.
The ATP may include analytical characterization (e.g., primary structure, size variants, charge variants, glycosylation and other PTMs), biophysical characterization (HOS, colloidal stability, conformational stability), as well as biological characterization (e.g., in vitro binding studies, potency assays)Citation22,Citation23. The subset of analytical measurements we used to characterize the non-originator materials in this study demonstrated moderate differences. We suspect that, with further process optimizing (e.g., feed media, supplementation strategy, downstream purification) in one or more of these cell lines, a product with a higher degree of analytical similarity to the RM 8671 can be achieved. Extended characterization to include additional orthogonal analytical measurements combined with well-documented process history would provide a unique pre-competitive analytical similarity exercise.
The combination of RM 8671 with comprehensive non-originator cell line product characterization could also be used to develop novel mathematical and statistical models toward the goal of achieving fingerprint-like biosimilarity or comparability. An often overlooked aspect/reality of emerging PAT or end-product characterization technology is that the data format/type/processing of the analytical assay itself plays an inherent role in how a given method can be used. For example, in this study intact mass spectrometry and 2D NMR were inspected for visual sameness and qualitatively assessed where appropriate to highlight differences correlating to product quality attributes. Emerging multi-attribute methods such as LC-MS-based peptide mapping and 2D NMR provide the opportunity for more comprehensive structural information output. However, implementation of these multivariate technologies would benefit from additional examples demonstrating sensitivity, precision, and novel data handling/processing. This evolution is most certainly possible as demonstrated by the Pearson’s correlation coefficients used here to demonstrate a higher degree of similarity of the non-originator NS0-produced “self” correlations than to PS 8670. This represents a more quantitative treatment of 2D NMR data, and shows that similarity scoring is possible with highly informative, data rich analytical methods. It is expected that the NS0 cell lines described herein will be useful for the continued evaluation of method performance capabilities in parallel with novel data analytics, a pre-requisite to fully integrate and de-risk state-of-the art or emerging technologies into a comparability or biosimilarity scoring approach.
Many analytical platforms such as small angle neutron scattering, NMR, absolute protein quantification and internal standards for mass spectrometry-based approaches rely on the availability of stable isotope labeled materials, including 2H, 13C, 15N and 18O. The mammalian expression system described herein affords the opportunity to continue to hone production of such labeled materials and represents a resource to the development of novel technologies that may provide insight into the structural complexity of mAbs. Collectively, the addition of novel high-resolution techniques or those capable of quantitative information may reveal insight into what variation in a specific product quality attribute represents a truly clinically meaningful difference.
In conclusion, bench-scale expression coupled with a small subset of analytical methods was applied in the current study to evaluate the initial production lots of the non-originator NISTmAb-expressing clones. This exercise was not intended as a full process optimization or analytical similarity exercise, but rather to evaluate that the expression systems are indeed functional (reasonable expression titers) and express a product that resembles the NISTmAb to a reasonable degree. The current data clearly show differences in the product produced by each clone, and that each clone is initially expressing products with slightly altered attributes. Clone-specific product differences are expected and are congruent to the clonal selection stage of upstream process development. Transfer to controlled bioreactor expression, upstream and downstream process optimization, and parallel analytical characterization represent future steps in the proposed lifecycle of these non-originator cell lines. The NS0 lines described herein afford the opportunity to innovate in the pre-competitive space, opening a wealth of opportunity to foster collaboration and best practices in process development, control, and approaches to analytical similarity and comparability.
Materials and Methods
Cell Line Construction
NS0 cell lines expressing the NISTmAb were generated by BioFactura (Frederick, MD) using the amino acid sequence of the NISTmAb provided by NIST. The signal peptide used for expression of NISTmAb PS 8670 and RM 8671 was unknown, and therefore murine signal peptides were selected by BioFactura for the non-originator cell lines. The codons were optimized for mouse expression and the gene synthesis was subcontracted to a third party, GeneArt (Thermo Fisher Scientific). BioFactura followed their standard, proprietary protocol to generate the cell lines.
Cell Growth and mAb Expression
NS0-59 and NS0-66 cells were grown in Chemically Defined (CD) Hybridoma Medium (Gibco, Cat # 11279–023) supplemented with 2 mmol/L L-glutamine (Gibco, Cat # 25030081) and 10 mL/L of Minimum Essential Medium Non-essential amino acids solution (MEM NEAA) (100X) (Gibco, Cat # 11140–050). NS0-60 cells were grown in CD Hybridoma Medium (Gibco, Cat # 11279–023) supplemented with 10 mL/L GlutaMAX (100X) (Gibco, Cat # 35050–061), 10 mL/L MEM NEAA (100X) (Gibco, Cat # 11140–050), 1X insulin transferrin & ethanolamine (ITSE) (InVitria, Cat # 777ITS032), 0.5 ng/mL, recombinant human Interluekin 6 (IL-6) (Invitrogen, Cat # PHC0064) and 10 g/L bovine serum albumin fatty acid-free powder (BSA-FAF) (Sigma, Cat # A8806).
All three clones were grown at 37°C, 5% CO2 and 85% humidity with shaking on an orbital shaker at 100 rpm. One mL (one vial) of thawed cells was transferred into a 50 mL, sterile conical tube (Thermo Fisher Scientific, CAT # 339653), and containing 10 mL pre-warmed media with gentle agitation. After centrifuging the cells at 200 x gs for 5 min, the supernatant was decanted and the pellet was re-suspended in 12 mL media in a 75-mL cell culture T-flask with vented cap (Corning, Cat # 430641U). When cell density reached between 1.25 x 10⁶ to 1.5 x 10⁶ cells/mL they were scaled up to 25 mL in a 125-mL shake flask, polycarbonate, sterile with 0.2 μm Vent Cap and seeded at a cell density of 0.5 x 10⁶ cells/mL. This was followed by scaling up to 50 mL, 100 mL and 200 mL culture in 250 mL, 500 mL, and 1 L flasks, respectively. During growth and scale up, the cell viability was consistently between 85–95% with density as high as 3.0 x 10⁶ to 4.0 x 10⁶. For antibody production, the cells were grown until viability was below 20% and density lower than 1 × 10⁶ cells/mL, which usually took 7–10 days. At the end of the growth period, the cells from the 200 mL culture were collected by centrifugation at 200 × g for 5 min and the supernatant was transferred to a clean 250 mL centrifuge bottle and spun at 25,000 × g for 45 min. The supernatant was filtered and used for mAb purification.
Antibody Purification
The mAb were purified from the supernatant using a 5 mL HiTrap Protein-A HP column (GE Life Science, Cat # 17–0403-01). The supernatant was loaded on a column pre-equilibrated with 25 mL of binding buffer [20 mmol/L sodium phosphate (pH 7.2) and 0.15 mol/L NaCl] at 5 mL/min. After loading the proteins supernatant, the column was washed with 3 column volumes of binding buffer. The mAbs were eluted from the column in 25 mL of eluant [100 mmol/L sodium citrate (pH 3.0–3.6)]. One mL fractions were collected into tubes containing 200 µL of 1 mol/L Tris-HCl (pH 9.0) to neutralize 3 column volumes of eluant The fractions containing the mAb were pooled and extensively dialyzed (2 X 4L) against buffer containing 12.5 mmol/L L-His, 12.5 mmol/L L-His HCL, pH 6.0 (formulation buffer).
When the purified mAb concentration was low, the proteins were concentrated using Sartorius Vivaspin 20 Centrifugal, polyethersulfone (PES) membrane, 10 kDa molecular weight cutoff.
The final protein concentrations were measured using a microvolume spectrophotometer (Nanodrop, Thermo Fisher Scientific, Willington, DE). Samples of L-His formulation buffer were used as blank. Absorption measurements performed at 280 nm were used along with a theoretical extinction coefficient (ε) of 1.45 (mL mg–1 cm–1) and determined to be 3.75, 2.50, 4.20 mg/mL for NISTmAb produced by clones 59, 60, and 66, respectively.
NISTmAb Reference Samples
Analytical analysis was performed on either the NISTmAb primary sample (PS 8670) or the NISTmAb Reference Material (RM 8671 lot 14HB-D-002) for comparison to the non-originator samples. PS 8670 is derived from a single production lot of NISTmAb and was reserved as the in-house primary standard, whereas RM 8671 was pooled from multiple production lots and is the publicly available Reference Material. PS 8670Citation4 was used for NMR experiments because it is available at higher concentrations (100 mg/mL and 10 mg/mL) and RM 8671 (10 mg/mL) was used for all other analyses. A detailed comparison of the two lots using a variety of analytical techniques was recently publishedCitation5.
SDS-PAGE Analysis
For SDS-PAGE analysis, 1.25 µg of each protein was fractionated on a 4–20% precast gel (Bio-Rad, Cat # 456–1094). The samples were prepared in the presence or absence of 700 mmol/L β-mercaptoethanol (BME) and boiled for 5 min prior to loading onto the gel. The gel was run at 200 V for 30 min followed by staining with GelCode Blue Safe Protein Stain (Thermo Fisher Scientific, Cat #: 24594).
SEC Analysis
SEC was performed according to a previously qualified methodCitation17. Briefly, all samples were analyzed on a Thermo Fisher Scientific/Dionex U3000 high-pressure liquid chromatography system using isocratic elution (100 mmol/L sodium phosphate supplemented with 250 mmol/L sodium chloride, pH 6.8) at 0.30 mL/min and monitored at 280 nm. Each sample was injected neat and equivalent to 60 µg of protein, with no dilution or buffer exchange, onto an Acquity UPLC Protein BEH SEC Column from Waters (1.7 µm particle size, 200 Å pore size, 4.6 x 150 mm length). NISTmAb RM 8671 lot 14HB-D-002 concentration was previously determined to be 10.0 mg/mL; therefore, 6 µL was injected. Injection volumes for each of the following clones were based on the UV measurements described above and are as follows; clone 59 (16 µL), clone 60 (25 µL), and clone 66 (14.3 µL).
NMR Analysis
The purified NS0-produced proteins were concentrated to 30 mg/mL by centrifugal filtration using a 100 kDa molecular weight cutoff, while PS-8670 was diluted to 30 mg/mL in 12.5 mmol/L L-histidine/12.5 mmol/L L-histidine HCl. All NMR data were collected at 50°C on a Bruker Avance III 900 MHz spectrometer with cryogenically cooled HCN triple resonance probe equipped with a z-axis gradient system. 1H-13C methyl datasets were acquired using a gradient-selected Heteronuclear Single Quantum Coherence (gs-HSQC) experiment with 64 scans per transient, 128 steady state scans and a recycle delay of 1.5 s. The spectra were recorded with 120 × 2018 complex points, corresponding to acquisition times of 10 ms and 80 ms, over spectral widths of 26.5 and 14 ppm in the F1 and F2 domains, respectively. The 13C carrier was placed at 21.25 ppm, while the 1H carrier was placed on the water resonance. Total experimental time for each spectrum was 3.5 hrs. All data were processed with apodization using a shifted sine-square bell and zero-filling in both dimensions and time-domain doubling by linear prediction in the indirect domain prior to Fourier Transform, resulting in a final data matrix of 512 × 4096 complex points.
Intact Mass Spectrometry
All analyses were performed on Agilent Technologies 1200 Infinity II series liquid chromatography system coupled to an Agilent 6545 Accurate-Mass Q-TOF LC/MS. Separation was performed on a Polymeric Reversed Phase (PLRP-S) Column (5 µm particle size, 1000 Å pore size, 50 × 2.1 mm length, Agilent Technologies PN PL1912-1502). 0.1% formic acid in acetonitrile (PN LS120) and 0.1% formic acid in water (PN LS118) were from Fisher Scientific. Vials (PN 5188–6591) and vial caps (PN 5182–0717) were from Agilent Technologies. ESI-L tune mix (PN G1969-85000) and ES-TOF biopolymer reference mass kit (PN G1969-85003) were from Agilent Technologies.
Non-originator samples NS0-59, NS0-60, and NS0-66 were prepared as described above. Samples were removed from the −80°C freezer and placed on the bench to thaw. Samples were thawed at least 30 min at room temperature and inverted 5 times with brief centrifuging between each inversion to ensure homogeneity of the sample. Samples were then diluted to a 1 mg/mL solution using 0.1% formic acid in water.
All samples were analyzed on the Agilent Technologies 6545 Accurate-Mass Q-TOF LC/MS system. For the analysis of both NISTmAb and non-originator samples, the 1mg/mL dilution was made and a 1 µg aliquot was injected at flow rate of 0.4 mL/min (mobile phase A = 0.1% formic acid in water and mobile phase B = 0.1% formic acid in acetonitrile). The initial conditions of 5% B were held for 2 minutes, followed by a linear gradient of 5% to 80% B over 2 minutes. The column was held at 80% B for an additional 3 minutes, adjusted to 5% B over 2 minutes, and allowed to equilibrate for 4 minutes prior to the next run. Mass analysis of the protein was performed in high mass using a mass range of 500–5,000 m/z and the following instrument parameters: gas temperature 350°C, dry gas 8 L/min, nebulizer 45 psig, capillary voltage 5000 V, fragmentor 400V, skimmer voltage 65V, and sheath gas temperature 275°C. Instrument calibration was performed with Agilent ESI-L tune mix followed by reference ion calibration at m/z 1221.9906. Theoretical mass values were calculated using the NIST Mass and Fragment Calculator 25. Deconvolution of mass spectra was performed using the protein deconvolution feature of MassHunter Bioconfirm 7 software and the maximum entropy algorithm.
SPR Binding
SPR experiments were performed using a Biacore T100 system (GE Healthcare) with analysis temperature set to 25°C and sample compartment temperature set to 15°C. Series S Sensor Chip SA, Series S Sensor Chip CAP, PBS-P+ Buffer 10x [0.2 mol/L phosphate buffer with 27 mmol/L KCl, 1.37 mol/L NaCl and 0.5% v/v Surfactant P20 (Tween 20)], HBS-EP+ Buffer 10x [0.1 mol/L HEPES, 1.5 mol/L NaCl, 0.03 mol/L EDTA and 0.5% v/v Surfactant P20 (Tween 20)], and Biotin CAPture Kit were all obtained from GE Healthcare. A peptidic epitope of the NISTmAb with the sequence NSELLSLINDMPITNDQKKLMSNN and N-terminal acetylation, C-terminal amidation, and a C-terminal biotinylated lysine residue was synthesized by Genscipt. Recombinant biotinylated human FcRn-B2m complex was purchased from ACRO Biosystems (PN FCM-H82W4).
Antibody-peptide binding measurements were conducted using the streptavidin-immobilized SA chip. Biotinylated peptidic epitope (0.2 µg/µL) was injected for 30 s at a flow rate of 5 µL/min and was affinity captured on the SA chip to a final surface density of 15 resonance units (RU). NISTmAb RM 8671 or non-originator analytes were diluted in sample buffer (HBS EP+ pH 7.4) and flowed over the peptide-coated SA chip at a flow rate of 50 µL/min and at the following concentrations: 1.56, 3.13, 6.25, 12.5, 25, 50, 100, 200 nmol/L. The complex was allowed to associate and dissociate for 200 s and 400 s, respectively. Following the association and dissociation phases of the experiment, the chip was regenerated using a 30 s injection 100 mmol/L HCl prior to the next cycle. Assays were performed in triplicate and the average steady state Kd value and standard deviation for each were calculated. The resulting sensorgrams were double reference subtracted and fit to steady-state affinity models using the Biacore T100 Evaluation Software.
Antibody FcRn binding measurements were conducted using a double-capture method via the oligonucleotide-immobilized CAP sensor chip, Biotin CAPture reagent (streptavidin bound to an oligonucleotide complementary to the strand on the CAP chip), and the biotin-labeled FcRn-B2m. Biotin capture reagent was injected for 200 s at a flow rate of 2 µL/min to capture approximately 2800 RU, followed by a 60 s injection at 5 µL/min of biotinylated human FcRn-B2m complex (0.5 ng/µL) to give a capture level of 85–95 RU. RM 8671 or non-originator analytes were diluted in sample buffer (PBS-P+ pH 6.0) and flowed over the FcRn-B2m coated CAP chip at a flow rate of 40 µL/min and at the following concentrations: 15.63, 31.25, 62.5, 125, 250, 500 nmol/L. The complex was allowed to associate and dissociate for 60 s each. Following the association and dissociation phases of the experiment, the chip was regenerated using a 30 s injection of PBS-P+, pH 7.4 prior to the next cycle. After completion of a full concentration cycle (15.63–500 nmol/L) the chip was regenerated with an injection of regeneration buffer 1 for 120 s (6 mol/L guanidine-HCl, 0.25 mol/L NaOH) and injection of regeneration buffer 2 for 120 s (30% acetonitrile in 0.25 mol/L NaOH). Assays were performed in triplicate and the average steady state Kd value and standard deviation for each were calculated. The resulting sensorgrams were double reference subtracted and fit to steady-state affinity models using the Biacore T100 Evaluation Software.
Abbreviations
| 2D | = | two-dimensional |
| AUC | = | analytical ultracentrifugation |
| BME | = | β-mercaptoethanol |
| DLS | = | dynamic light scattering |
| DSC | = | differential scanning calorimetry |
| FcRn | = | neonatal Fc receptor |
| FDA | = | Food and Drug Administration |
| FTIR | = | Fourier transform infrared spectrophotometry |
| HMW | = | high molecular weight |
| HOS | = | higher order structure |
| HRMS | = | high resolution intact mass spectrometry |
| LMW | = | low molecular weight |
| mAb | = | monoclonal antibody |
| MS | = | mass spectrometry |
| NMR | = | nuclear magnetic resonance spectroscopy |
| NIST | = | National Institute of Standards and Technology |
| NISTmAb | = | NIST monoclonal antibody |
| PQA | = | product quality attribute |
| PS | = | primary sample |
| PTM | = | post-translational modification |
| RM | = | reference material |
| SDS-PAGE | = | sodium dodecyl sulfate polyacrylamide gel electrophoresis |
| SEC | = | size-exclusion chromatography |
| SPR | = | surface plasmon resonance |
Disclaimer
Users should always refer to the Report of Investigation (https://www-s.nist.gov/srmors/view_detail.cfm?srm=8671) for their specific material lot for the most up to date values and uncertainty ranges. Certain commercial equipment, instruments, or materials are identified to adequately specify the experimental procedure. Such identification does not imply recommendation or endorsement by the National Institute of Standards and Technology, nor does it imply that the materials or equipment identified are necessarily the best available for the purpose.
Supplemental Material
Download MS Word (654.4 KB)Supplementary Material
Supplemental data for this article can be accessed here.
Additional information
Funding
References
- Monoclonal Antibodies - Global Trends in the Competitive, Technological and R&D Landscape. ReportBuyer Ltd, Kent, United Kingdom, October 2017, Report ID: 5174167
- Walsh G. 2014. Biopharmaceutical benchmarks 2014. Nature Biotechnol. 32:992–1000. doi:10.1038/nbt.3040.
- Rathore D, Faustino A, Schiel J, Pang E, Boyne M, Rogstad S. 2018. The role of mass spectrometry in the characterization of biologic protein products. Expert Rev Proteomics. 15:431–449. doi:10.1080/14789450.2018.1469982.
- Schiel JE, Turner A. 2018. The NISTmAb Reference Material 8671 lifecycle management and quality plan. Anal Bioanal Chem. 410:2067–2078. doi:10.1007/s00216-017-0844-2.
- Schiel JE, Turner A, Mouchahoir T, Yandrofski K, Telikepalli S, King J, DeRose P, Ripple D, Phinney K. The NISTmAb Reference Material 8671 value assignment, homogeneity, and stability. Anal Bioanal Chem. 2018;410:2127–2139. doi:10.1007/s00216-017-0800-1.
- Arbogast LW, Brinson RG, Formolo T, Hoopes JT, Marino JP. 2016. 2D 1HN, 15N correlated NMR methods at natural abundance for obtaining structural maps and statistical comparability of monoclonal antibodies. Pharm Res. 33:462–475. doi:10.1007/s11095-015-1802-3.
- Arbogast LW, Delaglio F, Schiel JE, Marino JP. 2017. Multivariate Analysis of two-dimensional 1H, 13C methyl NMR spectra of monoclonal antibody therapeutics to facilitate assessment of higher order structure. Anal Chem. 89:11839–11845. doi:10.1021/acs.analchem.7b03571.
- Castellanos MM, Howell SC, Gallagher DT, Curtis JE. 2018. Characterization of the NISTmAb Reference Material using small-angle scattering and molecular simulation: part I: dilute protein solutions. Anal Bioanal Chem. 410:2141–2159. doi:10.1007/s00216-018-0868-2.
- Castellanos MM, Mattison K, Krueger S, Curtis JE. 2018. Characterization of the NISTmAb Reference Material using small-angle scattering and molecular simulation: part II: concentrated protein solutions. Anal Bioanal Chem. 410:2161–2171. doi:10.1007/s00216-018-0869-1.
- Formolo T, Ly M, Levy M, Kilpatrick L, Lute SC, Phinney K, Marzilli L, Brorson K, Boyne M, Davis D, et al. Determination of the NISTmAb primary structure. In: Schiel JE, Davis DL, Borisov OB, editors. State-of-the-art and emerging technologies for therapeutic monoclonal antibody characterization volume 2 biopharmaceutical characterization: the NISTmAb case study. ACS Symposium Series 1201. American Chemical Society; 2015. p. 1–62.
- Mouchahoir T, Schiel JE. 2018. Development of an LC-MS/MS peptide mapping protocol for the NISTmAb. Anal Bioanal Chem. 410:2111–2126. doi:10.1007/s00216-018-0848-6.
- Petersen TN, Brunak S, Von Heijne G, Nielsen H, Signal P. 2011. 4.0: discriminating signal peptides from transmembrane regions. Nat Methods. 8:785–786. doi:10.1038/nmeth.1701.
- Tarrant RD, Velez-Suberbie ML, Tait AS, Smales CM, Bracewell DG. 2012. Host cell protein adsorption characteristics during protein A chromatography. Biotechnol Prog. 28:1037–1044. doi:10.1002/btpr.1581.
- Michels DA, Ip AY, Dillon TM, Brorson K, Lute SC, Chavez BK, Prentice KM, Brady LJ, Miller KJ. Separation methods and orthogonal techniques. In: Schiel JE, Davis DL, Borisov OB, editors. State-of-the-Art and Emerging Technologies for Therapeutic Monoclonal Antibody Characterization Volume 2 Biopharmaceutical Characterization: The NISTmAb Case Study. ACS Symposium Series 1201. American Chemical Society; 2015. p. 237–284.
- Luo Y, Raso SW, Gallant J, Steinmeyer C, Mabuchi Y, Lu Z, Entrican C, Rouse JC. Evidence for intermolecular domain exchange in the Fab domains of dimer and oligomers of an IgG1 monoclonal antibody. mAbs. 2017;9(6):916–926.
- Rosenberg AS. 2006. Effects of protein aggregates: an immunologic perspective. AAPS J. 8:E501–7. doi:10.1208/aapsj080359.
- Turner A, Yandrofski K, Telikepalli S, King J, Heckert A, Filliben J, Ripple D, Schiel JE. Development of orthogonal NISTmAb size heterogeneity control methods. Anal Bioanal Chem. 2018;410(8):2095–2110.
- Gokarn Y, Agarwal S, Arthur K, Bepperling A, Day ES, Filoti D, Greene DG, Hayes D, Kroe-Barrett R, Laue T, et al. Biophysical techniques for characterizing the higher order structure and interactions of monoclonal antibodies. In: Schiel JE, Davis DL, Borisov OB, editors. State-of-the-Art and Emerging Technologies for Therapeutic Monoclonal Antibody Characterization Volume 2 Biopharmaceutical Characterization: The NISTmAb Case Study. ACS Symposium Series 1201. American Chemical Society; 2015. p. 285–327.
- Marino JP, Brinson RG, Hudgens JW, Ladner JE, Gallagher DT, Gallagher ES, Arbogast LW, Huang RYC. Emerging technologies to assess the higher order structure of monoclonal antibodies. In: Schiel JE, Davis DL, Borisov OB, editors. State-of-the-Art and Emerging Technologies for Therapeutic Monoclonal Antibody Characterization Volume 3 Defining the Next Generation of Analytical and Biophysical Techniques. ACS Symposium Series 1202. American Chemical Society; 2015. p. 17–43.
- Arbogast LW, Brinson RG, Marino JP. 2015. Mapping monoclonal antibody structure by 2D 13C NMR at natural abundance. Anal Chem. 87:3556–3561. doi:10.1021/ac504804m.
- Arbogast LW, Brinson RG, Marino JP. 2016. Application of natural isotopic abundance 1H-13C- and 1H-15N-correlated two-dimensional NMR for evaluation of the structure of protein therapeutics. Methods Enzymol. 566:3–34. doi:10.1016/bs.mie.2015.09.037.
- Bandyopadhyay S, Mahajan M, Mehta T, Singh A, Parikh A, Gupta A, Kalita P, Patel M, Mediratta S. Physicochemical and functional characterization of a biosimilar adalimumab ZRC-3197. Biosimilars. 2015;5:1–18.
- Liu J, Eris T, Li C, Cao S, Kuhns S. 2016. Assessing analytical similarity of proposed amgen biosimilar ABP 501 to Adalimumab. BioDrugs. 30:321–338. doi:10.1007/s40259-016-0184-3.
- Sandra K, Steenbeke M, Vandenheede I, Vanhoenacker G, Sandra P. 2017. The versatility of heart-cutting and comprehensive two-dimensional liquid chromatography in monoclonal antibody clone selection. J Chromatogr A. 1523:283–292. doi:10.1016/j.chroma.2017.06.052.
- Kilpatrick EL, Liao WL, Camara JE, Turko IV, Bunk DM. 2012. Expression and characterization of 15N-labeled human C-reactive protein in Escherichia coli and Pichia pastoris for use in isotope-dilution mass spectrometry. Protein Expr Purif. 85:94–99. doi:10.1016/j.pep.2012.06.019.
- McGivney JBt, Bishop E, Miller K, Casas-Finet J, Yang H, Wei Z, Strouse R, Schenerman M. Evaluation of a synthetic peptide as a replacement for the recombinant fusion protein of respiratory syncytial virus in a potency ELISA. J Pharm Biomed Anal. 2011;54(3):572–576.
- Gao X, Ji JA, Veeravalli K, Wang YJ, Zhang T, McGreevy W, Zheng K, Kelley RF, Laird MW, Liu J, et al. Effect of individual Fc methionine oxidation on FcRn binding: Met252 oxidation impairs FcRn binding more profoundly than Met428 oxidation. J Pharm Sci. 2015;104(2):368–377.
- Agarabi CD, Schiel JE, Lute SC, Chavez BK, Boyne MT, 2nd, Brorson KA, Khan MA, Read EK. Bioreactor process parameter screening utilizing a Plackett-Burman design for a model monoclonal antibody. J Pharm Sci. 2015;104(6):1919–1928.
- Sommeregger W, Sissolak B, Kandra K, von Stosch M, Mayer M, Striedner G. Quality by control: Towards model predictive control of mammalian cell culture bioprocesses. Biotechnol J. 2017;12(7):1600546.
- US FDA. Guidance for industry: Scientific considerations in demonstrating biosimilarity to a reference product. Maryland: FDA; 2015.
- US FDA. Quality considerations in demonstrating biosimilarity of a therapeutic protein product to a reference product. Maryland: FDA; 2015.
- Chow SC, Song F, Bai H. 2017. Sample size requirement in analytical studies for similarity assessment. J Biopharm Stat. 27:233–238. doi:10.1080/10543406.2016.1265545.