
ABSTRACT
Bispecific antibodies are an emergent class of biologics that is of increasing interest for therapeutic applications. In one bispecific antibody format, single-chain variable fragments (scFv) are linked to or inserted in different locations of an intact immunoglobulin G (IgG) molecule to confer dual epitope binding. To improve biochemical stability, cysteine residues are often engineered on the heavy- and light-chain regions of the scFv to form an intrachain disulfide bond. Although this disulfide bond often improves stability, it can also introduce unexpected challenges to manufacturing or development. We report size variants that were observed for an appended scFv-IgG bispecific antibody. Structural characterization studies showed that the size variants resulted from the engineered disulfide bond on the scFv, whereby the engineered disulfide was found to be either open or unable to form an intrachain disulfide bond due to cysteinylation or glutathionylation of the cysteines. Furthermore, the scFv engineered cysteines also formed intermolecular disulfide bonds, leading to the formation of highly stable dimers and aggregates. Because both the monomer variants and dimers showed lower bioactivity, they were considered to be product-related impurities that must be monitored and controlled. To this end, we developed and optimized a robust, precise, and accurate high-resolution size-exclusion chromatographic method, using a statistical design-of-experiments methodology.
Introduction
Since the first recombinant antibody product, Orthoclone OKT3, was approved by the US Food and Drug Administration (FDA) in 1986, nearly 80 antibodies and fusion proteins have been approved in the United States, Europe, and Japan.Citation1 Eight of the 10 best-selling innovative drugs worldwide in 2016 were antibody or fusion protein biologics.Citation1 This clinical and commercial success has fueled interest in further developing biologics for therapeutic applications. In recent years, novel molecular formats, such as antibody-drug conjugates and bispecific antibodies, have entered clinical studies and received FDA approval. Although bispecific antibodies were first identified in the 1960s,Citation2–Citation6 their therapeutic application was not feasible until the 2000s due to technical challenges in expressing and purifying these formats.Citation7–Citation15 As of 2017, there were approximately 60 bispecific antibodies in clinical studiesCitation1 and two bispecific antibodies with FDA approval: Blincyto® (blinatumomab, Amgen/Micromet; approved in 2014), and Hemlibra® (emicizumab-kxwh, Chugai/Genentech; approved in 2017). In addition, Removab® (catumaxomab, Fresenius/Trion) was approved in the European Union in 2009; this product is no longer on the market in the EU.
More than 100 bispecific antibody formats have been reported in the literature.Citation9,Citation11 This diversity is the result of a large number of bispecific “building blocks” that include antigen-binding fragments (Fabs), single-chain variable fragments (scFvs), and receptor ligands. Bispecific antibody formats can be broadly classified into three groups. Constructions of these three different groups of bispecific antibody formats are shown in Supplementary Figure S1. Those in the first group do not possess fragment crystallizable (Fc) regions (i.e., are Fc-less) and have two antigen-binding sites connected by a flexible linker (e.g., Blincyto®).Citation16–Citation19 The second group consists of immunoglobulin G (IgG)-like bispecific antibodies with an asymmetrical architecture in which the two binding arms of the antibody have different targets, and hence different structures (e.g., Removab® and Hemlibra®).Citation20–Citation23 The third group comprises appended IgGs with symmetrical architecture, in which the second binding site is fused to either the IgG heavy or light chain. This format was first reported by Coloma and Morrison in 1997.Citation24 Since then, the secondary binding site, often in an scFv format, has been fused to the C terminus/N terminus of the heavy chain, the hinge region, the C terminus/N terminus of the light chain, the CH3 domain of the heavy chain, or other regions.Citation25–Citation27
Two principal challenges for appended IgG bispecific antibodies lie in the need to maintain high binding affinity of the appended scFv and biochemical stability. To overcome these challenges, several strategies are commonly utilized, including: 1) introducing flexible linkers between the heavy-chain variable (VH) and the light-chain variable (VL) domains to maintain intrinsic binding and stability of the scFv,Citation28–Citation30 2) introducing an additional disulfide bond between the VH and VL domains,Citation15,Citation31 and 3) selecting scFvs with improved stability early in the protein engineering process.Citation32 The use of these engineering strategies, which have the chief objective to improve stability and binding, must be balanced against other undesirable consequences, such as lower expression levels and poor expression fidelity.
Here, we report novel size variants resulting from introduction of the engineered disulfide bond between scFv VH and VL domains. Structural characterization studies revealed that the size variants were due to either opened engineered scFv disulfide bonds with concomitant cysteine/glutathione capping on the engineered cysteinesCitation33-Citation35 or stable dimers formed by intermolecular disulfide bonds. We also describe a convenient approach to monitor and control these size variants with high-resolution size-exclusion chromatography (SEC).
Results
Enrichment and bioactivity of Bis-A size variants
Bis-A is a symmetrical bispecific antibody with an appended scFv inserted into the middle of the CH3 domain. A substantial percentage of size variants (~ 50%) were observed in our studies (). Enriched fractions (1, 2, and 3) were obtained by using preparative SEC, and each was analyzed by high-performance SEC for purity ().
Figure 1. SEC chromatograms of Bis-A on an Aquity BEH SEC-200 column. (A) SEC of Bis-A affinity purified Protein A product pool. (B) SEC overlay of enriched fractions 1 (black), 2 (red), and 3 (blue).
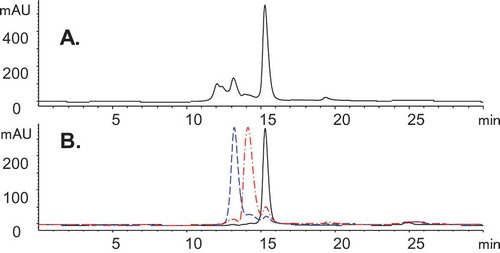
Bioactivity testing was performed for all three fractions () using three independent bioassays: 1) Fab, 2) scFv, and 3) a dual target, which included both Fab and scFv. Although all fractions maintained full Fab activity (the Fab activity for fraction 3 appears to be higher compared with the reference standard because its plateau is higher than that of the reference standard), the scFv activity of fractions 2 and 3 were attenuated in comparison with fraction 1 and the control. Consistent with these results, the dual-target bioactivity of fraction 1 was fully maintained, but both fractions 2 and 3 showed reduced dual-target activity, presumably due to their affected scFv.
Table 1. Bioactivity of Bis-A size variants.
Characterization of enriched fraction 2
Intact and reduced mass analysis
Intact mass analysis was performed on all three Bis-A enriched fractions. The mass spectra and deconvoluted masses are shown in and . Fraction 1 was confirmed as a Bis-A monomer with an intact mass of 204,365 Da, matching the theoretical mass of 204,364 Da (with G0f/G0f glycans) (). Fraction 2 was identified as a monomer variant based on the masses that are several hundred Daltons higher than the monomer (fraction 1) (). The masses observed in fraction 2 were not well resolved due to a high degree of heterogeneity. Reduced mass analysis was also performed on all three fractions (). After reduction, no mass difference between fraction 1 and fraction 2 was detected, suggesting that the modifications of fraction 2 occurred through cysteines and were reducible.
Figure 2. Intact and reduced mass analysis of Bis-A enriched fractions. (A1) Mass spectrum of intact fraction 1; (A2) mass spectrum of intact fraction 2; (A3) mass spectrum of intact fraction 3; (B1) intact mass of fraction 1; (B2) intact mass of fraction 2; (B3) intact mass of fraction 3 (B3); (C1) ion chromatogram of reduced fraction 1; (C2) ion chromatogram of fraction 2; (C3) ion chromatogram of fraction 3.

Ides and ides (or igde)/pngase f/cpb multi-enzyme digestion
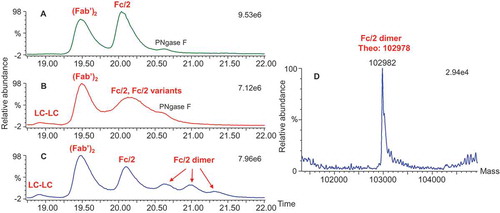
To determine whether modifications occurred on the Fab or the Fc of Bis-A, proteolytic cleavage by IdeS (FabRICATOR) was performed on all three fractions. IdeS is a unique enzyme that, under non-reducing conditions, cleaves the heavy chains below the hinge disulfide bonds (…CPPCPAPELLG/GPSVF…), yielding one F(ab′)2 and two half Fc (Fc/2) fragments. Deconvoluted mass spectra of F(ab′)2 and Fc/2 fragments of fractions 1, 2, and 3 are shown in , , and , respectively. The F(ab′)2 masses for fractions 1 and 2 were identical and matched the theoretical mass (). The mass difference of the Fc/2 fragment between fractions 1 and 2 ( and ) indicated that the modification in fraction 2 occurred on the Fc. However, when digested by IdeS only, the Fc/2 fragment mass profile from fraction 2 still showed a high degree of complexity, in part due to heterogeneities related to N-glycosylation and C-Lys in the Fc region (). This N-glycosylation and C-Lys complex was also observed in the Fc/2 fragment of fraction 1 ().
Figure 3. IdeS digestion scheme and masses of (Fab′)2 and Fc/2 after IdeS digestion. (A1) (Fab′)2 of fraction 1; (A2) (Fab′)2 of fraction 2; (A3) (Fab′)2 of fraction 3; (B1) Fc/2 of fraction 1 after IdeS digestion; (B2) Fc/2 of fraction 2 after IdeS digestion; (B3) Fc/2 of fraction 3 after IdeS digestion; (C1) Fc/2 of fraction 1 after IdeS/PNGase F/CpB digestion; (C2) Fc/2 of fraction 2 after IdeS/PNGase F/CpB digestion; (C3) Fc/2 of fraction 3 after IdeS/PNGase F/CpB digestion.
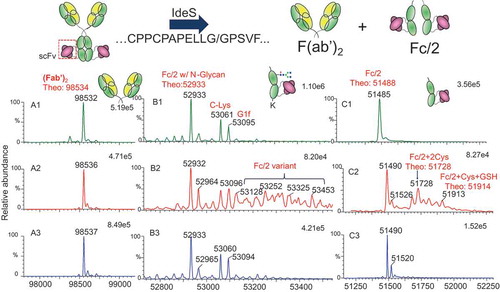
To further elucidate the structure of the Fc/2 fragment of fraction 2, multi-enzyme digestion using IdeS, peptide N–glycosidase F (PNGase F), and carboxypeptidase B (CpB) (in sequence) was performed, and digests were analyzed by liquid chromatography (LC)–mass spectrometry (MS). Removal of the heavy-chain N-glycosylation and C-terminal Lys reduced the complexity of the Fc/2 fragment mass profile (). The Fc/2 fragment of fraction 1 had a single mass of 51,485 Da, consistent with the theoretical mass of the Fc/2 fragment of Bis-A (). In addition to the Fc/2 fragment of fraction 2, modifications with masses matching Fc/2 + 2Cys and Fc/2 + 1Cys + 1GSH were also detected.
To determine whether modifications occurred on both or only one of the Fc/2 fragments of Bis-A, IgdE (FabALACTICA) digestion was performed. IgdE is a cysteine protease that cleaves the heavy chains above the hinge disulfide bonds (…KSCDKT/HTCPPC…), yielding two identical Fabs and one Fc fragment. After IgdE digestion, samples were treated with PNGase F and CpB to reduce heterogeneity arising from N-glycosylation and C-terminal lysine. Results of LC-MS analysis of fractions 1 and 2 treated with IgdE/PNGase F/CpB are shown in Supplementary Fig. S2. The Fc mass of fraction 1 was 105,606 Da (Fig. S2B1), matching the theoretical mass of the expected Fc structure. In contrast, the major observed masses for fraction 2 corresponded to an Fc with four additional cysteines and an Fc with two additional cysteines (Fig. S2B2), and the theoretical Fc mass was not detected. In addition, low levels of an Fc with two glutathiones and an Fc with one additional cysteine and two glutathiones were observed. These data suggest that fraction 2 is a mixture of Bis-A with two or four additional cysteines, as well as Bis-A with some additional combinations of low-level cysteines/glutathiones on the Fc. Detailed data are provided in Supplementary Fig. S2.
Structural characterization with nonreduced peptide mapping
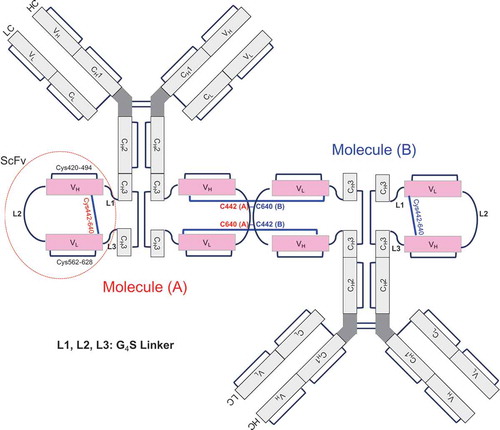
From the results just described, we determined that modifications of fraction 2 were in the Fc region through disulfide bond–linked cysteines that were reducible. In Bis-A, scFv is inserted into an intrachain disulfide bond in the CH3 domain, adding three more disulfide bonds (one from the VH of scFv, one from the VL of scFv, and one from the engineered stabilizing disulfide bond linking VH and VL). Therefore, after scFv insertion, Bis-A had a total of four instead of only one intrachain disulfide bond in the CH3 domain. If cysteines were numbered from the N to the C terminus, the four intrachain disulfide bond linkages in the CH3 domain were as follows: 1) a CH3 intrachain disulfide bond (Cys371-698) in which an scFv was inserted, 2) an scFv VH intrachain disulfide bond (Cys420-494), 3) an scFv VL intrachain disulfide bond (Cys562-628), and 4) an engineered stabilizing disulfide bond (Cys442-640) linking the VH and VL in scFv. In this study, a disulfide bond linkage that was between the light chain and the heavy chain of Bis-A is referred to as an “interchain disulfide bond,” and a disulfide bond linkage that was within the light chain or the heavy chain of Bis-A is referred to as an “intrachain disulfide bond.” Because the scFv is inserted into one heavy chain in Bis-A, all disulfide bonds within the scFv, including the engineered disulfide bond linking the VH and VL (Cys442–640), are referred to as “intrachain disulfide bonds.”
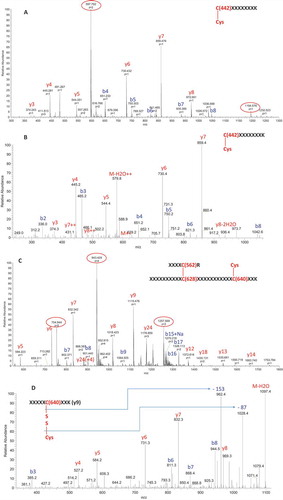
To determine which cysteines constituted the modification sites on the Fc fragments, we performed nonreduced peptide mapping. shows the ultraviolet chromatograms of nonreduced peptide mapping of fractions 1, 2, and 3. Compared with fraction 1, fraction 2 contained two additional peaks eluting at 29.5 and 41.9 min. MS and tandem MS (MS2) spectra demonstrated that the peak at 29.5 min was caused by cysteinylation on Cys442. shows the full scan of the peak at 29.5 min from fraction 2. In addition to the parent ions (indicated by the red circle, multiple ions with different charge states), several in-source fragment ions were observed. The in-source fragmentation could be reduced or eliminated by adjusting the MS setting (Supplementary Fig. S3). In this experiment, in-source fragmentation was maintained to assist in peptide peak identification. Identical retention times between in-source fragment ions and parent ions were observed (Supplementary Fig. S4), confirming that in-source fragments arose from the parent ions. These in-source fragments ions were either b ions or y ions, which could aid in the identification of the peptide. The theoretical and observed masses for both parent ions and in-source fragments matched one another (Supplementary Table S1), confirming the peak identification. shows the MS2 spectra for the peak at 29.5 min, which was also in agreement with the cysteinylation at Cys442 and peptide peak identification.
Figure 4. UV chromatograms of nonreduced peptide mapping. (A) Fraction 1; (B) fraction 2; (C) fraction 3.
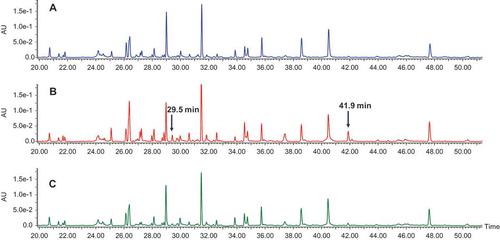
Figure 5. Mass spectra of peptides with cysteinylation on Cys442 at 29.5 min and cysteinylation on Cys640 at 41.9 min in fraction 2. (A) MS spectrum of peak at 29.5 min with in-source fragments; (B) MS2 spectra of parent ion 597.79(+ 2) at 29.5 min; (C) MS spectrum of peak at 41.9 min with in-source fragments; (D) MS3 spectrum from fragment ion Y9 of peak at 41.9 min.
To further confirm the cysteinylation at Cys442, we compared the nonreduced peptide map with its corresponding reduced peptide map. In reduced peptide mapping, the peak at 29.5 min disappeared – both the parent ions and the in-source fragment ions were all absent (Supplementary Fig. S5A and B). Instead, a peptide containing non-cysteinylated Cys442 was observed. These data provide conclusive evidence for the cysteinylation of Cys442 in fraction 2.
Similar to the peak identification at 29.5 min, the peak at 41.9 min in fraction 2 (monomer variant) was determined to be cysteinylation at Cys640. shows the full scan of the peak at 41.9 min of fraction 2. Both parent ions (highlighted by the red circle) and in-source fragments (b ions and y ions) were observed. The observed masses for both parent ions and in-source fragments matched their theoretical masses (Supplementary Table S2), confirming the peak identification. The peak at 41.9 min was more complex than the peak at 29.5 min in that there were three cysteines (Cys562, Cys628, and Cys640) in a single peptide for the peak at 41.9 min. However, the accurate masses of in-source fragments of certain y ions and b ions and the MS3 analysis of in-source y or b ions can aid in locating the cysteinylation site for the following reasons: (1) the accurate masses of in-source y ions (y5 to y14) contained only Cys640 and not Cys628, and all observed y ions matched the structure with cysteinylation at Cys640 (Supplementary Table S2); (2) the accurate masses of in-source b ions indicated that all observed b ions matched the structure with Cys628 linked to Cys562 (the expected disulfide bond in VL of scFv) (Supplementary Table S2); and (3) MS3 analysis of the in-source y9 ion also indicated that Cys640 was the cysteinylation site.
shows the results of MS3 analysis of the y9 ion, in which characteristic neutral loss of – 87 Da and – 153 Da for cysteinylation were observed. The MS3 analysis also confirmed the sequence of the y9 ion. MS2 analysis of the parent ions (Supplementary Fig. S6) was also in agreement with the proposed structure for the peak at 41.9 min and the source of its in-source fragmentation. Similar to the peak at 29.5 min, the peak at 41.9 min disappeared once it was reduced (Supplementary Figs. S5C and D). Both parent ions and in-source fragments were absent after reduction, confirming that cysteinylation was present in the peak at 41.9 min. In addition, low levels of glutathionylation were observed on both engineered cysteines (Cys442 and Cys640) in fraction 2 (Supplementary Fig. S7).
In summary, LC-MS analysis of fraction 1 and fraction 2 at both the protein level and the peptide level demonstrated that in fraction 2, instead of the formation of an intrachain disulfide bond between the two engineered cysteines (Cys442 in VH and Cys640 in VL), cysteinylation or glutathionylation on these two engineered cysteine sites were observed. The major modification form was the cysteinylated Cys442 and Cys640 on both heavy chains (i.e., the addition of four cysteines), and the second major form was the cysteinylated Cys442 and Cys640 on one heavy chain (the addition of two cysteines), in addition to the designed intrachain disulfide bond on the other heavy chain. The minor forms of fraction 2 included glutathionylation or a combination of cysteinylation and glutathionylation on one or both heavy chains. The characterized structures of the Bis-A monomer variant (fraction 2) are consistent with the observation from the bioactivity assays that the scFv was affected, whereas the Fab portion of the molecule was not.
Characterization of the enriched fraction 3
Fraction 3 was identified as a dimer because its intact mass was exactly double the monomer mass (). Upon reduction, only light chains and heavy chains were observed in the dimer-enriched fraction 3, and a mass difference between dimer and monomer was absent (). This observation indicated that the dimer was formed through disulfide bonds. After digestion with IdeS or IdeS/PNGase F/CpB, the F(ab′)2 for both the monomer and the dimer showed the same masses and matched the theoretical mass, indicating that the dimer was not modified through Fab ( and ). As shown in and , the intensity of the Fc/2 fragment for the dimer was significantly attenuated (by approximately half) compared with the monomer. Additional peaks were observed for fraction 3 and were determined to be the Fc/2 dimer, as their masses were exactly double the mass of the Fc/2 fragment (). These observations suggest that the dimer was formed by intermolecular disulfide bond formation in the Fc region (including the scFvs). There was a total of 10 cysteines in the Fc region (including the scFvs). The characterization results from fraction 2 (the monomer variants) suggest that Cys442 and Cys640 are probably implicated.
Figure 6. Total ion chromatograms of the three fractions and deconvoluted masses of the Fc/2 dimer in fraction 3 after IdeS/PNGase F/CpB digestion. (A) Ion chromatograph of fraction 1; (B) ion chromatograph of fraction 2; (C) ion chromatograph of fraction 3; (D) deconvoluted mass of Fc/2 dimer in fraction 3.
To confirm the dimer structure, non-reduced peptide mapping was employed. Surprisingly, no differences between the monomer (fraction 1) and the dimer (fraction 3) were observed upon non-reduced peptide mapping ( and ). No disulfide bonds were missing, and no unexpected disulfide bonds appeared in the dimer. In both the monomer and the dimer, Cys442 was linked to Cys640 by a disulfide bond, which was confirmed by non-reduced peptide mapping (Supplementary Figs. S8A and C; peak at 46.2 min). The similarity between the dimer and the monomer suggests that the dimer was formed by linking Cys442 of molecule A with Cys640 of molecule B and Cys640 of molecule A with Cys442 of molecule B (; named “head-to-tail connection”). The other possible connection (named “head-to-head connection”), which was the linkage of Cys442 (molecule A) to Cys442 (molecule B) and Cys640 (molecule A) to Cys640 (molecule B), could be conclusively ruled out because, if the head-to-head dimer was present, new peptides would have been observed in comparison with the monomer. The reason that only the head-to-tail connection was observed is most likely due to steric hindrance of the head-to-head dimer. In the design of the Cys442–Cys640 disulfide bond, the steric environment is unfavorable if Cys442 (molecule A) is linked to Cys442 (molecule B) or Cys640 (molecule A) is linked to Cys640 (molecule B). This dimer structure is also consistent with the observation from the bioactivity assay () that the scFv portion of fraction 3 was affected.
Figure 7. Putative head-to-tail structure of dimer molecule.
High-resolution SEC for monitoring and control of size variants
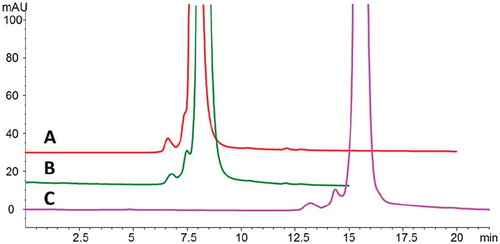
Because the monomer variant and dimer showed reduced bioactivity, an appropriate analytical method was required for routine process monitoring and control. Although preparative SEC with columns connected in series was initially employed to enrich the monomer variants, this approach was not suitable for in-process and release testing due to its low resolution and long analysis time. Rather, a high-resolution SEC method was required to monitor these size variants. As shown in , we used a 150 × 4.6-mm BEH SEC column (Waters, Milford, MA) to partially separate the monomer variants from the unmodified monomer peak. The addition of 750 mM sodium chloride to the mobile phase did not change the retention time for the cysteinylated product but increased the retention time for the desired monomer product, which led to substantially improved resolution (). The separation was further improved by doubling the column length to 30 cm (). The results of this preliminary study suggested that SEC could be used to monitor and control monomers, monomer variants, and dimer/aggregates.
Figure 8. SEC separation of Bis-A under different conditions on an Aquity BEH SEC-200 column. Shown are SEC separations on (A) 150 × 4.6–mm column with150 mM sodium phosphate, pH 6.8, mobile phase; (B) 150 × 4.6–mm column with 750 mM NaCl, 150 mM sodium phosphate, pH 6.8, mobile phase; and (C) 300 × 4.6–mm column with 750 mM NaCl, 150 mM sodium phosphate, pH 6.8, mobile phase.
To achieve optimal SEC separation, we developed the mobile-phase composition using a two-step approach involving pH screening followed by design-of-experiment (DOE) screening. After evaluation, the optimal mobile-phase pH was determined to be in the 5.5 – 7.0 range, with better selectivity between the monomer variant and the desired monomer product observed at the lower end of the range. Therefore, a pH range of 5.5–6.1 was chosen for the DOE study. The specific levels of pH, buffer, and salt concentrations are shown in Supplementary Table S3. Of these, salt concentration was found to be the most statistically significant parameter. The contours of the DOE response, i.e., the resolution between the monomer variant and the desired monomer as a function of sodium chloride and pH, is shown in Supplementary Fig. S9A. The contour plot clearly shows that a lower pH and a higher salt concentration improved resolution. As the salt concentration increased, the effect of pH on resolution became less profound. Similar pH effects were observed with the use of different buffering species. Among the various buffers that were evaluated, phosphate was found to produce the best separation. As a result, the pH was fixed at 5.8 to optimally balance the resolution and the phosphate buffer capacity. Because the best separation was obtained at the highest buffer and salt concentration during the initial DOE study, a second DOE study was conducted to fine-tune the separation. In the range evaluated (120–180 mM phosphate and 400–600 mM sodium chloride), the resolution between the peaks of interest was consistently found to be ~ 1.2 under most of the conditions tested (Supplementary Fig. S9B). Although the resolution marginally improved to 1.3 at the highest salt condition studied, the separation between the monomer variant and the dimer was found to be suboptimal at this salt condition. On the basis of the DOE study results, the SEC mobile phase, consisting of 150 mM sodium phosphate and 500 mM NaCl at pH 5.8, was chosen for the quantitation of aggregates and level of cysteinylated Bis-A product.
The final method was qualified according to International Conference on Harmonisation (ICH) guidance, demonstrating its robustness, linearity, accuracy, and precision. Detailed data are provided in supplementary materials.
Discussion
To improve the stability of scFv-IgG bispecific antibodies, an engineered intrachain disulfide bond in the scFv is often added. In the study described here, we added such an engineered disulfide bond to the appended scFv of a bispecific antibody, designated Bis-A. The Bis-A engineered disulfide bond between Cys442 and Cys640 was designed to link the VH and VL of the appended scFv, thereby stabilizing the scFv structure and restricting movement. We observed a high level of size variants for Bis-A and collected and characterized size variant fractions. The characterization data indicated that the engineered Cys442–Cys640 disulfide bond was open in the monomer variant. Both Cys442 and Cys640 could be cysteinylated or glutathionylated, effectively preventing formation of this intrachain disulfide bond. Cys442 and Cys640 could also form two intermolecular disulfides to form a head-to-tail stable dimer. Both monomer variants and dimer had reduced bioactivity, requiring these species to be monitored and controlled. By using the difference in apparent hydrodynamic radius between the Bis-A monomer and the monomer variants, we developed and optimized a convenient high-resolution SEC method for process monitoring and control. The method was qualified, demonstrating robustness, linearity, accuracy, and precision. Similar impurities can be anticipated for other appended scFv-IgG bispecific antibodies that share similar architecture and incorporate an engineered disulfide bond in the scFv. This high-resolution SEC method could be used for monitoring and control of appended scFv-IgGs bispecific antibody size variants.
Materials and methods
Chemicals, recombinant proteins, and combination proteins
RapiGest SF surfactant was obtained from Waters (Milford, MA). Trypsin/Lys-C and PNGase F were obtained from Promega Life Sciences (Madison, WI). IdeS and IgdE were obtained from Genovis (Lund, Sweden). CpB was obtained from Millipore (Burlington, MA). Dithiothreitol was obtained from Pierce Protein Biology (Rockford, IL). N-Ethylmaleimide, 2-(N-morpholino) ethanesulfonic acid, sodium phosphate dibasic, sodium phosphate monobasic monohydrate, sodium chloride, formic acid, and trifluoroacetic acid (TFA) were obtained from Sigma-Aldrich (St. Louis, MO). Water (OmniSolve, high-performance LC [HPLC] and spectrophotometry grade) and acetonitrile (OmniSolve, HPLC and spectrophotometry grade) were obtained from EMD Serono (Billerica, MA).
The bispecific antibody Bis-A was expressed using standard Chinese hamster ovary (CHO) mammalian cell culture techniques as previously described.Citation36 Enriched fractions containing monomer, monomer variant, and aggregate were collected from the polishing step and further processed with preparative SEC to obtain highly enriched fractions of monomer, monomer variant, and aggregate.
High-resolution SEC
High-resolution SEC was performed with a 1260 HPLC system (Agilent, Santa Clara, CA) on a BEH SEC column with 1.7-µm particle size, 200-Å pore, and 300 × 4.6 mm dimension (Waters). The optimized separation was achieved by using 150 mM sodium phosphate and 500 mM sodium chloride, pH 5.8, at 0.15 mL/min. The column was maintained at 25°C during the separation. The detector was set at 280 nm. Samples were injected as is, and the injection volume was adjusted to afford a column loading of 50 µg.
Preparative SEC
Enriched fractions from a polishing step in the purification process containing mixtures of monomer, monomer variant, and aggregate were dialyzed into water with Spectra/Por regenerated cellulose dialysis tubing (molecular weight cutoff, 12–14 kDa; cat# 25225–281; VWR, Radnor, PA) and concentrated and buffer exchanged into 1× phosphate-buffered saline (cat# 10010023; Thermo Fisher Scientific, Waltham, MA) to ~ 15 mg/mL, using Centriprep 30K centrifugal filters (cat# 4307; Millipore). The mixture was separated with two TSKgel G3000SW columns (21.5 mm × 60 cm, cat# 05147; Sigma-Aldrich) connected in series to an ÄKTA Avant 25 system (GE Healthcare Life Sciences, Little Chalfont, U/K) flowing at 4 mL/min, using 1× phosphate-buffered saline as the running buffer. The eluate was fractionated into 2-mL aliquots and analyzed by analytical high-performance SEC to generate pools of monomer, monomer variant, and aggregate. The pools were further concentrated and buffer exchanged into 20 mM histidine–235 mM sucrose, pH 6.0, using Centriprep 30K centrifugal filters (Sigma-Aldrich) to > 2.5 mg/ml for further analytical characterization.
Bioactivity
Three in vitro cell-based bioactivity assays were developed: the first and second assays targeted Fab and scFv, respectively, and the third utilized a dual-target mechanism to monitor the potential synergic effects of binding to both targets simultaneously.
Bioassay for fab
Two cell lines were used for the Fab bioassay: the Jurkat human T-lymphocyte cell line and the THP-1 human monocytic cell line. The Jurkat cell line was engineered to express Fab target and a luciferase reporter gene driven by NFκB. To quantify Fab-related activity, serial dilutions of antibody were prepared in cell culture medium (RPMI 1640, 10% fetal bovine serum) containing anti-human CD3 antibody (catalog# 16–0037-85, eBioscience, San Diego, CA) and added to white, flat-bottomed, 96-well assay plates. Jurkat cells and THP-1 cells were counted and suspended in cell culture medium to a working concentration of 1 × 10⁶ cells per mL. Diluted Jurkat and THP-1 cells were mixed 1:1 (vol/vol) and added to the assay plates at 50 µL per well. The cell mixture was then plated and incubated at 37°C with 5% CO2 for 22–24 h. Steady-Glo Luciferase Assay Reagent (Promega) was added and incubated for 20–60 min, and luminescence proportional to Fab activity was quantified with an EnVision plate reader (Perkin Elmer, Waltham, MA). The dose-response curve was generated with a four-parameter semilogistical curve model, using SoftMax Pro software (Molecular Devices, San Jose, CA). EC50 values represent the concentration of antibody at which half-maximal activation of Jurkat cells was observed. After the similarity assessment (parallelism test) between the reference standard and the test sample, the percent relative potencies of antibody samples were determined as [(EC50 of reference standard)/(EC50 of sample)] × 100.
Bioassay for scFV
The bioassay for scFv was performed by using a CHO cell line expressing scFV target, together with a Jurkat cell line engineered to express ligand of scFV target and a luciferase reporter gene driven by NFAT (nuclear factor of activated T cell). To quantify scFv-related activity, CHO cells were counted and diluted to 0.2 × 10⁶ cells per mL in cell culture medium (RPMI 1640, 10% fetal bovine serum) and added to white, flat-bottomed, 96-well assay plates. After incubation at 37°C with 5% CO2 for 2–4 h, serial dilutions of antibody were prepared in cell culture medium, added to the assay plates, and incubated for an additional 30–60 min. Jurkat cells were counted and diluted in cell culture medium to 1.2 × 10⁶ cells per mL and then added at 70 µL per well to the plates and incubated at 37°C with 5% CO2 for 16–20 h. Steady-Glo Luciferase Assay Reagent (Promega) was added and incubated for 30–60 min, and luminescence proportional to scFv activity was quantified with an EnVision plate reader (Perkin Elmer). The dose-response curve was generated with a four-parameter semilogistical curve model, using SoftMax Pro software (Molecular Devices). EC50 values represent the concentration of antibody at which half-maximal inhibition of CHO–Jurkat interaction was observed. After the similarity assessment (parallelism test) between the reference standard and the test sample, the percent relative potencies of antibody samples were determined as [(EC50 of reference standard)/(EC50 of sample)] × 100.
Dual-target bioassay
For the dual-target bioassay, Jurkat Fab target-expressing cells and CHO scFV target-expressing cells (Promega) were used. The Jurkat cell line is engineered to express both Fab target and ligand of scFV targets together with a luciferase reporter gene driven by NFκB. To quantify whole-antibody dual-target activity, serial dilutions of antibody were prepared in cell culture medium (RPMI 1640, 10% fetal bovine serum) and added to white, flat-bottomed, 96-well assay plates. Jurkat cells and CHO cells were counted, diluted in cell culture medium to a working concentration of 0.96 × 10⁶ cells per mL, and mixed 1:1 (vol/vol). The cell mixture was then plated at 50 µL per well and incubated at 37°C with 5% CO2 for 6 h. Steady-Glo Luciferase Assay Reagent (Promega) was added, the mixture was incubated for 20–60 min, and luminescence proportional to whole-antibody activity was quantified with an EnVision plate reader (Perkin Elmer). The dose-response curve was generated with a four-parameter semilogistical curve model, using SoftMax Pro software (Molecular Devices). EC50 values represent the concentration of antibody at which half-maximal activation of Jurkat cells was observed. After the similarity assessment (parallelism test) between the reference standard and the test sample, the percent relative potencies of antibody samples were determined as [(EC50 of reference standard)/(EC50 of sample)] × 100.
LC-MS analysis for intact, reduced, and protease-cleaved fragments
LC-MS of intact, reduced, and protease-cleaved Bis-A fragments was performed with a Synapt G2 mass spectrometer in conjunction with an ultra-performance LC (UPLC) system (Waters). Reversed-phase chromatography separation was performed by using a Proteomix RP-1000 column (4.6 × 150 mm). Mobile phase A was 0.01% TFA and 0.1% formic acid in water, and mobile phase B was 0.01% TFA and 0.1% formic acid in acetonitrile. Samples were eluted with a linear gradient. MS was performed with the following parameters: ESI positive ionization; sensitivity mode; capillary voltage, 3.2 kV; source temperature, 140°C; sampling cone, 40 kV; extraction cone, 4 kV; desolvation temperature, 350°C. Mass spectra were collected at an m/z range of 800–4,500. Molecular mass was determined through deconvolution of the mass data, using the MaxEnt I software package (Waters).
Ides/pngase f/cpb digestion
For IdeS digestion, the sample was first diluted to 1 mg/mL in 20 mM 2-(N-morpholino)ethanesulfonic acid buffer at pH 6.5. The reconstituted IdeS solution was added at a ratio of 0.5 unit per µg of protein, and the mixture was incubated at 37°C for 2.5 h.
For deglycosylation, the sample was diluted to 1 mg/mL in tris(hydroxymethyl)aminomethane (Tris) buffer (pH 7.5); PNGase F was diluted at 1:1 (vol/vol) in water. Diluted PNGase F was added to the sample at a ratio of 0.05 units per µg of protein, and the mixture was incubated at 37°C overnight.
For CpB digestion, CpB was first dissolved in water at 1 mg/mL. Reconstituted CpB solution was added to protein solution at a mass ratio of 1:50. The mixture was incubated at 37°C for 20 min.
Igde/pngase f/cpb digestion
For IgdE digestion, the sample was first diluted to 1 mg/mL in 100 mM phosphate buffer at pH 7.0. The reconstituted IgdE solution was added at a ratio of 1 unit per µg of protein, and the mixture was incubated at 37°C for 16–18 h. Deglycosylation and CpB digestion were performed as described in Section 4.6 for IdeS/PNGase F/CpB digestion.
Nonreduced and reduced peptide mapping
Nonreduced and reduced peptide mapping was used to verify disulfide bond linkages of Bis-A. Samples were diluted to 2 mg/mL in 50 mM Tris buffer (pH 7.0). One microliter of N-ethylmaleimide was dissolved in 0.1 M phosphate buffer at 40 mM and added to 100 µg of Bis-A. The mixture was incubated at room temperature for 20 min. The alkylated sample was mixed (1:1 vol/vol) with 0.2% RapiGest SF surfactant (Waters) dissolved in 50 mM Tris (pH 7.0), and the mixture was heated at 55°C for 30 min. The denatured sample was cooled to room temperature and digested with a Trypsin/Lys-C mix (1:12.5 enzyme:protein) at 37°C overnight. Half of the digest was reduced with 2 µL of 500 mM dithiothreitol and incubated at 37°C for 30 min. Both nonreduced and reduced digests were analyzed with a UPLC system coupled to a Thermo Fusion mass spectrometer (Waters). The peptides were separated on a CSH C18 column (Waters) at 55°C, using water and acetonitrile as mobile phases A and B with 0.1% formic acid or 0.02% TFA as ion-pairing reagent. Peptides were monitored with an ultraviolet detector at a wavelength of 220 nm and an MS instrument in positive-ion mode. Each tryptic peptide was identified by its mass (corresponding to the amino acid composition), and the fragmentation masses were determined with MS2. Xcalibur software (Thermo Fisher) was used for MS data acquisition and manual data processing. PepFinder software (Thermo Fisher) was used for a database search for sequence coverage and post-translational modifications.
Disclosure of potential conflicts of interest
All authors are employees of MedImmune and own stock and/or stock interests in AstraZeneca.
Abbreviations
CpB carboxypeptidase B
DOE design of experiment
EC50 half-maximal concentration
Fab antigen-binding fragment
Fc fragment crystallizable
Fc/2 half Fc [fragment]
FDA US Food and Drug Administration
HPLC high-performance liquid chromatography
IdeS FabRICATOR
IgdE FabALACTICA
IgG immunoglobulin G
LC liquid chromatography
MS mass spectrometry
MS2 MS/MS tandem mass spectrometry
MS3 MS/MS/MS tandem mass spectrometry
PNGase F peptide N–glycosidase F
scFv single-chain variable fragment
SEC size-exclusion chromatography
TFA trifluoracetic acid
Tris tris(hydroxymethyl)aminomethane
UPLC ultra-performance liquid chromatography
VH heavy-chain variable domain
VL light-chain variable domain
Supplemental Material
Download MS Word (5.5 MB)Acknowledgments
The authors thank Caroline Kittinger, Miranda Fong, Arun Parupudi and Deborah J. Shuman for their support in this work.
Supplementary material
Supplementary material as noted in text is available via the Internet at http://www.tandfonline.com.
Additional information
Funding
References
- Strohl WR. Current progress in innovative engineered antibodies. Protein Cell. 2018;9(1):86–120. doi:10.1007/s13238-017-0457-8.
- Riethmuller G. Symmetry breaking: bispecific antibodies, the beginnings, and 50 years on. Cancer Immun. 2012;12:12.
- Nisonoff A, Rivers MM. Recombination of a mixture of univalent antibody fragments of different specificity. Arch Biochem Biophys. 1961;93:460–462.
- Kohler G, Milstein C. Continuous cultures of fused cells secreting antibody of predefined specificity. Nature. 1975;256(5517):495–497.
- Milstein C, Cuello AC. Hybrid hybridomas and their use in immunohistochemistry. Nature. 1983;305(5934):537–540.
- Brennan M, Davison PF, Paulus H. Preparation of bispecific antibodies by chemical recombination of monoclonal immunoglobulin G1 fragments. Science. 1985;229(4708):81–83.
- Dhimolea E, Reichert JM. World bispecific antibody summit, September 27- 28,2011, Boston, MA. mAbs. 2012;4(1):4–13. doi:10.4161/mabs.4.1.18821.
- Garber K. Bispecific antibodies rise again. Nat Rev Drug Discov. 2014;13(11):799–801. doi:10.1038/nrd4478.
- Kontermann RE, Brinkmann U. Bispecific antibodies. Drug Discov Today. 2015;20(7):838–847. doi:10.1016/j.drudis.2015.02.008.
- Sheridan C. Amgen’s bispecific antibody puffs across finish line. Nat Biotechnol. 2015;33(3):219–221. doi:10.1038/nbt0315-219.
- Brinkmann U, Kontermann RE. The making of bispecific antibodies. mAbs. 2017;9(2):182–212. doi:10.1080/19420862.2016.1268307.
- Bezabeh B, Fleming R, Fazenbaker C, Zhong H, Coffman K, Yu X-Q, Leow CC, Gibson N, Wilson S, Stover CK, et al. Insertion of scFv into the hinge domain of full-length IgG1 monoclonal antibody results in tetravalent bispecific molecule with robust properties. mAbs. 2017;9(2):240–256. doi:10.1080/19420862.2016.1270492.
- Dong J, Sereno A, Aivazian D, Langley E, Miller BR, Snyder WB, Chan E, Cantele M, Morena R, Joseph IBJK, et al. A stable IgG-like bispecific antibody targeting the epidermal growth factor receptor and the type I insulin-like growth factor receptor demonstrates superior anti-tumor activity. mAbs. 2011;3(3):273–288.
- Spiess C, Zhai Q, Carter PJ. Alternative molecular formats and therapeutic applications for bispecific antibodies. Mol Immunol. 2015;67(2,Part A):95–106. doi:10.1016/j.molimm.2015.01.003.
- Schmiedl A, Breitling F, Dubel S. Expression of a bispecific dsFv-dsFv’ antibody fragment in escherichia coli. Protein Eng. 2000;13(10):725–734.
- Wolf E, Hofmeister R, Kufer P, Schlereth B, Baeuerle PA. BiTEs: bispecific antibody constructs with unique anti-tumor activity. Drug Discov Today. 2005;10(18):1237–1244. doi:10.1016/S1359-6446(05)03554-3.
- Baeuerle PA, Reinhardt C. Bispecific T-cell engaging antibodies for cancer therapy. Cancer Res. 2009;69(12):4941–4944. doi:10.1158/0008-5472.CAN-09-0547.
- Huehls AM, Coupet TA, Sentman CL. Bispecific T-cell engagers for cancer immunotherapy. Immunol Cell Biol. 2015;93(3):290–296. doi:10.1038/icb.2014.93.
- Nagorsen D, Kufer P, Baeuerle PA, Bargou R. Blinatumomab: a historical perspective. Pharmacol Ther. 2012;136(3):334–342. doi:10.1016/j.pharmthera.2012.07.013.
- Chelius D, Ruf P, Gruber P, Ploscher M, Liedtke R, Gansberger E, Hess J, Wasiliu M, Lindhofer H. Structural and functional characterization of the trifunctional antibody catumaxomab. mAbs. 2010;2(3):309–319.
- Ridgway JB, Presta LG, Carter P. “Knobs-into-holes” engineering of antibody CH3 domains for heavy chain heterodimerization. Protein Eng. 1996;9(7):617–621.
- Shatz W, Chung S, Li B, Marshall B, Tejada M, Phung W, Sandoval W, Kelley RF, Scheer JM. Knobs-into-holes antibody production in mammalian cell lines reveals that asymmetric afucosylation is sufficient for full antibody-dependent cellular cytotoxicity. mAbs. 2013;5(6):872–881. doi:10.4161/mabs.26307.
- Gunasekaran K, Pentony M, Shen M, Garrett L, Forte C, Woodward A, Ng SB, Born T, Retter M, Manchulenko K, et al. Enhancing antibody Fc heterodimer formation through electrostatic steering effects: applications to bispecific molecules and monovalent IgG. J Biol Chem. 2010;285(25):19637–19646. doi:10.1074/jbc.M110.117382.
- Coloma MJ, Morrison SL. Design and production of novel tetravalent bispecific antibodies. Nat Biotechnol. 1997;15(2):159–163. doi:10.1038/nbt0297-159.
- Dimasi N, Gao C, Fleming R, Woods RM, Yao XT, Shirinian L, Kiener PA, Wu H. The design and characterization of oligospecific antibodies for simultaneous targeting of multiple disease mediators. J Mol Biol. 2009;393(3):672–692. doi:10.1016/j.jmb.2009.08.032.
- Croasdale R, Wartha K, Schanzer JM, Kuenkele KP, Ries C, Mayer K, Gassner C, Wagner M, Dimoudis N, Herter S, et al. Development of tetravalent IgG1 dual targeting IGF-1R-EGFR antibodies with potent tumor inhibition. Arch Biochem Biophys. 2012;526(2):206–218. doi:10.1016/j.abb.2012.03.016.
- Yazaki PJ, Lee B, Channappa D, Cheung CW, Crow D, Chea J, Poku E, Li L, Andersen JT, Sandlie I, et al. A series of anti-CEA/anti-DOTA bispecific antibody formats evaluated for pre-targeting: comparison of tumor uptake and blood clearance. Protein Eng Des Sel. 2013;26(3):187–193. doi:10.1093/protein/gzs096.
- Michaelson JS, Demarest SJ, Miller B, Amatucci A, Snyder WB, Wu X, Huang F, Phan S, Gao S, Doern A, et al. Anti-tumor activity of stability-engineered IgG-like bispecific antibodies targeting TRAIL-R2 and LTbetaR. mAbs. 2009;1(2):128–141.
- Metz S, Haas AK, Daub K, Croasdale R, Stracke J, Lau W, Georges G, Josel HP, Dziadek S, Hopfner KP, et al. Bispecific digoxigenin-binding antibodies for targeted payload delivery. Proc Natl Acad Sci USA. 2011;108(20):8194–8199. doi:10.1073/pnas.1018565108.
- Kang JC, Poovassery JS, Bansal P, You S, Manjarres IM, Ober RJ, Ward ES. Engineering multivalent antibodies to target heregulin-induced HER3 signaling in breast cancer cells. mAbs. 2014;6(2):340–353. doi:10.4161/mabs.27658.
- Schanzer J, Jekle A, Nezu J, Lochner A, Croasdale R, Dioszegi M, Zhang J, Hoffmann E, Dormeyer W, Stracke J, et al. Development of tetravalent, bispecific CCR5 antibodies with antiviral activity against CCR5 monoclonal antibody-resistant HIV-1 strains. Antimicrob Agents Chemother. 2011;55(5):2369–2378. doi:10.1128/AAC.00215-10.
- Mabry R, Lewis KE, Moore M, McKernan PA, Bukowski TR, Bontadelli K, Brender T, Okada S, Lum K, West J, et al. Engineering of stable bispecific antibodies targeting IL-17A and IL-23. Protein Eng Des Sel. 2010;23(3):115–127. doi:10.1093/protein/gzp073.
- Beck A, Wagner-Rousset E, Ayoub D, Van Dorsselaer A, Sanglier-Cianférani S. Characterization of therapeutic antibodies and related products. Anal Chem. 2013;85(2):715–736. doi:10.1021/ac3032355.
- Chen X, Nguyen M, Jacobson F, Ouyang J. Charge-based analysis of antibodies with engineered cysteines: from multiple peaks to a single main peak. mAbs. 2009;1(6):563–571.
- Junutula JR, Raab H, Clark S, Bhakta S, Leipold DD, Weir S, Chen Y, Simpson M, Tsai SP, Dennis MS, et al. Site-specific conjugation of a cytotoxic drug to an antibody improves the therapeutic index. Nat Biotechnol. 2008;26:925–932. doi:10.1038/nbt.1480.
- Kasturirangan S, Gao C, Rainey G, Morrow M, Dobson CL, Drabic S, Schofield D, Carlesso G, Pollizzi K, Mazor Y, et al. Bispecific Binding Proteins And Uses Thereof. United States. US20180022807A1. 2018.