
ABSTRACT
The preponderance and diversity of charge variants in therapeutic monoclonal antibodies has implications for antibody efficacy and degradation. Understanding the extent and impact of minor antibody variants is of great interest, and it is also a critical regulatory requirement. Traditionally, a combination of approaches is used to characterize antibody charge heterogeneity, including ion exchange chromatography and independent mass spectrometric variant site mapping after proteolytic digestion. Here, we describe charge variant native mass spectrometry (CVMS), an integrated native ion exchange mass spectrometry-based charge variant analytical approach that delivers detailed molecular information in a single, semi-automated analysis. We utilized pure volatile salt mobile phases over a pH gradient that effectively separated variants based on minimal differences in isoelectric point. Characterization of variants such as deamidation, which are traditionally unattainable by intact mass due to their minimal molecular weight differences, were measured unambiguously by mass and retention time to allow confident MS1 identification. We demonstrate that efficient chromatographic separation allows introduction of the purified forms of the charge variant isoforms into the Orbitrap mass spectrometer. Our CVMS method allows confident assignment of intact monoclonal antibody isoforms of similar mass and relative abundance measurements across three orders of magnitude dynamic range.
Introduction
Biotherapeutic protein characterization frequently includes intact mass analysis to measure molecular weight, post-translational modification (PTM) profiles, and isoform complexity or polydispersity. The conventional workflow for intact mass analysis involves coupling reverse phase (RP) liquid chromatography directly to mass spectrometry (LC-MS). RP mobile phases are highly compatible with electrospray ionization (ESI) MS and allow very sensitive detection of intact proteins. RP chromatography requires significant concentrations of organic solvent often adjusted to very low pH (<3.0) using elevated column temperatures.Citation1 These conditions result in denaturation of most proteins and a broad distribution of relatively high charge states at low m/z ranges. Denaturing LC-MS can present analytical challenges for moderately heterogeneous samples. As sample complexity increases, multiple unique isoforms of differing masses and different charge states are likely to produce spectra with ions of overlapping m/z values. This phenomenon is known as spectral interference and can become a major challenge for data interpretation.Citation2
Performing intact mass analysis using physiological-like or “native” conditions in solution offers a facile alternative to RP LC-MS. Native MS utilizes 100% aqueous solutions of low-to-moderate concentrations of volatile salt (e.g., 50 mM ammonium acetate) buffered at neutral pH.Citation3,Citation4 This type of analysis proceeds commonly after removal of non-volatile salts by buffer exchange followed by nanospray infusion MS.Citation5–Citation7 Native MS-based intact mass analysis is required for certain classes of biotherapeutics that require preservation of non-covalent associations of protein-protein or protein-ligand complexes.Citation8 Native MS also affords a fundamental benefit to intact mass analysis of all types of heterogeneous samples where proteins acquire fewer charges and yield spectra at high m/z relative to denatured conditions. This increased separation significantly reduces spectral interference.Citation2,Citation9,Citation10 Modern mass analyzers, such as Orbitrap MS systems, have enabled native MS to deliver increasingly higher resolution data.Citation1,Citation2,Citation11–Citation15 Achieving baseline resolution of intact protein isoforms, such as monoclonal antibody (mAb) glycoforms, allows heterogeneous intact protein samples to be efficiently measured without sample pre-treatment (e.g., reduction or deglycosylation), and offers a true intact mass measurement of complex biologics.
Several separation techniques that utilize “native” mobile phases and are also ESI-compatible can be coupled directly to native MS. Examples include size exclusion chromatography (SEC), ion exchange chromatography (IEC), hydrophobic interaction chromatography (HIC), and capillary electrophoresis (CE).Citation16–Citation19 On-line separations offer notable advantages to infusion-based native MS applications. MS spectra can be correlated with retention time (RT) to provide orthogonal confirmation of isoform assignments. Optical (e.g., UV) detectors can be further coupled in-line with the LC and MS systems and are critical for method optimization or troubleshooting. Furthermore, the use of gentle, native conditions minimizes the potential of method-induced PTM artifacts, such as deamidation, which are often induced through the use of elevated column temperature, even at low pH.Citation20 Additionally, sample injections may be automated and sample desalting can be performed via separations in-line with MS detection.
IEC allows isoforms to be separated on the basis of charge (z), and benefits from on-column sample concentration and gradient elution, which makes this form of chromatography useful from a practical standpoint. Coupling IEC to MS, however, introduces new challenges. Conventional IEC uses gradients of low-to-high salt concentration to elute proteins, but, when coupling to MS, the high concentrations of salt can be problematic, even when utilizing volatile salts. Recent reports have shown that native IEC-MS is possible to implement, but these demonstrations required high concentrations of ammonium acetate (>200 mM) to elute proteins, which can result in reduced sensitivity of the mass spectra.Citation16,Citation21 Low sensitivity and lack of robustness remain significant barriers to any potential mainstream industry adoption.
IEC-based charge variant (CV) analysis plays an important role in biotherapeutic product development. CV data finds use at multiple stages in a product’s lifetime, from initial characterization through quality control, and is required for filings with regulatory agencies. CV analysis is conventionally accomplished using non-MS-compatible salt-gradient IEC coupled to UV detection.Citation22–Citation24 An alternative form of CV analysis has been reported that demonstrates IEC using a pH gradient in a low ionic strength background to affect protein elution.Citation25,Citation26 The mechanism of elution for pH-gradient IEC is such that, as pH increases and becomes equal to a protein isoform pI, the net charge state of that isoform in solution becomes neutral, and it desorbs from the IEC stationary phase and elutes from the column. Reports of pH-gradient IEC reveal that it is possible to perform high-resolution separation of proteins without the requirement of high ionic strength mobile phases. Recently, strong cation exchange chromatography coupled to a mass spectrometer has been demonstrated to resolve charged variant isoforms of antibodies eluted along a pH gradient.Citation27 Although effective at isoform separation, this workflow requires daily mobile phase preparation and does not address the conundrum of co-eluting species.
Here, we describe a novel workflow that simultaneously accomplishes native intact mass analysis and CV analysis using weak cation exchange (WCX) coupled directly to Orbitrap native MS. This platform uses robust mobile phase buffers and is based on pH gradient separation using extremely high purity MS compatible buffers at low ionic strength. Our approach, termed charge variant native mass spectrometry (CVMS), offers a powerful alternative to traditional RP LC-MS for intact mass analysis and is a robust and readily implemented platform; CV separation of near-isobaric isoforms improves mass accuracy and dynamic range of relative quantitation of low abundance isoforms. Our CVMS workflow constitutes a new state-of-the-art for intact mass analysis of proteins in the biopharmaceutical industry and beyond.
Results
We sought to develop a highly MS-compatible version of chromatographic methods previously demonstrated to allow IEC separation with pH gradient elution.Citation26,Citation27 To optimize MS selectivity, we established a pH-elution IEC method with low ionic strength and a constant background of volatile salt, which served to minimize gradient-related changes in ESI sensitivity and to maintain equivalent desolvation conditions throughout the entire course of separations. Ammonium acetate was selected as the buffer agent in the mobile phases because this volatile salt is stable in solution for a number of weeks. Background salt concentration and buffering strength are important parameters for modulating pH elution in IEC.
Although ammonium acetate is a popular choice of volatile salt-ingredient for native MS-compatible buffering solutions, it is not an ideal or true buffer. Ammonium acetate provides buffering within ±1 pH unit of 4.75 (acetate pKa) and ±1 pH unit of 9.25 (ammonium pKa).Citation28 As a result, pH gradients buffered using ammonium acetate may suffer in terms of experimental linearity. We optimized the pH of mobile phases for separations of trastuzumab (Herceptin®), which has a pI above 8.25 (theoretical pI = 8.583), where we found the experimental pH to be a more linear reflection of the actual ratio of blended mobile phases. 50 mM ammonium acetate was used in both mobile phases A and B. Mobile phase A was pH = 6.6 without pH adjusting. Mobile phase B was pH = 10.1, adjusted using ammonium hydroxide.
We monitored the linearity of our IEC separation using a pH/conductivity meter. Trastuzumab (21 µg/µL) in formulation buffer was injected as a volume of 1 µL onto a WCX column and eluted using a 10 or 20 min gradient of 1–8% mobile phase B (). CVMS (), using either length gradient, produced a chromatographic profile similar to the study by Harris et al., which utilized salt-elution on a WCX column with UV detection.Citation23 The authors in this case used a rigorous approach involving fractionation followed by peptide mapping to demonstrate that the majority of the charge heterogeneity of trastuzumab is related to site-specific asparagine deamidation and aspartic acid isomerization.
Figure 1. Gradient optimization. Shown are the UV chromatogram (blue), the actual monitored pH profile (black) and the programed gradient (red). Separation was performed on a ProPac WCX-10 column (5 μm particle size, 2.0 × 250 mm) column, further run parameters may be obtained from the experimental section.
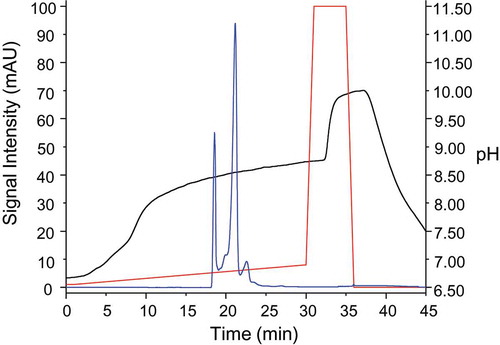
Figure 2. Trastuzumab charge heterogeneity is highly influenced by asparagine deamidation and aspartic acid isomerization. (a) The chromatogram resulting from our CVMS method is highly similar to the trastuzumab charge variant profile previously reported by Harris et al. showing amino acid site-specific charge variant peak assignments based on fractionation and peptide mapping data.Citation23 Delta masses are plotted for the seven major peaks. (b) Pathway for asparagine deamidation and aspartic acid isomerization. Deamidation of asparagine to aspartic acid results in a mass difference of +0.98 Da and changes the local pKa from basic (8.8) to acidic (3.9) and results in earlier elution by cation exchange separation. Isomerization of aspartic acid results in zero mass change and does not directly result in any predictable change to pI.
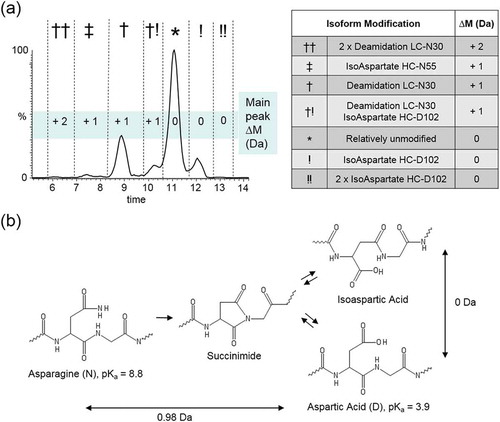
Asparagine deamidation and aspartic acid isomerization can both occur with exposure to heat or high pH over extended time periods (). Deamidation of asparagine on trastuzumab (theoretical pI = 8.576) results in a relative decrease in pI of 0.07 units and a near-isobaric mass increase of 0.98 Da. This is consistent with decreased RT of the LC-N30 deamidated peak (†) and doubly deamidated peak (††) relative to the main peak (*) in the trastuzumab charge variant profile.
Aspartic acid conversion to isoaspartic acid does not result in a mass difference and itself theoretically imparts no change in isoform pI; however, isoaspartic acid conversion can strain local protein tertiary structure as a result of an additional carbon atom becoming inserted into the polypeptide backbone. Such changes in protein surface characteristics can in turn alter IEC elution behavior, and may be responsible for the increased retention times of the peaks that contain HC-D102 isoaspartate: peaks (†!), (!), and (!!).Citation29
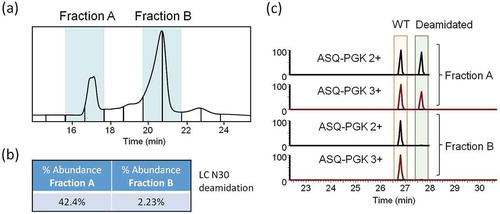
To confirm the identity of the purported main and deamidation peaks, we repeated our separation method and collected fractions for peptide mapping (). BioPharma Finder peptide mapping results showed that nearly half of light chain N30 in Fraction A was deamidated compared to ~ 2% N30 deamidation in Fraction B (). A manual analysis of the raw MS data also supports this conclusion ().
Figure 3. Fractionation of trastuzumab charge variants and confirmation by peptide mapping. (a) WCX fractionation of trastuzumab collected as fractions A and B. (b) Label-free quantitation of deamidation on N30 of trastuzumab LC based on AUC of extracted ion chromatograms. (c) Extracted ion chromatograms of doubly and triply charged mass of tryptic N30 LC peptide with and without deamidation from fractions A and B.
CVMS method optimized for high dynamic range
WCX separation of trastuzumab was repeated within the context of the CVMS method, where the column eluent flowed directly to the heated ESI needle of the Orbitrap MS system. A moderately high resolution Orbitrap setting of 45,000 (FWHM at 200 m/z) was required to robustly resolve spectral interferences of potential near-isobaric isoform. Large protein species such as mAbs rapidly decay while trapped inside Orbitrap detectors. Consequently, MS sensitivity decreases with increased transient time and resolution becomes inversely proportional to sensitivity.Citation14,Citation24 Mobile phases were prepared using high purity (≥99.999% metal-free content) ammonium acetate, which we have observed is an important ingredient for optimizing MS sensitivity in the CVMS workflow (data not shown) due to very low amount of metal ion adducting, which may cause chemical noise background during ESI-MS.
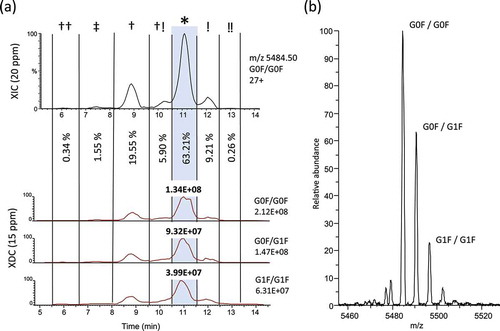
To determine the relative quantities of isobars owing to deamidation and isomerization, we generated an extracted ion chromatogram (XIC) of the raw data, monitoring the most abundant ion of the most abundant glycoform (G0F/G0F; 27 + ion, m/z 5484.50) as a suitable representation of the total deamidation/isomerization across all trastuzumab isoforms (). Using a window width of 20 ppm (approximately 3 Da), any true-isobaric species, such as isoaspartic acid isomers, or any near-isobaric protein isoforms, with 0–3 deamidation sites, would be merged into a single XIC trace. Within the G0F/G0F XIC trace, we identified peaks corresponding to six previously reported deamidation/isomerization isoforms. Abundances of deamidation and isomerization were estimated as individual isoforms using the G0F/G0F 27+XIC fractional peak areas.
Figure 4. Isoform-specific measurements of deamidation and isomerization. (a) In order to measure the relative abundance of total amounts of asparagine deamidation and aspartic acid isomerization we plotted an extracted ion chromatogram (XIC) of 20 ppm for the most abundant charge state of G0F/G0F (27+, m/z = 5484.50). Partial peak areas were determined manually and the G0F/G0F isoform at the main peak was measured to be 63.21% of the total abundance. An adjusted XDC area was calculated by multiplying the main peak fraction (*) by the XDC total area under the curve for the top 3 glycoforms. (b) Raw MS spectrum averaged across the main peak shows 27+ charge state with top 3 glycoforms labeled.
The CVMS data necessitated a time-resolved deconvolution strategy due to the significant chromatographic separation of isoforms, including baseline-resolved species as well as co-eluting and partially-interfering species. This strategy used a deconvolution algorithm (ReSpect) for intact mass determination in combination with a second algorithm (Sliding Window) that performs filtering and integration of the individual deconvolution events staggered over the course of a chromatographic separation.Citation30 We optimized our data analysis strategy for confident identification of both high and low abundance species using a mass tolerance of 15 ppm for ReSpect deconvolution and Sliding Window integration.
The Sliding Window algorithm allowed filtering of lesser quality identifications and generation of isoform-specific (or “extracted”) deconvolution chromatographic (XDC) traces. The XDC traces provide an integrated peak area to estimate relative abundance. Several high abundance, non-sialylated glycoforms eluted as XDC traces with multi-peak elution profiles reflected the established deamidation/isomerization pattern characteristic of the overall CV profile of trastuzumab. Thus, the XDC peak areas reported by BioPharma Finder were inclusive of the sum of several deamidation/isomerization isoforms. To determine the abundance of individual isoforms (glycoform with possible additional PTMs) in terms of XDC peak area, we multiplied the XIC-determined fractional amounts of peaks containing deamidation/isomerization or lack of modification by the total XDC peak area for the top three glycoforms (G0F/G0F, G0F/G1F, G1F/G1F). The most abundant isoform that contributed to the main peak was the G0F/G0F trastuzumab glycoform with no further deamidation or isomerization. The fraction-adjusted XDC area (1.34e8) of G0F/G0F served to represent the 100% relative abundance level in our measurements of individual isoforms.
CVMS data allowed highly confident and unambiguous detection of low level intact mAb species. Combining high mass accuracy with unique RT information permitted assignment of isoforms based on two independent criteria. As a confirmatory “third dimension”; the magnitude and direction of a relative RT shift can also be correlated with the predicted elution behavior caused by the chemical nature of a particular isoform being identified. Predictability in this regard is an advantage compared to other means of isoform separation, which can be effective but may not offer a clear relationship between isoform identity and elution order, such as isoform separation based on collision cross section by ion mobility. This strategy could be used routinely to support the isoform assignments for new species that arise in batch comparisons.
The trastuzumab species identified by CVMS were characterized by combinations of abundant N-glycoforms with several possible types of low level modifications, either acid or basic nature. Acidic peaks, eluting earlier than the main peak, indeed corresponded to isoforms having undergone PTMs that result in decreased pI, including asparagine deamidation and N-glycans containing sialic acid. Several basic isoforms eluting later than the main peak were identified, including isoforms with C-terminal lysine and aspartic acid conversion to succinimide. XDC traces were generated for each species detected.
Succinimide formation is an intermediate step in deamidation/isomerization pathways.Citation20 Succinimide conversion from aspartic acid will impart an increase in pI, and should therefore result in an increased RT in cation exchange separations. We identified aspartic acid-derived succinimide isoforms that eluted as relatively basic species and, as expected, modified in combination with the top three glycoforms (). We estimated a relative abundance of 3.41% aspartic acid conversion to succinimide.
Figure 5. Basic low-abundance isoforms. (a) Chromatographs showing the base peak (BPC) trace aligned with XDC traces (deconvolved with a mass tolerance set to 15 ppm) of the top 3 glycoforms with one asparagine conversion to succinimide or (b) one un-clipped C-terminal lysine. Abundance of each isoform is shown as a percentage relative to main-fraction adjusted XDC peak area of G0F/G0F. Panels (c) and (d) show mass spectrum averaged across highlighted RT window, for succinimide and lysine, respectively.
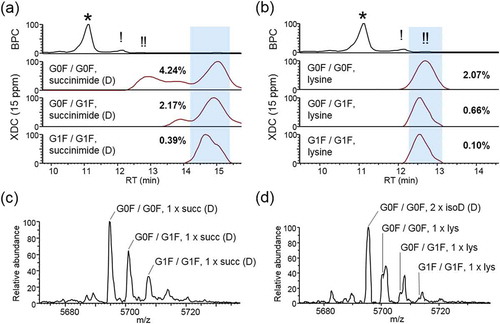
The trastuzumab heavy chain is initially translated to feature a C-terminal lysine, which in the final product is largely removed, though not entirely. The glycoform species that comprised the main peak had undergone lysine removal on both chains. We identified the top three glycoforms in which one C-terminal lysine residue was preserved (). Relative to the main peak, we see that C-terminal lysine species are also eluting appropriately as basic variants. It was observed that the lysine-retaining isoforms were significantly interfering with mass spectra of the glycoforms identified to have two isoaspartic acid conversions. Without the aid of separation, the main peak glycoforms would co-elute with the C-terminal lysine variants in approximately 100-fold greater abundance such that identification of C-terminal lysine content would not be possible. This observation illustrates the importance of separation for expanding the lower limit of detection and relative quantitation for intact mass analysis. In situations where near-isobaric variants are present in a high dynamic range of abundances, identification becomes impossible. Separation is a powerful way to simplify mass spectra, decreasing spectral interferences and increasing the likelihood of observing low abundance species.
Sliding Window deconvolution identified the G1F/G1F C-term lysine-containing isoform and measured a relative abundance of 0.10% compared to the G0F/G0F main peak isoform. This indicated that our CVMS method was capable of accurate mass assignment and relative abundance measurements over a dynamic range of three orders of magnitude. We conclude that high dynamic range intact mass analysis is possible through an efficient means of separation (IEC) to reduce the extent of mass interferences that would normally result from the co-elution of near- and true-isobars using infusion or other chromatographic approaches that do not separate on the basis of charge.Citation31
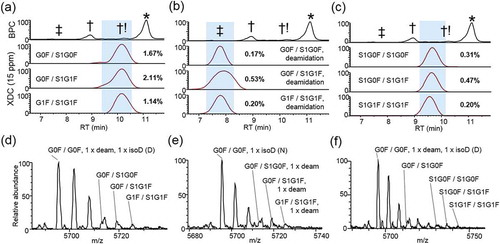
Sialic acids are monosaccharides that include a carboxylic acid group, which imparts a net decrease in protein pI, causing a shift to earlier RT. Neuraminic acid is a type of sialic acid that may be added to N-glycan structures of mAbs. Two neuraminic acid N-glycans, S1G0F and S1G1F, were identified in combinations with the abundant glycans G0F and G1F on isoforms that eluted early relative to the main peak (). By comparing the top three sialic acid-containing glycoforms to the top three main peak glycoforms, we estimated 2.47% relative abundance. We also identified the corresponding sialic acid-containing glycoforms that were also deamidated. These species were detected at approximately 0.45% abundance, but were easily identified due to the further decreased RT, owing to the decreased pI resulting from contributions from both deamidation and sialic acid (). Multiple species were identified containing two sialylated glycoforms (S1G0F/S1G0F, S1G0F/S1G1F, S1G1F/S1G1F), observed at approximately 0.49% relative abundance (). This species demonstrated a decreased RT compared to the moieties containing only one sialic acid glycan, consistent with the presence of an additional sialic acid relative to main peak glycoforms.
Figure 6. Acidic low-abundance isoforms. XDC traces (15 ppm) are plotted for top 3 glycoforms in combination with (a) one sialic (neuraminic) acid (S1G0F or S1G1F)-containing N-glycan, (b) one sialic acid-containing N-glycan and one deamidation, or (c) two sialic acid-containing N-glycans. Abundance of each isoform is shown as a percentage relative to main-fraction adjusted XDC peak area of G0F/G0F. (d), (e), and (f) show mass spectra averaged across highlighted RT respectively in (a), (b), and (c).
To quantify each of these PTMs, we summed the XDC peak areas of the top 3 PTM-glycoform species and divided by the summed XDC areas of the top 3 main peak glycoforms (G0F/G0F, G0F/G1F, and G1F/G1F) ().
Table 1. Relative abundances of minor trastuzumab charge variants. Relative abundances of several low-level modifications (succinimide on HC-D102, lysine on C-terminus, 1 x sialic acid N-glycoform +/- deamidation of LC-N30, and 2 x sialic acid N-glycoform) are shown as a percentage. Adjusted XDC peak areas represent only the main peak portion of the XDC total area under the curve reported by BioPharma Finder software. Relative abundances were calculated as the sum of the adjusted XDC peak areas of the top 3 glycoforms combined with each of the charge-bearing PTMs shown, divided by the sum of the XDC peak areas of the top 3 main peak glycoforms.
CVMS method optimized for high selectivity
We designed a ‘high selectivity’ variation on our CVMS method where we intended to accurately distinguish deamidation from the corresponding relatively unmodified isoforms. Deamidation of trastuzumab yields a theoretical mass difference of 6.75 ppm (, ). We repeated our chromatographic method and acquired high resolution MS spectra (60,000 FWHM at 200 m/z). The mass spectra corresponding to elution of the LC-N30 deamidation peak (experimental m/z 5484.500, z = 27+, apex RT = 14.2 min) as well as the main peak (experimental m/z 5484.454, z = 27, apex RT = 17.4 min) were manually investigated ().
Table 2. Trastuzumab PTMs and observed interfering isoforms. Trastuzumab modifications are organized by specific interfering isoforms which we observed using our CVMS method and the theoretical delta mass shown in ppm and nominal delta mass in Da. The maximum tolerance allowable for deconvolution mass and Sliding Window merge is calculated as ∆M/2, where ∆M relates to the difference in mass between two near-isobaric isoforms and a random dispersion of data points is assumed.
Figure 7. High Specificity Sliding Window ReSpect deconvolution. (a) Simulated spectra are shown for the deamidated (†) and relatively unmodified (*) isoforms of trastuzumab G0F/G0F 27+ charge states. The centroid peak apices of the two isoforms are distinguished by a calculated mass difference of 6.75 ppm. (b) Experimentally-measured m/z values for deamidated and unmodified G0F/G0F 27+ions are shown as profile and centroid. (c) Top panel shows base peak chromatogram (BPC) with labeled peaks corresponding to deamidated and relatively unmodified isoforms. Bottom panels show XIC traces for deamidated and unmodified isoforms rounded to nearest hundredth m/z value and plotted using a 3.3 ppm extraction width. (d) Major isoforms (corresponding to the top 3 glycan combinations +/- deamidation) are detected using Sliding Window deconvolution and plotted as individual XDC traces (3.3 ppm mass/merge tolerances).
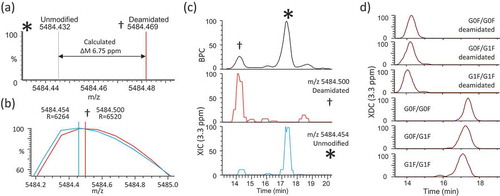
To assess whether the raw data could support the detection of deamidation on the intact isoforms, we plotted XIC traces of the experimental m/z values using a tolerance of 3.3 ppm, which is sufficiently narrow to prevent any overlap of the theoretical masses of deamidated and unmodified G0F/G0F trastuzumab (). The XIC traces clearly show unique elution profiles corresponding to individual deamidated and relatively unmodified isoforms (main peak). Sliding Window deconvolution successfully produced XDC plots (3.3 ppm mass/merge tolerance) of the top 3 glycoform species ± deamidation ().
The high mass accuracy of the raw data and deconvolution results we believe is achieved by virtue of IEC separation yielding mass spectra of “individualized” isoforms that are sufficiently separated from one another (). Without chromatographic resolution, these near-isobaric species would yield tremendous interference and prevent individual identification or quantitation of either species.
Table 3. Masses generated using respect deconvolution combined with sliding window. matched mass errors (Measured – Theoretical) are reported in ppm and Da.
Balanced CVMS method optimized for both selectivity and dynamic range
We further optimized our CVMS method to achieve a balance of high selectivity and high dynamic range. For this approach, we used a gradient of 1–8% in 30 min, and a 45,000 resolution Orbitrap setting for data acquisition to achieve reasonably high sensitivity compared to R = 60,000 setting and a 3.3 ppm mass/merge tolerance for Sliding Window deconvolution to maintain high selectivity in data analysis.
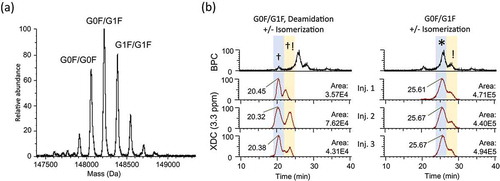
We measured a second, unrelated batch of trastuzumab in a set of 4 replicate analyses. Our method allowed us to reproducibly monitor individual, discrete XDC traces for the deamidated and main peaks of the top three glycoform species (). Our balanced method showed highly reproducible mass and RT data. We observed doublet peaks within the XDC traces of top glycoforms at the deamidation and main LC peaks that appear to correlate directly to the lower abundant HC-D102 peaks described previously.Citation23 Sensitivity to these isoaspartate species indicates that the ‘Balanced Method’ is indeed more sensitive than the ‘High Selectivity Method’ and with greater variability of peak areas for species below the 1e5 level.
Figure 8. Reproducibility of ‘Balanced Method’ optimized for both selectivity and dynamic range. (a) Deconvoluted spectrum shows a different glycosylation pattern for a second batch of trastuzumab analyzed using a method which was optimized for both specificity and dynamic range (Orbitrap resolution setting = 45,000, Sliding Window Deconvolution Mass/Merge Tolerance = 3.3 ppm, LC gradient = 1–8% B in 30 min). (b) XDC traces plotted at 3.3 ppm mass/merge tolerance demonstrate reproducibly sufficient separation in both mass and RT domains to distinguish deconvoluted G0F/G1F isoforms as being deamidated (LC-N30) or otherwise unmodified. Doublet peaks are observed for both the deamidated and main peak isoforms of G0F/G1F, presumably due to isomerization at HC-D102 as previously identified by Harris et al.Citation23
To understand the precision of our ‘Balanced Method’, we inspected the replicate data of the individual charge states that support the mass assignments of the isoforms identified by Sliding Window deconvolution. Analysis of the main and deamidated forms of the G0F/G1F glycoform showed that the charge states detected at >1e5 peak area have standard deviations <0.5 Da ().
Table 4. Mass precision of Sliding Window deconvolution-identified charge states in replicate CVMS analyses. Charge state value, mass mean (m/z), mass standard deviation (m/z, ppm, and Da), peak area, and apex RT are shown for the four most abundant charge state ions of the deamidated and main peak G0F/G1F isoforms identified by Sliding Window deconvolution.
We plotted the standard deviations for 90 charge states identified for 20 isoforms (3–5 charge states per isoform) detected in at least 2 of 4 replicates of our ‘Balanced Method’ (, Table S1). High abundance ions (>1e5 counts) demonstrated sub-Da precision across the quadruplicate CVMS analyses. Lowest abundance ions (<1e4 counts) demonstrated relatively poorer precision mass measurements with mass standard deviation ranging as high 2 Da that suggest insufficient mass precision for determining the presence of deamidation based solely on mass.
Figure 9. Individual charge state ions exhibit abundance-dependent mass precision. Mean peak area was calculated for 90 charge state ions corresponding to every isoform reproducibly identified by deconvolution across 4 replicates using our method optimized for both high sensitivity and high dynamic range.
Our analysis indicates that the utility of our CVMS method is contingent upon at least three different dimensions for success. With respect to determining the presence and quantity of any low-delta-mass modification such as deamidation, sufficient separation is required in both the mass and RT domains, while the former also requires a threshold-level ion abundance (approximately 1e5 peak area in this case).
Discussion
We report significant performance advantages using a native IEC-MS, or CVMS, method that can completely resolve large proteins of virtually the same molecular weight even within a narrow isoelectric range. We found this method to be sufficient for separating, detecting, and quantifying lysine truncation, glycosylation variants, deamidation, succinimide, and isoaspartic acid conversions. The combination of IEC-based CV analysis with native MS allows two dimensions of high resolution separation (mass and RT) for identifying and quantifying many isomers. These identifications can be further confirmed in a pseudo-third dimension in which isoform identification correlates with the expected elution behavior based on PTM chemical nature.
Low-mass PTMs such as deamidation pose a substantial challenge for intact mass analysis, particularly when using an approach based on RP or SEC (whether denatured or native). Our ‘Balanced Method’ CVMS experiment allowed Sliding Window deconvolution identification of isoforms across a dynamic range of almost three full orders of magnitude peak area abundance while reproducibly detecting deamidation versus main peak for the top three glycoforms. The most abundant charge states (peak area >1e5) maintained a mass standard deviation of less than 0.5 Da, which is suitable for directly identifying deamidation or any other PTMs that are approximately 1 Da or larger, assuming that baseline chromatographic separation has been achieved. Importantly, we also found that the lowest abundance tier of charge states (peak area <1e4) exhibited mass standard deviations as high as 2 Da, and thus are not suitable for distinguishing deamidation. Taken together, these data illustrate that low mass PTMs require sufficient abundance of an isoform in order to attain high precision mass measurements. The overall capacity of a CVMS experiment to accurately identify and quantify individual isoforms (including low mass PTMs such as deamidation) can be related to the degree of separation achieved by LC, the degree of mass separation between coeluting isoforms, and the absolute abundance of each of isoform.
Our findings support the notion that coupling properly suited chromatographic separation directly to MS can improve both mass accuracy and dynamic range, even when using significant concentrations of volatile salt in the mobile phase. This approach is particularly beneficial for MS1-only assignment of isoforms in intact mass analysis. The analytical advantage of our CVMS workflow has powerful implications for all fields of intact protein mass spectrometry, including biopharmaceutical characterization, proteomics, and structural biology.
Material and methods
WCX separation and native MS acquisition
Trastuzumab (21 ug in formulation buffer, produced in-house at Genentech) was injected using an autosampler-equipped Thermo Scientific Vanquish UHPLC system. Our ion exchange method optimized for MS sensitivity used a system of mobile phases A [50 mM ammonium acetate (99.9995% purity metals basis, Fluka), pH 6.6] and B [50 mM ammonium acetate, pH adjusted to 10.1 using ammonium hydroxide]. A 20 min gradient of 1–8% B was delivered at 0.3 mL/min through a ProPac WCX-10 column [5 μm particle size, 2.0 × 250 mm] (Thermo Fisher Scientific). The Orbitrap MS system (Q Exactive HF-X, Thermo Fisher Scientific) was operated in high mass range (HMR) mode using a resolving power of 45,000 or 60,000 (FWHM at m/z 200).
PTM analysis after proteolytic digestion
For LC-MS/MS analysis, six runs of 100 μg of trastuzumab were separated and fractionated offline, based on UV (280 nm) chromatogram, with a Shimadzu FRC-10A fraction collector, using identical conditions (column, gradient, and buffers) to the LC-MS analysis described above. Corresponding fractions from three runs were collected, pooled together and dried, resulting in two replicates for each fraction. Fractions were reconstituted in 50 mM ammonium bicarbonate pH 8, followed by reduction (10 mM dithiothreitol at 37°C for 1 hour) and alkylation (10 mM iodoacetamide at room temperature for 20 minutes). Fractions were digested overnight with trypsin (Promega, modified) at a 1:50 enzyme:substrate ratio at 37°C. Digestions were quenched with 2% trifluoroacetic acid and subjected to C18 stage-tip clean up. Samples were injected via an auto-sampler onto a 100 µm × 25 cm column (BEH, 1.7 μm, Waters Corp) at a flow rate of 0.7 µL/min using a NanoAcquity UPLC (Waters) system. A gradient from 98% Buffer A (water +0.1% formic acid) to 80% Buffer B (acetonitrile + 0.1% formic acid) was applied over 40 min at a flow rate of 0.5 µL/min. Samples were analyzed on-line via nanospray ionization into an Orbitrap Fusion Tribrid mass spectrometer (Thermo Fisher Scientific). Data were collected in data-dependent mode with HCD and ETD fragmentation. Extracted ion chromatograms corresponding to peptides of interest and area determinations were obtained through Qual Browser in Xcalibur 4.0 (Thermo Fisher Scientific). Data were also searched against the trastuzumab heavy and light chain sequences (Figure S1) using BioPharma Finder version 2.0 (Thermo Fisher Scientific).
Intact mass data analysis
Qual Browser (Xcalibur 4.0) software was used for creating and integrating the XIC trace of trastuzumab G0F/G0F 27+ion. BioPharma Finder version 3.0 (Thermo Fisher Scientific) was used for intact mass determination of raw MS spectra. The Sliding Window algorithm was used to generate a series of sequential average source spectra that were deconvoluted using the ReSpect™ algorithm iteratively along the separation time scale (time-resolved deconvolution). Deconvolved mass chromatograms (XDC) were constructed for each isoform using the summed intensities of all charge states identified in each of the averaged spectrum “windows”. Isoform abundance was calculated in BioPharma Finder software using the area under the curve in the XDC trace.Citation30
For our ‘high dynamic range’ scheme, we used moderately strict parameter settings for ReSpect deconvolution [Mass Tolerance 15 ppm], Sliding Window plotting/integration [Spectrum Width 0.3 min, Offset 1 scan, Merge Tolerance 15 ppm] and Sequence Matching [Mass Tolerance 50 ppm]. To match isoforms to the deconvolution masses, we used the amino acid sequences of the 2 pairs of light and heavy chains of trastuzumab, shown in Figure S1, and considered a static modification of 16 disulfide bonds (loss of 2.016 Da each), and variable modifications of lysine (+128.173 Da), aspartic acid conversion to succinimide (loss of 18.015 Da), as well as a database of common glycans found in Chinese hamster ovary cells.
For our ‘high selectivity’ and ‘balanced’ schemes, we used highly constrained parameter settings for ReSpect deconvolution [Mass Tolerance 3.3 ppm], Sliding Window plotting/integration [Spectrum Width 0.3 min, Offset 1 scan, Merge Tolerance 3.3 ppm] and Sequence Matching [Mass Tolerance 50 ppm]. Asparagine deamidation (+0.985 Da) was considered as a variable modification in addition to those used in the ‘high dynamic range’ scheme.
Theoretical protein isoform pI values were calculated with Prot pi software, version 2.2.7.113, using Expasy as the source for pKa values.
To estimate the relative abundance of specific isoforms, the total areas reported for Sliding Window deconvoluted chromatograms (XDC) of the top three most abundant glycoforms (G0F/G0F, G0F/G1F, G1F/G1F) were each multiplied by the fraction determined by XIC peak area of G0F/G0F 27+ (m/z = 5484.50) present at the main peak (63.2%) to calculate the fraction of the XDC area that comprised the main peak. The main-fraction XDC peak area of G0F/G0F was used a reference point of ‘100%’ for relative abundance measurements of all other isoforms identified. The abundance of specific PTMs was determined using the sum of the main-fraction XDC peak areas for the top three glycoforms compared with XDC peak areas of the top three glycoforms, which also bear that specific PTM.
Disclosure of Potential Conflicts of Interest
GH, WP and WS are current employees of Genentech, Inc., which develops and markets drugs for profit. AOB, PG, JS and JLJ are employees of Thermo Fisher Scientific, the company who manufactures and markets the chromatography and mass spectrometry instrumentation used.
Abbreviations
| CV | = | charge variant |
| CVMS | = | charge variant mass spectrometry |
| EMR | = | extended mass range |
| ESI | = | electrospray ionization |
| IEC | = | ion exchange chromatography |
| LC-MS | = | liquid chromatography-mass spectrometry |
| MW | = | molecular weight |
| nanoESI | = | nanoflow electrospray ionization |
| nMS | = | native mass spectrometry |
| PTM | = | post-translational modification |
| RP | = | reversed phase |
| RT | = | retention time |
| SEC | = | Size exclusion chromatography |
| UHPLC | = | ultra-high performance liquid chromatography |
| UV | = | ultraviolet |
| WCX | = | weak cation exchange |
| XDC | = | extracted deconvolution chromatogram |
| XIC | = | extracted ion chromatogram |
Supplemental Material
Download Zip (63.9 KB)Related Research Data
References
- Yin Y, Han G, Zhou J, Dillon M, McCarty L, Gavino L, Ellerman D, Spiess C, Sandoval W, Carter PJ. Precise quantification of mixtures of bispecific IgG produced in single host cells by liquid chromatography-Orbitrap high-resolution mass spectrometry. MAbs. 2016;8(8):1467–1476. doi:10.1080/19420862.2016.1232217.
- Marcoux J, Champion T, Colas O, Wagner-Rousset E, Corvaia N, Van Dorsselaer A, Beck A, Cianferani S. Native mass spectrometry and ion mobility characterization of trastuzumab emtansine, a lysine-linked antibody drug conjugate. Protein Sci. 2015;24(8):1210–1223. doi:10.1002/pro.2666.
- Katta V, Chait BT. Observation of the heme-globin complex in native myoglobin by electrospray-ionization. J Am Chem Soc. 1991;113(22):8534–8535. doi:10.1021/ja00022a058.
- Leney AC, Heck AJ. Native mass spectrometry: what is in the name? J Am Soc Mass Spectrom. 2017;28(1):5–13. doi:10.1007/s13361-016-1545-3.
- Rosati S, Yang Y, Barendregt A, Heck AJ. Detailed mass analysis of structural heterogeneity in monoclonal antibodies using native mass spectrometry. Nat Protoc. 2014;9(4):967–976. doi:10.1038/nprot.2014.057.
- Schachner L, Han G, Dillon M, Zhou J, McCarty L, Ellerman D, Yin Y, Spiess C, Lill JR, Carter PJ, et al. Characterization of chain pairing variants of bispecific IgG expressed in a single host cell by high-resolution native and denaturing mass spectrometry. Anal Chem. 2016;88(24):12122–12127. doi:10.1021/acs.analchem.6b02866.
- Zhang HM, Li C, Lei M, Lundin V, Lee HY, Ninonuevo M, Lin K, Han G, Sandoval W, Lei D, et al. Structural and functional characterization of a hole-hole homodimer variant in a “knob-into-hole” bispecific. Anal Chem. 2017;89(24):13494–13501. doi:10.1021/acs.analchem.7b03830.
- Debaene F, Boeuf A, Wagner-Rousset E, Colas O, Ayoub D, Corvaia N, Van Dorsselaer A, Beck A, Cianferani S. Innovative native MS methodologies for antibody drug conjugate characterization: high resolution native MS and IM-MS for average DAR and DAR distribution assessment. Anal Chem. 2014;86(21):10674–10683. doi:10.1021/ac502593n.
- Thompson NJ, Hendriks LJ, de Kruif J, Throsby M, Heck AJ. Complex mixtures of antibodies generated from a single production qualitatively and quantitatively evaluated by native Orbitrap mass spectrometry. MAbs. 2014;6(1):197–203. doi:10.4161/mabs.27126.
- Thompson NJ, Rosati S, Heck AJ. Performing native mass spectrometry analysis on therapeutic antibodies. Methods. 2014;65(1):11–17. doi:10.1016/j.ymeth.2013.05.003.
- Rosati S, Rose RJ, Thompson NJ, van Duijn E, Damoc E, Denisov E, Makarov A, Heck AJ. Exploring an orbitrap analyzer for the characterization of intact antibodies by native mass spectrometry. Angew Chem Int Ed Engl. 2012;51(52):12992–12996. doi:10.1002/anie.201206745.
- Rose RJ, Damoc E, Denisov E, Makarov A, Heck AJ. High-sensitivity Orbitrap mass analysis of intact macromolecular assemblies. Nat Methods. 2012;9(11):1084–1086. doi:10.1038/nmeth.2208.
- Makarov A. Electrostatic axially harmonic orbital trapping: a high-performance technique of mass analysis. Anal Chem. 2000;72(6):1156–1162.
- Makarov A, Denisov E. Dynamics of ions of intact proteins in the Orbitrap mass analyzer. J Am Soc Mass Spectrom. 2009;20(8):1486–1495. doi:10.1016/j.jasms.2009.03.024.
- Lossl P, Snijder J, Heck AJ. Boundaries of mass resolution in native mass spectrometry. J Am Soc Mass Spectrom. 2014;25(6):906–917. doi:10.1007/s13361-014-0874-3.
- Muneeruddin K, Nazzaro M, Kaltashov IA. Characterization of intact protein conjugates and biopharmaceuticals using ion-exchange chromatography with online detection by native electrospray ionization mass spectrometry and top-down tandem mass. Anal Chem. 2015;87(19):10138–10145. doi:10.1021/acs.analchem.5b02982.
- Muneeruddin K, Thomas JJ, Salinas PA, Kaltashov IA. Characterization of small protein aggregates and oligomers using size exclusion chromatography with online detection by native electrospray ionization mass spectrometry. Anal Chem. 2014;86(21):10692–10699. doi:10.1021/ac502590h.
- Chen B, Peng Y, Valeja SG, Xiu L, Alpert AJ, Ge Y. Online hydrophobic interaction chromatography-mass spectrometry for top-down proteomics. Anal Chem. 2016;88(3):1885–1891. doi:10.1021/acs.analchem.5b04285.
- Belov AM, Viner R, Santos MR, Horn DM, Bern M, Karger BL, Ivanov AR. Analysis of proteins, protein complexes, and organellar proteomes using sheathless capillary zone electrophoresis - native mass spectrometry. J Am Soc Mass Spectrom. 2017;28(12):2614–2634. doi:10.1007/s13361-017-1781-1.
- Patel K, Borchardt RT. Chemical pathways of peptide degradation II Kinetics of deamidation of an asparaginyl residue in a model hexapeptide. Pharm Res. 1990;7(7):703–711.
- Muneeruddin K, Bobst CE, Frenkel R, Houde D, Turyan I, Sosic Z, Kaltashov IA. Characterization of a PEGylated protein therapeutic by ion exchange chromatography with on-line detection by native ESI MS and MS/MS. Analyst. 2017;142(2):336–344. doi:10.1039/c6an02041k.
- Vlasak J, Ionescu R. Heterogeneity of monoclonal antibodies revealed by charge-sensitive methods. Curr Pharm Biotechnol. 2008;9(6):468–481.
- Harris RJ, Kabakoff B, Macchi FD, Shen FJ, Kwong M, Andya JD, Shire SJ, Bjork N, Totpal K, Chen AB. Identification of multiple sources of charge heterogeneity in a recombinant antibody. J Chromatogr B Biomed Sci Appl. 2001;752(2):233–245.
- Weitzhandler M, Farnan D, Horvath J, Rohrer JS, Slingsby RW, Avdalovic N, Pohl C. Protein variant separations by cation-exchange chromatography on tentacle-type polymeric stationary phases. J Chromatogr A. 1998;828(1–2):365–372.
- Zhang L, Patapoff T, Farnan D, Zhang B. Improving pH gradient cation-exchange chromatography of monoclonal antibodies by controlling ionic strength. J Chromatogr A. 2013;1272:.56–64. doi:10.1016/j.chroma.2012.11.060.
- Farnan D, Moreno GT. Multiproduct high-resolution monoclonal antibody charge variant separations by pH gradient ion-exchange chromatography. Anal Chem. 2009;81(21):8846–8857. doi:10.1021/ac901408j.
- Fussl F, Cook K, Scheffler K, Farrell A, Mittermayr S, Bones J. Charge variant analysis of monoclonal antibodies using direct coupled pH gradient cation exchange chromatography to high-resolution native mass spectrometry. Anal Chem. 2018;90(7):4669–4676. doi:10.1021/acs.analchem.7b05241.
- Konermann L. Addressing a common misconception: ammonium acetate as neutral pH “Buffer” for native electrospray mass spectrometry. J Am Soc Mass Spectrom. 2017;28(9):1827–1835. doi:10.1007/s13361-017-1739-3.
- Du Y, Walsh A, Ehrick R, Xu W, May K, Liu H. Chromatographic analysis of the acidic and basic species of recombinant monoclonal antibodies. MAbs. 2012;4(5):578–585. doi:10.4161/mabs.21328.
- Gazis PR, Horn DM The Sliding Window Algorithm for the Analysis of LC/MS Intact Protein Data Proceedings of the 63rd ASMS Conference on Mass Spectrometry and Allied Topics; 2015; St Louis, MO, USA.
- Lazar AC, Wang L, Blattler WA, Amphlett G, Lambert JM, Zhang W. Analysis of the composition of immunoconjugates using size-exclusion chromatography coupled to mass spectrometry. Rapid Commun Mass Spectrom. 2005;19(13):1806–1814. doi:10.1002/rcm.1987.