
 ?Mathematical formulae have been encoded as MathML and are displayed in this HTML version using MathJax in order to improve their display. Uncheck the box to turn MathJax off. This feature requires Javascript. Click on a formula to zoom.
ABSTRACT
Glycosylation of the conserved asparagine residue in each heavy chain of IgG in the CH2 domain is known as N-glycosylation. It is one of the most common post-translational modifications and important critical quality attributes of monoclonal antibody (mAb) therapeutics. Various studies have demonstrated the effects of the Fc N-glycosylation on safety, Fc effector functions, and pharmacokinetics, both dependent and independent of neonatal Fc receptor (FcRn) pathway. However, separation of various glycoforms to investigate the biological and functional relevance of glycosylation is a major challenge, and existing studies often discuss the overall impact of N-glycans, without considering the individual contributions of each glycoform when evaluating mAbs with highly heterogeneous distributions. In this study, chemoenzymatic glycoengineering incorporating an endo-β-N-acetylglucosaminidase (ENGase) EndoS2 and its mutant with transglycosylation activity was used to generate mAb glycoforms with highly homogeneous and well-defined N-glycans to better understand and precisely evaluate the effect of each N-glycan structure on Fc effector functions and protein stability. We demonstrated that the core fucosylation, non-reducing terminal galactosylation, sialylation, and mannosylation of IgG1 mAb N-glycans impact not only on FcγRIIIa binding, antibody-dependent cell-mediated cytotoxicity, and C1q binding, but also FcRn binding, thermal stability and propensity for protein aggregation.
Introduction
Genetic engineering is being applied to the design and production of biologics, and increasing numbers are gaining regulatory approval as biotherapeutics. This includes monoclonal antibodies (mAbs) that are produced by engineered Chinese hamster ovary (CHO) cells or murine NS0 cells. These proteins are subject to multiple co- and post-translational modifications as they transit the cell prior to secretion. One of the most common post-translational modifications is glycosylation,Citation1 the addition of oligosaccharides, which occurs during the generation of a glycoprotein. Oligosaccharides may be regarded as “The Third Life Chain”, after DNA and proteins, and is the subject of research to understand its contribution to the diversity of structure and function of glycoproteins. Glycans consist of chains of different types of sugars, with up to six different linkages and possible branching. Unlike proteins and DNA, which always have a linear sequence, the complexity and diversity of glycans make the study of their biological roles more difficult. N- and O-linked glycosylation are two forms of protein glycosylation in which either a nitrogen or oxygen molecule, respectively, is placed between the sugar and the amino acid residues on the proteins. N-glycosylation is known to have a variety of roles, including protein quality control, in a secretory pathway.Citation2 In the endoplasmic reticulum, the precise control of N-glycosylation by defined enzymes is the key to distinguishing between the correctly and incorrectly folded proteins. Only the correctly folded proteins will be transported to the Golgi apparatus. After protein transportation to the Golgi, glycosylation patterns become heterogeneous. This heterogeneity is due to the different glycosyltransferase levels and gene expression profile in addition to the availability and spatial localization of nucleotide-sugar substrates in the cytoplasm.Citation3
N-glycosylation of mAbs is most frequently formed at a conserved asparagine residue located in the heavy chain constant domain 2 (CH2) of the crystallizable fragment (Fc) region where the Asn-Ser-Thr consensus sequence is present. As described above, mAbs are usually produced in cell culture process, which results in highly heterogeneous glycosylation patterns. It has been more than 30 y since the very first mAb clinical trials were approved by the US Food and Drug Administration,Citation4,Citation5 and the accumulated scientific knowledge has shown that glycosylation is one of the most critical quality attributes (CQA) that impacts the safety, efficacy, and stability of mAb biotherapeutics. There are three classes of mAb mechanisms of action based on the type of antigen: 1) cell-bound antigen with depletion caused by Fc effector function; 2) cell-bound antigen with blocking or agonist activity caused by binding; and 3) soluble antigen with blocking caused by binding.Citation6 Studies show that glycosylation is a key factor that modulates the Fc effector functions,Citation7 influencing functions such as antibody-dependent cell-mediated cytotoxicity (ADCC) and complement-dependent cytotoxicity (CDC).Citation8 Both ADCC and CDC activities induce cytotoxicity through the lysis of target cells. ADCC activity involves cell surface antigen-bound mAbs that also bind Fcγ receptors. Fcγ receptors are expressed on various types of cells that are recruited to induce cell killing, including natural killer (NK) cells, dendritic cells, neutrophils, eosinophils, mast cells, B cells, and macrophages.Citation9-Citation11 Enhanced ADCC activity in biotherapeutics has been previously achieved through the removal of core fucosylation with α-1,6 linkage via controlled cell culture processes.Citation12 CDC activity is also known to be affected by N-glycosylation,Citation13,Citation14 which is activated by the binding of complement component C1q to the Fc region of the mAb to initiate the complement cascade. This process results in the cleavage of complements C4 and C3 and activates the membrane attack complex.Citation15
Another important Fc effector function is the mediation of the IgG serum recycling pathway through interactions with the neonatal Fc receptor (FcRn). This process is important in pharmacokinetics (PK) as a key part of regulating serum persistence.Citation16 FcRn is expressed in several organs and tissues.Citation17 It binds to IgGs under acidic conditions, leading to IgG internalization into the endosome either by pinocytosis or endocytosis. FcRn is known to interact with histidine residues of the region between the CH2 and CH3 domains of Fc by electrostatic interactions,Citation18,Citation19 which explains its pH-dependent affinity. This recycling pathway prevents IgG molecules from degrading in the lysosome, and IgGs dissociate from the FcRn at physiological pH to be released back into serum circulation.Citation17 Modulation of the binding affinity to FcRn has been shown to enhance antibody half-life in vivo.Citation20 N-glycosylation independent of FcRn interaction has also been described to affect the PK profile due to interactions with the endocytic mannose receptor. The terminal mannose on N-glycans therefore contributes to shortening the serum half-life of mAbs.Citation16,Citation21-Citation23 Another important attribute of therapeutics is safety. Specific glycan linkages such as galactose-α-1,3-galactose and certain types of sialic acid such as N-glycolylneuraminic acid (NGNA) have been reported to induce hypersensitivity reactions.Citation24,Citation25
Although the numerous studies pertaining to IgG glycosylation have focused on attributes such as safety, efficacy, and pharmacokinetic profiles, relatively few studies discuss the effect of N-glycosylation on the binding affinity of FcRn and stability of the therapeutic protein itself. Closely related to the protein stability, the propensity towards protein aggregation is another important attribute that can be caused by protein instability, and it also needs to be considered because of the risk of immunogenicity.Citation26,Citation27 Despite the recent efforts to elucidate the effect of the N-glycan on various attributes, the inevitable heterogeneity of mAbs produced by mammalian cell culture results in the inability to determine the contribution of each individual monosaccharide. To the best of our knowledge, the effects of each specific N-glycan structure, including glycans formed by core fucosylation, terminal galactosylation, and sialylation, on aggregation propensity has not been previously reported. Here, we report a focused evaluation of the effects of specific N-glycosylation patterns on the efficacy and stability of IgG1 mAbs with well-defined and highly homogeneous glycoforms generated by chemoenzymatic glycoengineering.Citation28
Results
Generation of IgG1 glycoforms with well-defined, homogenous Fc N-glycans
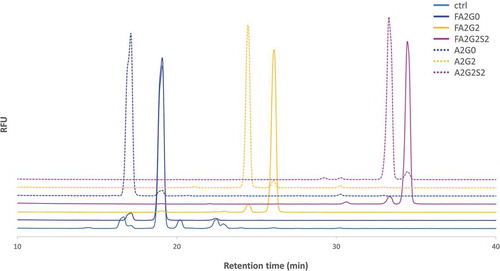
Two recombinant human IgG1 monoclonal antibodies with identical amino acid sequence were generated using the same CHO cell line. The control mAb (designated as “ctrl”) with core α-1,6-fucosylation was produced using a control cell culture condition, and a core non-fucosylated high mannose mAb (designated as “HM”) was produced with addition of Kifunensine to the control cell culture condition, as previously reportedCitation21 (). mAb-ctrl contained over 90% fucosylated species, where mAb-HM contained over 90% non-fucosylated and terminal mannosylated species calculated from 2-AB labeled released N-glycan analysis by hydrophilic interaction chromatography (). Incubation with endoglycosidase EndoS2 from Streptococcus pyogenes results in cleavage between the two GlcNAc residues in the chitobiose core of N-glycans,Citation29 which was confirmed with a reduced heavy chain mass analysis (, ). Both partially deglycosylated mAbs bearing one GlcNAc with or without an α-1,6-fucose (designated as “mAb-GlcNAc-Fuc” and “mAb-GlcNAc”), were further used as acceptors for transglycosylation (). Each fucosylated or non-fucosylated acceptor was then incubated with EndoS2-D184M and three different and defined glycan oxazoline. After the transglycosylation reaction was completed, six different IgG1 glycoforms with well-defined and homogeneous Fc N-glycans were generated and they were further analyzed in this study (, see also Figure S1 for detailed chemical structure). Intended enrichment of each specific N-glycan attached on heavy chains was confirmed by a reduced heavy chain mass analysis and was in a good agreement with the theoretical molecular mass (, ). The 2-AB labeled released N-glycan analysis by hydrophilic interaction chromatography showed over 90% homogeneity for all glycoforms (, ). No alternations to the light chains were observed by the reduced mass analysis (data not shown).
Table 1. 2-AB labeled N-glycan profile by HILIC analysis.
Table 2. Theoretical and observed mass for reduced heavy chain mass analysis.
Figure 1. Generation of IgG1 glycoforms with homogeneous glycoforms. (a) IgG1 N-glycosylation schematics and abbreviations used in this study for elucidating structures of complex type biantennary N-glycan. Presence of a core fucose is indicated by F; Ax indicates a biantennary glycan structure with the number (x) of GlcNAc on the antenna; Gx indicates the number (x) of galactose on the antenna; Sx indicates the number (x) of sialic acid on the antenna. Fuc: Fucose, Man: Mannose, GlcNAc: N-Acetylglucosamine, Gal: Galactose, SA: Sialic Acid. (b) Each core fucosylated and non-fucosylated homogeneous glycoform was generated from the same CHO cell line with or without Kifunensine to produce starting mAbs, control (ctrl) and high-mannose (HM). Subsequent deglycosylation and transglycosylation performed to obtain resulting homogeneous glycoforms. Endoglycosidase EndoS2 from S. pyogenes and D184 mutant as glycosynthase recombinantly expressed from E. coli. Glycan oxazolines (oxa) were used as well-defined donor substrates (Figure S1).
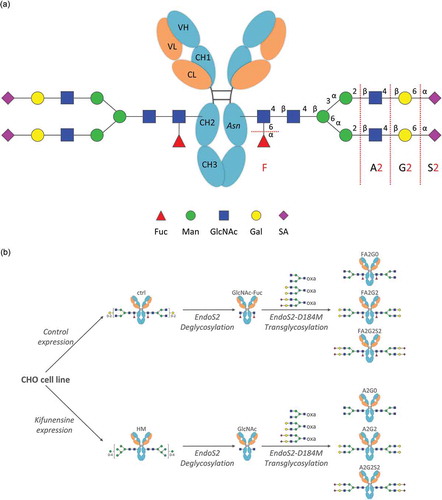
Figure 2. Reduced Heavy chain LC-MS analysis of glycoforms. Deconvoluted mass spectrometric data of heavy chain of starting mAbs, acceptors and resulting six glycoforms are shown to confirm intended transglycosylation and good agreement with theoretical molecular mass shown in . Starting mAbs showed relatively heterogeneous mass spectrum, where resulting acceptors and transglycosylated glycoforms showed highly homogeneous profile. Truncation of one sialic acid residue observed for mAb-FA2G2S2 and mAb-A2G2S2 is possibly due to fragmentation induced by ionization. No alternations in light chain were observed by the reduced mass analysis (data not shown).
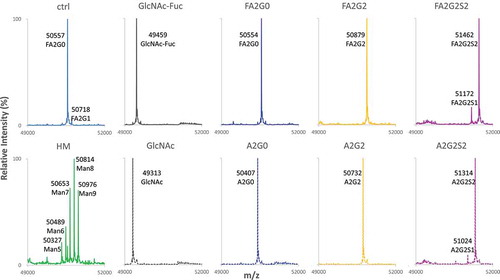
Figure 3. 2-AB labeled released N-glycan analysis of the transglycosylated glycoforms. N-glycans of heavy chain of the transglycosylated glycoforms were enzymatically released by PNGaseF and labelled by 2-AB for fluorescent detection in the HILIC mode separation to confirm the intended enrichment of N-glycans. Relative peak abundance of each glycoform was also described in , showing over 90% homogeneity for all transglycosylated glycoforms generated.
Effect of IgG1 N-glycosylation on FcγRIIIa binding affinity and ADCC activity
FcγRIIIa binding affinity
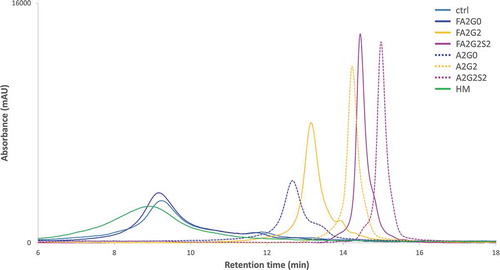
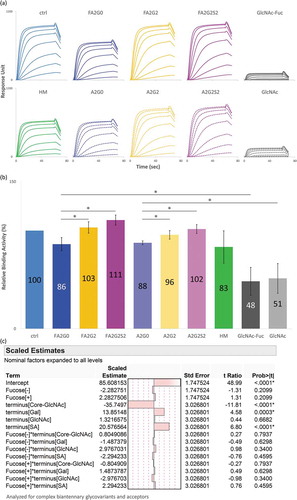
Homogeneous IgG1 glycoforms where evaluated for interaction analysis with FcγRIIIa using surface plasmon resonance (SPR) and affinity chromatography. Core defucosylation showed the most profound impact on relative binding activities both via SPR and affinity chromatography analyses ( and ). SPR analysis showed that in both non-fucosylated and fucosylated species, terminal galactosylation improved the binding affinity whereas sialylation slightly decreased the affinity (). These effects were more substantial with core defucosylation, indicating statistical interaction between core defucosylation, terminal galactosylation, and sialylation, which agreed with the statistical model (). Scaled estimates indicate a size of each effect to compare them on the response to factors such as terminal sugars and core fucosylation. The size of the effect by statistical interaction is shown as factors connected by asterisk in term row. Possible statistical interaction is graphically indicated by non-parallel lines in interaction profiles. In contrast to SPR analysis, FcγRIIIa affinity chromatography profile showed longer retention time of the terminally sialylated glycoforms compared to the terminally galactosylated glycoforms. Affinity chromatography also showed the significantly broadened peak shape and earlier elution of the terminally mannosylated mAb-HM (). Glycoforms that were partially deglycosylated to the core GlcNAc residues (mAb-GlcNAc-Fuc and mAb-GlcNAc) showed no binding to FcγRIIIa affinity column (data not shown). The kinetic constant could not be determined by 1:1 binding model from the obtained SPR sensorgrams for acceptors ().
Figure 4. Binding affinity of FcγRIIIa was increased by core defucosylation and terminal galactosylation, decreased by further terminal sialylation in SPR analysis. (a) Sensorgrams of each glycoform. Anti-His Ab was immobilized on CM5 chip. N-terminal his tagged FcγRIIIa captured and glycoforms as analytes were injected by single-cycle mode at five concentrations. (b) Relative binding activities of FcγRIIIa. Error bars represent SD of n = 3 and asterisks indicate statistical significance at p < 0.05. n.d: not determined. (c) JMP analysis: Scaled estimates of effect of glycosylation for binding affinity of FcγRIIIa. Analyzed for complex biantennary glycoforms. (d) JMP analysis: Interaction profile of terminal glycosylation for binding affinity of FcγRIIIa. Analyzed for complex biantennary glycoforms. In lower left panel, red: Gal, blue: SA, and green: GlcNAc. Significant statistical interaction between core fucosylation and terminal galactosylation (c-d).
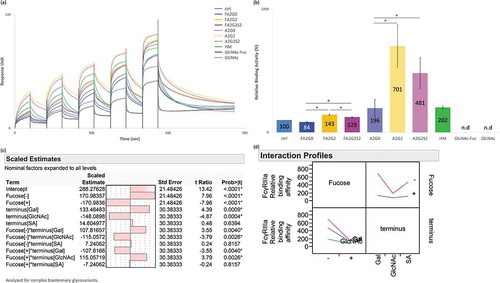
Figure 5. FcγRIIIa affinity chromatography showed longer retention by core fucosylation, terminal galactosylation and further sialylation. Non-glycosylated recombinant FcγRIIIa prepacked column was used to analyze the affinity interaction between transglycosylated glycoforms.
ADCC reporter bioassay
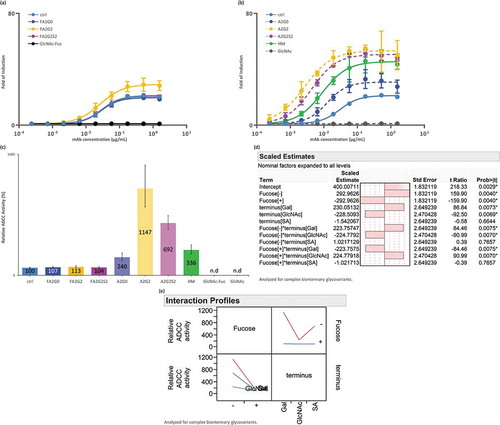
To further understand the effect of Fc glycosylation effect on the FcγRIIIa-mediated ADCC of each glycoform, an ADCC reporter bioassay was performed using the signaling nuclear factor of the activated T-cell (NFAT) pathway of FcγRIIIa-V158 engineered Jurkat effector cells and cells expressing the target antigen. Consistent with results for the SPR and affinity chromatography analyses described above, core defucosylation showed the most significant effect on ADCC activity, increasing the fold of induction and decreasing the EC50 ( and ). Galactosylation increased the activity whereas further sialylation showed decreased activity. Consistent with results for SPR analysis, significant statistical interaction between core defucosylation, terminal galactosylation, and sialylation was observed (). Partially deglycosylated mAb-GlcNAc-Fuc and mAb-GlcNAc showed no induction ().
Table 3. EC50 of each IgG1 glycoforms from ADCC reporter bioassay.
Figure 6. ADCC activity was increased by core defucosylation and terminal galactosylation, decreased by further sialylation in reporter bioassay for FcγRIIIa. Nuclear factor of activated T-cells (NFAT) engineered Jurkat cells expressing FcγRIIIa were incubated with target antigen expressing CHO-K1 cells. Receptor binding activates gene transcription through the NFAT pathway in effector cell leading to luciferase production and subsequent luciferase substrate addition was followed by luminescence detection. (a) Response curves of mAb-ctrl and fucosylated glycoforms. (b) Response curves of mAb-ctrl and non-fucosylated glycoforms. (c) Relative binding activity from EC50 of glycoforms. n.d: not determined. (d) JMP analysis: scaled estimates of effect of glycosylation for ADCC activity. Analyzed for complex biantennary glycoforms. (e) JMP analysis: Interaction profile of terminal glycosylation for ADCC activity. Analyzed for complex biantennary glycoforms. In lower left panel, red: Gal, blue: SA, and green: GlcNAc. Significant statistical interaction between core fucosylation and terminal galactosylation (d-e). Error bars represent 95% confidence interval of n = 3 (a-c).
Effect of IgG1 N-glycosylation on C1q binding affinity
C1q binding characteristics were analyzed by SPR with multi-cycle mode, where analyte was human serum C1q against each glycoform captured on a Protein A immobilized sensor chip (). All sensorgrams were fitted using the steady-state equilibrium model. Relative binding activity showed significant reduction by partial deglycosylation down to the core GlcNAc residues (mAb-GlcNAc-Fuc and mAb-GlcNAc). When compared to glycoforms with terminal GlcNAc (mAb-FA2G0 and mAb-A2G0), glycoforms with terminal galactose or sialic acid showed a moderate, but statistically significant, increase in relative binding activity. However, there was no statistically significant upregulation by further terminal sialylation (). The statistical model also showed that the significant effect on C1q binding affinity is derived from partial deglycosylation, terminal galactose, and there is no significant effect on C1q binding affinity by terminal sialylation and core fucosylation. There was also no significant statistical interaction between terminal sugars and core fucosylation ().
Figure 7. Binding affinity of C1q increased by terminal galactosylation and sialylation. (a) Sensorgrams of each glycoform. Glycoforms were first captured on Protein A chip and C1q as analytes were injected by multi-cycle mode at eight concentrations. Sensorgrams were fitted with steady-state equilibrium model. (b) Relative binding activities of C1q. Error bars represent SD of n = 3 and asterisks indicate statistical significance at p < 0.05. (c) JMP analysis: Scaled estimates of effect of glycosylation for binding affinity of C1q. Analyzed for complex biantennary glycoforms and acceptors.
Effect of IgG1 N-glycosylation on FcRn binding affinity
SPR analysis
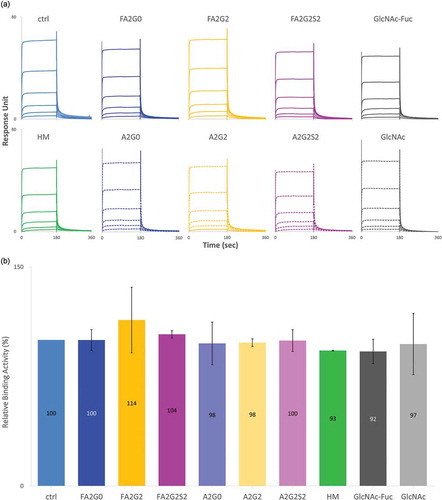
FcRn binding characteristics were analyzed by SPR and analytical affinity column. For SPR analysis, human FcRn was immobilized on a sensor chip and each glycoform was injected as analyte and processed in multi-cycle mode (). All sensorgrams were fitted with steady-state equilibrium model. Relative binding affinities were similar between the glycoforms, and no clear effect of terminal sugars or core fucose was observed ().
Figure 8. No effect of glycosylation for binding affinity of FcRn in SPR analysis. (a) Sensorgrams of each glycoform. FcRn was directly immobilized on CM5 chip and glycoforms as analytes were injected by multi-cycle mode at six concentrations. Sensorgrams were fitted with steady-state equilibrium model. (b) Relative binding activities of FcRn. Error bars represent variation range of n = 2.
Affinity chromatography
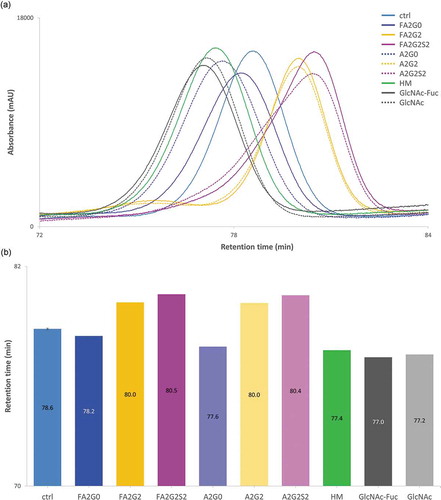
For pH gradient human FcRn affinity chromatography, sialylated and galactosylated glycoforms showed longer retention time compared to terminal agalactosylated species (mAb-FA2G0 and mAb-A2G0) which is consistent with previous reports.Citation30,Citation31 Partially deglycosylated glycoforms showed shorter retention time on the column, and the terminally mannosylated mAb-HM showed further shortened retention time compared to the other glycoforms ().
Figure 9. FcRn affinity chromatography showed longer retention by terminal galactosylation and sialylation. FcRn affinity chromatography utilized a human FcRn prepacked column. (a) Chromatograms and (b) Retention time of main peak. Terminal galactosylation and sialylation resulted in longer retention where mAb-HM and partially deglycosylated glycoforms showed the shortened retention. Error bar for mAb-ctrl represents SD of n = 6.
Thermal stability and aggregation propensity of IgG1 glycoforms
Thermal unfolding analysis
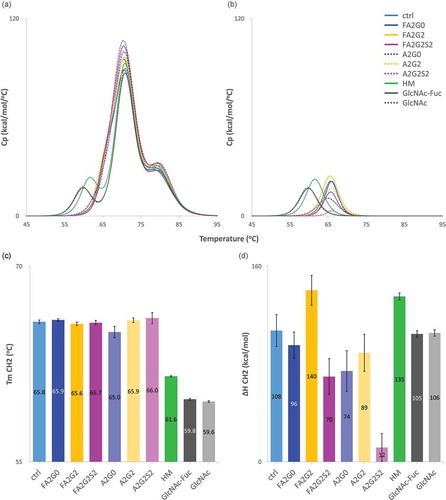
Differential scanning calorimetry (DSC) was used to determine the thermal unfolding temperatures (Tm), and calorimetric enthalpies (ΔH) of each glycoform as an index of protein thermal stability. Antibodies are known to have several melting transitionsCitation32 indicative of the unfolding of their various domains, and our peak assignments were based on previous reports of the thermal transitions of IgG1 antibodies.Citation33 The first transition peak corresponds to the unfolding of the CH2 domain, and the other two consecutive peaks represent unfolding of the antigen-binding fragment (Fab) and CH3 domains, respectively. Obtained thermograms were fitted using a non-two-state model and shown in . The first peak of each glycoform is shown in (see also Figure S2 for all fitted curves). Partially deglycosylated glycoforms and the terminally mannosylated mAb-HM showed considerably reduced thermal transition temperatures for CH2 domain compared to the other glycoforms (,c and ). As shown in , core defucosylation of complex biantennary glycoforms and terminal sialylation decreased ΔH of the CH2 domain, whereas terminal galactosylation increased ΔH of the CH2 domain. While the DSC data showed minor differences in the Tm of the CH2 domain in the biantennary glycoforms, the enthalpies of the unfolding of the CH2 domain differed significantly between all glycoforms.
Table 4. Thermal stability indicating temperature parmeters (°C).
Figure 10. Differential scanning calorimetry analysis of glycoforms showed thermal stability of CH2 domain was increased by terminal galactosylation and decreased in partially deglycosylated acceptors, terminally mannosylated mAb-HM, core defucosylated and terminal sialylated glycoforms. (a) Thermograms of each glycoform. (b) Transition peak of CH2 domain obtained from non-two-state curve fitting. (c) Thermal transition temperature Tm of CH2 domain obtained from curve fitting. Tm CH2 was significantly reduced in partially deglycosylated acceptors and terminally mannosylated mAb-HM. (d) Denaturation enthalpy ΔH of CH2 domain obtained from curve fitting showed significantly increased denaturing enthalpy by terminal galactosylation and decreased by core defucosylation and terminal sialylation. Error bars were generated based on variance of curve fitting using Origin software (c-d).
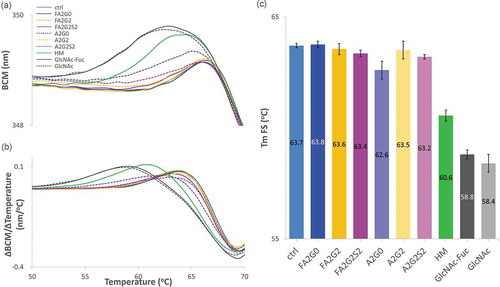
Fluorescence spectroscopy (FS) and static light scattering (SLS) techniques were used to simultaneously measure changes in tertiary structure and monitor the presence of aggregates. As shown in , barycentric mean (BCM) shift and its first derivative of each glycoform were plotted over temperature ramped from 20 to 90 °C, respectively. Melting temperatures obtained from FS (Tm FS) are shown in and found to be consistent with DSC data. Partially deglycosylated glycoforms and terminally mannosylated mAb-HM showed considerably reduced thermal transition temperatures. Core defucosylation slightly decreased Tm FS for all glycoforms. With a correlation coefficient of 0.98 between the Tm value of CH2 domain from DSC and Tm FS, BCM transition is highly likely to correspond to the unfolding of CH2 domain ().
Figure 11. Intrinsic fluorescence spectroscopy (FS) analysis to measure transition temperature showed transition temperature was decreased in partially deglycosylated acceptors and terminally mannosylated mAb-HM glycoforms. (a) Barycentric mean (BCM) shift curve. (b) First derivative of BCM shift and (c) peak top temperatures as Tm FS for each glycoform. Tm FS was significantly reduced in partially deglycosylated acceptors and terminally mannosylated mAb-HM. Error bars represent variation range of n = 2.
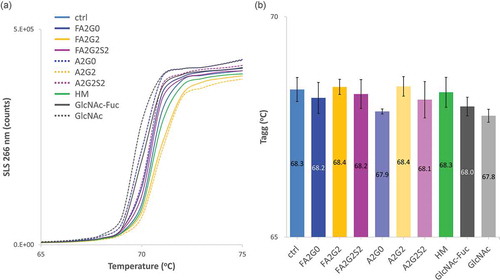
SLS count with temperature ramping is shown in and temperature onset of aggregation (Tagg) was calculated and shown in and . Terminally galactosylated glycoforms showed the highest Tagg, and core defucosylation slightly decreased Tagg for each complex biantennary glycoform except for the terminally galactosylated glycoforms.
Figure 12. Static light scattering analysis to measure aggregation propensity by temperature ramping showed aggregation temperature was increased by terminal galactosylation and decreased by terminal sialylation. (a) SLS counts of each glycoform. (b) Aggregation temperatures (Tagg) showed increased stability by terminal galactosylation and decreased stability by terminal sialylation. Core defucosylation also showed slightly decreased Tagg. Error bars represent variation range of n = 2.
Short-term forced degradation study to assess aggregation propensity
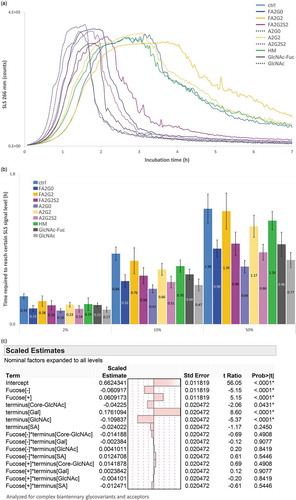
Short-term forced degradation study was performed to assess aggregation propensity after 65 °C for seven hours, and detected by SLS real-time monitoring analysis (). A cloudy solution was visually observed after the incubation for all glycoforms. The decrease in SLS signal after reaching the maximum could be due to the gross precipitation of the protein sample and consequent light obscuration. To assess the speed of aggregate formation, time required to reach certain SLS signal levels was calculated and shown in . Core defucosylation and terminal sialylation clearly accelerates the speed of aggregate formation, whereas terminal galactosylation clearly deaccelerated the speed of aggregate formation. Both terminus (core GlcNAc, galactose, GlcNAc, and sialic acid) and defucosylation effects on the speed of aggregation formation were also in agreement with the statistical model shown in , with significant difference established except for sialic acid. No significant statistical interactions between terminal sugars and core fucosylation were observed (see also Figure S3 for corresponding BCM shift consistent with defucosylation and terminus effect described).
Figure 13. Static light scattering analysis to measure aggregation propensity by isothermal incubation at 65 °C showed aggregation speed was decreased by terminal galactosylation and increased by core defucosylation and terminal sialylation. (a) SLS counts for seven hours. (b) Time required to reach 2, 10 and 50% of maximum SLS counts for each glycoform. Error bars represent SD of n = 3. (c) JMP analysis: Scaled estimates of effect of glycosylation for relative time required to reach certain levels. Time required to reach 2, 10 and 50% of maximum SLS counts was converted into relative time to average of mAb-ctrl and statistically analyzed for complex biantennary glycoforms and acceptors.
Long-term forced degradation study to assess aggregation and fragmentation propensity
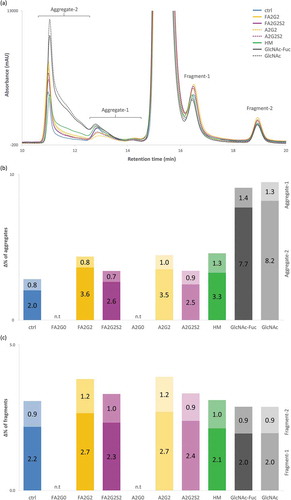
A long-term forced degradation study was performed to assess aggregation and fragmentation propensity by incubating samples in the formulation buffer at a concentration of 10 mg/mL, 50 °C for 17 days, except for mAb-FA2G0 and mAb-A2G0, which were excluded due to sample shortage. No differences in visual appearance were observed for solutions for all glycoforms, and they were all clear after the incubation. In the short-term stability evaluation, the SLS instrument uses a very small amount of sample in solution for the real-time monitoring, which is not suitable for long-term incubation, and thus size-exclusion chromatography (SEC) analysis could be performed. SEC analysis separated molecular size variants at the start of the incubation period, and after 10 and 17 days of incubation, and the chromatograms of glycoforms incubated for 17 days are shown in (see also Figure S4 for all chromatograms of three time points; initial, 10 and 17 days). There was only one high molecular weight species (HMW) peak and one low molecular weight species (LMW) peak separated from the main peak at the initial time point for all glycoforms, but new HMW and LMW peaks were detected after incubation at 50 °C. We divided the HMW peaks into two regions and classified them as aggregate-1 and aggregate-2, and similarly for the LMW species as fragment-1 and fragment-2. Each species possibly contains several size variants (e.g., dimer, trimer and multimer species), but we did not characterize them in this study. Apparently, N-glycosylation has much a larger effect on altering the propensity of aggregation than the propensity of fragmentation. ,c show the percent increase of each aggregate and fragment species calculated by subtraction of relative percent peak area of each peak detected at the initial time point. Partial deglycosylation to the innermost GlcNAc residue greatly increased aggregation compared to other glycoforms tested, whereas partially deglycosylated glycoforms showed the comparable levels of fragmentation to mAb-ctrl. Terminally mannosylated and galactosylated glycoforms showed the second highest levels of aggregation but were comparable with each other. Terminally galactosylated glycoforms showed a slightly increased level of fragmentation, but the overall difference was minimal among all the glycoforms tested. Core defucosylation among tested glycoforms did not show a difference in percent increase for either aggregation or fragmentation. Retention time of main peak for each glycoform observed in SEC analysis showed consistent effects of terminal galactosylation leading to longer retention, and terminal sialylation and defucosylation for shortened retention among glycoforms with complex type biantennary N-glycan (Figure S4 B).
Figure 14. Long-term forced degradation analyzed by size-exclusion chromatography showed significant increase of aggregation species in acceptors, mAb-HM and terminally galactosylated glycoforms but overall the same level of fragmentation among all glycoforms tested. (a) Chromatographic comparison of glycoforms after incubation for 17 days. (b) % increase of HMW species, with each aggregate-1 and aggregate-2 on top and bottom, respectively. (c) % increase of LMW species, with each fragment-1 and fragment-2 on bottom and top, respectively. n.t: not tested (b-c).
Discussion
In this study, we used chemoenzymatic transglycosylation glycoengineering to generate IgG1 mAb glycoforms with homogeneous Fc N-glycans and further characterized and elucidated their influence on effector functions and thermal stability considering the contribution of each major N-glycan structure.
Effector functions and affinity characteristics to Fc receptors
Consistent and robust upregulating effects of core defucosylation and the terminal galactosylation were observed in all analysis with respect to FcγRIIIa binding activity. Our observations for core defucosylation were supported by many previous studies investigating both heterogeneous and homogeneous glycoforms.Citation12,Citation13,Citation22,Citation34-Citation42 However, no consensus has been reached regarding the effects of terminal galactosylation, with some reports describing an upregulationCitation36-Citation39,Citation42-Citation44 and no effectCitation45-Citation47 or downregulationCitation48 of FcγRIIIa affinity or ADCC activity. Since our results demonstrated significant statistical interaction between core fucosylation and terminal galactosylation, and are in strong agreement with previous studies utilizing mAbs with highly homogeneous glycoforms,Citation37-Citation39,Citation42 we hypothesize that the interpretation of results could be compromised when evaluating mixtures of different types of glycoform. Our evaluations of the effects of terminal sialylation in FcγRIIIa binding analysis by SPR and ADCC reporter bioassay using N-glycosylated ligand agree with previous reports that have described reduction of FcγRIIIa affinity,Citation13,Citation38,Citation40,Citation46,Citation49,Citation50 but found no evidence of an unchanged affinity as previously reported.Citation30,Citation34,Citation51,Citation52
For terminally sialylated glycoforms and terminally mannosylated mAb-HM, results regarding FcγRIIIa shown in SPR and ADCC reporter bioassay were significantly different from affinity chromatography analysis. Affinity chromatography analysis used ligand without glycosylation and with eight amino acid mutations.Citation53 FcγRIIIa has five putative N-glycosylation sites, and those N-glycosylations at Asn-162 and Asn-45 have been reported to be key regulators of IgG-Fc binding.Citation54,Citation55 To the best of our knowledge, however, no reports have indicated that each one of those amino acid mutations modulate IgG-Fc binding. Either one or both of those two factors could have an effect on the interactions between terminal galactosylation/sialylation/mannosylation and FcγRIIIa binding.
An important aspect of the affinity chromatography method for affinity characteristic analysisCitation30,Citation53 is that the FcRn affinity chromatography showed the ability to separate different species with different affinities to the ligand, which SPR cannot distinguish. FcRn affinity chromatography with linear pH gradient mode is more physiologically representative than SPR analysis, which uses an acidified running buffer. Enhanced affinity from longer retention by terminal galactosylation and sialylation observed agrees with previous reports,Citation30,Citation31 but our results were able to discern for the first time retention differences between partial deglycosylation to core GlcNAc and no effect due to core fucosylation.
For C1q binding, the effect of core fucosylation and terminal mannosylation observed in our study was consistent with previous studies, where core fucosylation had no impactCitation12,Citation22,Citation35,Citation56 and high mannose glycoform showed impaired binding.Citation21,Citation23,Citation45,Citation57 However, the effect of terminal galactosylation for C1q binding and/or CDC activity is still unclear, where upregulating,Citation13,Citation14,Citation47,Citation48,Citation51,Citation53,Citation58 unchanging,Citation45,Citation59 and even downregulatingCitation45 effects were previously reported. Some early studies used guinea pig serum for CDC assays which also could explain discrepancies.Citation23,Citation45 According to our current knowledge, there are no reports investigating C1q binding to mAbs with highly homogeneous glycoforms. Based on the collective evidence so far, we think our data with highly homogeneous glycoforms also supports the general effect of terminal galactosylation to upregulation of C1q binding. Additional terminal sialylation resulted in a slight, albeit not statistically significant increase in C1q binding in our study, where previous reportsCitation45,Citation51 concluded that C1q binding is not affected by terminal sialylation. A crystal structure of homogeneous IgG-Fc glycoform with terminal α-2,6-sialylation has been recently reported,Citation60 but no other comparative structural research to understand the interaction between both FcγRIIIa and C1q binding to terminally sialylated glycoforms compared to terminally galactosylated glycoform, which is necessary to further discuss our findings. Overall, in agreement with many previous studies, core fucosylation, terminal galactosylation, and partial deglycosylation were found to be key attributes that significantly impact the FcγRIIIa binding affinity, ADCC activity and C1q binding affinity, but we also found FcRn binding affinity was affected by N-glycosylation.
Thermal stability
To the best of our knowledge, this is the first report precisely evaluating the effect of core fucosylation and terminal glycosylation of complex biantennary glycoforms on thermal stability of IgG1. In this study, we demonstrated that core defucosylation, terminal galactosylation, and terminal sialylation had the same effects on antibody stability in the thermal unfolding assay and short-term forced degradation study. Core defucosylation for glycoforms with terminal GlcNAc, galactose, and sialic acids showed impaired stability, whereas terminal galactosylation showed a stabilizing effect and terminal sialylation showed a destabilizing effect. The long-term forced degradation study did not show significant differences in aggregation and fragmentation propensity between core fucosylated and defucosylated glycoforms; however, potential risk must be assessed when choosing target product profiles for therapeutic development.
Another important observation in this study was the effect of terminal galactosylation of the glycoforms evaluated on the thermal stability. Terminal galactosylation showed a stabilizing effect, conversely to the destabilizing effect of terminal sialylation in the thermal unfolding evaluation by DSC and short-term forced degradation study. It has been reported that N-glycans form non-covalent interactions between carbohydrate and hydrophobic residues in Fc region, and can play an important role not only in the structural integrity of the Fc regionCitation61 and in reducing the dynamics of CH2 domain to maintain proper higher order structure, but also in preventing aggregation prone regions from solvent exposure.Citation59,Citation62-Citation64 Previous studies have supported the stabilizing effect of terminal galactosylation, with collective evidence indicating that the terminal galactose of N-glycan, especially the α-1,3-galactose, interacts with Lys246 of the CH2 domain.Citation43 More hydrogen bonds between sugar residues and amino acids are formed with terminally galactosylated glycoforms,Citation13,Citation62 which may contribute to stabilizing the CH2 domain. Increased denaturation enthalpy ΔH by terminal galactosylation observed in our study agrees with previous studies,Citation53,Citation65 from which we hypothesize that aggregation propensity was also reduced by terminal galactosylation. The IgG molecule with high mannose glycan showed remarkably decreased Tm CH2 and Tm FS, and could impact the aggregation propensity demonstrated in this and previous reports.Citation66,Citation67 The reduced stability and increased aggregation propensity of high mannose glycoforms are likely closely related to the structural integrity of CH2 domain.
Glycan-glycan interactions were previously reported to affect the hydrodynamic radius of the antibody.Citation13,Citation61,Citation68 In our observation, partial deglycosylation, core defucosylation, and terminal sialylation all showed the shortened retention of the main peak, whereas galactosylation with longer retention in the SEC analysis. It is speculated that these differences in the retention correlate to the change in hydrodynamic radius. The apparent molecular hydrodynamic radius increase by deglycosylation has also been previously reported,Citation69 supporting our observation. We hypothesize that aggregation propensity of mAb caused by different glycosylation is highly correlated with hydrodynamic radius since this observation corresponds to the effects of each core fucosylation and terminal glycosylation on thermal stability. Although thermal unfolding and the short-term forced degradation study showed similar effects of core fucosylation, terminal galactosylation, or sialylation, the long-term forced degradation study demonstrated that terminally galactosylated glycoforms showed higher aggregation than terminally sialylated glycoforms. This result indicates that degalactosylation and sialylation reduces the aggregation propensity for the long-term thermal stressed condition. With our observed data, we can only hypothesize that temperature (65 °C or 50 °C), duration (seven hours or 17 days), protein concentration, or a combination of these factors may be the reason for the different results. Fragmentation, as detected by SEC analysis, also showed minimal variations amongst the glycoforms. A previous report showed that high temperature (50 °C)-induced fragmentation was confirmed to occur by cleavage of the hinge region to form Fab-Fc and Fab/Fc fragments.Citation70 We hypothesize that the long-term thermal stressed condition did not have major effects on fragmentation derived from the hinge region, and that perhaps resulted in the overall same level of fragmentation with different Fc-glycosylation structure in CH2 domain.
In summary, chemoenzymatic transglycosylation glycoengineering was used to generate IgG1 glycoforms with highly homogeneous N-glycans, and our evaluations of each glycoform found very specific N-glycosylation impacts on Fc effector functions and protein stability. The effect of each glycoform has been difficult to clearly elucidate in previous studies using heterogeneous glycoforms, and this study offers an opportunity for more detailed understanding of the effects of specific glycans on mAb therapeutic development.
Materials and methods
Cell culture to generate starting mAbs (mAb-ctrl and mAb-HM)
All human IgG1 monoclonal antibodies in this study were produced at Astellas Pharma. A production cell culture for mAb-HM was performed with Kifunensine (Carbosynth, Cat # MK10316), a small molecule inhibitor of the enzyme α-mannosidase I, directly added into an in-house chemically defined cell culture media at final concentration of 80 μg/L to obtain mAb with high mannose glycoform.Citation21 A production cell culture for mAb-ctrl was performed without Kifunensine. Both produced mAbs were then purified according to the in-house protocol, finally formulated at 20 mg/mL IgG concentration in a buffer containing histidine and arginine at pH 6.0 (Ajinomoto, Cat # 8004011000 and 8003178000, respectively).
Plasmid construction and preparation for recombinant expression of enzymes
All gene fragments and plasmids were synthesized, cloned and obtained by utilizing GeneArtTM gene synthesis service provided by Thermo Fisher Scientific. ndoS2 gene from S. pyogenes was cloned into Novagen pET-42a vector (Merck Millipore, Cat # 70561). Briefly, ndoS2 gene fragment (GenBank accession number KC155346, from 192 to 2614) was synthesized with 5ʹ- PstI and 3ʹ- XhoI recognition sequences (CTGCAG and CTCGAG) attached as cloning sites. ndoS2 gene fragment was then cloned into 5ʹ terminal of GST tag gene in the pET-42a vector, namely to obtain pET-42_a_ndoS2-WT plasmid. The replacement of GAT (D: Asp) nucleic acid sequence (ndoS2 gene fragment from GenBank accession number KC155346, from 632 to 634) with ATG (M: Met) was incorporated, resulting in corresponding D184M mutation. pET-42_a_ndoS2-D184M plasmid was then obtained with the same procedure as the wild-type plasmid.
Recombinant expression of GST-EndoS2 and GST-EndoS2-D184M
Each plasmid was transformed into E. coli BL21(DE3) (Merck Millipore, Singles™ Competent Cells, Cat # 70235–3) and grown on an agar LB (Nacalai Tesque, Cat # 20066–95) plate containing 20 μg/mL kanamycin (Wako, Cat # 115–00342) overnight at 37 °C. Each recombinant clone was selected and cultured in a liquid LB medium containing 20 μg/mL kanamycin for six hours at 30 °C to obtain research cell banks (RCB), maintained as stocks in glycerol (Nacalai Tesque, Cat # 17018–83). Each RCB was inoculated and pre-cultured in a liquid LB medium containing 100 μg/mL kanamycin at 0.1% v/v for overnight at 30 °C. Pre-culture was then inoculated in a fresh liquid LB medium containing 100 μg/mL kanamycin at 1% v/v and cultured for two hours to mid-exponential phase. The expression of the protein GST-EndoS2 and GST-EndoS2-D184M was induced with 0.1 mM IPTG (Invitrogen, Cat # 099–02534) for 24 hours at 25 °C. The cells from each cell culture were harvested by centrifugation at 4,000 x g for 15 minutes at 4 °C and each cell pellet was resuspended in phosphate-buffered saline (PBS) (Nippon Gene, Cat # 314–90185). Resuspended cells were lysed by ultrasonication and then centrifugated at 15,000 x g for 15 minutes at 4 °C, followed by filtration by a 0.22 μm filter (Merck Millipore, Cat # SLGV033RS). Both recombinant GST-EndoS2 and GST-EndoS2-D184M was purified on a column with glutathione-Sepharose 4B (GE Healthcare Life Sciences, Cat # 17–0756-01) and eluted with reduced glutathione (Wako, Cat # 073–02013), followed by a buffer exchange using 10 kDa Amicon Ultra-4 (Merck Millipore, Cat # UFC801024). GST-EndoS2 was buffer exchanged into PBS pH 7.4 at 10 mg/mL and GST-EndoS2-D184M into 100 mM Tris-HCl, pH 7.4 (Nippon Gene, Cat # 318–90225) at 2 mg/mL. The protein purity was confirmed by SDS-PAGE and the concentration was measured on a NanoDrop 2000 (Thermo Fisher Scientific) using absorbance at 280 nm. Extinction coefficients were determined using ProtParam on the ExPASy Server (https://web.expasy.org/protparam/).
Deglycosylation, transglycosylation and following affinity purifications
Deglycosylation and preparation of acceptors
To prepare acceptors, mAb-ctrl and mAb-HM were first deglycosylated by GST-EndoS2, leaving core GlcNAc-Fucose and GlcNAc, respectively, on their Asn residues (). Each mAb was incubated at a final concentration of 135 μM with GST-EndoS2 (0.00024 and 0.0048 molar equivalent to mAb-ctrl and mAb-HM, respectively) in a deglycosylation buffer (10 mM sodium phosphate, 150 mM NaCl, pH 7.4) at 37 °C for five hours. The reaction solution was then subjected to affinity purification utilizing Protein A (MabSelect SuRe, GE Healthcare Life Sciences, Cat # 17–5438-03) and Amicon Pro Purification System with 10 kDa Amicon Ultra-0.5 Device (Merck Millipore, Cat # ACS501024), buffer exchanged to a consecutive transglycosylation reaction buffer (100 mM Tris-HCl, pH 7.4) to prepare each acceptor (mAb-GlcNAc-Fuc and mAb-GlcNAc).
Transglycosylation
α-2,6-sialylglyco (SG)-oxazoline, asialo (G2)-oxazoline and agalacto (G0)-oxazoline were purchased from Fushimi Pharmaceutical (Cat # 171810, 171814 and 171815, Figure S1). Preparation steps were essentially as described previously.Citation71,Citation72 Briefly, α-2,6-sialylglycopeptide was isolated from hen’s egg yolk, and subsequently each asialoglycopeptide and agalactoglycopeptide was obtained by enzymatic truncation of each of two sialic acids and galactoses, followed by oxazoline formation. Each SG-oxa, G2-oxa and G0-oxa was transferred onto remaining N-linked core GlcNAc-Fuc or GlcNAc residue on each acceptor (mAb-GlcNAc-Fuc and mAb-GlcNAc) by transglycosylation using GST-EndoS2-D184M (). Each acceptor was incubated at final concentration of 100 μM with GST-EndoS2-D184M (3.0 mmolar eq.) with additions of each SG-oxa, G2-oxa and G0-oxa (10 molar eq.) for two times with an interval of 20 minutes in a transglycosylation buffer (100 mM Tris-HCl, pH 7.4, a previously reported buffer to be suitable for α-2,6-sialylglyco oxazoline stabilityCitation71 and transglycosylation reactionsCitation28) at 30 °C for total 40 minutes. Each reaction solution was then subjected to affinity purification as previously described with buffer exchanged into the formulation buffer (histidine and arginine, pH 6.0). Two acceptors were also buffer exchanged into the same formulation buffer for further analysis.
UHPLC system used for chromatographic separations
All chromatographic separations were carried out on a Nexera UHPLC (Shimadzu) equipped with a diode-array detector and a fluorescence detector unless otherwise noted. All chromatography data analysis was performed using a LabSolutions version 5.86 software (Shimadzu).
Reduced heavy chain mass analysis
Each mAb was reduced at 1 mg/mL with 25 mM dithiothreitol in a reduction reaction buffer (1 mM EDTA, 7.5 M Guanidine, 0.1 M Tris-HCl, pH8.0) at 37 °C for 30 minutes. Reduced heavy chain mass analysis utilized chromatographic separations performed on an ACQUITY UPLC H-Class System (Waters) equipped with a diode-array detector and a Zorbax 300 SB-CN column (Agilent, 2.1 × 150 mm, 5 μm, Cat # 883750–905) followed by a quadrupole time-of-flight (Q-TOF) mass spectrometry (Synapt G2-S Q-TOF instrument, Waters). The mobile phase A (MPA) was composed of 0.1% trifluoroacetic acid (TFA). The mobile phase B (MPB) was composed of 0.1% TFA, 80% 1-propanol and 10% acetonitrile. The column was equilibrated with 75% MPA and 25% MPB. Each reduced mAb was injected at amount of 10 μg onto a 70 °C column and eluted using gradient from 25–60% MPB at 0.2 mL/min over 16 minutes. Absorbance was detected at λ = 214 and 280 nm. Mass spectrometric data were collected with a m/z range of 1000–5000 and corresponding m/z values for each reduced heavy chain of mAb were determined using Q-TOF mass spectrometry. The deconvolution of mass spectrometric data was performed with a MaxEnt1 algorithm, part of the MassLynx version 4.1 software (Waters).
2-AB labeled released N-glycan analysis by hydrophilic interaction chromatography
N-glycosylation analysis utilized an all-inclusive EZGlyco kit for sample preparation (Sumitomo Bakelite, Cat # BS-X4410). The kit contains mAb capturing Protein A column, PNGaseF for enzymatic N-glycan release, 2-Aminobenzamide (2-AB) as fluorescent labeling reagent and final purification column for excess labeling reagent removal. According to the manufacturer’s protocol, each mAb sample was applied to a Protein A column for capture followed by an enzymatic N-glycan release with PNGaseF. Released N-glycans were then labeled by 2-AB reagent at their reducing ends, and then excess labeling reagent was removed and 2-AB labeled N-glycans were purified to be subjected to HILIC analysis. HILIC analysis of 2-AB labeled N-glycans utilized an ACQUITY UPLC Glycan BEH Amide column (Waters, 130 Å, 1.7 µm, 2.1 × 150 mm, Cat # 186004742). MPA was composed of 100 mM ammonium formate, pH 4.5. MPB was composed of acetonitrile. The column was equilibrated with 25% MPA and 75% MPB. Each 2-AB labeled glycan was injected onto a 45 °C column and eluted using gradient from 25–50% MPA at 0.25 mL/min over 50 minutes. Fluorescence was detected by excitation at λ = 330 nm, emission at λ = 420 nm.
SPR affinity characterizations
SPR analysis was performed on a Biacore T200 (GE Healthcare Life Sciences). Each resulted sensorgram was processed by Biacore T200 Evaluation Software (GE Healthcare Life Sciences) for binding analysis, using either a 1:1 binding model or a steady-state equilibrium model. Each relative binding activity was calculated by the following equation.
All sensor grams were generated by subtraction of each flow cell (FC), FC2 – FC1 and FC4 – FC3.
FcγRIIIa
Recombinant human FcγRIIIa-V158 used in the SPR analysis was expressed in mouse myeloma cell line and His-tagged on their C-terminal with five putative N-glycosylation sites (NS0-derived, Gly17-Gln208, R&D Systems, Cat # 4325-FC-050, GenBank accession number AAH17865), N-glycosylation profile of FcγRIIIa from R&D Systems was analyzed and reported.Citation73 For interaction analysis of captured Fcγ receptors and IgG1 mAb glycoforms, an anti-His capturing antibody (GE Healthcare Life Sciences, Cat # 28–9950-56) was immobilized to reach 10,000 RU onto two flow cells (FC2 and FC4) of a CM5 chip (GE Healthcare Life Sciences, Cat # BR100530) using the standard amine coupling kit (GE Healthcare Life Sciences, Cat # BR-1000–50) including EDC (1-ethyl-3-(3-dimethylaminopropyl) carbodiimide hydrochloride), NHS (N-hydroxysuccinimide) and ethanolamine-HCl. Fcγ receptor was injected onto two flow cells (FC2 and FC4) and captured (0.1 μg/mL for 60 sec at 5 µL/min) and followed by subsequent injection several dilutions of IgG1 glycoforms onto all flow cells by a single-cycle mode (74–6000 nM, 5 dilutions, all for 60 sec at 30 µL/min). After monitoring the dissociation phase (300 sec), the surface was regenerated for 30 sec at 30 µL/min by a 10 mM Glycine pH 1.5 (GE Healthcare Life Sciences, Cat # BR-1003–54). Experiments were carried out using HBS-EP+, pH 7.4 buffer (GE Healthcare Life Sciences, Cat # BR-1006–69).
FcRn
Recombinant human FcRn used in the SPR analysis was expressed in HEK293 cell line and purified as heterodimer of human FCGRT/B2M with one putative N-glycosylation site on FCGRT (Sino Biological, Cat # CT009-H08H, UniProt accession number P55899). For interaction analysis of immobilized FcRn and IgG1 mAb glycoforms, FcRn was directly immobilized to reach 70 RU onto two flow cells (FC2 and FC4) of a CM5 chip as described above. Several dilutions of IgG1 glycoforms were injected onto all flow cells by a multi-cycle mode (12–3000 nM, 6 dilutions, for 180 sec at 30 µL/min). After monitoring the dissociation phase (180 sec), the surface was regenerated for 120 sec at 30 µL/min by a 20 mM Tris-HCl pH 8.0. Experiments were carried out using PBS, 0.05% P-20, pH 6.0 buffer (TEKnova, Cat # P1192).
C1q
C1q used in the SPR analysis was purified from human serum as 18 polypeptide chains consisting of three nonidentical A, B, C subunits (SIGMA, Cat # C1740-1MG). For interaction analysis of captured IgG1 mAb glycoforms and C1q, 135 nM of each mAb glycoform was captured for 60 sec at 5 µL/min onto two flow cells (FC2 and FC4) of a Protein A chip (GE Healthcare Life Sciences, Cat # 29127556). Several dilutions of C1q were injected onto all flow cells by a multi-cycle mode (1–50 μg/mL, 8 dilutions, for 60 sec at 30 µL/min). After monitoring the dissociation phase (10 sec), the surface was regenerated for 30 sec at 30 µL/min by a 10 mM Glycine pH 1.5. Experiments were carried out using HBS-EP+, pH 7.4 buffer.
ADCC reporter bioassay
ADCC reporter assay was performed with Promega reporter bioassay kit (Cat # G7010) including the nuclear factor of activated T-cells (NFAT) engineered Jurkat cells expressing FcγRIIIa with V158 variant. All cells were cultured in 5% CO2 incubator at 37 °C. For target cell, an in-house antigen expressing CHO-K1 adherent cells was used in this study. Target cells were cultured in a Minimum Essential Medium α, nucleosides medium (Thermo Fisher Scientific, Cat # 12571–063) supplemented with 10% heat-inactivated fetal bovine serum (Thermo Fisher Scientific, Cat # 1009118) and 0.5 mg/mL final concentration of Geneticin™ Selective Antibiotic (Thermo Fisher Scientific, Cat # 10131–027). When ready for ADCC assay, target cells were harvested and inoculated in 96-well assay microplates for 24 hours. Following assay was performed according to the manufacturer’s protocol. Briefly, triplicate serial dilutions of the glycoengineered mAbs (starting concentration: 1.6 μg/mL, dilution factor: 3) were added and followed by an addition of 7.5 × 10⁴ cells/well of the NFAT engineered Jurkat cells expressing FcγRIIIa-V158 for six hours at 37 °C. At the time of the effector cell addition, the ratio of effector cell to target cell is estimated to be 2.5. The receptor binding activates gene transcription through the NFAT pathway in the effector cell leading to luciferase production. A luciferase substrate was then added, and luminescence was recorded by multimode microplate reader SpectraMax M4 (Molecular Device). Fold of induction was calculated with the following equation.
Response curve was fitted by four parameter logistic model using Prism 7 software from GraphPad to calculate EC50. Each relative ADCC activity was calculated by the following equation.
Intermediate assay variation was qualified by testing mAb-ctrl with 10 plates assayed on 3 different days. 95% Confidence Interval of EC50 was within 100 ± 15% to the calculated average.
FcγRIIIa affinity chromatography analysis
FcγRIIIa affinity chromatography utilized a non-glycosylated FcγRIIIa recombinantly expressed from E. coli (TOSOH, 4.6 mm I.D. × 75 mm, TSKgel FcR-IIIA-NPR).Citation53 FcγRIIIa ligand has eight amino acid mutations for stabilization purpose. MPA was composed of 20 mM sodium acetate, 50 mM NaCl, pH 5.0. MPB was composed of 10 mM gly-HCl, pH 3.0. The column was equilibrated with 100% MPA. Each mAb was injected at amount of 5 μg onto a 25 °C column and eluted using gradient from 0–100% MPB at 0.6 mL/min over 12 minutes. Absorbance was detected at λ = 214 and 280 nm.
FcRn affinity chromatography analysis
FcRn affinity chromatography utilized a human FcRn prepacked column (Roche Custom Biotech, Cat # 08128057001).Citation31,Citation74 According to the manufacturer, FcRn is recombinantly expressed by a CHO cell line, thus one putative N-glycosylation site is present (UniProt accession number P55899), although the glycosylation pattern was not reported by the manufacturer. MPA was composed of 20 mM 2-(N-morpholino)ethanesulfonic acid (MES)/HCl, 140 mM NaCl pH 5.5. MPB was composed of 20 mM MES/HCl, 140 mM NaCl pH 8.8. The column was equilibrated with 80% MPA and 20% MPB. Each mAb was injected at amount of 25 μg onto a 25 °C column and eluted using gradient from 20–100% MPB at 0.35 mL/min over 90 minutes. Absorbance was detected at λ = 214 and 280 nm.
Differential scanning calorimetry
DSC analysis was performed on a MicroCal VP-Capillary DSC Calorimeter (Malvern). During each sample measurement, the formulation buffer was injected into the reference cell, and 1 mg/mL mAb in the same formulation buffer was injected into the sample cell. Thermograms were collected from 20 to 100 °C at a scan rate of 60 °C/hour. To avoid the intrinsic difference between reference and sample cells, the formulation buffer was also injected into both reference and sample cells and its thermogram was corrected by subtracted from each sample measurement. Obtained data was processed by Origin 7.0 software (OriginLab). The transition curves were fitted using a non-two-state model to obtain the transition temperatures and enthalpies of the different antibody domains (Tm CH2, Tm Fab and Tm CH3).
Intrinsic fluorescence spectroscopy and static light scattering analysis for thermal unfolding and short-term forced degradation
Intrinsic fluorescence and SLS measurement were performed on UNit analyzer (Unchained Labs). All generated data was processed by UNit Analysis software (Unchained Labs). In this study, all mAb glycoforms were measured at a concentration of 1 mg/mL in the formulation buffer, same as DSC analysis, and 9 μL of each sample was injected into sample tubes. For melting temperature from fluorescence spectroscopy (Tm FS) determination, intrinsic tryptophan fluorescence was excited using the integral 266 nm laser, and Tm values were determined at the inflection point of the curve developed when plotting the barycentric mean (BCM) shift of the fluorescence signal over the applied temperature, as previously reported.Citation75 For aggregation temperature (Tagg), values were calculated based on the steepest slope that evolved when plotting the static light scattering signal over the applied temperature. The temperature ramp started at 20 °C, ended at 90 °C, and had a step width of 1 °C/min. For isothermal stability analysis, the incubation was performed at 65 °C for seven hours for real-time monitoring of aggregate formation.
Size-exclusion chromatography analysis for long-term forced degradation study
SEC analysis utilized a TSKGel G3000 SWXL column (TOSOH, 7.8 × 300 mm, 5 μm, Cat # 0008541) to quantify aggregation and fragmentation. The mobile phase was composed of 20 mM sodium phosphate, 1.0 M NaCl, pH 6.5. Glycoforms were incubated at 10 mg/mL in formulation, 50 °C for 10 and 17 d. Each mAb was injected at amount of 50 μg, isocratically separated and eluted onto a 30 °C column at a flow rate of 0.5 mL/min for 30 minutes. Absorbance was detected at λ = 280 nm. The percentage of aggregate, fragment or monomer species were quantified based on the total peak areas.
Statistical analysis
Data was statistically analyzed using SAS JMP version 10. The built-in module of Fit Model was used to obtain scaled estimates and interaction profiles. Statistical significance was established at a p < 0.05. For assessing statistical significance of the observed changes, one-way ANOVA model was used, and statistical significance was established at a p < 0.05.
Abbreviations
| 2-AB | = | 2-aminobenzamide |
| ADCC | = | antibody-dependent cell-mediated cytotoxicity |
| BCM | = | barycentric mean |
| CDC | = | complement-dependent cytotoxicity |
| CH | = | heavy chain constant domain |
| CHO | = | Chinese hamster ovary |
| CI | = | confidence interval |
| ctrl | = | control |
| DSC | = | differential scanning calorimetry |
| EC50 | = | half maximal (50%) effective concentration |
| EDC | = | (1-ethyl-3-(3-dimethylaminopropyl) carbodiimide hydrochloride) |
| EDTA | = | ethylenediaminetetraacetic acid |
| ENGase | = | endo-β-N-acetylglucosaminidase |
| eq | = | equivalent |
| ER | = | endoplasmic reticulum |
| Fab | = | antigen-binding fragment |
| Fc | = | fragment crystallizable |
| FcRn | = | neonatal Fc receptor |
| FcγRIIIa | = | Fcγ receptor IIIa |
| FS | = | fluorescence spectroscopy |
| Fuc | = | fucose |
| Gal | = | galactose |
| GlcNAc | = | N-Acetylglucosamine |
| HILIC | = | hydrophilic interaction chromatography |
| HM | = | high mannose |
| HMW | = | high molecular weight |
| IgG | = | immunoglobulin G |
| KD | = | dissociation constant |
| LC-MS | = | liquid chromatography - mass spectrometry |
| LMW | = | low molecular weight |
| mAb | = | monoclonal antibody |
| Man | = | mannose |
| MES | = | 2-(N-morpholino)ethanesulfonic acid |
| MP | = | mobile phase |
| NFAT | = | nuclear factor of activated T-cells |
| NGNA | = | N-glycolylneuraminic acid |
| NHS | = | N-hydroxysuccinimide |
| NK | = | natural killer |
| oxa | = | oxazoline |
| PK | = | pharmacokinetics |
| SA | = | sialic acid |
| SD | = | standard deviation |
| SEC | = | size-exclusion chromatography |
| SLS | = | static light scattering |
| SPR | = | surface plasmon resonance |
| Tagg | = | temperature onset of aggregation |
| Tm | = | melting temperature |
Disclosure of Potential Conflicts of Interest
No potential conflicts of interest were disclosed.
Supplemental Material
Download MS Word (1 MB)Acknowledgments
We would like to thank the Astellas Process Sciences group, especially Nobumasa Takao and Yuki Ando for providing the formulated bulk of the IgG1 mAb used in this study. We also would like to thank Dr. Hideto Yamaguchi, Dr. Lily Liu-Shin and Dr. Jose M.M. Caaveiro for critical review of this manuscript. We also appreciate the support expressed by Dr. Ban Kazutoshi, VP of Biotechnology Laboratories, and by Koji Nagao, VP of Pharmaceutical Science and Technology Laboratories for the execution of this study.
Additional information
Funding
Related Research Data
References
- Walsh G, Jefferis R. Post-translational modifications in the context of therapeutic proteins. Nat Biotechnol. 2006;24:.1241–1252. doi:10.1038/nbt1252.
- Anelli T, Sitia R. Protein quality control in the early secretory pathway. Embo J. 2008;27:.315–327. doi:10.1038/sj.emboj.7601974.
- Breitling J, Aebi M. N-linked protein glycosylation in the endoplasmic reticulum. Cold Spring Harb Perspect Biol. 2013;5:.a013359–a013359. doi:10.1101/cshperspect.a013359.
- Leavy O. Therapeutic antibodies: past, present and future. Nat Rev Immunol. 2010;10:.297. doi:10.1038/nri2763.
- Liu JKH. The history of monoclonal antibody development - Progress, remaining challenges and future innovations. Ann Med Surg. 2014;3:.113–116. doi:10.1016/j.amsu.2014.09.001.
- Jiang X-R, Song A, Bergelson S, Arroll T, Parekh B, May K, Chung S, Strouse R, Mire-Sluis A, Schenerman M. Advances in the assessment and control of the effector functions of therapeutic antibodies. Nat Rev Drug Discov. 2011;10:.101–111. doi:10.1038/nrd3365.
- Wang X, Mathieu M, Brezski RJ. IgG Fc engineering to modulate antibody effector functions. Protein Cell. 2018;9:.63–73. doi:10.1007/s13238-017-0473-8.
- Chan AC, Carter PJ. Therapeutic antibodies for autoimmunity and inflammation. Nat Rev Immunol. 2010;10:.301–316. doi:10.1038/nri2761.
- Guilliams M, Bruhns P, Saeys Y, Hammad H, Lambrecht BN. The function of Fcγ receptors in dendritic cells and macrophages. Nat Rev Immunol. 2014;14:.94–108. doi:10.1038/nri3582.
- Bruhns P. Properties of mouse and human IgG receptors and their contribution to disease models. Blood. 2012;119:.5640–5649. doi:10.1182/blood-2012-01-380121.
- Bruhns P, Jönsson F. Mouse and human FcR effector functions. Immunol Rev. 2015;268:.25–51. doi:10.1111/imr.12350.
- Yamane-Ohnuki N, Kinoshita S, Inoue-Urakubo M, Kusunoki M, Iida S, Nakano R, Wakitani M, Niwa R, Sakurada M, Uchida K, et al. Establishment of FUT8 knockout Chinese hamster ovary cells: an ideal host cell line for producing completely defucosylated antibodies with enhanced antibody-dependent cellular cytotoxicity. Biotechnol Bioeng. 2004;87:614–622. doi:10.1002/bit.20151.
- Raju TS. Terminal sugars of Fc glycans influence antibody effector functions of IgGs. Curr Opin Immunol. 2008;20:.471–478. doi:10.1016/j.coi.2008.06.007.
- Dekkers G, Treffers L, Plomp R, Bentlage AEH, de Boer M, Koeleman CAM, Lissenberg-Thunnissen SN, Visser R, Brouwer M, Mok JY, et al. Decoding the human immunoglobulin g-glycan repertoire reveals a spectrum of Fc-Receptor- and complement-mediated-effector activities. Front Immunol. 8;2017. doi:10.3389/fimmu.2017.00877
- Zhou X, Hu W, Qin X. The role of complement in the mechanism of action of rituximab for b-cell lymphoma: implications for therapy. Oncologist. 2008;13:.954–966. doi:10.1634/theoncologist.2008-0089.
- Liu L. Pharmacokinetics of monoclonal antibodies and Fc-fusion proteins. Protein Cell. 2018;9:.15–32. doi:10.1007/s13238-017-0408-4.
- Roopenian DC, Akilesh S. FcRn: the neonatal Fc receptor comes of age. Nat Rev Immunol. 2007;7:.715–725. doi:10.1038/nri2155.
- Sockolosky JT, Szoka FC. The neonatal Fc receptor, FcRn, as a target for drug delivery and therapy. Adv Drug Deliv Rev. 2015;91:.109–124. doi:10.1016/j.addr.2015.02.005.
- Ying T, Ju TW, Wang Y, Prabakaran P, Dimitrov DS. Interactions of IgG1 CH2 and CH3 domains with FcRn. Front Immunol. 2014;5:.1–7. doi:10.3389/fimmu.2014.00146.
- Zalevsky J, Chamberlain AK, Horton HM, Karki S, Leung IWL, Sproule TJ, Lazar GA, Roopenian DC, Desjarlais JR. Enhanced antibody half-life improves in vivo activity. Nat Biotechnol. 2010;28:.157–159. doi:10.1038/nbt.1601.
- Yu M, Brown D, Reed C, Chung S, Lutman J, Stefanich E, Wong A, Stephan J-P, Bayer R. Production, characterization and pharmacokinetic properties of antibodies with N-linked Mannose-5 glycans. MAbs. 2012;4:.475–487. doi:10.4161/mabs.20737.
- Kanda Y, Yamada T, Mori K, Okazaki A, Inoue M, Kitajima-Miyama K, Kuni-Kamochi R, Nakano R, Yano K, Kakita S, et al. Comparison of biological activity among nonfucosylated therapeutic IgG1 antibodies with three different N-linked Fc oligosaccharides: the high-mannose, hybrid, and complex types. Glycobiology. 2007;17:104–118. doi:10.1093/glycob/cwl057.
- Wright A. Effect of altered CH2-associated carbohydrate structure on the functional properties and in vivo fate of chimeric mouse-human immunoglobulin G1. J Exp Med. 1994;180:.1087–1096. doi:10.1084/jem.180.3.1087.
- Chung CH, Mirakhur B, Chan E, Le Q-T, Berlin J, Morse M, Murphy BA, Satinover SM, Hosen J, Mauro D, et al. Cetuximab-induced anaphylaxis and IgE specific for galactose-α-1,3-galactose. N Engl J Med. 2008;358:.1109–1117. doi:10.1056/NEJMoa074943.
- Zhu A, Hurst R. Anti-N-glycolylneuraminic acid antibodies identified in healthy human serum. Xenotransplantation. 2002;9:.376–381. doi:10.1034/j.1399-3089.2002.02138.x.
- Singh SK. Impact of product-related factors on immunogenicity of biotherapeutics. J Pharm Sci. 2011;100:.354–387. doi:10.1002/jps.22276.
- Joubert MK, Hokom M, Eakin C, Zhou L, Deshpande M, Baker MP, Goletz TJ, Kerwin BA, Chirmule N, Narhi LO, et al. Highly aggregated antibody therapeutics can enhance the in vitro innate and late-stage T-cell immune responses. J Biol Chem. 2012;287:.25266–25279. doi:10.1074/jbc.M111.330902.
- Li T, Tong X, Yang Q, Giddens JP, Wang L-X. Glycosynthase mutants of endoglycosidase S2 show potent transglycosylation activity and remarkably relaxed substrate specificity for antibody glycosylation remodeling. J Biol Chem. 2016;291:.16508–16518. doi:10.1074/jbc.M116.738765.
- Sjögren J, Struwe WB, Cosgrave EFJ, Rudd PM, Stervander M, Allhorn M, Hollands A, Nizet V, Collin M. EndoS 2 is a unique and conserved enzyme of serotype M49 group A streptococcus that hydrolyses N-linked glycans on IgG and α 1 -acid glycoprotein. Biochem J. 2013;455:.107–118. doi:10.1042/BJ20130126.
- Dashivets T, Thomann M, Rueger P, Knaupp A, Buchner J, Schlothauer T. Multi-angle effector function analysis of human monoclonal IgG glycovariants. PLoS ONE. 2015;10:.e0143520. doi:10.1371/journal.pone.0143520.
- Cymer F, Schlothauer T, Knaupp A, Beck H. Evaluation of an FcRn affinity chromatographic method for IgG1-type antibodies and evaluation of IgG variants. Bioanalysis. 2017;9:.1305–1317. doi:10.4155/bio-2017-0109.
- Vermeer AWP, Norde W. The thermal stability of immunoglobulin: unfolding and aggregation of a multi-domain protein. Biophys J. 2000;78:.394–404. doi:10.1016/S0006-3495(00)76602-1.
- Ionescu RM, Vlasak J, Price C, Kirchmeier M. Contribution of variable domains to the stability of humanized IgG1 monoclonal antibodies. J Pharm Sci. 2008;97:.1414–1426. doi:10.1002/jps.21104.
- Peipp M, Van Bueren JJL, Schneider-Merck T, Bleeker WWK, Dechant M, Beyer T, Repp R, Van Berkel PHC, Vink T, Van De Winkel JGJ, et al. Antibody fucosylation differentially impacts cytotoxicity mediated by NK and PMN effector cells. Blood. 2008;112:2390–2399. doi:10.1182/blood-2008-03-144600.
- Shields RL, Lai J, Keck R, O’Connell LY, Hong K, Meng YG, Weikert SHA, Presta LG. Lack of fucose on human IgG1 N -linked oligosaccharide improves binding to human FcγRIII and antibody-dependent cellular toxicity. J Biol Chem. 2002;277:.26733–26740. doi:10.1074/jbc.M202069200.
- Shinkawa T, Nakamura K, Yamane N, Shoji-Hosaka E, Kanda Y, Sakurada M, Uchida K, Anazawa H, Satoh M, Yamasaki M, et al. The absence of fucose but not the presence of galactose or bisecting N -acetylglucosamine of human IgG1 complex-type oligosaccharides shows the critical role of enhancing antibody-dependent cellular cytotoxicity. J Biol Chem. 2003;278:.3466–3473. doi:10.1074/jbc.M210665200.
- Li T, DiLillo DJ, Bournazos S, Giddens JP, Ravetch JV, Wang L. Modulating IgG effector function by Fc glycan engineering. Proc Natl Acad Sci. 2017;114:.3485–3490. doi:10.1073/pnas.1702173114.
- Lin C-W, Tsai M-H, Li S-T, Tsai T-I, Chu K-C, Liu Y, Lai M-Y, Wu C-Y, Tseng Y-C, Shivatare SS, et al. A common glycan structure on immunoglobulin G for enhancement of effector functions. Proc Natl Acad Sci. 2015;112:10611–10616. doi:10.1073/pnas.1513456112.
- Kurogochi M, Mori M, Osumi K, Tojino M, Sugawara S, Takashima S, Hirose Y, Tsukimura W, Mizuno M, Amano J, et al. Glycoengineered monoclonal antibodies with homogeneous glycan (M3, G0, G2, and A2) using a chemoenzymatic approach have different affinities for FcγRIIIa and variable antibody-dependent cellular cytotoxicity activities. PLoS ONE. 2015;10:e0132848. doi:10.1371/journal.pone.0132848.
- Shivatare SS, Huang L-Y, Zeng Y-F, Liao J-Y, You T-H, Wang S-Y, Cheng T, Chiu C-W, Chao P, Chen L-T, et al. Development of glycosynthases with broad glycan specificity for the efficient glyco-remodeling of antibodies. Chem Commun. 2018;54:6161–6164. doi:10.1039/C8CC03384F.
- Li C, Zhu S, Ma C, Wang LX. Designer α1,6-Fucosidase mutants enable direct core fucosylation of intact N-Glycopeptides and N-Glycoproteins. J Am Chem Soc. 2017;139:.15074–15087. doi:10.1021/jacs.7b07906.
- Tsukimura W, Kurogochi M, Mori M, Osumi K, Matsuda A, Takegawa K, Furukawa K, Shirai T. Preparation and biological activities of anti-HER2 monoclonal antibodies with fully core-fucosylated homogeneous bi-antennary complex-type glycans. Biosci Biotechnol Biochem. 2017;81:.2353–2359. doi:10.1080/09168451.2017.1394813.
- Houde D, Peng Y, Berkowitz SA, Engen JR. Post-translational modifications differentially affect IgG1 conformation and receptor binding. Mol Cell Proteomics. 2010;9:.1716–1728. doi:10.1074/mcp.M900540-MCP200.
- Yamaguchi Y, Nishimura M, Nagano M, Yagi H, Sasakawa H, Uchida K, Shitara K, Kato K. Glycoform-dependent conformational alteration of the Fc region of human immunoglobulin G1 as revealed by NMR spectroscopy. Biochim Biophys Acta - Gen Subj. 2006;1760:.693–700. doi:10.1016/j.bbagen.2005.10.002.
- Wright A, Morrison SL. Effect of C2-associated carbohydrate structure on Ig effector function: studies with chimeric mouse-human IgG1 antibodies in glycosylation mutants of Chinese hamster ovary cells. J Immunol. 160;1998:3393–3402.
- Scallon BJ, Tam SH, McCarthy SG, Cai AN, Raju TS. Higher levels of sialylated Fc glycans in immunoglobulin G molecules can adversely impact functionality. Mol Immunol. 2007;44:.1524–1534. doi:10.1016/j.molimm.2006.09.005.
- Peschke B, Keller CW, Weber P, Quast I, Lünemann JD. Fc-Galactosylation of human immunoglobulin gamma isotypes improves C1q binding and enhances complement-dependent cytotoxicity. Front Immunol. 8;2017. doi:10.3389/fimmu.2017.00646
- Nimmerjahn F, Anthony RM, Ravetch JV. Agalactosylated IgG antibodies depend on cellular Fc receptors for in vivo activity. Proc Natl Acad Sci. 2007;104:.8433–8437. doi:10.1073/pnas.0702936104.
- Kaneko Y, Nimmerjahn F, Ravetch JV. Anti-inflammatory activity of immunoglobulin G resulting from Fc sialylation. Science. 2006;313:.670–673. doi:10.1126/science.1129594.
- Anthony RM, Nimmerjahn F, Ashline DJ, Reinhold VN, Paulson JC, Ravetch JV. Recapitulation of IVIG anti-inflammatory activity with a recombinant IgG Fc. Science. 2008;320:373–376. (80-). doi:10.1126/science.1154315.
- Boyd PN, Lines AC, Patel AK. The Effect of the Removal of Sialic Acid, Galactose and Total Carbohydrate on the Functional Activity of Campath-I H. Mol Immunol. 1995;32:1311–1318.doi:10.1016/0161-5890(95)00118-2
- Thomann M, Schlothauer T, Dashivets T, Malik S, Avenal C, Bulau P, Rüger P, Reusch D. In vitro glycoengineering of IgG1 and its effect on Fc receptor binding and ADCC activity. PLoS ONE. 2015;10:.e0134949. doi:10.1371/journal.pone.0134949.
- Kiyoshi M, Caaveiro JMM, Tada M, Tamura H, Tanaka T, Terao Y, Morante K, Harazono A, Hashii N, Shibata H, et al. Assessing the heterogeneity of the Fc-Glycan of a therapeutic antibody using an engineered FcγReceptor IIIa-Immobilized column. Sci Rep. 2018;8:3955. doi:10.1038/s41598-018-22199-8.
- Ferrara C, Stuart F, Sondermann P, Brünker P, Umaña P. The carbohydrate at FcγRIIIa Asn-162. J Biol Chem. 2006;281:.5032–5036. doi:10.1074/jbc.M510171200.
- Shibata-Koyama M, Iida S, Okazaki A, Mori K, Kitajima-Miyama K, Saitou S, Kakita S, Kanda Y, Shitara K, Kato K, et al. The N-linked oligosaccharide at Fc RIIIa Asn-45: an inhibitory element for high Fc RIIIa binding affinity to IgG glycoforms lacking core fucosylation. Glycobiology. 2008;19:126–134. doi:10.1093/glycob/cwn110.
- Chung S, Quarmby V, Gao X, Ying Y, Lin L, Reed C, Fong C, Lau W, Qiu ZJ, Shen A, et al. Quantitative evaluation of fucose reducing effects in a humanized antibody on Fcγ receptor binding and antibody-dependent cell-mediated cytotoxicity activities. MAbs. 2012;4:.326–340. doi:10.4161/mabs.19941.
- Zhou Q, Shankara S, Roy A, Qiu H, Estes S, McVie-Wylie A, Culm-Merdek K, Park A, Pan C, Edmunds T. Development of a simple and rapid method for producing non-fucosylated oligomannose containing antibodies with increased effector function. Biotechnol Bioeng. 2008;99:.652–665. doi:10.1002/bit.21598.
- Hodoniczky J, Yuan ZZ, James DC. Control of recombinant monoclonal antibody effector functions by Fc N-glycan remodeling in vitro. Biotechnol Prog. 2005;21:.1644–1652. doi:10.1021/bp050228w.
- Mimura Y, Church S, Ghirlando R, Ashton P, Dong S, Goodall M, Lund J, Jefferis R. The influence of glycosylation on the thermal stability and effector function expression of human IgG1-Fc: properties of a series of truncated glycoforms. Mol Immunol. 2000;37:.697–706. doi:10.1016/S0161-5890(00)00105-X.
- Chen C, Hsu J, Lin C, Wang C, Tsai M, Wu C, Wong C, Ma C. Crystal structure of a homogeneous IgG-Fc glycoform with the N-Glycan designed to maximize the antibody dependent cellular cytotoxicity. ACS Chem Biol. 2017;12:.1335–1345. doi:10.1021/acschembio.7b00140.
- Buck PM, Kumar S, Singh SK. Consequences of glycan truncation on Fc structural integrity. MAbs. 2013;5:.904–916. doi:10.4161/mabs.26453.
- Li W, Zhu Z, Chen W, Feng Y, Dimitrov DS. Crystallizable fragment glycoengineering for therapeutic antibodies development. Front Immunol. 8;2017. doi:10.3389/fimmu.2017.01554
- Brader ML, Estey T, Bai S, Alston RW, Lucas KK, Lantz S, Landsman P, Maloney KM. Examination of thermal unfolding and aggregation profiles of a series of developable therapeutic monoclonal antibodies. Mol Pharm. 2015;12:.1005–1017. doi:10.1021/mp400666b.
- Voynov V, Chennamsetty N, Kayser V, Helk B, Forrer K, Zhang H, Fritsch C, Heine H, Trout BL. Dynamic fluctuations of protein-carbohydrate interactions promote protein aggregation. PLoS ONE. 2009;4:.e8425. doi:10.1371/journal.pone.0008425.
- Ghirlando R, Lund J, Goodall M, Jefferis R. Glycosylation of human IgG-Fc: influences on structure revealed by differential scanning micro-calorimetry. Immunol Lett. 1999;68:.47–52. doi:10.1016/S0165-2478(99)00029-2.
- Zheng K, Yarmarkovich M, Bantog C, Bayer R, Patapoff TW. Influence of glycosylation pattern on the molecular properties of monoclonal antibodies. MAbs. 2014;6:.649–658. doi:10.4161/mabs.28588.
- Fang J, Richardson J, Du Z, Zhang Z. Effect of Fc-Glycan structure on the conformational stability of IgG revealed by hydrogen/deuterium exchange and limited proteolysis. Biochemistry. 2016;55:.860–868. doi:10.1021/acs.biochem.5b01323.
- Kiyoshi M, Tsumoto K, Ishii-Watabe A, Caaveiro JMM. Glycosylation of IgG-Fc: a molecular perspective. Int Immunol. 2017;29:.311–317. doi:10.1093/intimm/dxx038.
- Zheng K, Bantog C, Bayer R. The impact of glycosylation on monoclonal antibody conformation and stability. MAbs. 2011;3:.568–576. doi:10.4161/mabs.3.6.17922.
- Ravuluri S, Bansal R, Chhabra N, Rathore AS. Kinetics and characterization of non-enzymatic fragmentation of monoclonal antibody therapeutics. Pharm Res. 2018;35:.142. doi:10.1007/s11095-018-2415-4.
- Higuchi Y, Eshima Y, Huang Y, Kinoshita T, Sumiyoshi W, Nakakita S, Takegawa K. Highly efficient transglycosylation of sialo-complex-type oligosaccharide using coprinopsis cinerea endoglycosidase and sugar oxazoline. Biotechnol Lett. 2017;39:.157–162. doi:10.1007/s10529-016-2230-0.
- Noguchi M, Fujieda T, Huang WC, Ishihara M, Kobayashi A, Shoda S. A practical one-step synthesis of 1,2-Oxazoline derivatives from unprotected sugars and its application to chemoenzymatic β - N -Acetylglucosaminidation of disialo-oligosaccharide. Helv Chim Acta. 2012;95:.1928–1936. doi:10.1002/hlca.201200414.
- Cosgrave EFJ, Struwe WB, Hayes JM, Harvey DJ, Wormald MR, Rudd PM. N-Linked glycan structures of the human Fcγ receptors produced in NS0 cells. J Proteome Res. 2013;12:.3721–3737. doi:10.1021/pr400344h.
- Schlothauer T, Rueger P, Stracke JO, Hertenberger H, Fingas F, Kling L, Emrich T, Drabner G, Seeber S, Auer J, et al. Analytical FcRn affinity chromatography for functional characterization of monoclonal antibodies. MAbs. 2013;5:576–586. doi:10.4161/mabs.24981.
- Schermeyer MT, Wöll AK, Kokke B, Eppink M, Hubbuch J. Characterization of highly concentrated antibody solution - A toolbox for the description of protein long-term solution stability. MAbs. 2017;9:.1169–1185. doi:10.1080/19420862.2017.1338222.