
 ?Mathematical formulae have been encoded as MathML and are displayed in this HTML version using MathJax in order to improve their display. Uncheck the box to turn MathJax off. This feature requires Javascript. Click on a formula to zoom.
ABSTRACT
Despite major advances in antibody discovery technologies, the successful development of monoclonal antibodies (mAbs) into effective therapeutic and diagnostic agents can often be impeded by developability liabilities, such as poor expression, low solubility, high viscosity and aggregation. Therefore, strategies to predict at the early phases of antibody development the risk of late-stage failure of antibody candidates are highly valuable. In this work, we employ the in silico solubility predictor CamSol to design a library of 17 variants of a humanized mAb predicted to span a broad range of solubility values, and we examine their developability potential with a battery of commonly used in vitro and in silico assays. Our results demonstrate the ability of CamSol to rationally enhance mAb developability, and provide a quantitative comparison of in vitro developability measurements with each other and with more resource-intensive solubility measurements, as well as with in silico predictors that offer a potentially faster and cheaper alternative. We observed a strong correlation between predicted and experimentally determined solubility values, as well as with measurements obtained using a panel of in vitro developability assays that probe non-specific interactions. These results indicate that computational methods have the potential to reduce or eliminate the need of carrying out laborious in vitro quality controls for large numbers of lead candidates. Overall, our study provides support to the emerging view that the implementation of in silico tools in antibody discovery campaigns can ensure rapid and early selection of antibodies with optimal developability potential.
Introduction
Therapeutic antibodies are the fastest growing class of biopharmaceuticals, with more than 68 approved products currently on the market,Citation1,Citation2 which target a variety of disorders including cancer, hemophilia, autoimmunity and infectious diseases.Citation3,Citation4 In this context, the enormous cost of advancing antibodies into clinical trials has led to a strong interest in predicting the risk of late-stage failure in the early discovery phase.Citation5,Citation6 Many antibodies fail drug development due to poor biophysical properties, such as poor expression, low solubility, aggregation and lack of specificity.Citation7–Citation9 These failures have prompted the development of predictive in vitro assays that screen for desirable biophysical properties in the early discovery phases (“developability”) to anticipate the clinical success of antibodies. Developability assays are intended to run prior lead candidate selection and may enable the early exclusion of biophysically challenging antibodies.Citation10–Citation16
As the developability of proteins is, in contrast to that of small molecules,Citation17 a recently emerged field of research, there have been limited endeavours to date to define stringent criteria to accurately predict the developability of antibodies.Citation13 Currently, accurate developability assessments require the combination of several in vitro screening assays, since no single assay appears to be fully predictive. This aspect makes developability assessment demanding in both time and resources.Citation13
Early screening is further challenged by the quality and quantity of antibody candidates available at the early stages of development, which are commonly prepared in minute amounts, low concentrations and relatively low purity. These factors may cause large errors and issues of measurement reproducibility.Citation10 Consequently, these screening methods do not attempt to directly measure properties such as solubility, aggregation and viscosity, but they rather aim to determine parameters that are easier to measure and considered to be predictive of these properties. For example, non-specific interactions of antibodies with polyclonal immunoglobulin G (IgG) antibodies assessed using cross-interaction chromatography (CIC) have been found to correlate with solubilityCitation16 and in vivo clearance rates.Citation18 It has also been reported that the monomer-retention time in standup monolayer adsorption chromatography (SMAC) depends on the non-specific interaction of antibodies with the column matrix, and tends to correlate with antibody precipitation and aggregation,Citation14 while estimates of the apparent hydrophobicity from hydrophobic interaction chromatography (HIC) correlate with aggregationCitation10,Citation13 and in vivo clearance.Citation19 Furthermore, reversible self-association from affinity-capture self-interaction nanoparticle spectroscopy (AC-SINS) has been found to predict viscosity, solubility issuesCitation20–Citation23 and in vivo clearance.Citation15
Overall, however, the current limitations and challenges that in vitro assays are facing highlight a pressing need for more effective and rapid strategies to assess antibody developability. Given the promising advances in the prediction of solubility, aggregation and viscosity that have been made in the last decade,Citation19,Citation24–Citation35 in silico predictors could offer convenient alternatives to experimental approaches due to their rapidity and lack of materials requirement.Citation36 These predictors are typically based on physico-chemical properties derived from the amino acid sequence, and are sometimes processed with machine-learning algorithms, or structure-based algorithms that identify troublesome surface-exposed patches that can compromise the biophysical properties of the antibodies.
Here, we quantitatively compare commonly used in vitro developability assays with each other and with one resource-intensive solubility measurement, and we further addressed the problem of identifying effective in silico assays for antibody developability assessment. We used a humanized IgG subclass 4 (IgG4) antibody that features complex biophysical properties.Citation37,Citation38 With the in silico solubility predictor CamSol, we identified surface-exposed residues that upon mutation are predicted to markedly reduce or increase solubility.Citation39 Using a large combinatorial in silico screening of all candidate mutations at these positions, we designed an ‘antibody solubility library’ consisting of the wild type, eight variants with progressively increased predicted solubility values, and eight variants with progressively decreased solubility values. The CamSol prediction of solubility encompasses the contribution of various physicochemical properties, such as hydrophobicity, structural propensities, and electrostatics, both at the level of individual residues considered within local motifs and in the broader context of the whole sequence.Citation39 Our results show that the in silico predicted solubility scores of the antibody variants correlated highly with the experimental relative solubility as determined by an ammonium sulfate precipitation assay.Citation40,Citation41 When we subjected the antibody variants to a set of well-established experimental developability assays, we found that CamSol predictions correlate remarkably well with experimental data, in particular with assays that measure non-specific interactions. This study is a demonstration of how the selection and design of lead candidates with a high developability potential can be facilitated by rapid computational predictions that only require the amino acid sequence as an input.
Results
Rational in silico design of an antibody library
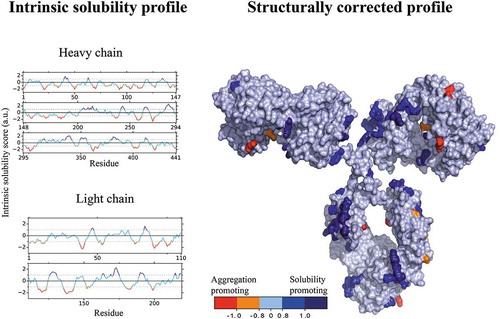
The antibody HzATNP (humanized anti-trinitrophenyl) was selected as a model system because it forms high amounts of aggregates upon storageCitation38 and its self-association is highly sensitive to pH and ionic strength.Citation37 We employed the CamSol method to identify suitable mutation sites, which we defined as solvent-exposed residues within regions either predicted to hamper the solubility or to promote it. Specifically, we calculated the intrinsic solubility profile () of HzATNP from its amino acid sequence using the CamSol intrinsic method.Citation39 Then, we carried out structural corrections to the intrinsic solubility profile using a homology model of HzATNP. The structurally corrected solubility profile was then color-coded onto the surface of the structural model, where residues with scores ≥ 1 are solubility promoting while scores ≤ −1 denote poorly soluble regions that may elicit aggregation (). We mention in particular that there are a few highly insoluble patches and many more highly soluble patches, as is typical of proteins that are stable in their folded native states.
Figure 1. Illustration of the CamSol method applied to HzATNP. The sequence-based intrinsic solubility scores were calculated through a linear combination of physicochemical properties with CamSol (left) and structurally corrected with a 2 Å homology model (right) using a default patch radius of 10 Å. The structurally corrected solubility profile was then projected and color coded on the surface of the antibody. Dark blue represents highly soluble regions, whereas orange and red represent poorly soluble regions.
Based on the structurally corrected solubility profile, one can readily identify the residue positions predicted to have the greatest impact on the solubility of the wild-type (WT) antibody (), as those residues within aggregation hotspots (score ≤ −1) or within solubility-promoting regions (scores ≥ 1). In the design procedure, we suggest the selection of residues with the lowest solubility scores in the structurally corrected solubility profiles. This procedure enables the selection of residues with poor solubility and high solvent exposure, and thus most likely increase the impact of a mutation on the overall solubility of the corresponding antibody variant. We have not implemented a fully automated computational procedure for the selection of the candidate mutation sites, as the users in many cases will have other data that could guide this selection. Such data could suggest the exclusion of residue positions known, or believed to be, key determinants for function, or for conformational and chemical stability. In particular, in this study, in order to improve the quality of our quantitative comparison among commonly used experimental developability assays and in silico predictions, we needed to make the span of predicted solubilities in our library as large as possible. Therefore, we selected a set of candidate mutation sites that could be used to increase solubility, and also a set of residues that could be used to decrease solubility.
Figure 2. Rational design of the mAb solubility library used in this work. (a) Intrinsic (red/orange/blue) and structurally corrected (green) solubility profiles of the wild-type mAb calculated for the heavy (top panel) and light (lower panel) chains. Vertical bars denote the sites selected for mutation. (b) Structural model of the Fab region color coded according to the structurally corrected profile (color-bar); sites selected for mutation are labelled. (c) Distribution of Fab region CamSol solubility scores calculated for all possible combination of mutations at the selected mutation sites, with a limit of four simultaneous mutations; red indicates mutations at sites predicted to be highly soluble and blue mutations at sites predicted to be poorly soluble. (d) Boxplot of Fab solubility scores from the distribution in (c), but separated according to the number of mutations carried out (x-axis); in C and D the dashed line denotes the Fab solubility score of the wild-type antibody.
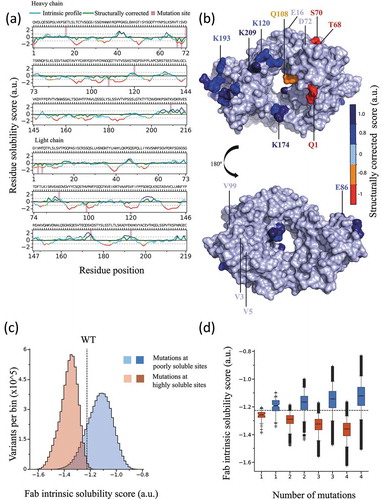
To build a library of monoclonal antibody (mAb) variants that explores a wide range of solubility values, we first selected seven surface-exposed amino acids: four in the heavy chain (E16, D72, K120, K209) and three in the light chain (E86, K174, K193) of the antigen-binding fragment (Fab). These positions were predicted to contribute highly to the overall solubility, and thus represent promising mutation sites to decrease it (). Further, we selected seven solvent-exposed residues, four in the heavy chain (Q1, T68, S70, Q108) and three in the light chain (V3, T5, V99) of the Fab domain, which were predicted to negatively affect the overall solubility, and used the positions of these residues as mutation sites to design variants with increased solubility values ().
Next, we performed an in silico screening using combinatorial mutagenesis at the 14 selected positions allowing up to four simultaneous mutations and by trying substitution to all 20 natural amino acids (). This procedure resulted in >107 screened mutants. From this very large in silico library, we selected 46 variants for preliminary expression analysis (Table S1), based on the criteria that these variants: 1) should span the entire range of solubility scores in the overall library and be as equally spaced as possible within this range; 2) be as chemically diverse in terms of selected mutations and mutation sites; and 3) not include mutations to Pro for structural reasons, Cys to avoid formation of covalent aggregates, Gln/Asn to avoid potential deamidation sites and Met to avoid potential oxidation. The selected 46 variants were expressed in small-scale in HEK293 cells and subjected to Protein A purification. From this pre-screening of 46 variants, 16 variants were selected for scaled-up production and for full purification including size-exclusion chromatography (SEC) in order to obtain large amounts of highly pure antibodies for accurate experimental analysis. These 16 variants also span the entire range of predicted solubility values (), and exhibit acceptable expression levels and thermal stability, as assessed from the preliminary screening of the 46 variants (Table S1). The 16 selected variants were expressed in larger scale in HEK293 cells, subjected to thorough purification using Protein A and SEC, and their thermal stabilities measured by differential scanning fluorimetry ().
Table 1. Antibody solubility library designed by CamSol. mAb variants and their mutations introduced in the heavy and light chains, and the corresponding CamSol scores. WT indicates wild-type.
Table 2. Initial experimental characterization of the antibody solubility library. Tm1 and Tm2 is the midpoint of the thermal unfolding transitions of the Fc domain and the Fab domain, respectively; Rh is the hydrodynamic radius given with the error of the linear fit and pI is the isoelectric point.
Experimental characterization of the antibody library
Variants were first characterized in terms of their thermal stability, native fold and pI. The experimental characterization of the WT mAb and the 16 mutational variants is summarized in . All variants were purified to > 99% purity. The thermal unfolding midpoint of the Fc domain (Tm1), where no mutations were introduced, was measured to be in the 68.1 ± 0.3°C range for all 17 mAbs. For the Fab domain, all mutants displayed high thermal unfolding midpoints (Tm2) with a span of 3.7°C and an average of 79.2°C. The hydrodynamic radius (Rh) of each mAb variant was determined to evaluate whether mutagenesis led to pronounced structural reorganization. Rh values in the 5.1 ± 0.1 nm range were obtained for all variants as expected for native IgG antibodies,Citation42 suggesting that they all possess the same overall native shape. Some of the mutations in the antibody solubility library introduced or removed electrostatic charges. We therefore measured the isoelectric point (pI) for each mutant, which was found to span the 7.4– 8.4 range, with good agreement between theoretical and experimental values.
Evaluation of the developability potential of the antibody library
To provide a robust evaluation of the developability potential of the antibody library, we subjected the variants to a set of well-established developability assays (, , Table S2).Citation12–Citation14,Citation16,Citation41 Experimental data were compared with the combined-chain (considering both heavy and light chains) intrinsic CamSol solubility scores of the variants, which is calculated from the amino acid sequence alone.Citation36 We found that the developability assays correlated well with each other and with the CamSol scores, as shown by a correlation matrix based on Pearson correlation coefficient (rp) and Spearman’s rank-order correlation coefficient (rs) ( and S2(a), respectively). The Spearman’s rank-order correlation coefficient is a measurement of the monotonic behaviour of the relationship between two variables, while the Pearson correlation coefficient estimates the linearity. Thus, the Spearman’s correlation is an estimate of the similarity between the ways in which two different assays rank the molecules, while the Pearson coefficient is a more quantitative estimate that also accounts for the actual differences between the measured values, but it is restricted to linear relationships (Figure S3). The negative correlation between CamSol and some experimental assays is expected, as it follows from the fact that CamSol scores grow with increasing solubility while some experimental readouts decrease with increased solubility.
Figure 3. Developability assessment of the antibody solubility library. The variants were analyzed by: (a) Ammonium sulfate precipitation (AMS), (b) hydrophobic interaction chromatography (HIC), (c) cross-interaction chromatography (CIC), (d) stand-up monolayer chromatography* (SMAC*) using an TSK G3000 SWXL column, (e) stand-up monolayer chromatography (SMAC) using an Zenix SEC 300 column, and (f) affinity-capture self-interaction nanoparticle spectroscopy (AC-SINS), and all types of measurements are compared with combined-chain (heavy and light chains) intrinsic CamSol solubility scores (x-axis). Data points are labelled according to the mAb numbering and color coded according to their intrinsic solubility CamSol score as depicted in the color bar. The fits represent linear regressions and the corresponding R2 values are given.
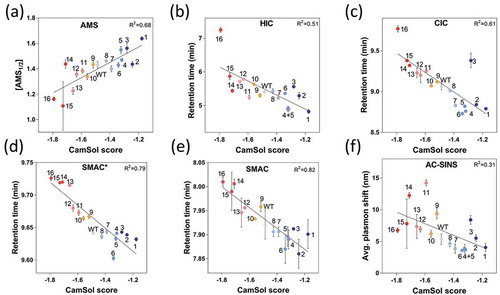
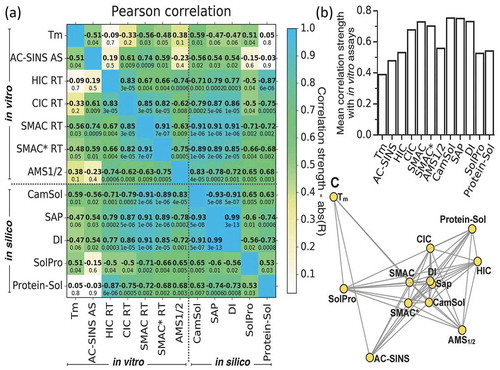
Figure 4. Computational predictions are highly correlated with experimental developability measurement, and can then be adopted in alternative to them. (a) Matrix of Pearson correlation coefficients calculated comparing all combinations of in silico predictions (lower-right) and in vitro developability measurements (top-left). The corresponding p-values are reported below the coefficients, and the matrix is colored-coded according to the correlation strength, which is defined as the absolute value of the correlation coefficients (color-bar). See Figure S5 for scatter plots of the underlying data and Figure S2 for the corresponding Spearman’s rank-order correlation coefficients. (b) Bar-plot with the mean correlation strength, defined for each method (x-axis) as the average of the absolute values of the correlation coefficients with all other in vitro methods. (c) Network visualisation of methods based on the relative distances calculated according to the dissimilarity of the Pearson correlation coefficients, only methods with Abs(R) ≥ 0.5 are connected. Distances among the nodes are approximately proportional to 1-Abs(R), as an exact solution does not exist in the two-dimensional space.
Ammonium sulfate (AMS) precipitation was conducted to assess the relative solubility of the antibody library (, S4). The AMS½, which is the AMS concentration at which the soluble antibody concentration is 50%, was used as a proxy for the solubility of the variants.Citation36 We found a high correlation between the prediction and the AMS½ scores with a Spearman’s rank order correlation coefficient of rs = 0.80 and a Pearson correlation coefficient of rp = 0.83 (p ≤ 10−4, ), S2). To assess the apparent hydrophobicity, we used HIC and obtained a fairly good correlation with the predicted solubility (rs = −0.75 and rp = −0.71 (p ≤ 0.01)) (), ). To probe the tendency of the variants to cross-interact with polyclonal antibodies, CICCitation16 was performed, and a rs = −0.72 and rp = −0.79 (p ≤ 0.01) was obtained (, ). We evaluated the propensity of the variants to interact with a Zenix 300 column (SMAC)Citation14 and a TSK G3000 SWXL column (SMAC*) by determining the retention time, and found high correlations (SMAC: rs = −0.88 and rp = −0.91, p ≤ 1 × 10⁻⁶; SMAC*: rs = −0.88 and rp = −0.89; p ≤ 1 × 10⁻⁶) (, ). With SMAC, mAb variant 11 exhibited an unusually broad peak, indicating strong non-specific column-mAb interaction (Figure S6). This mutant was therefore excluded, as when the shape of the peak was compromised and thus the retention time alone is no longer a reliable measurement of non-specific interactions (Figure S6). The tendency to self-associate was determined using AC-SINS,Citation12,Citation20 where a lower correlation (rs = −0.57 and rp = −0.56; p ≤ 0.02) was found compared to HIC, CIC, SMAC and SMAC* (), ). As expected, the thermal stability of the Fab domain did not show strong correlations with any of the other assays, although the best correlation was observed with CamSol (rs = 0.55 and rp = 0.59, p ≤ 0.01) (). Overall, we found that the CamSol scores show a strong correlation with SMAC and SMAC* measurements, a good correlation with CIC and HIC, and a rather poor, but still statistically significant, correlation with AC-SINS and Tm measurements ().
Comparison with other in silico solubility predictors
CamSol scores and acquired experimental data were compared to other in silico predictors (), S2, S5), namely SolPro,Citation30 Protein-SolCitation43 and SAP.Citation27 Like CamSol, SolPro and Protein-Sol solely require the amino acid sequence for solubility predictions, whereas SAP requires structural input as it determines dynamically exposed hydrophobic surface patches by short molecular dynamics simulations. In addition, SAP allows calculation of the developability index (DI), a score that takes into account the net charge of the antibody and the aggregation propensity of its surface patches.Citation44 CamSol correlates highly with SAP (rs = −0.93 and rp = −0.93) and DI (rs = −0.91 and rp = −0.91, p ≤ 4 × 10⁻⁷) and less with SolPro (rs = 0.54 and rp = 0.65) and Protein-Sol (rs = 0.54 and rp = 0.63) (, S2). As expected, SAP correlates fairly well with hydrophobicity as assessed by HIC (rs = 0.75 and rp = 0.79). In addition, SAP and DI also correlate with non-specificity methods like SMAC, SMAC* and CIC as well as with the AMS solubility assay (, S2). Another interesting finding is that Protein-Sol predictions correlate highly with HIC (rs = – 0.8 and rp = −0.87), albeit more weakly than with the other in vitro measurements.
Comparing developability assays and solubility predictors
To illustrate in a more direct manner the relationships between the different in vitro assays and in silico predictions considered in this study, we presented a matrix visualisation of the correlation coefficients and associated p-values between all possible pairwise comparisons ( for Pearson correlation, Figure S2 for Spearman’s rank, and Figure S5 for the corresponding scatter plots). Similarly, reports the mean correlation strength, defined for each method as the average of the absolute values of the correlation coefficients with all other in vitro measurements. This representation reveals that, among the in silico predictors considered, the sequence-based solubility score of CamSol, and the structure-based calculations of SAP and DI are on average highly correlated with the experimental measurements, while SolPro and Protein-Sol correlate more weakly. Among the in vitro developability measurements, SMAC*, SMAC and CIC have a high mean correlation strength with in vitro measurements, followed by AMS1/2, HIC and AC-SINS, and finally by the melting temperature of the Fab domain, which as expected has the lowest mean correlation. shows instead a network representation of the approximate relative distances between the assays calculated according to their respective correlation. These distances were determined based on the dissimilarity of the Pearson correlation coefficients (see figure caption and Materials and Methods), and therefore the closer two assays are, the stronger they correlate with each other.
Discussion
In silico design of mAb developability
In this work we carried out a quantitative comparison between various methods of assessing mAb developability, including selected in silico solubility predictors. Our strategy consisted of constructing and then screening a mAb library designed to span a broad range of solubility values, with different variants (approximately) uniformly distributed in this range. To construct this library, we mutated surface-exposed residues of a biophysically troublesome mAb,Citation37,Citation38 which were predicted to affect its solubility. As antibody structures are relatively well conserved for different sequences,Citation45 structural homology models are typically accurate enough to select suitable surface-exposed residues for mutation, at least outside the more heterogeneous complementarity-determining region (CDR) loops. Thus, we performed a CamSol structurally corrected calculation on a homology model of the WT to identify suitable sites for amino acid substitution, followed by a fast, purely sequence-based screening of all possible mutations at those sites (). This mutational strategy has previously been demonstrated for a single-domain antibodyCitation39 and for β2-microglobulin,Citation46 but never for a large multi-chain complex like a mAb. In our case, experimental data confirmed that a simple homology model proved sufficient for mutating residues of the IgG4 Fab framework (). Specifically, residues that contributed strongly to the solubility according to the structurally corrected calculation were identified in the structure of the WT mAb, excluding the CDRs (). In fact, even if CDRs often encompass highly insoluble residues that promote antigen binding,Citation47,Citation48 we excluded these regions from our screening to minimize the chances of affecting the binding affinity of the antibody with the selected mutations. However, we did not directly test whether the mutations that we carried out affected target binding or immunogenicity, which should be considered in a screening procedure for therapeutic purposes. We proceeded in this way because the specific goal of our study was to quantitatively compare different in vitro and in silico developability screening methods, independently from the activity or immunogenicity of the antibodies analyzed. A key result of our study is that experimental measurements confirmed the effectiveness of CamSol to rationally modulate with high accuracy the solubility of a humanized full-length antibody, and to design mAb variants with a controlled range of developability potentials.
In vitro developability measurements
Our results show that different in vitro developability methods are on average consistent with each other (, S2 and S5). In particular CIC, SMAC and SMAC* form a group of highly correlated measurements, in agreement with the fact that these are different ways of assessing the propensity of the antibodies to engage in non-specific interactions. HIC also correlates well with these assays, as its marginally worse correlation is in line with the fact that HIC more selectively probes hydrophobic interactions. At variance with these measurements of retention times in chromatography columns, AMS precipitation is a more resource-demanding assay that probes more directly the relative solubility of antibodies by assessing their propensity to precipitate at increasing concentrations of the crowding agent AMS. The correlation observed between AMS1/2 solubility and all chromatography retention times is not perfect, but it is statistically significant (p < 0.01, ). Instead, AC-SINC is a method of assessing the propensity of antibodies to self-associate in solution. Therefore, the relatively low correlation with CIC, SMAC, and SMAC* (rp = 0.61, 0.74, and 0.59, respectively), and in particular the non-statistically significant correlation with HIC and AMS precipitation, are somewhat unexpected. However, a weak and sometimes even inverse correlation between reversible self-association and solubility has previously been observed.Citation22,Citation23 A low and often non-statistically significant correlation was also found between Tm and all other developability assays considered (). In general, Tm gives an indication about the conformational stability of a protein, but no direct correlation has been described with long-term stability or solubility.Citation10 In agreement with these results, Tm measurements have previously been shown not to correlate with other standard developability assays.Citation13
In silico developability predictions
Among the in silico predictors that we considered, CamSol, SAP and DI scores correlate with in vitro measurements to a similar extent (). However, the implementation of the SAP and DI methods requires accurate structural modelling of each variant, and the subsequent calculation of these scores may take up to a few minutes per antibody. Therefore, these methods would require extensive computational resources to carry out screenings such as that presented in . By contrast, CamSol only requires the amino acid sequence as an input, so that the screening requires at least 6 orders of magnitude less time than SAP and DI, thus making this method particularly appealing for the screening of large antibody libraries. SolPro and Protein-Sol are also sequence-based methods, but with respect to CamSol show overall worse, but still statistically significant, correlations with in vitro measurements. The notable exception is the very high correlation between HIC and Protein-Sol (rp = 0.87, p < 10−5), which is the highest correlation of HIC with any assay (, S2). This observation suggests that Protein-Sol could be a promising screening assay for hydrophobicity. More generally, the fact that in silico tools that work in fundamentally different ways give similar ranking of antibody variants in excellent agreement with experimental measurements is, in our opinion, a clear demonstration of the readiness of in silico tools for implementation in antibody screening campaigns.
Incorporation of CamSol in silico predictions in mAb screening campaigns
The good correlation between CamSol scores and reasonably direct measurements of solubility such as AMS precipitation (rp = 0.83, p ~ 10−5) is in line with previous reports for mAbs. Conversely, a key novel finding of this study is the remarkable correlation of CamSol with assays that probe non-specific interactions, such as SMAC, SMAC* and CIC.Citation14,Citation16 The correlations between CamSol and these assays are consistently better than the corresponding correlations between such assays and measurements of AMS precipitation, which probe solubility in a more direct way (, S2). These findings suggest that the combination of biophysical properties at the core of the CamSol calculations is able to capture both the propensity of mAbs for self-interactions and for interactions with other proteins and surfaces. This result is relevant because non-specific interactions are important in developability studies and have been shown to translate into critical issues, such as low expression, high viscosity and fast in vivo clearance.Citation15,Citation18,Citation19,Citation49 We have shown that the sequence-based intrinsic CamSol score correlates particularly strongly with SMAC* (rp = −0.89) and SMAC (rp = −0.91) and fairly well with CIC (rp = −0.79) (, , S2). We also note that the value of the correlation of CamSol and CIC is strongly influenced by the late retention time of mAb3; if mAb3 is excluded a very strong correlation is found (rs = −0.91 and rp = −0.92 p ~ 10−6). In essence, the typical correlation observed among the different in vitro developability assays that we explored, and in particular CIC, SMAC and SMAC*, is similar to that observed between these assays and CamSol (), which only requires the amino acid sequence as input. Consequently, we conclude that, at least for the library we analyzed, CamSol can replace the in vitro assays that we used. Another key result of this study is the finding that high sequence-based CamSol scores, as well as low SAP or DI scores, which require more time-consuming structure-based calculations, generally translate into a high developability potential (, , S2 and S5).
Taken together, our results demonstrate that the in silico solubility predictor CamSol is a powerful screening tool to assess the developability of mAb libraries. In particular, we expect CamSol to be useful to screen phage libraries and other in vitro constructed libraries, as these libraries can give rise to biophysically more challenging mAbs than those derived from mammalian platforms.Citation13,Citation50,Citation51 Since CamSol can rapidly screen hundreds of thousands of sequences and requires no protein structure or material,Citation39 we recommend that it should be run as a primary screen in parallel with functional screening assays in the early discovery phase. Ideally, mAbs offering the best compromise between functionality and predicted developability can be isolated at a very early stage, thereby changing the pace of consequent screenings by lowering the number of antibody candidates for further assessment.
Potential limitations of in silico CamSol assays
A potential limitation of the approach we presented is that CamSol was used to design this mAb solubility library, which was then used to assess the performance of various in silico methods, including CamSol itself. It should, however, be noted that, while the structurally corrected CamSol profile was used to select suitable mutation sites (, S1), such profile is never exploited in the calculation of the sequence-based solubility scores that are later used to assess the performance of CamSol.Citation36,Citation39 In addition, while these scores were computed in silico for all possible mutations at the selected sites, the subsequent selection of the variants to actually produce in the laboratory was done manually using the three criteria highlighted at the beginning of the result section. The only influence of the CamSol scores in this selection was the requirement that the selected variants should be approximately uniformly distributed across the whole solubility range. Given that the full range contained more than 107 variants, this manual selection consisted of an essentially random extraction within each solubility bin, with the sole consideration to avoid picking the same mutations over and over and to discard mutations to residues that may give rise to chemical or structural liability (Cys, Met, Asn, Gln, Pro). In addition, all mutations in the library are performed at solvent-exposed positions, while the sequence-based prediction of CamSol may not be able to effectively capture the impact of mutations at buried positions. It should, however, be noted that the solvent exposure of the mutation sites covers a rather broad range of levels (Figure S1). In addition, should it be necessary, buried positions may be identified from homology models and the structurally corrected CamSol method can be used instead of the intrinsic one. Finally, variants in our library differed by up to four mutations, while some antibody libraries built, for instance, for affinity maturation may have more substantial differences. However, high correlation between the CamSol sequence-based score and solubility measurements has previously been reported in the case of a smaller (nine mAbs) library obtained from in vitro-directed evolution, whose variants differ in the variable fragment by up to 32 mutations, some found at non-fully exposed sites.Citation36 The results of that study, together with those reported here on a larger mAb library and comprising the analysis of many other in vitro measurements of developability potential, strongly suggest that CamSol may be broadly applicable to the developability screening of mAb libraries.
In conclusion, the results that we presented here illustrate the application of the in silico CamSol method for the rational design of developable antibodies, for the re-engineering of troublesome lead candidates, and for the early screening and ranking of variant libraries. The use of this method thus helps increase the chances of faster identification of lead candidates with high developability potential. These findings suggest that the CamSol method can be used as a convenient in silico alternative to more demanding in vitro developability assays.
Materials and methods
Model monoclonal antibody
The HzATNP humanized monoclonal IgG4 antibody (145.2 kDa) used in this study was provided by Novo Nordisk A/S. A single amino acid substitution within the free hinge region (S241P) was introduced to avoid formation of half-mAb, which is a common problem for IgG4 antibodies.Citation52
Homology modelling of HzATNP
Modeller (version 9.12) was used to produce a 2.0 Å homology model of the antibody. The crystal structures of the unliganded mAb7 (PDB code: 4LEX) and recombinant human IgG4 Fc (PDB code: 4C54) were used as templates for homology modelling. The sequence identity of the antibody with the templates ranged from 86% for the Fab heavy chain, 98% for the Fab light chain to 100% for the Fc. The homology model was energy minimized using Gromacs (version 5.1.2) to remove possible steric clashes arising from the model building. Homology models of the variants were generated as described.Citation39
Design of antibody variants using CamSol
An antibody library was rationally designed using the solubility predictor CamSol (www-mvsoftware.ch.cam.ac.uk).Citation39 Briefly, the antibody homology model was used to calculate the structurally corrected solubility profile. PyMol (version 2.0) was used to color-code the antibody surface according to the structurally corrected solubility profile, which CamSol stores in the b-factor column of the PDB file format. The color ramp settings were set to dark blue (b > 1), blue (b > 0.8), orange (b < −0.8) and red (b < −1). The solubility library was built by selecting 7 surface exposed amino acids that contribute either highly or poorly to solubility according to the structurally corrected profile. CamSol was subsequently used to perform a sequence-based combinatorial screening to test all possible amino acid substitutions at the selected positions with a limit of four simultaneous mutations. From the screening, 46 mutants were selected based on their intrinsic solubility scores. For computational efficiency, the scores used in the solubility screening (carried out on more than 107 mutational variants) where calculated from the heavy and light chain sequences of the Fab only, as all mutation sites were performed in this region. Throughout the rest of this report, we provide the CamSol scores calculated using the light chain and the whole of the heavy chain sequence. Because the Fc region is identical in all variants, these scores are by construction correlated with R = 1 with the Fab scores, and therefore the two types of score are effectively interchangeable compared with experimental data. All multi-chain CamSol scores were computed as previously described from the amino acid sequences of heavy and light chains.Citation36
Calculation of other in silico scores
Sequence-based solubility scores were calculated using SolPro (http://scratch.proteomics.ics.uci.edu/)Citation30 and ProteinSol (http://protein-sol.manchester.ac.uk).Citation43 Structure-based SAP scores and molecular charge values were calculated using SAP predictor.Citation27,Citation44 SAP scores were calculated using structural input based on a SAP radius of 5 Å and pH of 7.0 in the BIOVIA Discovery Studio 2018 software (Accelrys, USA). The developability index was calculated using the reported β-value of 0.0815 at 25°C and the following equation:Citation44
Antibody library expression and purification
Single and multiple mutations were introduced into pNNC340 (expression vector harbouring WT HzANTP heavy chain) and pNNC341 (expression vector harbouring WT HzANTP light chain) using QuickChange Lightning multi-site-directed and site-directed mutagenesis kits, respectively (Agilent Technologies). Strings encoding desired HzANTP variants with 15-bp 5ʹ and 3ʹ overhangs matching the 15-bp ends of the linearized WT HzANTP vectors were ordered from GeneArt (Thermo Fisher Scientific). Linerized vectors were generated by PCR, using the KOD xtreme kit (Merck Millipore), according to the manufacturer’s instructions, pNNC340-41 as template, and using the following primers: Forward primer for pNNC340-41, 5ʹ-TCGACCTCTGGCTAATAAAGG-3ʹ; Reverse primer for pNNC340-41, 5ʹ-ATTCGCTAGAGATCCGTTTAAAC-3ʹ. The strings were cloned into the linearized vectors using the In-Fusion HD cloning kit (Takara Bio) according to the manufacturer’s instructions. Site-directed mutagenesis and In-Fusion cloning products were transformed into E. coli DH5alpha competent cells (Thermo Scientific), and the cells were plated on Luria-Bertani (LB) agar plates containing carbencillin and incubated at 37°C overnight. Single colonies were picked and inoculated in 2 mL LB medium containing carbenicillin and grown at 37°C overnight at 250 rpm shaking. Plasmids were harvested from overnight cultures using QIAGEN Plasmid Plus 96 BioRobot Kit (Qiagen) and a Biomek FXP pipetting robot (Beckman Coulter, Brea, US) according to the manufacturer’s instructions. The protein encoding sequences in the plasmids were obtained using Eurofins Scientific’s sequencing service. Clones harbouring vectors encoding the mutations of interest were re-transformed and single colonies were inoculated in 150 mL of LB medium with carbencillin and incubated overnight at 37°C, 125 rpm shaking. > 1 mg quantities of each vector were prepared from these cultures using GenElute HP maxiprep kit (Sigma-Aldrich), according to the manufacturer’s instruction. Expi293F™ cells (Thermo Fisher Scientific, Waltman, US) with a density of 3∂106 cells mL−1 and > 95% viability as measured by NC-3000 NucleoCounter (Chemometec) were transfected with heavy chain and light chain encoding vectors in a 1:1 ratio using the ExpiFectamine™ 293 kit according to the manufacturer’s instructions (Thermo Fisher Scientific). Consequently, 2 mL and 1–2 L cultures per vector were incubated at 36.5°C, 8% CO2 and 300 or 125 rpm shaking, respectively. The cultures were fed transfection enhancers 16 hours after transfection, according to the manufacturer’s instructions. Cultures were incubated for 5 days before harvest. The supernatants were filtered and the antibody concentrations in the filtrates were quantified by Dip and ReadTM Protein A (ProA) Biosensors in an Octet system (Pal ForteBio). Variants were purified on an Äkta Express chromatography system using affinity purification using Mabselect Sure Protein A resin followed by a gel filtration column based on the Superdex200 resin (GE Healthcare). The MabSelect Sure Protein A column was washed with 0.1 M Hepes, 150 mM NaCl, pH 7.4 and antibodies were eluted from the affinity column with 0.1 M sodium formate, pH 3.5 onto the pre-equilibrated gel filtration column via an interconnected loop. The gel filtration column was operated using a running buffer based on 20 mM HEPES, 0.15 M NaCl, pH 7.4. Eluted peaks were fractionated in 96-well plates and fractions were pooled to obtain high purities with minimum of high-molecular weight protein. Antibody concentrations were determined by 280 nm absorbance with Dropsense 96 (Trinean).
Sample handling
Samples at the pH and NaCl concentration of interest were prepared in 20 mM HEPES using Millipore Amicon ultracentrifugation (Merck) devices with a molecular cut off of 10 kDa. The desired pH and NaCl concentration was achieved after up-concentrating the protein samples, followed by three washes with the desired buffer and a final dilution into the desired buffer and concentration. Subsequently, protein concentration was determined using an extinction coefficient of 1.43 mL mg−1 cm−1 at 280 nm using Dropsense 96 (Trinean).
Dynamic light scattering
The hydrodynamic radius (Rh) was determined by measuring Rh at a range of protein concentrations and then extrapolating the Rh value to zero protein concentration to avoid the effects of mAb self-association or repulsion on Rh determination.Citation53 Experiments were conducted using dynamic light scattering using a DynaPro plate reader (Wyatt Technology). Twenty µl of protein samples of 1, 5, 8, 12, 16 and 20 mg/mL in 20 mM HEPES, 10 mM NaCl, pH 8, were measured in 384-well clear-bottom plates (Corning) and the hydrodynamic radius was determined by linear extrapolating to 0 mg/ml. Ten acquisitions were recorded for 5 seconds at 25°C with 0.5 and 1000 nm as low and high cut off values, respectively. Data processing was performed using Dynamics (version: 7.5.0.17; Wyatt Technology).
Differential scanning fluorimetry
Thermal denaturation was measured in high sensitivity capillaries using a Prometheus NT.48 instrument (NanoTemper Technologies). The antibody mutants were subjected to a linear thermal ramp (1°C/min, from 20°C to 95°C) and 10–20% laser excitation intensity. Fluorescence at 350 and 330 nm was collected and the unfolding temperatures (Tm) were determined from the first derivative of the fluorescence ratio (F350/F330). Scattering onset was measured using integrated back reflection optics of the instrument. Data processing was performed using PR control (version: 1.11; NanoTemper Technologies).
Capillary isoelectric focussing
The pI was determined using the iCE3 system (Protein Simple) equipped with an UV detector at 280 nm and an Alcoot 720N autosampler. The separation was conducted using a 50 mm long, 100 µm (I.D.) fluorocarbon coated capillary (Protein Simple). The catholyte consisted of 0.1 M NaOH in 0.1% methyl cellulose and the anolyte of 0.08 M phosphoric acid in 0.1% methyl cellulose. According to the manufacturer´s protocol, protein samples were mixed with 1% methyl cellulose (0.4% final concentration), 5 µl of pharmalytes (GE Healthcare; final concentration 4%), 0.5 µl of low pI marker (pH 4.22) and 0.5 µl high pI marker (pH 9.22; final concentration: 1%) and sterile water until a final volume of 120 µl and final protein concentration of 0.2–0.5 mg/mL was reached. Samples were focused for 1 min at 1500 V and mobilized for 10 min at 3000 V with detection at 280 nm. Data processing was performed using Chrom Perfect (version 6.0.4). Theoretical pI values were calculated using Biopython.
Ammonium sulfate precipitation
Each antibody variant was prepared at a range of ammonium sulfate concentrations (0-2 M in steps of 0.125 M) with a final protein concentration of 1 mg/ml and in 20 mM HEPES, 10 mM NaCl, pH 7.0. 20 µl of each assay solution was added in duplicates in a 384-well clear-bottom plate (Corning). The plate was sealed and incubated for 48 hours at room temperature (RT) under quiescent conditions protected from light. Samples were then transferred to 0.5 mL Eppendorf tubes and centrifuged at 25.000 x g for 30 mins. The concentration of soluble protein in the supernatant was measured by 280 nm absorbance measurements with Dropsense 96 (Trinean) in duplicates. The precipitation midpoint (AMS½) was determined by fitting a sigmoidal function (Figure S4).
Size-exclusion chromatography
SEC-HPLC was performed using a HPLC system (1200 model, Agilent Technologies) and a TSK G3000 SWXL SEC Column (5 µm, 7.8 × 300 mm; Tosoh Bioscience). Eluent A consisted of 122 mM Na2HPO4, 78 mM NaH2PO4, 300 mM NaCl and 4% 2-propanol at pH 6.8. The flow rate was set to 0.8 mL/min of 100% eluent A at a column temperature of 28°C for 24 mins. Twenty µg of protein was injected on the column and detection occurred at 215 nm and 280 nm. Data processing was performed using ChemStation (Agilent).
Hydrophobic interaction chromatography
HIC-UPLC was performed using a HPLC/UPLC system (1100/1200/1290 model, Agilent Technologies) and a Protein-Pak Hi Res Hydrophobic Interaction Column (2.5 µm, 4.6 × 100 mm; Waters). Eluent A consisted of 2.5 M ammonium sulfate, 125 mM sodium phosphate, pH 6.7 and eluent B of 125 mM sodium phosphate, pH 6.7. Furthermore, 5% 2-propanol was added to both eluents to prevent bacterial growth on the column. The gradient was chosen as follows: at time point 0 min, 50% B was present, after 12 mins, 85% B, after 15 mins, 80% B, after 16 and 22 mins, 50% B. The flow rate was set to 0.7 mL/min, column temperature to 30°C and detection occurred at 280 nm. 4 µg of protein was injected on the column. Data was analyzed in ChemStation (Agilent Technologies). The column temperature was set to 30°C.
Affinity-capture self-interaction nanoparticle spectroscopy
AC-SINS was performed as described.Citation12 Briefly, the capture solution containing polyclonal goat anti-human IgG Fc (Cat no.:109–005-008, Jackson ImmunoResearch Europe Ltd, UK) were prepared in 20 mM NaAc at pH 4.3 in a ratio 1:10 with gold particles and incubated for 16–20 hrs at RT. Polyethylene glycol (PEG) was used to block unlabelled sites and was mixed 1:10 with the gold particles/capture antibody solution and incubated for 1 hr at RT. The solution was centrifuged at 15.000 rpm for 6 mins in order to remove excessive PEG in the supernatant. The gold particle pellet was resuspended in 2 mM NaAc, pH 4.3 to a volume representing half the volume of the solution before centrifugation. The antibody variant samples were mixed with the target buffer 20 mM sodium citrate, 50 mM NaCl pH 6.0, goat non-specific antibody solution and gold particle concentrate to achieve the following final concentrations: antibody variants 1 µg/mL; non-specific antibodies 0.1 mg/mL and gold particles 1/10 of the total volume. The assay mix was incubated for 2 hrs at 25°C in a UV transparent Greiner plate. Absorbance was measured at 460–620 nm at a 3 nm increment.
Cross-interaction chromatography
CIC was performed as described.Citation16 Briefly, 100 mg of a human serum polyclonal antibody (I4506; Sigma) was diluted into 3.3 mL of 0.1 M NaHCO3, 0.2 M NaCl, pH 8.2 resulting in a final concentration of approximately 10 mg/mL. All following steps were performed on an Äkta avant system (GE Healthcare). A 1 mL HiTrap column (17–0716-01; GE Healthcare), was washed with 6 ml ice cold 1 mM HCl and the 3.3 mL IgG solution passed over the column at a flow rate of 0.1 mL/min. Consequently, the column was stored at 30 min at RT. The previously saved flow-through was passed two more times over the column at 0.1 mL/min. The final flow through was saved and protein concentration estimated. Since N-hydroxysuccinimide groups are released from the column during coupling and they absorb at 280 nm, the flow-through was buffer shifted with a Zeba column (Thermo Fischer) and the protein concentration at A280 was determined. Approximately 20 mg polyclonal antibody was coupled to the column. The following steps were repeated twice with a 15 min incubation at RT in between. The column was washed with 6 mL of quenching buffer (0.5 M ethanolamine, 0.5 M NaCl, pH 8.3), 6 mL of washing buffer (0.1 M sodium acetate, 0.2 M NaCl, pH 5.0) and 6 mL of quenching buffer (0.5 M ethanolamine, 0.5 M NaCl, pH 8.3). Lastly, the pH was adjusted to 7.4 with phosphate-buffered saline (PBS). Five μg of each antibody variant was injected and cross-interaction with the human serum polyclonal antibody measured at a flow rate of 0.1 mL/min using PBS (pH 7.4) as a mobile phase on an 1100/1200 series HPLC system (Agilent Technologies). Peak retention times on the column were monitored at 280 nm.
Standup monolayer chromatography
SMAC was performed as previously described.Citation14 Briefly, a HPLC system (1100 model, Agilent Technologies) and a Zenix column (SEC-300, 3 µm, 4.6 × 300 mm; Sepax Technologies) were used. Eluent A consisted of PBS (pH 7.4) and the flow was set to 0.35 mL/min. 10 µg of protein was injected and peak retention times were monitored at 280 nm. In the SMAC* experiments we measured the retention time on a TSK G3000 SWXL SEC Column (5 µm, 7.8 × 300 mm; Tosoh Bioscience) as described in the ‘Size-exclusion chromatography’ section.
Statistical analysis
The Spearman’s rank correlation coefficients, Pearson correlation coefficients, and corresponding p-values were calculated using the functions spearmanr and pearsonr of the scipy.stats package (version 0.18) in Python 2.7.10. The network representation of was plotted with the NetworkX library in Python using as edge lengths 1-Abs(rp) (rp being the Pearson correlation coefficient) and requiring to connect only points with Abs(rp) ≥ 0.5.
Abbreviations
| AC-SINS | = | affinity-capture self-interaction nanoparticle spectroscopy |
| CIC | = | cross-interaction chromatography |
| HIC | = | hydrophobic interaction chromatography |
| HzATNP | = | humanized anti-trinitrophenyl |
| IgG | = | immunoglobulin G |
| mAb | = | monoclonal antibody |
| pI | = | isoelectric point |
| SEC | = | size-exclusion chromatography |
| SMAC | = | stand-up monolayer chromatography |
| STDV | = | standard deviation |
| Tm | = | melting temperature |
Disclosure of Potential Conflicts of Interest
No potential conflict of interest was reported by the authors.
Supplemental Material
Download MS Word (36.1 KB)Acknowledgments
From Novo Nordisk A/S we thank Anette Henriksen and Christian Rischel for valuable discussions about the project and Bjarne Gram Hansen, Birgitte Friedrichsen and Anne Lee Andersen for their efforts in organizing plasmid generation and protein expressions. Funding was provided by Novo Nordisk A/S and Innovation Fund Denmark. P. S. is also supported by a Borysiewicz Fellowship from the University of Cambridge
Supplimental material
Supplemental data for this article can be accessed on the publisher’s website.
Related Research Data
References
- Cai HH. Therapeutic monoclonal antibodies approved by FDA in 2016. MOJ Immunol. 2017;5. doi:10.15406/moji.2017.05.00145.
- Ecker DM, Jones SD, Levine HL. The therapeutic monoclonal antibody market. MAbs. 2015;7:9–14. doi:10.4161/19420862.2015.989042.
- Reichert JM. Antibodies to watch in 2017. MAbs. 2017;9:167–181. doi:10.1080/19420862.2016.1269580.
- Leavy O. Therapeutic antibodies: past, present and future. Nat Rev Immunol. 2010;10:297. doi:10.1038/nri2763.
- Shire SJ, Shahrokh Z, Liu J. Challenges in the development of high protein concentration formulations. J Pharm Sci. 2004;93:1390–1402. doi:10.1002/jps.20079.
- Caldwell GW, Ritchie DM, Masucci JA, Hageman W, Yan Z. The new pre-preclinical paradigm: compound optimization in early and late phase drug discovery. Curr Top Med Chem. 2001;1:353–366. doi:10.2174/1568026013394949.
- Roberts CJ. Therapeutic protein aggregation: mechanisms, design, and control. Trends Biotechnol. 2014;32:372–380. doi:10.1016/j.tibtech.2014.05.005.
- Perchiacca JM, Ladiwala AR, Bhattacharya M, Tessier PM. Aggregation-resistant domain antibodies engineered with charged mutations near the edges of the complementarity-determining regions. Protein Eng Des Sel. 2012;25:591–601. doi:10.1093/protein/gzs042.
- Perchiacca JM, Tessier PM. Engineering aggregation-resistant antibodies. Annu Rev Chem Biomol Eng. 2012;3:263–286. doi:10.1146/annurev-chembioeng-062011-081052.
- Jarasch A, Koll H, Regula JT, Bader M, Papadimitriou A, Kettenberger H. Developability assessment during the selection of novel therapeutic antibodies. J Pharm Sci. 2015;104:1885–1898. doi:10.1002/jps.24430.
- Saxena V, Panicucci R, Joshi Y, Garad S. Developability assessment in pharmaceutical industry: an integrated group approach for selecting developable candidates. J Pharm Sci. 2009;98:1962–1979. doi:10.1002/jps.21592.
- Liu Y, Caffry I, Wu J, Geng SB, Jain T, Sun T, Reid F, Cao Y, Estep P, Yu Y, et al. High-throughput screening for developability during early-stage antibody discovery using self-interaction nanoparticle spectroscopy. MAbs. 2014;6:483–492. doi:10.4161/mabs.27431.
- Jain T, Sun T, Durand S, Hall A, Houston NR, Nett JH, Sharkey B, Bobrowicz B, Caffry I, Yu Y, et al. Biophysical properties of the clinical-stage antibody landscape. Proc Natl Acad Sci U S A. 2017;114:944–949. doi:10.1073/pnas.1616408114.
- Kohli N, Jain N, Geddie ML, Razlog M, Xu L, Lugovskoy AA. A novel screening method to assess developability of antibody-like molecules. MAbs. 2015;7:752–758. doi:10.1080/19420862.2015.1048410.
- Avery LB, Wade J, Wang M, Tam A, King A, Piche-Nicholas N, Kavosi MS, Penn S, Cirelli D, Kurz JC, et al. Establishing in vitro in vivo correlations to screen monoclonal antibodies for physicochemical properties related to favorable human pharmacokinetics. MAbs. 2018;10:244–255. doi:10.1080/19420862.2017.1417718.
- Jacobs SA, Wu SJ, Feng Y, Bethea D, O’Neil KT. Cross-interaction chromatography: a rapid method to identify highly soluble monoclonal antibody candidates. Pharm Res. 2010;27:65–71. doi:10.1007/s11095-009-0007-z.
- Lipinski CA, Lombardo F, Dominy BW, Feeney PJ. Experimental and computational approaches to estimate solubility and permeability in drug discovery and development settings. Adv Drug Deliv Rev. 2001;46:3–26. doi:10.1016/S0169-409X(00)00129-0.
- Kelly RL, Sun T, Jain T, Caffry I, Yu Y, Cao Y, Lynaugh H, Brown M, Vásquez M, Wittrup KD, et al. High throughput cross-interaction measures for human IgG1 antibodies correlate with clearance rates in mice. MAbs. 2015;7:770–777. doi:10.1080/19420862.2015.1043503.
- Sharma VK, Patapoff TW, Kabakoff B, Pai S, Hilario E, Zhang B, Li C, Borisov O, Kelley RF, Chorny I, et al. In silico selection of therapeutic antibodies for development: viscosity, clearance, and chemical stability. Proc Natl Acad Sci U S A. 2014;111:18601–18606. doi:10.1073/pnas.1421779112.
- Estep P, Caffry I, Yu Y, Sun T, Cao Y, Lynaugh H, Jain T, Vásquez M, Tessier PM, Xu Y. An alternative assay to hydrophobic interaction chromatography for high-throughput characterization of monoclonal antibodies. MAbs. 2015;7:553–561. doi:10.1080/19420862.2015.1016694.
- Geoghegan JC, Fleming R, Damschroder M, Bishop SM, Sathish HA, Esfandiary R. Mitigation of reversible self-association and viscosity in a human IgG1 monoclonal antibody by rational, structure-guided Fv engineering. MAbs. 2016;8:941–950. doi:10.1080/19420862.2016.1171444.
- Wu J, Schultz JS, Weldon CL, Sule SV, Chai Q, Geng SB, Dickinson CD, Tessier PM. Discovery of highly soluble antibodies prior to purification using affinity-capture self-interaction nanoparticle spectroscopy. Protein Eng Des Sel. 2015;28:403–414. doi:10.1093/protein/gzv045.
- Geng SB, Wittekind M, Vigil A, Tessier PM. Measurements of monoclonal antibody self-association are correlated with complex biophysical properties. Mol Pharm. 2016;13:1636–1645. doi:10.1021/acs.molpharmaceut.6b00071.
- Trainor K, Broom A, Meiering EM. Exploring the relationships between protein sequence, structure and solubility. Curr Opin Struct Biol. 2017;42:136–146. doi:10.1016/j.sbi.2017.01.004.
- Castillo V, Grana-Montes R, Sabate R, Ventura S. Prediction of the aggregation propensity of proteins from the primary sequence: aggregation properties of proteomes. Biotechnol J. 2011;6:674–685. doi:10.1002/biot.201000331.
- Van Durme J, De Baets G, Van Der Kant R, Ramakers M, Ganesan A, Wilkinson H, Gallardo R, Rousseau F, Schymkowitz J. Solubis: a webserver to reduce protein aggregation through mutation. Protein Eng Des Sel. 2016;29:285–289. doi:10.1093/protein/gzw019.
- Chennamsetty N, Voynov V, Kayser V, Helk B, Trout BL. Design of therapeutic proteins with enhanced stability. Proc Natl Acad Sci U S A. 2009;106:11937–11942. doi:10.1073/pnas.0904191106.
- Paladin L, Piovesan D, Tosatto SCE. SODA: prediction of protein solubility from disorder and aggregation propensity. Nucleic Acids Res. 2017;45:W236–W40. doi:10.1093/nar/gkx412.
- Yang Y, Niroula A, Shen B, Vihinen M. PON-Sol: prediction of effects of amino acid substitutions on protein solubility. Bioinformatics. 2016;32:2032–2034. doi:10.1093/bioinformatics/btw066.
- Magnan CN, Randall A, Baldi P. SOLpro: accurate sequence-based prediction of protein solubility. Bioinformatics. 2009;25:2200–2207. doi:10.1093/bioinformatics/btp386.
- Agrawal NJ, Kumar S, Wang X, Helk B, Singh SK, Trout BL. Aggregation in protein-based biotherapeutics: computational studies and tools to identify aggregation-prone regions. J Pharm Sci. 2011;100:5081–5095. doi:10.1002/jps.22705.
- Kuroda D, Shirai H, Jacobson MP, Nakamura H. Computer-aided antibody design. Protein Eng Des Sel. 2012;25:507–521. doi:10.1093/protein/gzs024.
- Li L, Kumar S, Buck PM, Burns C, Lavoie J, Singh SK, Warne NW, Nichols P, Luksha N, Boardman D. Concentration dependent viscosity of monoclonal antibody solutions: explaining experimental behavior in terms of molecular properties. Pharm Res. 2014;31:3161–3178. doi:10.1007/s11095-014-1409-0.
- Adolf-Bryfogle J, Kalyuzhniy O, Kubitz M, Weitzner BD, Hu X, Adachi Y, Schief WR, Dunbrack RL Jr. RosettaAntibodyDesign (RAbD): A general framework for computational antibody design. PLoS Comput Biol. 2018;14:e1006112. doi:10.1371/journal.pcbi.1006112.
- Goldenzweig A, Fleishman S. Principles of protein stability and their application in computational design. Annu Rev Biochem. 2018. doi:10.1146/annurev-biochem-062917-012102.
- Sormanni P, Amery L, Ekizoglou S, Vendruscolo M, Popovic B. Rapid and accurate in silico solubility screening of a monoclonal antibody library. Sci Rep. 2017;7:8200. doi:10.1038/s41598-017-07800-w.
- Neergaard MS, Kalonia DS, Parshad H, Nielsen AD, Moller EH, van de Weert M. Viscosity of high concentration protein formulations of monoclonal antibodies of the IgG1 and IgG4 subclass - prediction of viscosity through protein-protein interaction measurements. Eur J Pharm Sci. 2013;49:400–410. doi:10.1016/j.ejps.2013.04.019.
- Neergaard MS, Nielsen AD, Parshad H, Van De Weert M. Stability of monoclonal antibodies at high-concentration: head-to-head comparison of the IgG1 and IgG4 subclass. J Pharm Sci. 2014;103:115–127. doi:10.1002/jps.23788.
- Sormanni P, Aprile FA, Vendruscolo M. The CamSol method of rational design of protein mutants with enhanced solubility. J Mol Biol. 2015;427:478–490. doi:10.1016/j.jmb.2014.09.026.
- Wingfield PT. Protein precipitation using ammonium sulfate. Curr Protoc Protein Sci/Editorial Board. John E Coligan [et al]. 2001. APPENDIX 3:Appendix-3F. doi:10.1002/0471140864.psa03fs13.
- Yamniuk AP, Ditto N, Patel M, Dai J, Sejwal P, Stetsko P, Doyle ML. Application of a kosmotrope-based solubility assay to multiple protein therapeutic classes indicates broad use as a high-throughput screen for protein therapeutic aggregation propensity. J Pharm Sci. 2013;102:2424–2439. doi:10.1002/jps.23618.
- Bethea D, Wu SJ, Luo J, Hyun L, Lacy ER, Teplyakov A, Jacobs SA, O’Neil KT, Gilliland GL, Feng Y. Mechanisms of self-association of a human monoclonal antibody CNTO607. Protein Eng Des Sel. 2012;25:531–537. doi:10.1093/protein/gzs047.
- Hebditch M, Carballo-Amador MA, Charonis S, Curtis R, Warwicker J. Protein-Sol: a web tool for predicting protein solubility from sequence. Bioinformatics. 2017;33:3098–3100. doi:10.1093/bioinformatics/btx345.
- Lauer TM, Agrawal NJ, Chennamsetty N, Egodage K, Helk B, Trout BL. Developability index: a rapid in silico tool for the screening of antibody aggregation propensity. J Pharm Sci. 2012;101:102–115. doi:10.1002/jps.22758.
- Sircar A. Methods for the homology modeling of antibody variable regions. Methods Mol Biol. 2012;857:301–311. doi:10.1007/978-1-61779-588-6_13.
- Camilloni C, Sala BM, Sormanni P, Porcari R, Corazza A, De Rosa M, Zanini S, Barbiroli A, Esposito G, Bolognesi M, et al. Rational design of mutations that change the aggregation rate of a protein while maintaining its native structure and stability. Sci Rep. 2016;6:25559. doi:10.1038/srep25559.
- Davies DR, Cohen GH. Interactions of protein antigens with antibodies. Proc Natl Acad Sci U S A. 1996;93:7–12. doi:10.1073/pnas.93.1.7.
- Mian IS, Bradwell AR, Olson AJ. Structure, function and properties of antibody binding sites. J Mol Biol. 1991;217:133–151. doi:10.1016/0022-2836(91)90617-F.
- Hotzel I, Theil FP, Bernstein LJ, Prabhu S, Deng R, Quintana L, Lutman J, Sibia R, Chan P, Bumbaca D, et al. A strategy for risk mitigation of antibodies with fast clearance. MAbs. 2012;4:753–760. doi:10.4161/mabs.22189.
- Spencer S, Bethea D, Raju TS, Giles-Komar J, Feng Y. Solubility evaluation of murine hybridoma antibodies. MAbs. 2012;4:319–325. doi:10.4161/mabs.19869.
- Wang F, Sen S, Zhang Y, Ahmad I, Zhu X, Wilson IA, Smider VV, Magliery TJ, Schultz PG. Somatic hypermutation maintains antibody thermodynamic stability during affinity maturation. Proc Natl Acad Sci U S A. 2013;110:4261–4266. doi:10.1073/pnas.1301810110.
- Angal S, King DJ, Bodmer MW, Turner A, Lawson AD, Roberts G, Pedley B, Adair JR. A single amino acid substitution abolishes the heterogeneity of chimeric mouse/human (IgG4) antibody. Mol Immunol. 30;1993:105–108.
- Saluja A, Fesinmeyer RM, Hogan S, Brems DN, Gokarn YR. Diffusion and sedimentation interaction parameters for measuring the second virial coefficient and their utility as predictors of protein aggregation. Biophys J. 2010;99:2657–2665. doi:10.1016/j.bpj.2010.08.020.