
ABSTRACT
Biotherapeutics, which are biologic medications that are natural or bioengineered products of living cells, have revolutionized the treatment of many diseases. However, unwanted immune responses still present a major challenge to their widespread adoption. Many patients treated with biotherapeutics develop antigen-specific anti-drug antibodies (ADAs) that may reduce the efficacy of the therapy or cross-react with the endogenous counterpart of a protein therapeutic, or both. Here, we describe an in vitro method for assessing the immunogenic risk of a biotherapeutic. We found a correlation between clinical immunogenicity and the frequency with which a biotherapeutic stimulated an increase in CD134, CD137, or both cell surface markers on CD4+ T cells. Using high-throughput flow cytometry, we examined the effects of 14 biotherapeutics with diverse rates of clinical immunogenicity on peripheral blood mononuclear cells from 120 donors with diverse human leukocyte antigen class II-encoding alleles. Biotherapeutics with high rates of ADA development in the clinic had higher proportions of CD4+ T cells positive for CD134 or CD137 than biotherapeutics with low clinical immunogenicity. This method provides a rapid and simple preclinical test of the immunogenic potential of a new candidate biotherapeutic or biosimilar. Implementation of this approach during biotherapeutic research and development enables rapid elimination of candidates that are likely to cause ADA-related adverse events and detrimental consequences.
Introduction
The administration of protein biotherapeutics, which are natural or bioengineered drugs that are produced in living cells, can provoke an unwanted immune response leading to the development of anti-drug antibodies (ADAs). ADAs can affect the pharmacokinetics, pharmacodynamics, efficacy, and even the safety of a biotherapeutic.Citation1 The incidence, magnitude, and duration of an ADA response depends on characteristics of both the patient and the biotherapeutic.Citation2 For example, patients with a highly active immune system, such as observed in autoimmunity, may have increased risk of immunogenicity toward biotherapeutics.Citation3,Citation4 However, ADA development is not limited to patients with autoimmune disease. ADA development occurred in 48% of the patients who received bococizumab, an anti- proprotein convertase subtilisin-kexin type 9 (PCSK9) monoclonal antibody for reducing low-density lipoprotein.Citation5 Although different attempts to minimize immunogenicity are used, most biotherapeutics are immunogenic to some extent and can lead to the development of ADA in patients.Citation6,Citation7 With the increased number of biotherapeutics both in preclinical and clinical development and approved by the US Food and Drug Administration for the treatment of numerous diseases, including cancer, autoimmune disorders, and viral and bacterial infections, it is critical to evaluate the immunogenicity potential of candidate and approved biotherapeutics. For biosimilars, which are products with the identical protein sequence generated by a different manufacturer than the original biotherapeutic and which may have a different formulation buffer, as well as for new biotherapeutics, effective screening of immunogenic risk and the potential for ADA development before clinical trials is critical for mitigating this adverse event.
Several methods for assessing the immunogenicity risk of biotherapeutics in vitro have been described. Because T helper cells are needed to produce high affinity specific ADA, many methods evaluate CD4+ T cells as an indicator for immunogenicity. These methods typically investigate the effect of biotherapeutics on T cell proliferation or cytokine secretion from cultured peripheral blood mononuclear cells (PBMCs) from healthy donors.Citation8–11 Two main methods for assessing T cell proliferation are: 1) incorporation of [3H]thymidine and detection of radioactivity; or 2) flow cytometric analysis of cells that have incorporated fluorescent dyes, such as carboxyfluorescein succinimidyl ester or bromodeoxyuridine. Assessment by [3H]thymidine incorporation is restricted to laboratories with dedicated areas and protocols for handling radioactive agents and proper waste management procedures.Citation12 Assessment by incorporation of flow cytometry requires depletion of CD8+ cells prior to analysis to achieve meaningful sensitivity for this assay.Citation13,Citation14 The efficiency of T cell proliferation assays is limited by the requirement for long culture times and multiple steps, which reduce the signal and limit detection of proliferative T cell clones. Techniques, such as ELISA and ELISPOT, to evaluate cytokine secretion were also developed to examine biotherapeutics immunogenicity in vitro, but these assays do not have enough sensitivity for use as a stand-alone assay. Consequently, effective assessment of immunogenic risk would benefit from additional, highly sensitive approaches.
Interactions between antigen-presenting cells (APCs) and T cells initiate the immune response toward a biotherapeutic. APCs include dendritic cells (DCs), macrophages, and B cells, which endocytose the biotherapeutic, break it into peptides (antigens), and present individual peptide antigens as part of a complex with human leukocyte antigen class-II (HLA-II) molecules on their cell surface. T cells recognize and bind this peptide-HLA-II complex with the T cell receptor (TCR), which provides an initial stimulatory signal to the T cell.Citation15,Citation16 To achieve T cell activation, proliferation, and cytokine production by an antigen, costimulatory signals delivered by CD28 on T cells and its ligands CD80 or CD86 on APCs are also needed.Citation17 Additional T cell costimulatory receptors belonging to the tumor necrosis factor receptor superfamily (TNFRSF), such as CD134 (also known as OX40) and CD137 (also known as 4–1BB), with their corresponding ligands on APCs (OX40L and 4–1BBL, respectively) are also important for full antigen-dependent T cell activation.Citation18 CD134 and CD137 are rarely present on unstimulated T cells (naïve) in human blood. Their expression is transiently induced on both CD4+ and CD8+ T cells following antigen stimulation and priming of naïve T cells.Citation19–21 In vivo, CD134 co-stimulation is thought to have a more prominent role in CD4+ T-cell function, whereas CD137 preferentially co-stimulates CD8+ T cells.Citation22 However, in vitro data indicate that CD137 can contribute to CD4+ T cell activation following antigen stimulation, suggesting that both CD134 and CD137 support similar responses and have overlapping effects on CD4+ and CD8+ T cell populations.Citation23,Citation24
Here, we evaluated the fraction of CD4+ T cells positive for CD134, CD137, or both after stimulation of PBMCs with a panel of 14 biotherapeutics with low, intermediate, and high reported rates of ADA development in clinical trials. We found that that the proportion of cells positive for CD134 or CD137 distinguished biotherapeutics with low immunogenicity from those with intermediate or high immunogenicity. Based on this observation, we developed a flow cytometry-based method for efficient, sensitive, and rapid assessment of the immunogenicity risk of a biotherapeutic, which we predict will be particularly useful as a preclinical screening assay to eliminate candidate biotherapeutics that have a high likelihood of causing ADA.
Results
Biotherapeutics with high immunogenic potential enhance CD134 and CD137 expression on CD4 T cells in vitro
We sought to determine whether T cell activation in vitro identifies biotherapeutics with high immunogenicity from those with low immunogenicity. As an initial test, we stimulated PBMCs from 40 healthy donors, representing a diverse set of HLA-II-encoding alleles (Supplementary Table 1), with two biotherapeutics, one with a reported low ADA risk and one with a high immunogenicity risk (). We used bevacizumab, which is an FDA-approved humanized anti-vascular endothelial growth factor monoclonal immunoglobulin G1 (IgG1) antibody that causes ADA in 0.6% of patients [United States Prescribing Information (USPI, 2020)], and HuA33, which is a humanized anti-A33 monoclonal IgG antibody that causes ADA in 73% of patients.Citation25 We monitored the fraction of CD4+ T cells positive for CD134, CD137, or both by flow cytometry two days after stimulation (Supplementary Figure 1 and ). PBMC samples from each donor were stimulated with keyhole limpet hemocyanin (KLH) as a positive control of the ability of the CD4+ T cells to undergo antigen-induced activation in vitro. We defined a stimulation index (SI) for the ability of the biotherapeutic to increase the fraction of live CD4+ cells that were positive for either CD134 or CD137 compared to the fraction of cells positive for these markers in tissue culture medium (). We used a 90/95 tolerance interval for bevacizumab (see Methods, Statistical Analysis) to define the range of values for low-immunogenic biotherapeutics. Based on this range, a threshold of 1.8 was determined as the upper limit of the values of a low-immunogenic drug (stimulation index (SI)≥1.8). Based on this threshold, all donors exhibited a positive response (SI≥1.8) to KLH, whereas 37.5% of the donors responded positively to HuA33 and only 2.5% were positive for bevacizumab (). This substantial difference in the number of donors responding to HuA33 and bevacizumab suggested that the abundance of CD134 or CD137 at the cell surface of CD4+ T cells could be used to differentiate between biotherapeutics with low and high immunogenic potential. We refer to this assay as the CD134/CD137 T cell activation assay.
Table 1. Properties of the biotherapeutic agents tested
Figure 1. Percent of CD4+ T cells positive for CD134, CD137, or both following exposure to bevacizumab or anti-human A33 (HuA33). PBMCs from 40 donors were collected from human blood and incubated with bevacizumab, HuA33, keyhole limpet hemocyanin (KLH) or tissue culture medium for 2 days. The fraction of CD4+ live cells positive for CD134 and CD137 was measured by flow cytometry. (a) Representative flow cytometry graphs of the abundance of CD134 and CD137 on CD4+ cells from a single donor for each condition. The percent of cells of CD134+, CD137+, and CD134+CD137+ cells are indicated. (b) Scatter plot of the stimulation index (SI) for each of the 40 donors tested with each treatment. Horizontal line represents the threshold for a positive response (SI ≥ 1.8). Each dot represents a donor. (c) Percentage of donors positive for each condition based on SI ≥ 1.8. Statistical significance was determined as indicated in Materials and Methods (***, p ≤ 0.001). bevacizumab: p-value = 0.92 (Non-significant [ns]), HuA33: p-value < 0.001, KLH: p-value < 0.001
![Figure 1. Percent of CD4+ T cells positive for CD134, CD137, or both following exposure to bevacizumab or anti-human A33 (HuA33). PBMCs from 40 donors were collected from human blood and incubated with bevacizumab, HuA33, keyhole limpet hemocyanin (KLH) or tissue culture medium for 2 days. The fraction of CD4+ live cells positive for CD134 and CD137 was measured by flow cytometry. (a) Representative flow cytometry graphs of the abundance of CD134 and CD137 on CD4+ cells from a single donor for each condition. The percent of cells of CD134+, CD137+, and CD134+CD137+ cells are indicated. (b) Scatter plot of the stimulation index (SI) for each of the 40 donors tested with each treatment. Horizontal line represents the threshold for a positive response (SI ≥ 1.8). Each dot represents a donor. (c) Percentage of donors positive for each condition based on SI ≥ 1.8. Statistical significance was determined as indicated in Materials and Methods (***, p ≤ 0.001). bevacizumab: p-value = 0.92 (Non-significant [ns]), HuA33: p-value < 0.001, KLH: p-value < 0.001](/cms/asset/b08fae72-c6a8-4983-8fb6-8076ac5cbf3e/kmab_a_1898831_f0001_b.gif)
The CD134/CD137 T cell activation assay is reproducible
To determine the robustness of this assay in the evaluation of the immunogenicity risk of various biotherapeutics, we tested 6 additional biotherapeutics with known low and high clinical ADA. We stimulated PBMCs from a cohort of 40 HLA-II typed donors, 26 of whom overlapped with those tested against HuA33 and bevacizumab (Supplementary Table 1), with biotherapeutic antibody-based drugs targeting PCSK9 that have a range of ADA rates (): bococizumab (48% ADA5), MPSK3169A/RG7652 (3.3% ADACitation26), alirocumab (4.8% 6.3% ADA;USPI 2017), or evolocumab (0.3% ADA; USPI 2017). We evaluated the abundance of CD134 and CD137 on CD4+ T cells. Consistent with the clinical data that identify bococizumab as having a higher immunogenicity risk than the other anti-PCSK9 antibodies, we found that 19 of the 40 (47.5%) donors were responsive to bococizumab, whereas no more than 3 of the 40 donors responded to RG7652, alirocumab, or evolocumab ().
Figure 2. The CD134/CD137 T cell activation assay is reproducible. PMBCs were isolated from blood from 2 sets of donors and incubated with the indicated biotherapeutics or KLH as a positive control. After 2 days, the fraction of CD4+ live cells positive for CD134 and CD137 was measured by flow cytometry. (a, b) Results of a single experiment with cells from one set of 40 donors. The scatter plot presents the SI for each of the 40 donors tested with each treatment. The horizontal line represents the threshold for a positive response (SI ≥ 1.8). The bar graph presents the percentage of positive donors for each of the treatment based on SI ≥ 1.8. (c, d) Results from a single experiment with cells from second set of 40 donors. The experiment was performed by a different analyst and on a different day from the experiment shown in A and B. Data are presented as in A and B. Statistical significance was determined as indicated in Materials and Methods (***, p ≤ 0.001). Bevacizumab: p-value = 0.78 (ns), RG7652: p-value = 0.58 (ns), alirocumab: p-value = 0.58 (ns), evolocumab: p-value = 0.92, bococizumab: p-value < 0.001, KLH: p-value < 0.001, trastuzumab: p-value (ns), pertuzumab: p-value: 0.58
Using a second set of PBMCs from a separate cohort of 40 donors with known HLA-II genotypes (Supplementary Table 1), we examined the CD134 and CD137 responses of isolated CD4+ T cells to two low immunogenic biotherapeutics: trastuzumab (10% ADA; USPI 2019) and pertuzumab (2.8% ADA; USPI 2013). To establish the reproducibility of the assay, this analysis was performed on a different day and by a different analyst. As an additional evaluation of robustness, cells from this separate donor cohort were tested for responsiveness to bococizumab and bevacizumab. Consistent with the first set of T cells from the first cohort of donors, cells from 50% of the donors exceeded the threshold for a positive response to bococizumab, whereas only 5% exhibited a positive response to bevacizumab treatment (). None of the donors exhibited a positive response to trastuzumab and only 3 of 40 (7.5%) exhibited a positive response to pertuzumab.
Next, we compared the CD134/CD137 T cell activation assay with a proliferation assay using PBMCs from the second cohort of 40 donors. We used bococizumab as a biotherapeutic with a high immunogenic risk and bevacizumab as one with a low immunogenic risk. T cell activation was measured 2 days after exposure to the biotherapeutic and proliferation 7 days after exposure. Due to the high signal to noise of bevacizumab-treated PBMCs and high donor variability in this T cell proliferation assay, we could not set a threshold based on a tolerance to discriminate between bevacizumab and more immunogenic drugs. Therefore, to enable comparison of the discriminatory ability of the activation and proliferation assays, we determined receiver operating characteristic (ROC) curves for the sensitivity and specificity of both assays for bevacizumab and bococizumab. ROC curves showed a superior specificity and sensitivity of the CD134/CD137 T cell activation assay over the T cell proliferation assay (Supplementary Figure 2). The area under the curve (AUC) for the proliferation assay was 0.63 and the AUC for the CD134/CD137 T cell activation assay was 0.75. Interestingly, the optimal discriminatory cutoff to separate bevacizumab and bococizumab by ROC analysis for the CD134/CD137 T cell activation assay was close to 1.8, the threshold that was selected based on the tolerance interval.
HLA-II presentation of peptides from biotherapeutics with high immunogenicity is essential for induction of CD134 or CD137
TCR recognition of HLA-bound peptides is crucial for the induction of a T cell-mediated immune response and the subsequent formation of persistent ADAs.Citation27 Therefore, we assessed whether the increased proportion of CD4+ T cells positive for CD134 or CD137 after stimulation with bococizumab resulted from HLA-II–dependent antigen presentation. For these experiments we selected the PBMCs with T cells that exhibited a positive response (SI ≥ 1.8) to bococizumab in the CD134/CD137 assay and varied in their HLA-II-encoding alleles (Supplementary Table 1). We stimulated the PBMCs for 2 days with bococizumab alone or in combination with antibody that blocks HLA-II (pan-HLA-II antibody) and examined the induction of CD134 and CD137. As expected, PBMCs from all donors exposed to bococizumab alone exhibited T cell activation that exceeded the threshold (SI ≥ 1.8), indicating a positive response (). We observed no significant difference in CD4+ T cell activation between PBMCs incubated with the pan-HLA-II antibody and those incubated with bococizumab in the presence of the pan-HLA-II antibody (). Furthermore, none of the cells exceeded the positivity threshold when tested for responsiveness to bococizumab in the presence of the pan-HLA-II antibody. These results indicated that the induction of the activation markers CD134 and CD137 on CD4+ T cells by bococizumab results from engagement of the TCR by HLA-II-presented peptides.
Figure 3. HLA-II presentation is required for a positive signal in the CD134/CD137 T cell activation assay. PBMCs were isolated from 5 human blood samples and incubated in the presence or absence of pan-HLA blocking antibody (αHLA-pan) and bococizumab for 2 days. The proportion of live CD4+ T cells positive for CD134 and CD137 was determined by flow cytometry, and SI was determined. The horizontal line represents the threshold for a positive response (SI ≥ 1.8). **p values < .005, paired t-tests
The CD134/CD137 T cell activation assay can assess the immunogenic potential of immunosuppressive biotherapeutics
The mechanism of action of biotherapeutics that function by targeting the immune response can influence immunogenicity. Therefore, we investigated whether we could accurately classify the immunogenicity of immune-modulator biotherapeutics using the CD134/CD137 T cell activation assay. Note that ADA risk can vary, depending on the population and treatment paradigm,Citation28 with some of the tested drugs having multiple values reported. For example, ixekizumab, a monoclonal anti-interleukin (IL)-17A antibody, has a frequency of ADA of 5.2% – 22% in patients with different disease states (USPI, 2020). Similarly, the tumor necrosis factor (TNF) inhibitor adalimumab exhibits a frequency of 5% – 26% ADA development,Citation29 and etanercept, another TNF-inhibiting drug with a different mechanism of action, has a narrower range (3.6% – 8.7% (USPI, 2011)). We defined 3 immunogenicity categories: 1) low were drugs with an ADA rate consistently less 15%, 2) intermediate/high were drugs with an ADA rate between 15% and 30%, and 3) high were drugs with an ADA rate above 30%. Thus, we selected etanercept and secukinumab as biotherapeutics representing the low immunogenicity category, ixekizumab and adalimumab as the representatives of the intermediate/high category, and ATR-107Citation30 and anti-IL13/IL17 BITS7201ACitation31 as representatives of the high category ().
Our analysis consistently identified ATR-107, an antibody targeting the IL-21 receptor,Citation30 as high risk with most donors exhibiting a positive response that exceeded the threshold (). For BITS7201A,Citation31 a bispecific IgG4 antibody that targets both IL-13 and IL-17, and secukinumab, a human monoclonal antibody that targets IL-17, the CD134/CD137 T cell activation assay accurately reflected the high and low immunogenicity of these two biotherapeutics (). Our assay distinguished between anti-IL13/IL17 BITS7201A and bevacizumab () and identified a potential immunogenicity risk for ixekizumab (intermediate/high), another IL-17A inhibitor antibody ().
Figure 4. Evaluation of immune-modulating biotherapeutics in the CD134/CD137 T cell activation assay. (a, b, c) PBMCs were isolated from 40 human blood samples and incubated in the presence of the indicated biotherapeutics for 2 days. The proportion of live CD4+ T cells positive for CD134 and CD137 was determined by flow cytometry, and SI was determined. Data are presented on separate graphs to enable matching of donor samples and HLA-II types to each experiment (see Supplementary Table 1). Horizontal lines represent the threshold for a positive response (SI ≥ 1.8). In all experiments KLH served as positive control. Statistical significance was determined as indicated in Materials and Methods (***, p ≤ 0.001). Bevacizumab (in a and c): p-value = 0.78 (ns), bevacizumab (in b): p-value = 0.92 (ns), etanercept: p-value = 0.58 (ns), adalimumab: p-value = 0.58 (ns), ATR-107 = p-value < 0.001, KLH: p-value < 0.001, anti-IL13/IL17/BITS7201A (αIL13/IL17): p-value < 0.001, ixekizumab: p-value < 0.001, secukinumab: p-value = 0.78 (ns)
However, our assay was not effective at differentiating the ADA risk of adalimumab (intermediate/high) and etanercept (low) (), which may relate to the overlapping ranges of reported ADA percentages for these drugs.Citation29
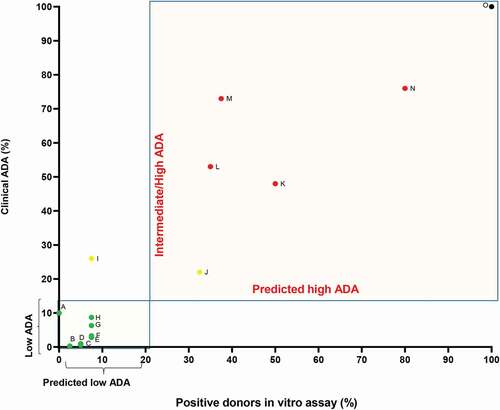
As an indication of the accuracy of the CD134/CD137 T cell activation assay, we plotted the percentage of positive donors in our assay against the maximum reported clinical ADA response rate (). We grouped the drugs with intermediate/high and high clinical ADA rates, because, in a drug development context, the decision making for the best candidates would be based on choosing the molecule with the lowest risk among a panel of candidates. Based on this analysis, the CD134/CD137 T cell activation assay accurately identified the clinical immunogenicity risk of most (13/14) of the biotherapeutics. Adalimumab was the only drug for which the CD134/CD137 T cell activation assay classified the drug at a lower immunogenic risk (< 20% of donors with a positive response) than the clinical ADA observed. overall, the results indicated that the assay can be used as a useful tool for a rapid screening biotherapeutics for a high immunogenicity risk and distinguishing them from biotherapeutics with low ADA.Citation32
Figure 5. Summary of clinical ADA frequency and percentage of positive responding donors as determined by in the CD134/CD137 T cell activation assay. Biotherapeutics were divided into 2 groups based on their clinical ADA: low ADA (green dots) ≤15% ADA and intermediate/high (yellow dots) or high ADA (red dots) >15%. A-Trastuzumab, B-Evolocumab, C-Bevacizumab, D-Secukinumab, E-Pertuzumab, F-RG7652, G-alirocumab, H-Etanercept, I-Adalimumab, J-Ixekizumab, K-Bococizumab, L-Anti-IL13/IL17/BITS7201A, M-HuA33, N-ATR-107, O- KLH (black dot). Rates of clinical immunogenicity were derived from the most current USPI, unless stated differently. ADA values for anti-IL13/IL17/BITS7201A and ATR-107 at single ascending-dose studies were considered for the calculation. Because secukinumab clinical ADA frequency is below 1%, an ADA = 1 was used. Because adalimumab, etanercept and ixekizumab have high variability in clinical ADA frequency, ADA was chosen based on maximal ADA in the USPI. For adalimumab-ADA = 26%, for etanercept- 8.7%, and for ixekizumab- 22%
Discussion
ADAs generated in response to biotherapeutics have consequences for both biotherapeutic safety and efficacy, which may lead to the termination of a biotherapeutic development program during or after clinical trials. Here, we presented an efficient in vitro method for assessing the potential immunogenicity risk of biotherapeutics and for distinguishing between high and low ADA biotherapeutics prior to their use in the clinic. We found a relationship between the clinical ADA induced by biotherapeutics and the frequency of eliciting an immune response in vitro as measured by the proportion of CD4+ T cells positive for CD134 or CD137 on CD4+ T cells using flow cytometry.
In vitro T cell assays to screen for immunogenicity are used for preclinical testing (reviewed in Ref. 8), and such screening is recommended, but not required, by some of the health authorities.Citation33 However, those assays may need multiple expensive and laborious steps, such as depletion of CD8+ T cells,Citation13,Citation14 multiple stimulation cycles with an antigen,Citation34 use of [3H]-thymidine incorporation,Citation10 or incubation of CD4+ T cells with irradiated PBMCs as APCs.Citation35 One of the major advantages of the CD134/CD137 T cell activation assay is that those steps are not required, thus enabling improved throughput and reducing cost and labor.
Both CD134 and CD137 are present after the induction of antigen-primed naïve CD4+ T cells and are crucial for sustained clonal expansion and cell survival.Citation24,Citation36,Citation37Consistent with an earlier report,Citation21 we detected only limited amounts of CD134 or CD137 on unstimulated cells. We also found low amounts of these markers on CD4+ T cells stimulated with biotherapeutics with low clinical ADA frequency. Generation of a T cell-dependent immune response and persistent ADAs requires T cell recognition of epitopes presented by HLA-II. This activation ensures a robust antibody response by B cells, isotype switching, and the development of memory B cells. Without these signals, antigen-specific B cells might be rendered anergic or undergo apoptosis.Citation38 We found that HLA-II blockade inhibits T cell activation in response to bococizumab, suggesting that CD134 and CD137 markers are specifically associated with T cell activation from antigen presentation. Thus, an additional application of the CD134/CD137 assay includes evaluation of the capacity of peptide loaded APCs to prime T cells. This assay could be modified to detect additional markers of T cell activation or differentiation, or both, to further characterize a T cell population or to identify other markers that may improve assay specificity.
HLA molecules are highly polymorphic, which may affect their peptide-HLA binding interaction. To overcome this challenge, we tested a panel of donors that represent the major allelic diversity of the population worldwide. The consistency between the experiments and across the donor cohorts for both bevacizumab and bococizumab indicated that this T cell activation assay is reproducible and suitable for ranking the immunogenicity risk of biotherapeutics. Although we tested 40 donors in each cohort, computational strategies, such as SampPick,Citation39 may enable the creation of a cohort of donors that will closely match the target population for the biotherapeutic, which could reduce the number of donors.
Additionally, the assay may also reveal biotherapeutics with multiple hot spots for T cell recognition or with promiscuous epitope(s), as suggested by finding multiple donors with various HLA types that responded to bococizumab. Evaluation of the HLA profiles associated with reactivity may also reveal populations of patients at increased risk of developing ADA, enabling personalized therapy and patient stratification.
Although the assay correctly assessed the immunogenicity of most immune-modulating biotherapeutics used for the treatment of autoimmune disorders, the assay had limited success in evaluating the immunogenicity of TNF inhibitors. Previous studies of PBMCs from patients with inflammatory bowel disease, ulcerative colitis, psoriasis, or rheumatoid arthritis indicated that anti-TNF treatment reduces T cell activation and proliferation.Citation40 Therefore, the mechanism of action of the TNF-blocking biotherapeutics may interfere with the CD134/CD137 T cell activation assay. Kinetic experiments show that anti‐TNF treatment delays rather than impairs CD4+ T cell activation, maturation, and proliferation.Citation32 We assessed T cell activation 2 days after biotherapeutic stimulation. Longer incubation time after exposure to TNF inhibitors may enable detection of increased CD134 and CD137 abundance and effective evaluation of the immunogenicity of such TNF-targeted biotherapeutics.
Additional limitations of our study are that we mostly evaluated antibody-based biotherapeutics, and we performed a descriptive analysis of the correlation between T cell activation and ADA risk. Any protein that exhibits diversity, either in primary sequence or in posttranslational modifications, among the population could trigger ADA. Future studies with other biotherapeutics that are not antibodies are warranted to determine the application of this assay to those biological molecules. As the CD134/CD137 T cell activation assay becomes more common and widely use in the industry, the statistical power of the predictive ability of this assay in evaluating ADA risk will be clearer.
The immune response of T helper cells to biotherapeutics mainly depends on a few T cells that recognize specific antigens. The PBMCs used in our assay are from healthy donors and are considered as antigen inexperienced (naïve) because those donors were never exposed to the biotherapeutic agent that could generate therapeutic-specific memory T cells.Citation8 In our assay, only those naïve T cells that recognize an antigen derived from the biotherapeutic through presentation by HLA-II and engagement of TCRs lose their naïve phenotype to become activated T cells. The identification of this rare population of activated antigen‐specific T cells within the large repertoire of non‐specific T cells is still a major challenge. Given the complexity and polymorphic nature of the immune system, there is still no single assay that can precisely predict whether a biotherapeutic will elicit a detrimental immune response in all patients. In addition, many factors can contribute to the generation of ADA in vivo. Examples include the route of administration, dosing regimen, type of disease, persistence of the biotherapeutic in the lymph node, and interaction of T cells and B cells in the follicular and germinal centers.Citation41,Citation42 In vitro assays cannot account for those factors. Thus, our CD134/CD137 T cell activation assay, like all available in vitro assays, cannot precisely predict the rate of immunogenicity in the clinic. Thus, we propose that the CD134/CD137 assay should be used as one of several assays for assessing immune responses to biotherapeutics. Methods such as in silico T cell epitope prediction, DC internalization,Citation43 and proteomic analysis of major histocompatibility complex-associated peptides proteomics (MAPPs)Citation44 remain critical for providing an accurate and complete portrait of the immunogenicity of a biotherapeutic.
We found a strong relationship between reported clinical immunogenicity data and the probability that a biotherapeutic will activate T cells, as evaluated by CD134 and CD137 expression in vitro. Thus, the assay is valuable for screening and selection against biotherapeutics with high potential immunogenicity risk. The ease of sample preparation for flow cytometry analysis and the reduced duration of the cell culture step of our method enables rapid evaluation of multiple biotherapeutics using this novel method. This approach may be implemented to help mitigate the risk of unwanted immune responses to protein therapeutics during lead selection, which in turn may reduce the harmful clinical ADA consequences that occur in clinical trials.
Materials and methods
In vitro T cell activation assay
PBMCs were collected from an anonymous healthy volunteers participating in the Genentech blood donor program, after written, informed consent from the Western Institutional Review Board. PBMCs were isolated from fresh blood by density gradient centrifugation using Uni Sep blood separation tubes (Accurate Chemical & Scientific; Westbury, NY). PBMCs samples were frozen in 10% dimethyl sulfoxide and 90% human AB serum. Thawed cells were cultured with AIM V medium (Thermo Fisher) with 10% human AB serum (Sigma Aldrich; Catalog No. H3667) at a concentration of 2 × 10⁶ cells/mL and challenged with test antibodies at a final concentration of 100 μg/mL. All samples were tested in triplicate. For each donor, responses to a negative control, consisting of cells exposed to medium only (referred to as the unstimulated cells), and a positive control of cells exposed to KLH (mcKLH) were included. Cell plates were placed in a 5% CO2 incubator at 37°C for 42–48 hours. After incubation, the cells were washed and stained with viability dye (Thermo Fisher), CD4 (clone SK3), CD134 (clone ACT35), and CD137 (clone 4B4-1). The cells were incubated for 30 minutes in 4°C, washed with phosphate-buffered saline containing 0.5% bovine serum albumin (BSA) and analyzed by fluorescence-activated cell sorting (FACS) Canto II (BD Inc.; Franklin Lakes, NJ). Flow cytometry plots were analyzed using FlowJo FACS analysis software (Tree Star, Inc.; Ashland, OR). For data analysis, SI was calculated by dividing the maximum percentage of live+CD4+CD134+, live+CD4+CD137+, or live+CD4+CD134+CD137+ by the maximum percentage of the same 3 populations of cells in the medium-only treated sample (unstimulated cells) for each treatment and donor (Supplementary Figure 1). To achieve minimum signal to noise and maximum sensitivity, a response was considered positive if the SI was greater than 1.8 (SI ≥ 1.8). The percentage of donors that responded to a treatment (% positive donors) was calculated by dividing the number of donors that had a positive response (SI ≥ 1.8) by the total number of donors that were examined.
Less than 5% of donor samples were excluded from analysis because their PBMCs failed to respond to KLH (SI < 1.8). None of the excluded samples showed a response to any of the biotherapeutics tested. Researchers were blinded to the clinical ADA values of the tested biotherapeutics during the analysis.
HLA-II genotype
Donors were genotyped for HLA DR, DP, and DQ using next-generation sequencing (performed by Scisco Genetics). Briefly, HLA II typing was performed by multiplex PCR of HLA specific amplicons. Exon and flanking intron sequences from the HLA-encoding genes were amplified in 4 reactions, simultaneously tagged with index sequences (to distinguish samples), pooled, and sequenced. Supplementary Table 1 and Supplementary Figure 3 summarize HLA-II genotypes for donors tested. We used a random selection of donors per cohort, and HLA-II were genotyped post experiment.
Tested material
mcKLH (ImjectTM mcKLH; Thermo Fisher Scientific) was used as positive control and inclusion criteria for this assay. Evolocumab (NDC 55513–0750-01), alirocumab(NDC 00024–5902-02), infliximab (NDC 57894–0030-01), adalimumab (NDC 00074–3799-02), and etanercept (NDC 58406–0455-04) clinical grade therapeutics were purchased from fisher clinical services. ATR-107 was purchased from Absolute Antibody Ltd (catalog number AB01293-10.0, Boston, USA). Bococizumab, HuA33, ixekizumab, and secukinumab were manufactured based on sequence published in Drugbank from engineered Chinese hamster ovary (CHO) cell lines at Genentech. Bevacizumab, trastuzumab, and pertuzumab were produced from CHO cell lines at Genentech. Anti-IL13/IL17 was produced in E. coli at Genentech.
In vitro T cell proliferation assay
PBMCs were prepared, cultured, and exposed to the biotherapeutics using the same method described for the T cell activation assay. Cell plates were placed in a 5% CO2 incubator at 37°C for 7 days. After incubation, the cells were washed and stained with viability dye (Thermo Fisher) and CD4 (clone SK3). The cells were fixed and permeabilized with ethanol and stained with anti-Ki67 for 30 minutes at room temperature. The cells were analyzed by FACS Canto II (BD Inc.; Franklin Lakes, NJ), and FACS plots were analyzed using FlowJo FACS analysis software (Tree Star, Inc.; Ashland, OR).
HLA-pan blocking
PBMCs (2 × 10⁶ cell/mL) were incubated in the presence of 100 μg/ml anti-HLA-pan antibody (IVA12) for 42–48 h at 37°C with or without the presence of bococizumab.
Statistical analysis
The threshold for determining positive donors, that is donors that produced an increase in CD137 or CD134 or both in response to a biotherapeutic, in the assay was based on the data shown in . We established a “tolerance interval,” containing 90% of the data for the low-immunogenic drug (bevacizumab) in 95% of repeated experiments (standard definition of a 90/95 tolerance interval). We used the assumption that the data is approximately normally distributed. The upper limit of 90/95 tolerance interval gave us an SI of 1.8 as the threshold for defining a low-immunogenic sample. The number of observed values above the threshold follows a binomial distribution with a success probability approximately equal to 10%, which was used to determine p-values. For example, the number of positives in an experiment with 40 donors has a binomial distribution (number, probability) with success probability p = 10% and n = 40 under the assumption of “no immunogenicity.”
To allow for the comparison of discriminatory ability of the activation and proliferation assay, we used ROC curves for the discrimination of bevacizumab and bococizumab. The AUC provides a measurement of performance across all possible thresholds.
Disclosure of potential conflicts of interest
No potential conflicts of interest were disclosed.
List of abbreviations
| ADA | = | Anti-drug antibody |
| APCs | = | Antigen-presenting cells |
| AUC | = | Area under the curve |
| CHO | = | Chinese hamster ovary |
| HLA | = | Human leukocyte antigen |
| IgG | = | Immunoglobulin G |
| IL | = | Interleukin |
| KLH | = | Keyhole limpet hemocyanin |
| MAPPs | = | Major histocompatibility complex associated peptide proteomics |
| ns | = | Non-significant |
| PBMCs | = | Peripheral blood mononuclear cells |
| PCSK9 | = | Proprotein convertase subtilisin kexin type 9 |
| ROC | = | Receiver operating characteristic |
| SI | = | Stimulation index |
| TCR | = | T cell receptor |
| TNF | = | Tumor necrosis factor |
| TNFRSF | = | Tumor necrosis factor receptor superfamily |
Supplemental Material
Download Zip (1.8 MB)Acknowledgments
The authors would like to thank Patricia Y. Siguenza for her support of the project and colleagues at the Department of Protein Analytical Chemistry, the Core Biophysical Characterization and Reagent Facility, and the Critical Reagents System for providing critical reagents. Additionally, we thank Nancy R. Gough (BioSerendipity, LLC) and anshin biosolutions for editorial assistance.
Supplementary material
Supplemental data for this article can be accessed on the publisher’s website.
References
- Pratt KP. Anti-drug antibodies: emerging approaches to predict, reduce or reverse biotherapeutic immunogenicity. Antibodies. 2018;7:19. doi:10.3390/antib7020019.
- Ratanji KD, Derrick JP, Dearman RJ, Kimber I. Immunogenicity of therapeutic proteins: influence of aggregation. J Immunotoxicol. 2014;11:99–11. doi:10.3109/1547691X.2013.821564.
- Singh SK. Impact of product-related factors on immunogenicity of biotherapeutics. J Pharm Sci. 2011;100:354–87.
- Talotta R, Rucci F, Canti G, Scaglione F. Pros and cons of the immunogenicity of monoclonal antibodies in cancer treatment: a lesson from autoimmune diseases. Immunotherapy. 2019;11:241–54.
- Ridker PM, Tardif J-C, Amarenco P, Duggan W, Glynn RJ, Jukema JW, Kastelein JJ, Kim AM, Koenig W, Nissen S, et al. Lipid-reduction variability and antidrug-antibody formation with bococizumab. New Eng Journal Med. 2017;376:1517–26.
- Hamuro L, Tirucherai GS, Crawford SM, Nayeem A, Pillutla RC, DeSilva BS, Leil TA, Thalhauser CJ. Evaluating a multiscale mechanistic model of the immune system to predict human immunogenicity for a biotherapeutic in phase 1. Aaps J. 2019;21:94. doi:10.1208/s12248-019-0361-7.
- Vandivort TC, Horton DB, Johnson SB. Regulatory and strategic considerations for addressing immunogenicity and related responses in biopharmaceutical development programs. J Clin Transl Sci. 2020 Dec;4(6):547-55.
- Duke BR, Mitra-Kaushik S. Current in vitro assays for prediction of T cell mediated immunogenicity of biotherapeutics and manufacturing impurities. J Pharm Innov. 2020;15:202–18. doi:10.1007/s12247-019-09412-5.
- Groell F, Jordan O, Borchard G. In vitro models for immunogenicity prediction of therapeutic proteins. Eur J Pharm Biopharm. 2018;130:128–42. doi:10.1016/j.ejpb.2018.06.008.
- Joubert MK, Deshpande M, Yang J, Reynolds H, Bryson C, Fogg M, Baker MP, Herskovitz J, Goletz TJ, Zhou L, et al. Use of in vitro assays to assess immunogenicity risk of antibody-based biotherapeutics. PloS One. 2016;11(8):e0159328. doi:10.1371/journal.pone.0159328.
- Spindeldreher S, Maillère B, Correia E, Tenon M, Karle A, Jarvis P, Kolbinger F. Secukinumab demonstrates significantly lower immunogenicity potential compared to ixekizumab. Dermatol Ther (Heidelb). 2018;8(1):57–68. doi:10.1007/s13555-018-0220-y.
- Messele T, Roos MT, Hamann D, Koot M, Fontanet AL, Miedema F, Schellekens PTA, Rinke De Wit TF. Nonradioactive techniques for measurement of in vitro T-cell proliferation: alternatives to the [3H]Thymidine incorporation assay. Clinical Diagnostic Laboratory Immunology. 2000;7(4):687–92. doi:10.1128/CDLI.7.4.687-692.2000.
- Ito S, Ikuno T, Mishima M, Yano M, Hara T, Kuramochi T, Sampei Z, Wakabayashi T, Tabo M, Chiba S, et al. In vitro human helper T-cell assay to screen antibody drug candidates for immunogenicity. J Immunotoxicol. 2019;16(1):125–32. doi:10.1080/1547691X.2019.1604586.
- Walsh RE, Lannan M, Wen Y, Wang X, Moreland CA, Willency J, Knierman MD, Spindler L, Liu L, Zeng W, et al. Post-hoc assessment of the immunogenicity of three antibodies reveals distinct immune stimulatory mechanisms. mAbs. 2020;12(1):1764829. Taylor & Francis. doi:10.1080/19420862.2020.1764829.
- Jawa V, Terry F, Gokemeijer J, Mitra-Kaushik S, Roberts BJ, Tourdot S, De Groot AS. T-cell dependent immunogenicity of protein therapeutics pre-clinical assessment and mitigation–updated consensus and review 2020. Front Immunol. 2020;11. doi:10.3389/fimmu.2020.01301.
- Rosenberg AS, Sauna ZE. Immunogenicity assessment during the development of protein therapeutics. J Pharm Pharmacol. 2018;70:584–94. doi:10.1111/jphp.12810.
- Sansom D. CD28, CTLA-4 and their ligands: who does what and to whom? Immunology. 2000;101:169. doi:10.1046/j.1365-2567.2000.00121.x.
- Gonzalez LC, Loyet KM, Calemine-Fenaux J, Chauhan V, Wranik B, Ouyang W, Eaton DL. A coreceptor interaction between the CD28 and TNF receptor family members B and T lymphocyte attenuator and herpesvirus entry mediator. Proc Natl Acad Sci USA. 2005;102(4):1116–21. doi:10.1073/pnas.0409071102.
- Seddiki N, Santner-Nanan B, Martinson J, Zaunders J, Sasson S, Landay A, Solomon M, Selby W, Alexander SI, Nanan R, et al. Expression of interleukin (IL)-2 and IL-7 receptors discriminates between human regulatory and activated T cells. J Exp Med. 2006;203(7):1693–700. doi:10.1084/jem.20060468.
- Wolfl M, Kuball J, Ho WY, Nguyen H, Manley TJ, Bleakley M, Greenberg PD. Activation-induced expression of CD137 permits detection, isolation, and expansion of the full repertoire of CD8+ T cells responding to antigen without requiring knowledge of epitope specificities. Blood J Am Soc Hematol. 2007;110:201–10.
- Zaunders JJ, Munier ML, Seddiki N, Pett S, Ip S, Bailey M, Xu Y, Brown K, Dyer WB, Kim M, et al. High levels of human antigen-specific CD4+ CD4+ T cells in peripheral blood revealed by stimulated coexpression of CD25 and CD134 (OX40). J Immunol. 2009;183(4):2827–36. doi:10.4049/jimmunol.0803548.
- Shuford WW, Klussman K, Tritchler DD, Loo DT, Chalupny J, Siadak AW, Brown TJ, Emswiler J, Raecho H, Larsen CP, et al. 4-1BB costimulatory signals preferentially induce CD8+ T cell proliferation and lead to the amplification in vivo of cytotoxic T cell responses. J Exp Med. 1997;186:47–55. doi:10.1084/jem.186.1.47.
- Qui HZ, Hagymasi AT, Bandyopadhyay S, Rose M-CS, Ramanarasimhaiah R, Ménoret A, Mittler RS, Gordon SM, Reiner SL, Vella AT, et al. CD134 plus CD137 dual costimulation induces Eomesodermin in CD4 T cells to program cytotoxic Th1 differentiation. J Immunol. 2011;187(7):3555–64. doi:10.4049/jimmunol.1101244.
- Taraban VY, Rowley TF, O’Brien L, Chan HC, Haswell LE, Green MH, Tutt A, Glennie M, Al-Shamkhani A. Expression and costimulatory effects of the TNF receptor superfamily members CD134 (OX40) and CD137 (4-1BB), and their role in the generation of anti-tumor immune responses. Eur J Immunol. 2002;32(12):3617–27. doi:10.1002/1521-4141(200212)32:12<3617::AID-IMMU3617>3.0.CO;2-M.
- Welt S, Ritter G, Williams C, Cohen LS, John M, Jungbluth A, Richards EA, Old LJ, Kemeny NE. Phase I study of anticolon cancer humanized antibody A33. Clin Cancer Res. 2003;9:1338–46.
- Baruch A, Luca D, Kahn RS, Cowan KJ, Leabman M, Budha NR, Chiu CPC, Wu Y, Kirchhofer D, Peterson A, et al. A phase 1 study to evaluate the safety and LDL cholesterol–lowering effects of RG7652, a fully human monoclonal antibody against proprotein convertase subtilisin/kexin type 9. Clin Cardiol. 2017;40:503–11. doi:10.1002/clc.22687.
- Zubler RH. Naive and memory B cells in T-cell-dependent and T-independent responses. Springer seminars in immunopathology. 2001;23(4):405-419.
- Bano N, McKelvey T, Spear N, Yang T-Y, Shankar G, Schantz A. Analysis of regulatory guidance on antidrug antibody testing for therapeutic protein products. Bioanalysis. 2019;11:2283–96. doi:10.4155/bio-2019-0241.
- Dingman R, Balu-Iyer SV. Immunogenicity of protein pharmaceuticals. J Pharm Sci. 2019;108:1637–54.
- Hua F, Comer GM, Stockert L, Jin B, Nowak J, Pleasic‐Williams S, Wunderlich D, Cheng J, Beebe JS. Anti‐IL21 receptor monoclonal antibody (ATR‐107): safety, pharmacokinetics, and pharmacodynamic evaluation in healthy volunteers: a phase I, first‐in‐human study. J Clin Pharmacol. 2014;54:14–22. doi:10.1002/jcph.158.
- Staton TL, Peng K, Owen R, Choy DF, Cabanski CR, Fong A, Brunstein F, Alatsis KR, Chen H. A phase I, randomized, observer-blinded, single and multiple ascending-dose study to investigate the safety, pharmacokinetics, and immunogenicity of BITS7201A, a bispecific antibody targeting IL-13 and IL-17, in healthy volunteers. Pulmonary Med BMC. 2019;19:5. doi:10.1186/s12890-018-0763-9.
- Povoleri GA, Lalnunhlimi S, Steel KJ, Agrawal S, O’Byrne AM, Ridley M, Kordasti S, Frederiksen KS, Roberts CA, Taams LS, et al. Anti‐TNF treatment negatively regulates human CD4+ T‐cell CD4+ T-cell activation and maturation in vitro, but does not confer an anergic or suppressive phenotype. Eur J Immunol. 2020;50:445–58. doi:10.1002/eji.201948190.
- Agency EM. Guideline on immunogenicity assessment of therapeutic proteins. Committee for Medicinal Products for Human Use (CHMP) London, UK, 2017.
- Delluc S, Ravot G, Maillere B. Quantitative analysis of the CD4 T‐cell repertoire specific to therapeutic antibodies in healthy donors. Faseb J. 2011;25:2040–48. doi:10.1096/fj.10-173872.
- Schultz HS, Reedtz-Runge SL, Bäckström BT, Lamberth K, Pedersen CR, Kvarnhammar AM, Akatsuka Y. Quantitative analysis of the CD4+ T cell response to therapeutic antibodies in healthy donors using a novel T cell: PBMC assay. PLoS One. 2017;12:e0178544. doi:10.1371/journal.pone.0178544.
- Gramaglia I, Jember A, Pippig SD, Weinberg AD, Killeen N, Croft M. The OX40 costimulatory receptor determines the development of CD4 memory by regulating primary clonal expansion. J Immunol. 2000;165:3043–50. doi:10.4049/jimmunol.165.6.3043.
- Pollok KE, Kim Y-J, Zhou Z, Hurtado J, Kim K, Pickard R, Kwon BS. Inducible T cell antigen 4-1BB. Analysis of expression and function. J Immunol. 1993;150:771–81.
- De Groot AS, Scott DW. Immunogenicity of protein therapeutics. Trends Immunol. 2007;28(11):482–90. doi:10.1016/j.it.2007.07.011.
- McGill JR, Yogurtcu ON, Verthelyi D, Yang H, Sauna ZE. SampPick: selection of a cohort of subjects matching a population HLA distribution. Front Immunol. 2019;10:2894. doi:10.3389/fimmu.2019.02894.
- Grundström J, Linton L, Thunberg S, Forsslund H, Janczewska I, Befrits R, Van Hage M, Gafvelin G, Eberhardson M. Altered immunoregulatory profile during anti‐tumour necrosis factor treatment of patients with inflammatory bowel disease. Clin Exp Immunol. 2012;169:137–47. doi:10.1111/j.1365-2249.2012.04600.x.
- Fu K, March K, Alexaki A, Fabozzi G, Moysi E, Petrovas C. Immunogenicity of protein therapeutics: a lymph node perspective. Front Immunol. 2020;11. doi:10.3389/fimmu.2020.00791.
- Lu Y, Khawli LA, Purushothama S, Theil F-P, Partridge MA. Recent advances in assessing immunogenicity of therapeutic proteins: impact on biotherapeutic development. J Immunol Res. 2016;2016. doi:10.1155/2016/8141269.
- Wen Y, Cahya S, Zeng W, Lin J, Wang X, Liu L, Malherbe L, Siegel R, Ferrante A, Kaliyaperumal A. Development of a FRET-based assay for analysis of mAbs internalization and processing by dendritic cells in preclinical immunogenicity risk assessment. Aaps J. 2020;22:1–13.
- Quarmby V, Phung QT, Lill JR. MAPPs for the identification of immunogenic hotspots of biotherapeutics; an overview of the technology and its application to the biopharmaceutical arena. Expert Rev Proteomics. 2018;15:733–48. doi:10.1080/14789450.2018.1521279.