
ABSTRACT
Monoclonal antibodies (mAbs) are the basis of treatments and diagnostics for pathogens and other biological phenomena. We conducted a structural characterization of mAbs against the N-terminal domain of nucleocapsid protein (NPNTD) from SARS-CoV-2 using small-angle X-ray scattering and transmission electron microscopy. Our solution-based results distinguished the mAbs’ flexibility and how this flexibility affects the assembly of multiple mAbs on an antigen. By pairing two mAbs that bind different epitopes on the NPNTD, we show that flexible mAbs form a closed sandwich-like complex. With rigid mAbs, a juxtaposition of the antigen-binding fragments is prevented, enforcing a linear arrangement of the mAb pair, which facilitates further mAb polymerization. In a modified sandwich enzyme-linked immunosorbent assay, we show that rigid mAb-pairings with linear polymerization led to increased NPNTD detection sensitivity. These enhancements can expedite the development of more sensitive and selective antigen-detecting point-of-care lateral flow devices, which are critical for early diagnosis and epidemiological studies of SARS-CoV-2 and other pathogens.
Introduction
SARS-CoV-2 nucleocapsid proteins (NP) are critical for incorporating and packaging viral genomic RNA into mature virions. In infected cells, NPs are produced in large amounts from subgenomic mRNA and are present at the replication-transcription complexes (RTCs), the sites of RNA synthesis. The NP gene is relatively conserved, with a sequence identity of 91% and 50% to SARS-CoV and MERS-CoV, respectively, and is rather stable, as it acquires few mutations over time.Citation1,Citation2 Although the NP from SARS-CoV-2 is abundant and highly immunogenic,Citation3–5 most SARS-CoV-2 detection assays use different spike protein regions as the antigen in immunoassays. This is mainly because antibodies against the spike protein are believed to be less cross-reactiveCitation6 and are expected to correlate better with neutralizing capacity.Citation7 Testing for serum antibodies against NP from SARS-CoV-2 was suggested to increase diagnostic capacity.Citation4,Citation8,Citation9 However, serological assays cannot achieve diagnosis early in the onset of an infection because seroconversion occurs after 7–10 days in patients.Citation3,Citation4,Citation10
Direct detection of viral proteins, often referred to as antigen-based detection, is more sensitive than serology assays in the case of SARS-CoV.Citation11 Antigen-based detection is amenable to use in rapid point-of-care lateral flow assays (LFA), which is another advantage. Thus far, antigen-based LFAs are significantly less sensitive than gold-standard RT-PCR, but may approach RT-PCR’s clinical sensitivity with further research and development. The choice of antigen, mAbs, and LFA protocols remains to be fully optimized for SARS-CoV-2.
The abundance and structure of NP in each virion provide a detection advantage over other antigen targets. NP is a 422 amino acid, 46 kDa phosphoprotein composed of two domains linked via a Ser/Arg rich linker with a short C-terminal region. NP dimerizes through its C-terminal domain (CTD).Citation12 The N-terminal domain (NPNTD) is exposed and interacts with RNA. The independent NPNTD and CTD domains do not have stable tertiary contacts in the absence of RNA.Citation12,Citation13 In the presence of RNA, NPNTD and CTD form a single bipartite RNA interaction site, which constitutes the basic building block of the nucleocapsid of SARS-CoV-2.Citation14,Citation15 Abundance, stability,Citation12 and location at the surface of higher-order ribonucleoprotein assembly on RNACitation15,Citation16 make NPNTD a viable antigen for the selection of highly specific mAbs for functional assays. NP is one of the early diagnostic markers in SARS-CoV-2,Citation17 and it has been detected 1 day before the onset of clinical symptoms in SARS infections.Citation18 Diagnostic fluorescence LFA immunoassays have been developed to detect SARS-Cov-2 NP protein in nasopharyngeal and nasal swab specimens.Citation19,Citation20
LFA protocols could take advantage of agglutination, a process in which antibodies mediate antigen-dependent aggregation into large particles.Citation21 The nature of the particles is influenced by antigen valency, enhancing antigen-antibody complex formation.Citation22,Citation23 Agglutination is also a factor when pairs of mAbs are used. LFAs that rely on a pair of mAbs that interact with different epitopes on an antigen have improved LFA sensitivity and specificity.Citation24 MAb-NP agglutination can serve to enhance the antigen-based detection limits against NP.
IgG flexibility, its importance in improving mAb recognition, and its influence on agglutination have remained uncharacterized. Although there have been several attempts by cryo-electron tomographyCitation25–28 and negative stain (NS) electron tomography,Citation29 large-scale flexibility measurements are often not amenable to single-particle techniques. In contrast, the resolution of small-angle X-ray scattering (SAXS) is sufficient, especially when atomic structures of individual components are available, to determine the conformational variability of the antigen-binding fragments (Fabs) in various antibodies,Citation30 including complexes with antigens or Fc-gamma receptors (FcγRs).Citation31,Citation32 A previous study showed that the Fabs’ conformational flexibility is derived from the inherent plasticity of the Fc-hinge regions in solution.Citation33 Rigidity of the hinges inversely correlates with, and can modulate mAb agonistic potency,Citation34,Citation35 and this highlights the importance of newer strategies to modulate antibody-agglutination.Citation36
Here, we used SAXS and other biophysical techniques to structurally characterize mAbs that specifically bind the minimal NPNTD region from a pool of nine commercial mAbs raised against full-length NP. We correlated the observed flexibilities with super-structures formed when mAb pairs bind NPNTD. Our structural insights have general implications for all antigen–antibody interactions. Simultaneously, the novel enzyme-linked immunosorbent assay (ELISA) protocol described here is intended to expedite the development of sensitive and selective antigen detecting LFAs, which could be applied in early diagnosis and epidemiological studies of SARS-CoV-2.
Results
mAbs against nucleocapsid N-terminal domain (NPNTD)
We used an integrative approach by size-exclusion chromatography (SEC) coupled with SAXS and multi-angle light scattering (SEC-MALS-SAXS) to find mAbs that selectively bind minimal NPNTD. SEC-MALS-SAXS experiments show that, from the pool of nine commercial mAbs raised against full-length NP, four antibodies (mAb1, mAb2, mAb4, and mAb8) bind NPNTD. The SEC signal shifts with an increase in molecular weight (MW) (, ), which shows that mAb1, mAb2, mAb4, and mAb8 form complexes with the NPNTD in a 1:2 molar ratio. Additionally, the radius of gyration (Rg) values distinguishes binder from non-binders (, ). Final merged SAXS profiles for the corresponding SEC peak (Supplemental Figure 1) were used to calculate pair-distribution functions (P(r)).
Table 1. SAXS, MALS, and SPR experimental parameters
Figure 1. SEC-MALS-SAXS identifies mAbs that bind to NPNTD. (a) SEC-MALS-SAXS chromatograms for free and NPNTD bind mAb1, 2, and 4 (green, blue and red lines). Chromatogram for mAb5 + NPNTD (gray) sample is included for comparison to a no-binder. Solid lines represent the light scattering signal in arbitrary units, while symbols represent molecular mass (top) calculated from MALS and Rg values (bottom) for each collected SAXS frame versus elution time. (b) P(r) functions calculated for the experimental SAXS curves for all tested mAb + NPNTD samples (colored as indicated). The P(r) functions are normalized at the maxima. The experimental P(r) function for NPNTD alone is shown for the comparison and normalized relative to the MW estimated by SAXS.Citation37 Inset: Experimental Rg values determined by Guinier plot for the experimental SAXS curves of mAb+NPNTD mixtures (solid dots) and mAb1, 2, and 4 (circles) indicate binder and no-binder. Experimental SAXS curves for mAbs + NPNTD and free mAb1, 2, and 4 are shown in Supplemental Figure 1 and Figure 2B, respectively
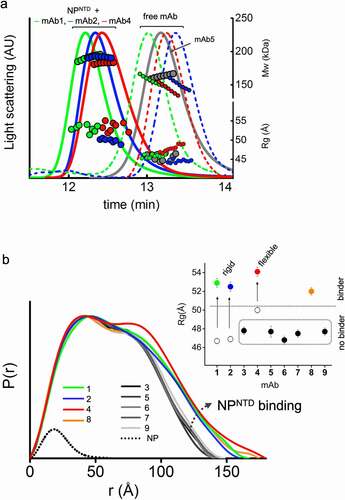
MAb binding of antigen is clearly distinguished by broad P(r) functions relative to those that remain unbound. The P(r) shape further provides information on the overall arrangement of mAb-antigen complexes (), which can be linked to the Fab’s flexibility (). The first peaks in the P(r) function at r ~ 40 Å arise from the approximate repeated distances across the Fc or Fab regions’ length and breadth. The P(r) shoulder at r ~ 80 Å reflects the inter-domain distances between the Fc and Fab regions. Simultaneously, the divide between P(r) peak and shoulder reflects the Fabs’ distancing, which correlates with the extended conformers’ occupancy in solution.Citation31 The P(r) features and experimental Rg values () allowed us to rank the inherent flexibility of mAbs, with mAb2 adopting the least and mAb4 the most extended states.
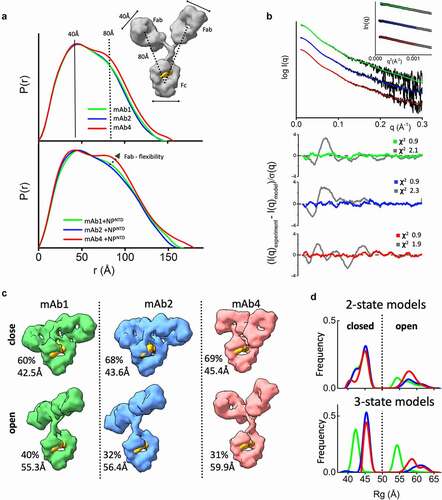
Figure 2. The flexibility of the NPNTD-binding mAbs. (a) P(r) functions for free mAb 1, 2, and 4 (top) and their complexes with the NPNTD normalized onto their maxima. The P(r) shoulder at r ~ 80 Å indicates the Fab-Fc separation described within the atomic model of IgG1 (inset). P(r) peak at 40 Å corresponds to the average size across Fc or Fab regions. (b) Experimental SAXS profiles of free mAbs 1, 2, and 4 (black) and theoretical SAXS profiles calculated from their respective two-state atomistic models (green, blue, and red) are shown in the panel. Residuals (Experiment/Model) for the fits of two-state models (green, blue, and red) are shown together with the best single model (gray) and indicate that the two-state model is required to match the experimental SAXS curves. (c) Two-state models for free mAb 1, 2, and 4 are shown together with the corresponding weights in % and Rg values. The Rg values and weights of mAb4 further confirm a larger separation between the Fc and Fab region. The atomistic models are shown as molecular envelopes at 10 Å resolution. The glycan-moiety in the Fc region is colored yellow. (d) The Rg distributions of the top 300 selected multistate models are shown for two-state (top panel) and three-state models (bottom panel) of free mAb 1, 2, and 4 (green, blue, and red)
mAbs with distinct flexibility of the Fab domains
Interpretation of SAXS and P(r) functions is further enhanced by available atomic models of mAbs. While the crystal structure of intact human IgG1 antibody (PDBID:1HZH) does not fit the SAXS data, it forms the basis for creating an ensemble of conformations. We used the program BILBOMDCitation38 to explore the Fab regions’ conformational space relative to the Fc. BILBOMD performs minimal molecular dynamics (MD) simulations on the Fc-hinge regions at very high temperature, where the additional kinetic energy prevents the Fabs from becoming trapped in a local minimum. This conformational sampling provides a pool of atomistic models (>10,000) from which SAXS curves are calculatedCitation39 and compared to the experimental curve. MultiFoXS algorithmCitation40 is used to identify the weighting of multistate models that fit the experimental data.
At least two distinct conformations are required to fit the SAXS data measured for the three mAbs that bind antigen (mAb 1, 2, and 4). A single conformation from BILBOMD failed to adequately match our measured SAXS profiles with poor goodness-of-fit (χ2 2.1, 2.3 and 1.9) (). For each mAb, we found significant improvement in the SAXS fit by selections of two-state models with similar goodness-of-fit for all three mAbs (χ2 0.9) ( and c). At the same time, the three-state models do not improve the SAXS fit (χ2 0.9). To estimate the number of conformational states in solution, we examined the Rg distributionCitation41 for the top 300 selected multistate models. The Rg distribution of the two-state models () has two peaks: one corresponding to closed conformations at 43–46 Å and the other corresponding to open conformations at 53–65 Å. For three-state models (), the Rg distribution also has two peaks, suggesting that mAbs adopt two states in solution, a closed conformation and flexible-open conformation. The area under the Rg-distribution curve indicates a higher population of mAb4-open conformers, whereas the shift in peaks suggests a superior rigidity of mAb1. For a better representation of the conformational space that the mAbs occupy, the top selected two-state model is shown in for each of the mAbs that bind antigen. MAb-binders (mAb 1, 2, and 4) show differences in conformational variability between the two-states. Both mAb4 open and closed conformers show significant separation between the Fc and Fab regions () relative to those found to fit data from the other two mAbs. This difference provides further insight into the prominent P(r) shoulder observed for mAb4 ().
The same feature, indicating additional mAb4 flexibility, is observed in the P(r) functions when NPNTD is present (). A more distinct separation of the P(r) shoulder in the mAb4-NPNTD complex and free state ( bottom) indicates a larger distancing of Fab from Fc. On the other hand, smaller P(r) shoulders () together with reduced experimental Rg values () of the mAb1-NPNTD and mAb2-NPNTD complexes correlate with the P(r) shapes of free mAb1 and mAb2, which suggests rigidity of the antibodies. Comparable Fab-flexibility between free and NPNTD-bound states agrees with previous MD simulations showing only minor allosteric communication between Fab and Fc domains upon antigen binding.Citation42
Fab flexibility correlates with a sandwich or linear pairing of mAbs
MAb pairs that simultaneously bind the same NPNTD through different epitopes are also readily distinguished from pairs that compete for the same epitope by SEC-MALS-SAXS. Based on the SEC elution profile and the MALS-determined MW across the SEC peak, we show that the NPNTD does not bridge mAb1 and 4 (). Thus, mAb1 and 4 compete for binding to NPNTD. In contrast, higher mass species were formed by mixing mAb2-NPNTD with either mAb1 or mAb 4, showing that mAb1-2 or mAb2-4 are pairing through simultaneous binding with NPNTD at different epitopes (). Control experiments show that neither mAb1-2 nor mAb2-4 mixtures form larger complexes in the absence of NPNTD (Supplementary Figure 2).
Figure 3. MAb linear or sandwich pairing depends on inherent flexibility. (a) SEC-MALS-SAXS chromatograms for the mAb1-2-NPNTD (green), mAb2-4-NPNTD (red) and mAb1-4-NPNTD (gray) samples. Solid lines represent the UV 280 nm signal in arbitrary units, while symbols represent molecular mass (top) calculated from MALS and Rg values (bottom) for each collected SAXS frame versus elution time. (b) P(r) functions calculated for the experimental SAXS curves for the main SEC peak of mAb1-2-NPNTD (green), mAb2-4-NPNTD (red), mAb1-4-NPNTD (gray), and early SEC shoulder of mAb1-2-NPNTD (green dots). The P(r) functions are normalized at the r = 40 Å. The P(r)-maxima peaks are indicated. Experimental SAXS and Guinier plots are shown in Supplemental Figure 1. (c) Average SAXS envelopes obtained for mAb2-4-NPNTD, mAb1-2-NPNTD complexes were calculated using a P2 symmetry operator. Average SAXS envelopes calculated using a P1 symmetry operator are shown in Supplemental Figure 3. A single representative envelope was manually superimposed with compact conformers of mAb1 (red), mAb2 (blue), and mAb4 (green) taken from the two-state model of free mAbs (see ). The structure of NPNTD (magenta; PDB ID: 6VYO) was manually docked at the proximity of the CRD3 -Fab region. Additionally, the SAXS envelope obtained for the larger multimer of mAb1-2-NPNTD determined in P1 symmetry is shown
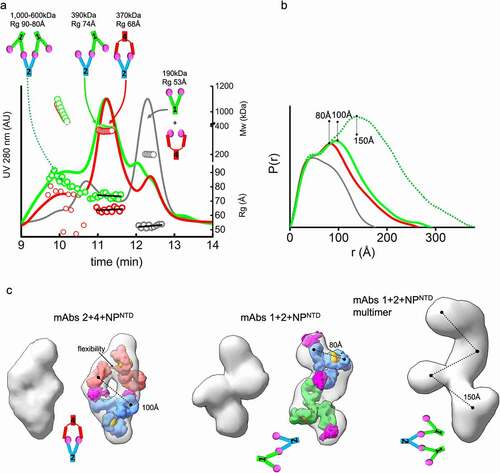
Each mAb pair binds NPNTD in different stoichiometries and orientations. Mass by MALS and SAXS from the main elution peak show that the complex formed by mAbs1-2 is ~390 kDa, while the mAbs2-4 is ~370 kDa, which corresponds to two antibodies bound by three or two NPNTD molecules, respectively. Also, the orientation of binding between the pairs is very different. The Rg of mAb1-2-NPNTD is 74 Å relative to the 68 Å measured for mAb2-4-NPNTD (, bottom right axis). Furthermore, Rg changes are accompanied by a shift in the secondary peak in the P(r) distribution (100 Å vs. 80 Å). To gain insights into the structures these mAb pairs form, we reconstructed SAXS envelopes for both mAb1-2-NPNTD and mAb2-4-NPNTD. The envelopes for mAb2-4-NPNTD show a sandwich-like assembly with a hollow feature in the center of the model, whereas the mAb1-2-NPNTD adopts a linear arrangement.
We manually superimposed the SAXS envelopes with their corresponding mAb-atomistic models to approximate the overall arrangement of mAb-pairs. The sandwich-like arrangement of mAb2-4-NPNTD matches the SAXS envelope and shows two antigens bound between two Fabs. The SAXS envelope of mAb1-2-NPNTD matches a linear arrangement of the antibodies where only one NPNTD is shared between mAb1-2 (). The shapes and models of the complexes provide insights into the P(r) distributions’ shifts.
We postulate that the difference in orientation fundamentally relies on differences in the flexibility of the mAbs. The mAb2-4 pair contains the flexible mAb4 and shows a closed and capped arrangement around two antigens. MAb4’s flexibility allows the Fabs to stretch to accommodate two NPNTD molecules’ binding located on the Fabs of mAb2. In contrast, the more rigid mAb1-Fab regions restrict the Fabs’ positioning onto the NPNTD located on the mAb2. Thus, the relative rigidity of both mAb2 and mAb1 enforces the linear arrangement of the mAb1-2-NPNTD complex.
The linear antibody-antigen arrangement of the mAb1-2-NPNTD complex should permit further networking of multiple mAbs through the uncovered epitopes of the NPNTD molecules bound to the outermost Fab regions. Indeed, there is a notable presence of very large complexes (~1 MDa) in the mAb1-2-NPNTD sample (), suggesting further elongation of the complex by extending the rigid linear arrangement ( and c). The mAb2-4-NPNTD also shows a small amount of very large complexes. However, the low SAXS signal () did not allow us to determine this species’ overall arrangement. These observations suggest that flexibility of mAbs is a factor in the agglutination of mAb – antigen complexes.
Sandwich and linear mAb-pairing observed by TEM
To further support our solution scattering results, we applied freshly prepared samples of either mAb1-2-NPNTD or mAb2-4-NPNTD to transmission electron microscopy (TEM) grids for TEM analysis (Materials and Methods; ). While both samples show that mAb-NPNTD pairs can form a sandwich arrangement, these are formed almost twice as readily in the more flexible mAb2-4-NPNTD (45%, ) compared to the more rigid mAb1-2-NPNTD (23%, ). Further, the flexible mAb2-4-NPNTD sandwich appears elongated or more ‘relaxed,’ while the more rigid mAb1-2-NPNTD sandwich appears circular and more ‘strained.’ There is a significant presence of single antibodies or single antibodies bound by NPNTD, which is evident to a lesser degree in the solution scattering ( – right complex peaks). However, the classification method, relying on the alignment of identical features, may overestimate the number of mAb monomers and underestimate the number of linear arrangements of the populations. A linear arrangement was only evident in the mAb1-2-NPNTD mixture, albeit at 8%. While these complexes clearly highlight differences in mAb pairing that agree with the solution scattering (), the samples were relatively dilute. Thus, we sought to image the complexes at a higher concentration with an extended incubation time (see Materials and Methods).
Figure 4. TEM 2D class averages highlight mAb-NPNTD pairing differences. Representative 2D class averages from NS-TEM data for mAb1-2-NPNTD (a), and mAb2-4-NPNTD (b). Scale bars are 10 nm
As shown in Supplementary Figure 4, it is immediately apparent that the higher concentration, longer incubation period samples have a significantly higher prevalence of the elongated sandwich arrangement for the flexible mAb2-4-NPNTD pair (Supplementary Figure 4B), at 28%, versus 6% for the more rigid mAb1-2-NPNTD pair (Supplementary Figure 4A). However, under these conditions there is little discernible difference in the percentage of extended linear arrangements (i.e., polymerized) in the mAb1-2-NPNTD sample (Supplementary Figure 4A) compared to the mAb2-4-NPNTD sample (Supplementary Figure 4B; 11% vs. 10%). Collectively, these TEM data support the solution scattering data, which demonstrate that a rigid antibody-antigen pairing has a higher propensity to form extended linear complexes, while a flexible antibody-antigen pairing facilitates the formation of sandwiched complexes.
SPR kinetic analysis revealed comparable picomolar affinities of all antibodies
To compare the relative affinity of each mAb for antigen, we performed binding kinetic assays. In addition, we performed assays on horseradish peroxidase (HRP)-conjugated mAbs in preparation for ELISAs, described below. Due to the high affinities of the mAbs, we opted to use a kinetic titration (single-cycle kinetics) strategy and avoid problematic regeneration steps (Materials and Methods). We measured the binding kinetics of mAb 1, 1-HRP, 2, 4, and 4-HRP by surface plasmon resonance (SPR) (Supplementary Figure 5). All antibodies (unconjugated and HRP-conjugated) had high-affinity constants (KD) in the picomolar range (Supplementary Table 1). The KD of HRP-conjugated mAb1 and 4 are very similar, at 11 and 28 pM, respectively. The percentage activity of the HRP-conjugated antibodies is lower than unconjugated, suggesting that conjugating HRP on the antibodies affects the percentage of available antibodies for interaction on the SPR sensor chip. The possibility exists that this effect could also be present in the chip-free solution-based ELISA. However, the high concentration of HRP-conjugated antibodies used (0.4 mg/mL; Methods), relative to the picomolar affinities, represents a large excess of functional, high-affinity HRP-conjugated antibodies in the ELISA. Therefore, the antibodies have comparable kinetics, effectively excluding them as explanations for functional outcomes.
A modified ELISA protocol “boosts” the signal of the linear mAb arrangement
We sought to assess the consequences of the observed mAb linear arrangement vs. sandwich pairing () on detection limits. Since mAb2 pairs with mAb1 and mAb4, we used mAb2 as the NPNTD capture antibody and conjugated HRP to mAb1 and mAb4 (1-HRP, 4-HRP) to serve as the detection antibodies. We hypothesized that the linear arrangement of mAb1-2-NPNTD could facilitate a higher ratio of detection-to-capture mAbs (two or more 1-HRP antibodies to capture mAb2) on the plate, leading to a boost in the signal. This would contrast with the sandwich pairing of mAb4, which closes off further binding and constrains assembly to a 1:1 ratio of 4-HRP to mAb2. To test this hypothesis, we developed a modified ELISA protocol.
To enhance detection, we modified the standard ELISA protocol. The two main differences between this and a standard ELISA are: 1) The detection HRP-conjugated mAbs are added directly on top of the samples during the incubation period that is typically used for the capture of the antigen only, and 2) Free (non-plate-bound) mAb2 is “spiked” into the detection HRP-conjugated mAb solutions before their addition on top of the samples. We rationalized that adding antigen simultaneously with the detection antibodies would initiate maximal polymerization and that “spiking” in mAb2 would further extend “networking” of the linear mAb1-2-NPNTD arrangement ( – middle/right panels) whereas, the sandwich pairing of mAb2-4-NPNTD does not allow the polymerization of antibodies ( – left panel).
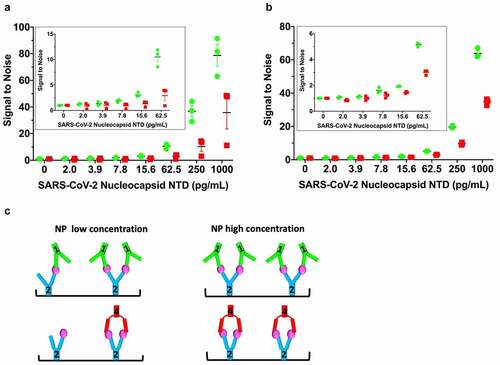
Following this protocol, we observed improvements in detection limits using mAb1-2-NPNTD relative to mAb2-4-NPNTD (). In the repeated experiments ( and b), the signal of 1-HRP is ~2-fold higher than 4-HRP, although the magnitude of the effect is diminished with decreasing concentration of antigen ( and b). The two independent experiments ( and b) each had a control experiment done in parallel on the same plate (Supplementary Figure 6A and B, respectively). The first control experiment follows the standard ELISA protocol, where the plate is washed prior to the addition of the mAb-HRP for a 20-min incubation (Supplementary Figure 6A). To control for the longer incubation time of the mAb-HRP with the samples in our modified ELISA protocol, we ran an additional control (Supplementary Figure 6B), where the mAb-HRP had a longer incubation time of 1.5 h. No “boost” of the 1-HRP signal over the 4-HRP level was seen in either control experiment (Supplementary Figure 6AB). Simultaneously, there was a general elevation of both signals in the control with the longer incubation time (Supplementary Figure 6B). These results collectively demonstrate the ability to capitalize on the linear-mAb arrangement functionally, which results from the structural rigidity of the antibodies ().
Figure 5. Linearly arranged mAbs show boosted signal in modified ELISA. (a) A modified ELISA where the detection HRP-conjugated mAbs (1-HRP in green, 4-HRP in red) are added directly on top of the samples during the NPNTD capture incubation period. Free (non-plate-bound) mAb2 is “spiked” into the detection HRP-conjugated mAb solutions before their addition on top of the samples. The corresponding standard control ELISA protocol run in parallel on the same plate is shown in Supplementary Figure 6A. (b) Repeat of the experiment conducted in (a), with a corresponding control ELISA protocol run in parallel on the same plate with a longer mAb-HRP-sample incubation period, shown in Supplementary Figure 6B. (c) Schematic of low versus high concentration of NPNTD in samples. In both experiments, the 1-HRP that forms the more rigid linear arrangement in the unconjugated form (mAb1-2-NPNTD) shows an ~2-fold increased ELISA signal, relative to 4-HRP, that forms a sandwich arrangement in the unconjugated form (mAb2-4-NPNTD). Each NPNTD concentration was run in triplicate, and the standard error of the mean for each is included
Further, we were interested in whether the structurally enforced functional “boost” effect could be maintained in the presence of a virion-disrupting detergent (Supplementary Figure 7) since NP is present inside virions. SARS-CoV-2 virions are not lysed adequately in the presence of 0.5% Tween-20, a detergent commonly used in ELISAs that is present in our protocol at a lower concentration, 0.05% (Methods), but are effectively lysed in the presence of 0.5% triton X-100.Citation43 Therefore, we used our same modified ELISA protocol that demonstrated the “boost” ( and b), except that we used phosphate-buffered saline (PBS) pH 7.4 plus 0.5% triton X-100 as the sample dilution buffer, instead of PBS pH 7.4 alone. The presence of triton X-100 reduced the “boost,” although it is still detectable (Supplementary Figure 7). Interestingly, the presence of triton X-100 appears to have increased the overall limit of detection (LOD) to lower than 0.4 pg/mL. In contrast, it is clearly not this low in the detergent’s absence (compare 0 and 2 pg/mL in and b with 0 and 1.7 pg/mL in Supplementary Figure 7). Further improvements could be gained to maximize both the “boost” and detergent effects. Together, these results suggest that combining our modified ELISA protocol with the presence of a SARS-CoV-2 virion lysing concentration of triton X-100 leads to a highly sensitive ELISA, with great potential for further diagnostic development.
Discussion
The ongoing SARS-CoV-2 pandemic has highlighted the need for sensitive point-of-care diagnostics (POCs), which are primarily antibody-based technologies.Citation44 Currently, mAbs are widely used to detect antigen molecules, including the nucleocapsid protein from SARS-CoV-2. The US Food and Drug Administration recently authorized a lateral flow antigen test as the first over-the-counter, fully at-home diagnostic test for the qualitative detection of SARS-CoV-2 nucleocapsid antigens.Citation45 However, there is an urgent need to improve the detection limit of these diagnostic devices that use various types of colorimetric mAb-based assays.Citation44
Multiple approaches, such as fluorescent immunoassays,Citation46–48 nanoparticle luminescence,Citation49,Citation50 or magnetic beads as the antibody support surface,Citation51 are used to enhance antigen detection. In immunoassays and RT-PCR, the detection is signaled through chemical conjugation to an enzyme or nanoparticle that drives a colorimetric reaction, a fluorophore, or another moiety. However, a limitation of existing immunoassays in detecting antigens relative to RT-PCR is the lack of exponential amplification of signal when probes detect an antigen. Immunoassays mainly rely on antibody-antigen binding at a 1:1 ratio. An immunoassay diagnostic with a greater detection-to-capture antibody ratio will also have a greater signal-to-antigen ratio, effectively enhancing overall specific antigen detection.
Despite the widespread use of antibodies in diagnostics and treatments, an understanding of structural properties that affect antibody–antigen interactions in their aqueous environment is currently insufficient to guide optimization for these purposes. Here, we describe how antibodies’ inherent flexibility leads to distinct antigen-binding arrangements that drive different functional outcomes in a SARS-CoV-2 detection ELISA. We show that we can rapidly assess new antibody–antigen interactions using SEC-MALS-SAXS to identify pairs that bind in a linear arrangement (), which results in a more sensitive detection assay (). A critical benefit of using the SEC-MALS-SAXS approach is its ease of use and the ability to study antibody-interactions in solution. It has previously been shown that other techniques that rely on grids (electron microscopy) or crystals often do not reflect the dynamic nature of antibodies in solution.Citation27 However, electron microscopy can be used to visualize the overall arrangement of larger mAb complexes. Indeed, our TEM experiment supports our solution-based models, demonstrating different pairing of mAbs with NPNTD. Interestingly, while both TEM and SEC-MALS-SAXS clearly demonstrate differences in pairing, the linear arrangements were better detected in the latter, highlighting the importance of assessing protein–protein interactions in their naturally dynamic solution states. Thus, these experiments further affirm the SEC-MALS-SAXS technique as a means to visualize mAb dynamicity and networking in an efficient way.
A central finding in this work is the observation and rationalization of how mAb flexibility can affect larger assemblies of more than one mAb with or without antigen. Many mAbs are abandoned as formulations despite a high affinity for their antigen because of a propensity to aggregate. SEC-MALS-SAXS is a rapid method that allows separation of larger-scale assemblies from single mAbs and, therefore, an interrogation of aggregation propensity based on the structural properties of the underlying single mAb. Further, SAXS provides the resolution to distinguish rigid and flexible mAbs in solution. Flexibility can arise not only from primary sequence differences but it may also occur due to glycosylation. This may have been a factor in our studies, as we used both mouse (mAb1, mAb2) and rabbit (mAb4) host antibodies.Citation52 In light of our results on the impact of flexibility, further studies to assess the effects of glycosylation may be worthwhile, as glycosylation can be adjusted.
Having identified two mAbs (mAb1 and mAb4) with differing degrees of flexibility () that can both bind SARS-CoV-2 NPNTD simultaneously with a third antibody mAb2, we were able to contrast the larger assemblies composed of mAb1-2 NPNTD versus mAb2-4 NPNTD (). Further analysis confirmed the existence of two different binding modes of antibody-antigen-antibody: sandwich, and linear (). The linear mode suggested further polymerization might be possible. This polymerization would be considered aggregation when interpreted by other methods. However, we sought to use this propensity to overcome the limitation on amplification inherent in antibody-based diagnostics.
Based on the above observations, we developed a modified ELISA. We used mAb2 as a common capture antibody and mAbs 1 and 4 as detection antibodies. We saw an increased signal for the mAb1-2 pairing relative to mAb2-4, where mAb1 and mAb4 were coupled to HRP, a common signal-generating enzyme used in ELISAs.Citation53 To control for changes in binding kinetics, we used SPR to demonstrate that the near-equivalent binding affinities for nucleocapsid are maintained after HRP-conjugation of the two antibodies. The modified ELISA that used the linearly arranged mAb1-2 pair consistently generated a larger signal than the sandwich mAb2-4 pair. Furthermore, the signal of 1-HRP is ~2-fold higher than 4-HRP, and the effect is diminished with decreasing concentration of antigen, which supports our hypothesis.
Having made gains in detection by considering the structural properties of mAbs, more optimization is likely possible. Introducing further rigidity in mAb2 through glycosylation modifications, binding factors like protein A or G, detergents, or other metabolites could enhance further networking and, therefore, detection. The positive signal line in LFAs is often generated by antibodies conjugated to colloidal gold or latex, which accumulate into pink or blue lines, respectively.Citation54 These are meant for visual inspection by non-experts in POC devices. A previous study demonstrated that the detection limit of an LFA could be lowered threefold, from 3.1 ng/mL to 0.9 ng/mL for detection of aflatoxin B2 in food, through non-covalently clustering (16 nm diameter) gold nanoparticles for a visual readout.Citation54 Thus, the clustering of signal molecules coupled to antigen-specific antibodies is a viable strategy for lowering the LOD in LFAs. Our study shows that this can be achieved without introducing an additional factor by taking advantage of the antibodies’ structural rigidity. A survey of commercial ELISAs suggests a common LOD of 100 pg/mL, with the most sensitive being 0.01 pg/mL for protein analytes.Citation55 Many antibodies have been identified against NP and other antigen targets from SARS-CoV-2. SEC-MALS-SAXS could be applied to hundreds of mAbs in a short amount of time to identify the most rigid. By combining this novel strategy with other optimization methods (e.g., tuning antibody affinities, selecting signaling molecule/moiety), the LOD of standard LFA POC devices could achieve as yet unattained sensitivity for current and future pathogens.
Materials and methods
Monoclonal antibody sources
Seven antibodies were purchased from SinoBiological, and two antibodies from CreativeBiolabs. The catalog numbers for the SinoBiological antibodies are as follows: #1: 40143-MM05, #2: 40143-MM08, #3: 40143-R001, #4: 40143-R004, #5: 40143-R019, #6: 40143-R040, #7: 40588-R0004. The catalog numbers for the CreativeBiolabs antibodies are as follows: #8: MRO-0015YJ, #9: MRO-0016YJ. Antibodies #1 and #4 were chemically conjugated to HRP by SinoBiological CRO Services. The molar HRP:Ab ratio was 2.81 for #1-HRP, and 3.5 for #4-HRP.
Expression and purification of NPNTD
Gene fragment coding of nucleocapsid protein from SARS-CoV-2 was codon-optimized for efficient expression in E. coli. The coding sequence of NPNTD comprising residues Asn47 to Ala173 (UniProtKB – P0DTC9) was synthesized and cloned into pMCSG53 vectorCitation56 by Twist Biosciences, USA. Cloning into pMCSG53 vector introduced to NPNTD, a His6-Tag at the N-terminus followed by a cleavage site for tobacco etch virus (TEV) protease. For NPNTD expression, the plasmid was transformed into E. coli BL21(DE3)-Gold cells (Stratagene) using heat-shock. After the transformation, bacterial cells were precultured overnight at 37 °C in 100 ml of LB Lennox medium supplemented with 40 mM K2HPO4 and 160 mg/L of ampicillin. Subsequently, 40 ml of overnight cultures was used to inoculate 4 L of LB with 40 mM K2HPO4 and 160 mg/L ampicillin. Next, the cells were incubated at 37 °C with 180 RPM shaking for approximately 3 h until reaching optical density at 600 nm equal to 1. Subsequently, the bacteria culture was cooled down for 1 h in an incubator set to 4 °C with 180 RPM shaking. Expression of NPNTD was induced with 0.2 mM isopropyl β-d-1-thiogalactopyranoside, supplemented with 0.1% glucose, and incubated overnight at 16 °C. Bacteria cells were harvested by centrifugation at 4 °C, 5000 RCF for 10 min. Cell pellets were resuspended in lysis buffer 50 mM HEPES pH 8.0, 500 mM NaCl, 5% v/v glycerol, 20 mM imidazole, and 10 mM β-mercaptoethanol (1 g of cells: 5 ml of lysis buffer) for purification or frozen and stored at −80 °C until purification.
After overexpression of NPNTD, bacteria cells were lysed by sonication on ice using 120 W output power for 5 minutes (4 sec pulses of sonication followed by 20 sec brakes). After sonication, samples were centrifuged to remove cellular debris (30k RCF, 4 °C, 1 h). We used a vacuum-assisted purification system to perform NPNTD purification with immobilized metal affinity chromatography (IMAC). Using 5 ml of Ni2+ Sepharose (GE Healthcare) loaded on a Flex-Column (420400–2510) attached to a Vac-Man vacuum system (Promega), beads were equilibrated in a lysis buffer. The cell lysate was loaded on the column, and Ni2+ Sepharose was washed using 20 column volumes of lysis buffer. For elution, the lysis buffer was supplemented with imidazole up to 500 mM (pH 8). After elution for removing 6His-Tag, we used TEV protease added in a molar ratio 1 TEV to 40 NPNTD. TEV cleavage leaves three residues SerAsnAla at the N-terminus of NPNTD. Next, NPNTD was concentrated using 10 kDa cutoff centrifugal protein concentrators (Merck-Millipore). Subsequently, we performed SEC of NPNTD using a Superdex S200 16/600 column attached to an Åkta Express (GE Healthcare) purification system. SEC was done at 4 °C in a buffer containing 20 mM HEPES, 500 mM NaCl, 5% v/v glycerol, 10 mM β-mercaptoethanol, pH 8.0. Purified fractions of NPNTD from the middle of the gel filtration elution peak were concentrated to 10.7 mg/ml. Protein was flash cooled using 40 μL aliquots dropped directly into liquid nitrogen. Samples were stored at −80 °C or on dry ice during shipment. Upon thawing, the samples were stored at 4 °C and diluted in PBS pH 7.4 for functional assays.
Size-exclusion chromatography coupled to small-angle X-ray scattering with multi-angle light scattering
For SEC-MALS-SAXS experiments, 60 μL of samples containing mAb ~1-3 mg/mL and NPNTD in 1:5 molar ratio was prepared in PBS pH 7.4 buffer. mAb 1, 2, and 4 were also measured in the absence of NPNTD using the same buffer conditions. The mAb pairs 1–2, 1–4, and 2–4 in the presence of NPNTD were prepared in the molar ratio of 1:1:10 in the same buffer conditions. All samples were incubated for a minimum of 30 minutes before the injection on SEC.
SEC-MALS-SAXS was collected at the SIBLYS beamline (BL 12.3.1) at the Advanced Light Source (ALS) at Lawrence Berkeley National Laboratory (LBNL) in Berkeley, California.Citation57 The x-ray wavelength was set at λ = 1.216 Å, and the sample-to-detector distance was 2070 mm, resulting in scattering vectors, q, ranging from 0.01 Å−1 to 0.4 Å−1. The scattering vector is defined as q = 4πsinθ/λ, where 2θ is the scattering angle. All the experiments were performed at 20 °C, and data were processed as previously described.Citation58 Briefly, a SAXS flow cell was coupled with an inline Agilent 1290 Infinity HPLC system using a Shodex KW 803 column. The column was equilibrated with a running buffer (PBS pH 7.4) with a 0.65 mL/min flow rate. 55 µL of each sample was run through the SEC, and two second X-ray exposures were collected continuously during a 20 min elution. The SAXS frames recorded before the protein elution peak were used to subtract all other frames. The subtracted frames were investigated by the radius of gyration (Rg) derived by the Guinier approximation I(q) = I(0) exp(-q2*Rg*2/3) with the limits q*Rg<1.5. The elution peak was mapped by comparing integral ratios to background and Rg relative to the recorded frame using the program SCÅTTER. Uniform Rg values across an elution peak represent a homogeneous state of mAb or its complex. Final merged SAXS profiles (Supplementary Figure 1), derived by integrating multiple frames across the elution peak, were used for further analysis, including a Guinier plot, which determined the aggregation free state (Supplementary Figure 1). The program SCATTER was used to compute the pair distribution function (P(r)) ( and ). The distance r where P(r) approaches zero intensity identifies the macromolecule’s maximal dimension (Dmax, , ). P(r) functions for single mAb (), single mAb+NPNTD () were normalized at the maxima except the P(r) of NPNTD alone (); mAb1-2-NPNTD and mAb2-4-NPNTD complexes () where the area under P(r) function correlates to MW estimated by SAXS. The SAXS flow-cell was also connected inline to a 1290 series UV-vis diode array detector measuring at 280 and 260 nm, 18-angle DAWN HELEOS II multi-angle light scattering (MALS) and quasi-elastic light scattering (Wyatt Technology), and Optilab rEX refractometer (Wyatt Technology). System normalization and calibration were performed with bovine serum albumin (BSA) using a 45 μL sample at 10 mg/mL in the same SEC running buffer and a dn/dc value of 0.175. The light scattering experiments were used to perform analytical scale chromatographic separations for MW and hydrodynamic radius (Rh) determination. UV, MALS, and differential refractive index data were analyzed using Wyatt Astra 7 software to monitor sample homogeneity across the elution peak complementary to the above-mentioned SEC-SAXS signal validation.
Solution state modeling
BILBOMDCitation38 rigid body modeling along with a FoXS and MultiFOXSCitation39,Citation40 approach was used to define, select, and weight the two-state atomistic model that best agreed with individual SAXS profiles of free mAb1, 2, and 4. The crystal structure with PDB ID: 1HZH,Citation59 including the glycans moiety, was used as an initial model. In the case of glycoproteins, the glycans’ contribution to the scattering is known to be larger than protein alone.Citation60 Minimal molecular dynamics simulation applied on the mAb hinge regions explores the Fab domain’s conformational space relative to the Fc-glycan region. The disulfide bonds in the hinge region were kept intact. In the conformational sampling, individual Fabs would move independently of one another. A single best-fit two-state and three-state model was selected for each mAb using MultiFOXS.Citation39,Citation40 We estimated the number of mAb states in solution by examining the Rg distributionCitation41 for the top 300 multistate-models () that all gave the same goodness-of-fit (χ2 ~ 0.9). The number of main peaks in the distribution indicates the number of states. The area and the position of the peaks validate the level of mAb flexibility.Citation41,Citation61 The SAXS envelopes were reconstructed from the experimental data of mAb2-4-NPNTD and mAb1-2-NPNTD complex using the program DAMMIF.Citation62 Ten bead models obtained for each SAXS experiment were averaged by DAMAVERCitation63 to construct the average model representing each reconstruction’s general structural features. Bead models were converted to volumetric SITUS format with the pdb2vol kernel convolution utility.Citation64 SAXS data and SAXS-derived models have been deposited in SIMPLE SAXS database (https://simplescattering.com/), and experimental SAXS parameters are reported in .
Negative staining and transmission electron microscopy (TEM)
Carbon film-coated 400 meshes Cu gridsCitation65 were rendered hydrophilic by processing in a Tergeo-EM plasma cleaner (PIE-Scientific) for 30 s at 15 W. Each complex composition was dialyzed and diluted to a final “low” concentration of 45 nM (2 hr) or “high” concentration of 450 nM (10 s) into Tris pH 7.4, 150 mM NaCl buffer from the initial 45 μM condition used for SAXS measurements to prepare NS-TEM specimen grids. Four μL of each diluted specimen was incubated on the pre-treated grids for 1 min before staining in 4 successive 50 μL drops of 1% uranyl formate on Parafilm, then blotted and air dried.Citation66 The grids were imaged in a Tecnai F20 electron microscope (ThermoFisher Scientific) operated at 120kV and equipped with a DirectView direct electron detector (Direct Electron) with a pixel size of 1.3 Å/pixel, at a cumulated dose of 40 electrons/pixel and a defocus range of −0.6 to −1.3 μm.
NS-TEM data processing
For each specimen, single particle data were picked manually from the micrographs and processed in RELION-3.1.Citation67,Citation68 The final data sets added up to 539, 6548, 693 and 3427 particles from 39, 82, 38 and 59 micrographs for mAb1-2-NPNTD “low” and “high” concentration, and mAb2-4-NPNTD “low” and “high” concentrations, respectively. Contrast transfer function (CTF) was estimated, particle data was extracted as 128 × 128 or 152 × 152 pixel boxes, 2.7 Å/pix, CTF-corrected and normalized before undergoing 2D alignment and classification. Class-average features were interpreted based on the number and arrangement of identifiable antibodies in their densities. Corresponding classes were grouped accordingly and their populations were pooled.
SPR
Affinity and kinetic data were acquired using a Biacore T200. All antibodies were coupled to a CM5 Biacore sensor chip using amine coupling. MAbs 1, 2, 4, 4-HRP were coupled using 10 mM acetate pH 5.5 at 10 μg/mL, while mAb 1-HRP required 10 mM acetate pH 5.0 at 10 μg/mL. All experiments were run in 10 mM HEPES pH7.4, 150 mM NaCl, 35 mM EDTA, 0.01% surfactant P20. NPNTD analyte injections for the single-cycle kinetic titrations were as follows: 0.074 nM, 0.22 nM, 0.67 nM, 2 nM, 6 nM. The dissociation time was 3600 s.
ELISA development
ELISAs were developed using the following materials: Corning 96-Well High-Binding Flat-Bottom Microplates from StemCell (Cat. # 38019), and R&D Systems, Stop Solution 2 N Sulfuric Acid (Cat. # DY994), Substrate Reagent Pack (Cat. # DY999), BSA-ELISA grade (5217/100 G). All reagents were allowed to warm to room temperature before use. ELISA signals were recorded using a POLARstar Omega plate reader. Samples were diluted in PBS unless otherwise stated. The wash buffer consisted of PBS pH 7.4 and 0.05% Tween 20. The blocking buffer consisted of PBS pH 7.4, 2% BSA, and 0.1% Tween 20. Unless specified, the following modified ELISA protocol was used: 100 μL per well of 4 mg/mL mAb2 capture antibody in PBS was added to the ELISA microtiter plate. The plate was sealed and incubated overnight at room temperature. The next day, the solution was discarded and washed with a wash buffer three times. The plate was blocked with 300 μL per well of blocking buffer for 1 h at room temperature. The plate was washed three times. NPNTD was diluted into PBS as a serial dilution concentration series, and 100 μLs per well was added to the plate. For the detection and “antibody networking” assessment, 100 μL of PBS containing 0.4 mg/mL antibody-HRP with or without 0.4 mg/mL mAb2 capture antibody was added directly to the samples in the plate, for a final concentration of 0.2 mg/mL. The plate frame was gently tapped for 1 min to mix, sealed, and incubated protected from light for 1.5 hours at room temperature. The plate was washed three times. Before use, the Substrate Reagent was prepared by combining equal parts of component A & B. 100 μL of working Substrate Reagent was added to each well and incubated for 20 minutes at room temperature protected from light. Fifty μL of Stop Solution was added to each well, and the plate was gently tapped to ensure thorough mixing. The optical density (OD) of each well was determined within 30 minutes of stopping the reaction. The OD 450 nm and 540 nm were recorded. The data were background corrected in Excel by subtracting the OD 540 nm from the 450 nm signal. For normalized data, all signals were individually divided by the background signal. All samples were run in triplicate. The mean and standard error of the mean was calculated and plotted in GraphPad Prism.
Abbreviations
CTD, C-terminal domain; FcγRs, Fc-gamma receptors; HRP, horseradish peroxidase; LFA, lateral flow assay; LOD, limit of detection; mAb, monoclonal antibody; MALS, multi-angle light scattering; NS, negative staining; NP, nucleocapsid protein; NPNTD, N-terminal domain of nucleocapsid protein; P(r), pair-distribution function; Rg, radius of gyration; RTC, replication-transcription complex; SAXS, small-angle X-ray scattering; SEC, size-exclusion chromatography; SPR, surface plasmon resonance; TEM, transmission electron microscopy.
Author contributions
C.D.H., G.L.H. and M.H. designed the overall research. M.W. and A. J. designed, expressed, and characterized nucleocapsid protein. D.J.R., C.D.H and M.H. collected and analyzed SAXS data. C.D.H. and M.H. reconstructed the SAXS models. P.G. collected and analyzed TEM data. C.D.H performed ELISA assays. C.D.H., P.G., M.W., A.J., G.L.H., and M.H. wrote the manuscript. All authors have given approval to the final version of the manuscript.
Supplemental Material
Download MS Word (40.7 MB)Acknowledgments
We would like to thank Robert Jedrzejczak and Lukas L. Welk for their help in protein expression and purification. We would also like to thank Andrew Barile-Hill from Cytiva for SPR data collection/analyses.
Disclosure statement
The authors declare that they have no conflict of interest.
Supplementary material
Supplemental data for this article can be accessed on the publisher’s website
Additional information
Funding
References
- Marra MA, Jones SJ, Astell CR, Holt RA, Brooks-Wilson A, Butterfield YS, Khattra J, Asano JK, Barber SA, Chan SY, et al. The Genome sequence of the SARS-associated coronavirus. Science. 2003;300:1399–13. doi:10.1126/science.1085953.
- Zhu Y, Liu M, Zhao W, Zhang J, Zhang X, Wang K, Gu C, Wu K, Li Y, Zheng C, et al. Isolation of virus from a SARS patient and genome-wide analysis of genetic mutations related to pathogenesis and epidemiology from 47 SARS-CoV isolates. Virus Genes. 2005;30:93–102. doi:10.1007/s11262-004-4586-9.
- Wolfel R, Corman VM, Guggemos W, Seilmaier M, Zange S, Muller MA, Niemeyer D, Jones TC, Vollmar P, Rothe C, et al. Virological assessment of hospitalized patients with COVID-2019. Nature. 2020;581:465–69. doi:10.1038/s41586-020-2196-x.
- Ng DL, Goldgof GM, Shy BR, Levine AG, Balcerek J, Bapat SP, Prostko J, Rodgers M, Coller K, Pearce S, et al. SARS-CoV-2 seroprevalence and neutralizing activity in donor and patient blood. Nat Commun. 2020;11:4698. doi:10.1038/s41467-020-18468-8.
- Hachim A, Kavian N, Cohen CA, Chin AWH, Chu DKW, Mok CKP, Tsang OTY, Yeung YC, Perera RAPM, Poon LLM, et al. ORF8 and ORF3b antibodies are accurate serological markers of early and late SARS-CoV-2 infection. Nat Immunol. 2020;21:1293–301. doi:10.1038/s41590-020-0773-7.
- Huang AT, Garcia-Carreras B, Hitchings MDT, Yang B, Katzelnick LC, Rattigan SM, Borgert BA, Moreno CA, Solomon BD, Trimmer-Smith L, et al. A systematic review of antibody mediated immunity to coronaviruses: kinetics, correlates of protection, and association with severity. Nat Commun. 2020;11:4704. doi:10.1038/s41467-020-18450-4.
- Poh CM, Carissimo G, Wang B, Amrun SN, Lee CY, Chee RS, Fong S-W, Yeo NKW, Lee W-H, Torres-Ruesta A, et al. Two linear epitopes on the SARS-CoV-2 spike protein that elicit neutralising antibodies in COVID-19 patients. Nat Commun. 2020;11:2806. doi:10.1038/s41467-020-16638-2.
- Liu W, Liu L, Kou G, Zheng Y, Ding Y, Ni W, Wang Q, Tan L, Wu W, Tang S, et al. Evaluation of nucleocapsid and spike protein-based enzyme-linked immunosorbent assays for detecting antibodies against SARS-CoV-2. J Clin Microbiol. 2020;58. doi:10.1128/JCM.00461-20
- Rikhtegaran Tehrani Z, Saadat S, Saleh E, Ouyang X, Constantine N, DeVico AL, Harris AD, Lewis GK, Kottilil S, Sajadi MM, et al. Performance of nucleocapsid and spike-based SARS-CoV-2 serologic assays. PLoS One. 2020;15:e0237828. doi:10.1371/journal.pone.0237828.
- Jiang HW, Li Y, Zhang HN, Wang W, Yang X, Qi H, Li H, Men D, Zhou J, Tao S-C, et al. SARS-CoV-2 proteome microarray for global profiling of COVID-19 specific IgG and IgM responses. Nat Commun. 2020;11:3581. doi:10.1038/s41467-020-17488-8.
- Di B, Hao W, Gao Y, Wang M, Wang YD, Qiu LW, Wen K, Zhou D-H, Wu X-W, Lu E-J, et al. Monoclonal antibody-based antigen capture enzyme-linked immunosorbent assay reveals high sensitivity of the nucleocapsid protein in acute-phase sera of severe acute respiratory syndrome patients. Clin Diagn Lab Immunol. 2005;12:135–40. doi:10.1128/CDLI.12.1.135-140.2005.
- Zeng W, Liu G, Ma H, Zhao D, Yang Y, Liu M, Mohammed A, Zhao C, Yang Y, Xie J, et al. Biochemical characterization of SARS-CoV-2 nucleocapsid protein. Biochem Biophys Res Commun. 2020;527:618–23. doi:10.1016/j.bbrc.2020.04.136.
- Chang CK, Sue SC, Yu TH, Hsieh CM, Tsai CK, Chiang YC, Lee S-J, Hsiao -H-H, Wu W-J, Chang W-L, et al. Modular organization of SARS coronavirus nucleocapsid protein. J Biomed Sci. 2006;13:59–72. doi:10.1007/s11373-005-9035-9.
- Peng Y, Du N, Lei Y, Dorje S, Qi J, Luo T, Gao GF, Song H. Structures of the SARS -CoV-2 nucleocapsid and their perspectives for drug design. Embo J. 2020;39:e105938. doi:10.15252/embj.2020105938.
- Yao H, Song Y, Chen Y, Wu N, Xu J, Sun C, Zhang J, Weng T, Zhang Z, Wu Z, et al. Molecular Architecture of the SARS-CoV-2 Virus. Cell. 2020;183:730–8 e13. doi:10.1016/j.cell.2020.09.018.
- Gui M, Liu X, Guo D, Zhang Z, Yin CC, Chen Y, Xiang Y. Electron microscopy studies of the coronavirus ribonucleoprotein complex. Protein Cell. 2017;8:219–24. doi:10.1007/s13238-016-0352-8.
- Li T, Wang L, Wang H, Li X, Zhang S, Xu Y, Wei W. Serum SARS-COV-2 nucleocapsid protein: a sensitivity and specificity early diagnostic marker for SARS-COV-2 infection. Front Cell Infect Microbiol. 2020;10:470. doi:10.3389/fcimb.2020.00470.
- Che X-Y, Hao W, Wang Y, Di B, Yin K, Xu Y-C, Feng C-S, Wan Z-Y, Cheng VCC, Yuen K-Y, et al. Nucleocapsid protein as early diagnostic marker for SARS. Emerg Infect Dis. 2004;10(11):1947–49. doi:10.3201/eid1011.040516.
- Diao B, Wen K, Zhang J, Chen J, Han C, Chen Y, Wang S, Deng G, Zhou H, Wu Y, et al. Accuracy of a nucleocapsid protein antigen rapid test in the diagnosis of SARS-CoV-2 infection. Clin Microbiol Infect. 2020;27:289.e1–289.e4. doi:10.1016/j.cmi.2020.09.057.
- Grant BD, Anderson CE, Williford JR, Alonzo LF, Glukhova VA, Boyle DS, Weigl BH, Nichols KP. SARS-CoV-2 Coronavirus nucleocapsid antigen-detecting half-strip lateral flow assay toward the development of point of care tests using commercially available reagents. Anal Chem. 2020;92:11305–09. doi:10.1021/acs.analchem.0c01975.
- Murphy K, Travers P, Walport M, Janeway C. Janeway’s immunobiology. New York, USA: Garland Science; 2008.
- Knutson DW, Van Es LA, Kayser BS, Glassock RJ. Soluble oligovalent antigen–antibody complexes. II. The effect of various selective forces upon relative stability of isolated complexes. Immunology. 1979;37:495–503.
- Van Es LA, Knutson DW, Kayser BS, Glassock RJ. Soluble oligovalent antigen-antibody complexes. I. The effect of antigen valence and combining ratio on the composition of fluorescein-carrier anti-fluorescein complexes. Immunology. 1979;37:485–93.
- Qiu LW, Tang HW, Wang YD, Liao JE, Hao W, Wen K, He X-M, Che X-Y. [Development and application of triple antibodies-based sandwich ELISA for detecting nucleocapsid protein of SARS-associated coronavirus]. Zhonghua Liu Xing Bing Xue Za Zhi. 2005;26:277–81.
- Bongini L, Fanelli D, Piazza F, De Los Rios P, Sandin S, Skoglund U. Dynamics of antibodies from cryo-electron tomography. Biophys Chem. 2005;115:235–40. doi:10.1016/j.bpc.2004.12.037.
- Sandin S, Ofverstedt LG, Wikstrom AC, Wrange O, Skoglund U. Structure and flexibility of individual immunoglobulin G molecules in solution. Structure. 2004;12:409–15. doi:10.1016/j.str.2004.02.011.
- Jay JW, Bray B, Qi Y, Igbinigie E, Wu H, Li J, Ren G. IgG antibody 3D structures and dynamics. Antibodies (Basel). 2018;7. doi:10.3390/antib7020018.
- Lei D, Liu J, Liu H, Cleveland TET, Marino JP, Lei M, Ren G. Single-molecule 3D images of “hole-hole” IgG1 homodimers by individual-particle electron tomography. Sci Rep. 2019;9:8864. doi:10.1038/s41598-019-44978-7.
- Zhang X, Zhang L, Tong H, Peng B, Rames MJ, Zhang S, Ren G. 3D structural fluctuation of IgG1 antibody revealed by individual particle electron tomography. Sci Rep. 2015;5:9803. doi:10.1038/srep09803.
- Tian X, Vestergaard B, Thorolfsson M, Yang Z, Rasmussen HB, Langkilde AE. In-depth analysis of subclass-specific conformational preferences of IgG antibodies. IUCrJ. 2015;2:9–18. doi:10.1107/S205225251402209X.
- Wright DW, Elliston ELK, Hui GK, Perkins SJ. Atomistic modeling of scattering curves for human IgG1/4 reveals new structure-function insights. Biophys J. 2019;117:2101–19. doi:10.1016/j.bpj.2019.10.024.
- Yanaka S, Yogo R, Kato K. Biophysical characterization of dynamic structures of immunoglobulin G. Biophys Rev. 2020;12:637–45. doi:10.1007/s12551-020-00698-1.
- Remesh SG, Armstrong AA, Mahan AD, Luo J, Hammel M. Conformational plasticity of the immunoglobulin fc domain in solution. Structure. 2018;26:1007–14 e2. doi:10.1016/j.str.2018.03.017.
- Liu X, Zhao Y, Shi H, Zhang Y, Yin X, Liu M, Zhang H, He Y, Lu B, Jin T, et al. Human immunoglobulin G hinge regulates agonistic anti-CD40 immunostimulatory and antitumour activities through biophysical flexibility. Nat Commun. 2019;10:4206. doi:10.1038/s41467-019-12097-6.
- White AL, Chan HT, French RR, Willoughby J, Mockridge CI, Roghanian A, Penfold C, Booth S, Dodhy A, Polak M, et al. Conformation of the human immunoglobulin G2 hinge imparts superagonistic properties to immunostimulatory anticancer antibodies. Cancer Cell. 2015;27:138–48. doi:10.1016/j.ccell.2014.11.001.
- Mayes PA, Hance KW, Hoos A. The promise and challenges of immune agonist antibody development in cancer. Nat Rev Drug Discov. 2018;17:509–27.
- Rambo RP, Tainer JA. Accurate assessment of mass, models and resolution by small-angle scattering. Nature. 2013;496:477–81. doi:10.1038/nature12070.
- Pelikan M, Hura GL, Hammel M. Structure and flexibility within proteins as identified through small angle X-ray scattering. Gen Physiol Biophys. 2009;28:174–89. doi:10.4149/gpb_2009_02_174.
- Schneidman-Duhovny D, Hammel M, Tainer JA, Sali SA. Accurate SAXS profile computation and its assessment by contrast variation experiments. Biophys J. 2013;105:962–74. doi:10.1016/j.bpj.2013.07.020.
- Schneidman-Duhovny D, Hammel M, Tainer JA, Sali SA. FoXS, FoXSDock and MultiFoXS: single-state and multi-state structural modeling of proteins and their complexes based on SAXS profiles. Nucleic Acids Res. 2016;44:W424–9. doi:10.1093/nar/gkw389.
- Schneidman-Duhovny D, Hammel M. Modeling structure and dynamics of protein complexes with SAXS profiles. Method Mol Biol. 2018;1764:449–73.
- Zhao J, Nussinov R, Ma B. Antigen binding allosterically promotes Fc receptor recognition. MAbs. 2019;11:58–74. doi:10.1080/19420862.2018.1522178.
- Patterson EI, Prince T, Anderson ER, Casas-Sanchez A, Smith SL, Cansado-Utrilla C, Solomon T, Griffiths MJ, Acosta-Serrano Á, Turtle L, et al. Methods of inactivation of SARS-CoV-2 for downstream biological assays. J Infect Dis. 2020;222:1462–67. doi:10.1093/infdis/jiaa507.
- Alpdagtas S, Ilhan E, Uysal E, Sengor M, Ustundag CB, Gunduz O. Evaluation of current diagnostic methods for COVID-19. APL Bioeng. 2020;4:041506. doi:10.1063/5.0021554.
- FDA. Coronavirus (COVID-19) update: FDA authorizes antigen test as first over-the-counter fully at-home diagnostic test for COVID-19. FDA News Release. 2020. https://www.fda.gov/news-events/press-announcements/coronavirus-covid-19-update-fda-authorizes-antigen-test-first-over-counter-fully-home-diagnostic.
- Wang D, He S, Wang X, Yan Y, Liu J, Wu S, Liu S, Lei Y, Chen M, Li L, et al. Rapid lateral flow immunoassay for the fluorescence detection of SARS-CoV-2 RNA. Nat Biomed Eng. 2020;4:1150–58. doi:10.1038/s41551-020-00655-z.
- Ahn DG, Jeon IJ, Kim JD, Song MS, Han SR, Lee SW, Jung H, Oh J-W. RNA aptamer-based sensitive detection of SARS coronavirus nucleocapsid protein. Analyst. 2009;134:1896–901. doi:10.1039/b906788d.
- Loeffelholz MJ, Tang YW. Laboratory diagnosis of emerging human coronavirus infections - the state of the art. Emerg Microbes Infect. 2020;9:747–56. doi:10.1080/22221751.2020.1745095.
- Hesari M, Ding Z. A perspective on application of carbon quantum dots in luminescence immunoassays. Front Chem. 2020;8:580033. doi:10.3389/fchem.2020.580033.
- Teengam P, Siangproh W, Tuantranont A, Vilaivan T, Chailapakul O, Henry CS. Multiplex paper-based colorimetric DNA sensor using pyrrolidinyl peptide nucleic acid-induced AgNPs aggregation for detecting MERS-CoV, MTB, and HPV oligonucleotides. Anal Chem. 2017;89:5428–35. doi:10.1021/acs.analchem.7b00255.
- Fabiani L, Saroglia M, Galata G, De Santis R, Fillo S, Luca V, Faggioni G, D’Amore N, Regalbuto E, Salvatori P, et al. Magnetic beads combined with carbon black-based screen-printed electrodes for COVID-19: a reliable and miniaturized electrochemical immunosensor for SARS-CoV-2 detection in saliva. Biosens Bioelectron. 2021;171:112686. doi:10.1016/j.bios.2020.112686.
- Yagi H, Yanaka S, Kato K. Structure and dynamics of immunoglobulin G glycoproteins. Adv Exp Med Biol. 2018;1104:219–35.
- Lin AV. Direct ELISA. Method Mol Biol. 2015;1318:61–67.
- Tang D, Sauceda JC, Lin Z, Ott S, Basova E, Goryacheva I, Biselli S, Lin J, Niessner R, Knopp D, et al. Magnetic nanogold microspheres-based lateral-flow immunodipstick for rapid detection of aflatoxin B2 in food. Biosens Bioelectron. 2009;25:514–18. doi:10.1016/j.bios.2009.07.030.
- Zhang S, Garcia-D’Angeli A, Brennan JP, Huo Q. Predicting detection limits of enzyme-linked immunosorbent assay (ELISA) and bioanalytical techniques in general. Analyst. 2014;139:439–45. doi:10.1039/C3AN01835K.
- Eschenfeldt WH, Makowska-Grzyska M, Stols L, Donnelly MI, Jedrzejczak R, Joachimiak A. New LIC vectors for production of proteins from genes containing rare codons. J Struct Funct Genomics. 2013;14:135–44. doi:10.1007/s10969-013-9163-9.
- Dyer KN, Hammel M, Rambo RP, Tsutakawa SE, Rodic I, Classen S, Tainer JA, Hura GL. High-throughput SAXS for the characterization of biomolecules in solution: a practical approach. Method Mol Biol. 2014;1091:245–58.
- Hura GL, Menon AL, Hammel M, Rambo RP, Poole FL, Tsutakawa SE, Jenney FE, Classen S, Frankel KA, Hopkins RC, et al. Robust, high-throughput solution structural analyses by small angle X-ray scattering (SAXS). Nat Methods. 2009;6:606–12. doi:10.1038/nmeth.1353.
- Saphire EO, Parren PW, Pantophlet R, Zwick MB, Morris GM, Rudd PM, Dwek RA, Stanfield RL, Burton DR, Wilson IA. Crystal structure of a neutralizing human IGG against HIV-1: a template for vaccine design. Science. 2001;293:1155–59. doi:10.1126/science.1061692.
- Hammel M, Kriechbaum M, Gries A, Kostner GM, Laggner P, Prassl R. Solution structure of human and bovine β2-glycoprotein I revealed by small-angle X-ray scattering. J Mol Biol. 2002;321:85–97. doi:10.1016/S0022-2836(02)00621-6.
- Hammel M. Validation of macromolecular flexibility in solution by small-angle X-ray scattering (SAXS). Eur Biophys J. 2012;41:789–99. doi:10.1007/s00249-012-0820-x.
- Franke D, Svergun DI. DAMMIF, a program for rapid ab-initio shape determination in small-angle scattering. J Appl Crystallogr. 2009;42:342–46. doi:10.1107/S0021889809000338.
- Volkov VV, Svergun DI. Uniqueness of ab initio shape determination in small-angle scattering. J Appl Cryst. 2003;36:860–64. doi:10.1107/S0021889803000268.
- Wriggers W, Milligan RA, McCammon JA. Situs: a package for docking crystal structures into low-resolution maps from electron microscopy. J Struct Biol. 1999;125:185–95. doi:10.1006/jsbi.1998.4080.
- Booth DS, Avila-Sakar A, Cheng Y. Visualizing proteins and macromolecular complexes by negative stain EM: from grid preparation to image acquisition. J Vis Exp. 2011. doi:10.3791/3227.
- Scarff CA, Fuller MJG, Thompson RF, Iadanza MG. Variations on negative stain electron microscopy methods: tools for tackling challenging systems. J Vis Exp. 2018. doi:10.3791/57199.
- Scheres SH. RELION: implementation of a Bayesian approach to cryo-EM structure determination. J Struct Biol. 2012;180:519–30. doi:10.1016/j.jsb.2012.09.006.
- Zivanov J, Nakane T, Forsberg BO, Kimanius D, Hagen WJ, Lindahl E, Scheres SH. New tools for automated high-resolution cryo-EM structure determination in RELION-3. Elife. 2018;7. doi:10.7554/eLife.42166.