
 ?Mathematical formulae have been encoded as MathML and are displayed in this HTML version using MathJax in order to improve their display. Uncheck the box to turn MathJax off. This feature requires Javascript. Click on a formula to zoom.
ABSTRACT
The determination of concentrations of large therapeutic molecules, like monoclonal antibodies (mAbs), in the interstitial brain fluid (ISF) is one of the cornerstones for the translation from preclinical species to humans of treatments for neurodegenerative diseases. Microdialysis (MD) and cerebral open flow microperfusion (cOFM) are the only currently available methods for extracting ISF, and their use and characterization for the collection of large molecules in rodents have barely started. For the first time, we compared both methods at a technical and performance level for measuring ISF concentrations of a non-target-binding mAb, trastuzumab, in awake and freely moving mice. Without correction of the data for recovery, concentrations of samples are over 10-fold higher through cOFM compared to MD. The overall similar pharmacokinetic profile and ISF exposure between MD (corrected for recovery) and cOFM indicate an underestimation of the absolute concentrations calculated with in vitro recovery. In vivo recovery (zero-flow rate method) revealed an increased extraction of trastuzumab at low flow rates and a 6-fold higher absolute concentration at steady state than initially calculated with the in vitro recovery. Technical optimizations have significantly increased the performance of both systems, resulting in the possibility of sampling up to 12 mice simultaneously. Moreover, strict aseptic conditions have played an important role in improving data quality. The standardization of these complex methods makes the unraveling of ISF concentrations attainable for various diseases and modalities, starting in this study with mAbs, but extending further in the future to RNA therapeutics, antibody-drug conjugates, and even cell therapies.
Introduction
Over the past years, the development of treatment options for neurodegenerative disorders, such as Alzheimer’s and Parkinson’s disease, has met substantial challenges. Motivated by the fact that many neurodegenerative diseases are proteinopathies, therapeutic monoclonal antibodies (mAbs) are one of the main research strategies used to address this gap.Citation1 Although highly selective and effective drugs in the body’s periphery, mAbs face the well-known hurdle for brain exposure of many therapeutic molecules intended to treat disorders of the central nervous system (CNS): the blood-brain-barrier (BBB). The BBB results in low brain exposure of mAbs, typically with a brain-to-serum ratio of ~0.1% to 1%. In contrast, chemical drugs can reach a (free) brain-to-serum ratio of up to 100%, and even more if active transport processes are involved.
Several strategies have been developed to demonstrate the penetration of mAbs into the brain tissue. These include refining the measurement of relevant biomarkers in the brain as a model for mAb efficacyCitation2 or enhancing the delivery of therapeutic mAbs into the brain. Several of these approaches are beginning to show promise.Citation3,Citation4 However, fewer methodological advances have been achieved to accurately quantify the exposure and effects of such brain-targeted therapeutics in the compartment where they exert their action. The antibodies’ targets are located in the interstitial fluid (ISF) surrounding the brain cells, and therefore this represents the compartment in which relevant drug concentrations of mAbs should be measured.Citation5,Citation6 Currently, the state-of-the-art methods for determining brain exposure of mAbs used in most preclinical studies are based on whole brain homogenate in rodents. Translation from preclinical species to humans is based on the measurement and extrapolation of mAb concentrations in the cerebrospinal fluid (CSF) in both species, followed by a back-translation to the expected concentration within the human brain based on the rodent brain homogenate data. The brain consists of numerous compartments, including neuronal and glial cells, ISF, CSF, blood, and vessels’ endothelial cells, that make up a complex mixture of tissue constituents. Subsequently, extracting the “real” concentration of the antibody in the ISF from these data is rendered impossible. Although the technique of dissecting specific brain regions is sometimes useful to understand target-driven exposure, these measurements are not designed to discriminate between the different compartments of the brain. They are therefore unable to provide valuable information on mAb pharmacokinetics (PK) and concentrations in the ISF target compartment. This insight would be highly valuable to inform on optimal antibody design and differentiate between candidates. More specifically, it would enable improved mAb efficacy by relating the ISF concentration to both the physico-chemical components of the antibody and the pathways underlying brain distribution through a rational screening cascade. It would inform on efficacious therapeutic dose levels (and selection of dosing regimens) and support the evaluation of potential alternative delivery routes (e.g., intranasal, intrathecal) for the enhancement of mAb brain disposition. In addition, studying target engagement by measuring the mAb-target complex, as well as analyzing pharmaco-dynamic biomarkers in the brain interstitial space, would enable the optimization of the treatment paradigm.
To date, microdialysis is the only in vivo method enabling the continuous measurement of free, unbound analyte concentrations in the ISF. Thoroughly investigated in several tissues (brain, liver, skin, kidney, and muscle) for small chemical molecules up to peptides, mainly in rodents,Citation7–9 and less frequently in humans,Citation10,Citation11 this minimally invasive sampling technique is currently being adapted to collect large biotechnological molecules, including mAbs. Indeed, sampling and quantitatively measuring macromolecules (mAbs are ~150 kDa) in ISF necessitates a sampling unit with large openings. Only two distinct ISF-sampling units currently offer this possibility: microdialysis (MD) probes, consisting of a large molecular weight cutoff (MWCO) membrane of ~1 MDa, and a novel type called cerebral open flow microperfusion (cOFM) probes, consisting of an open exchange structure formed of a macroscopic plastic mesh. Because probes with large openings bring experimental challenges, which can strongly affect the peri-probe environment,Citation12,Citation13 only a few groups in the scientific community have so far investigated the PK of large molecules, including mAbs, in the rodent brain ISF using the large pore MD probe.Citation14,Citation15 Their work started to validate MD for the collection of macromolecules and opened the path to new insights into understanding the brain disposition of mAbs. However, as method validation for MD probes continues with new equipment entering the market and novel challenges identified, the use of cOFM probes offers an opportunity to broaden the possibilities.
Here we describe the implementation and comparison of MD and cOFM sampling units for measuring mAb concentrations in the ISF of awake and freely moving mice. We also detail the use of aseptic surgical techniques and of a number of novel technological solutions. In order to complete the PK investigation in ISF, we collected terminal samples (CSF, serum and brain) at the end of each ISF-sampling experiment, and performed standard PK-tissue studies, using the same antibody tested with MD and cOFM (collecting CSF, plasma, serum and perfused brain). As a test molecule for these studies, trastuzumab was chosen for two reasons. First, it binds to the human epidermal growth factor receptor-2 (HER2) with no cross-reactivity to mouse, rendering it a non-targeting mAb in this species. Second, trastuzumab is clinically relevant as it is currently being evaluated for the treatment of brain metastases in patients suffering from HER2-overexpressing metastatic breast cancer. Therefore, these preclinical studies can help to understand the disposition of anti-HER2 antibodies in the human brain and characterize the potential of two ISF-sampling methods as tools to determine mAb kinetics in a relevant target compartment of the brain.
Results
Experimental setups and technological improvements for ISF-sampling of macromolecules in mouse
The collection of large therapeutic molecules in brain ISF from awake, freely-moving animals requires highly customized ISF-sampling set-ups (). Through the use of probes with large pores or macroscopic openings, the passage of analytes will occur via ultrafiltration and convective flow, therefore making the probes more sensitive to pressure changes and leakage of perfusion fluid in the surrounding tissue (). A push-pull mechanism is essential to avoid pressure accumulation inside the probes and to achieve good recovery of the test article. The MD method typically uses dissociated push and pull components, and therefore requires a careful adjustment of the perfusion flow rate at both the syringe pumps (push) and the peristaltic pumps (pull) when starting the experiment (). The cOFM method described here uses an integrated push-pull fluidic system, where both components are controlled by one single peristaltic pump head (). Push and pull are therefore perfectly synchronized, with no need of manual adjustment. Moreover, our ISF-sampling setups include the possibility of dual probe implantation, thus necessitating two push-pull systems per animal. Each pump used for the cOFM possesses two heads, which enables the control of two independent push-pull systems by one pump ().
Figure 1. Illustration of the two ISF-sampling push-pull setups and associated probes used for collection of macromolecules in awake and freely moving mice. (a) Microdialysis (MD) setup includes a dissociated push/pull fluidic system and (c) a large pore membrane probe with a molecular weight cutoff (MWCO) of 1 MDa. (b) Cerebral open flow microperfusion (cOFM) setup includes a synchronized push/pull fluidic system and (d) a probe with macroscopic openings of 200 µm
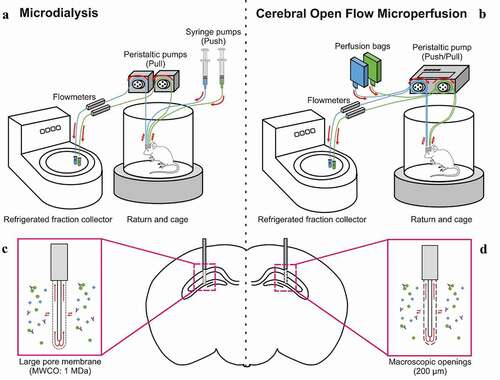
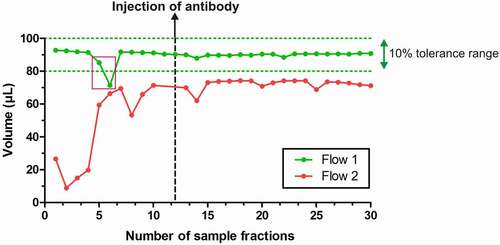
MD and cOFM have been upgraded with online flowmeters that guarantee a constant monitoring of the probes outflow (). It enables the experimenter to immediately pinpoint variations in flows, and therefore in volumes of samples, and to solve issues during the experiment or perform a post hoc exclusion of samples. As shown with representative traces in , flows are typically being monitored over time, as soon as the probe has been connected. A tolerance range of approximately 10% of the expected volume guides the exclusion of sample fractions if needed: in the case of , a flow of 1 µL/min with a fraction time of 90 minutes has been set, therefore placing the tolerance area between 100 and 80 µL per fraction. Two fractions from Flow 1 have been excluded due to a sudden drop in volume, which was, however, overcome afterward. Flow 2 led to an exclusion of this set of samples, as volumes are highly unstable over time and below the tolerance range throughout the sampling period.
Figure 2. Probe outflow stability monitored using online flowmeters. Flow 1 (green) shows a stable volume over time, directly into the tolerance zone set for this experiment. Two fractions have been excluded (pink rectangle). Flow 2 (red) shows very unstable volumes over time due to experimental issues with the probe. Besides, volumes of samples fractions are always below the tolerance range, which therefore excludes this probe from further analysis
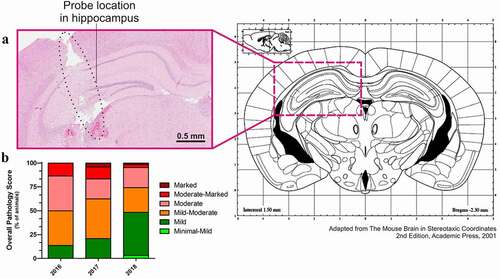
To make the best use of microdialysis, it is critical to determine the final location of the probe, as both MD and cOFM methods enable the targeting of precise brain areas for neurological diseases purposes. In this study, we focused on the hippocampus of mice, as it is a brain area critical for cognitive processes, learning and memory, and is especially vulnerable to damage in a wide range of neurodegenerative disorders. The coordinates of the guide implantation, and therefore the probe location, were verified after the MD or cOFM; it was thus required to first pull out the guide and probe from the tissue in order to further study the brain. After serial sectioning and hematoxylin and eosin (H&E) staining, an accredited pathophysiologist created a report on tissue pathology, evaluating the reach of the target and the tissue state in the peri-probe environment. The representative coronal brain section shown in validates the location of the probe in the targeted brain region, as compared with the mouse brain atlas. The staining also enables the assessment of tissue pathology and tissue damage (necrosis, hemorrhage, inflammation) via an overall pathology score, grading the pathology from minimal to marked. A mild to moderate score is considered within an acceptable range; data from animals above that score are excluded. The evolution of the overall pathology score has been monitored over the years (). In order to constantly improve animal welfare and enhance the scientific relevance of the data, strict aseptic surgeries and aseptic experiments were thoroughly implemented. This resulted in faster recovery of animals through an improved survival rate post-surgery (from 76% in 2016 to 88% in 2018; data not shown) and a decreased post-operative tissue pathology (36% of moderate-marked animals in 2016 vs. 4.8% in 2018, ). Overall, a drastic reduction in inter-animal variability and experimental dropouts enabled us to exclude fewer animals and gain confidence in data quality. This strict quality control is performed after every MD and cOFM experiment.
Figure 3. Validation of probe location and quality controls on tissue pathology. (a) Histological staining (H&E) of a brain slice, where the sampling probe was implanted. The clear location of the probe in the left hippocampus validates the coordinates used. The histological staining also enables to evaluate the tissue pathology after microdialysis. (b) Overall pathology score throughout the establishment of microdialysis and aseptic surgery at AbbVie. Based on tissue pathology, an overall pathology score is given to each mouse after microdialysis. A mild to moderate score is considered to lie within the usual range of such a surgical procedure. Data from animals above that score are excluded from further analyses
Trastuzumab PK profile through classical PK studies, MD and cOFM
A single dose of trastuzumab (43 mg/kg) was administered by either intraperitoneal (i.p.) or intravenous (i.v.) injection across different types of in vivo studies for the investigation of the PK parameters of this large molecule in mice. A full PK-tissue screen was performed until 504 hrs post-application (p.a.), with n = 3 mice at each time points. Serum, perfused brain and CSF were collected over time and the concentration of trastuzumab in these different compartments was measured. shows the complete rich sampling PK profile of trastuzumab collected via this method, revealing stable concentrations in serum over the course of the 504 hrs of experiment. The lower panel shown in focuses on the first 50 hrs p.a. The PK analysis indicates that the maximal concentration (Cmax) is reached in serum at 7 hrs, while brain and CSF reach Cmax at 50 and 75 hrs, respectively (). Brain and CSF exposures are comparable, with an AUC0-t of 542 and 535 µg.hr/mL, respectively. The tissue/serum ratios support this further, with values of 0.78% and 0.80% for brain and CSF, respectively (). Half-life in the different compartments could not be accurately evaluated due to the too short duration of the study with respect to the concentration change of the compound.
Table 1. Pharmacokinetic parameters of trastuzumab calculated in different compartments following a single 43 mg/kg i.p. or i.v. dose. Pharmacokinetic parameters were estimated by semi-parametric methods using a set of macro-routines in a spreadsheet (Pharmkin/MS Excel). The subscript mention “Measured” refers to measured concentration, with no recovery correction applied to the data. The subscript mention “Back-calculated” refers to the data corrected for analyte recovery
Figure 4. Trastuzumab pharmacokinetic profiles in different compartments. (a) Trastuzumab pharmacokinetic profiles in mouse serum, brain homogenates and CSF obtained by classical rich sampling PK studies following intraperitoneal application of 43 mg/kg dose over 504 h p.a. (n = 3 mice/timepoints). (b) Extension of the early phase post-application (derived from the orange frame in the upper panel (A)). (c) Trastuzumab pharmacokinetic profiles in mouse brain ISF obtained by MD (n = 4 mice and probes) and cOFM (n = 2 mice and probes) following intraperitoneal or intravenous application of 43 mg/kg dose, followed by a continuous sampling over 48 h post-application. MD measurements include both unprocessed (directly measured data) and corrected concentrations (in vitro recovery). (d) Extension of the early phase post-application (derived from the orange frame in the upper panel (C))
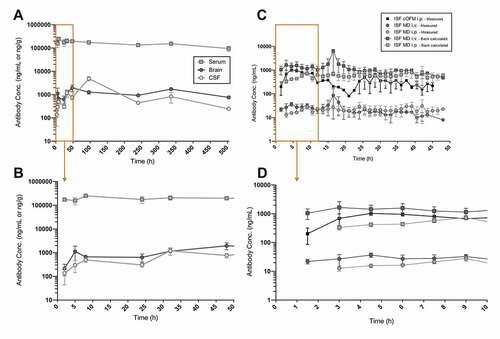
MD and cOFM methods bring the additional information of the ISF free concentration of trastuzumab over time in the same animal. Due to the presence of a membrane, the MD requires the back-calculation of the concentrations measured using a pre- and post-experimental in vitro recovery. On the other hand, cOFM does not allow the use of such recovery due to the macroscopic openings of its sampling unit. shows the unprocessed measured concentrations of trastuzumab in ISF using both methods, as well as the corrected data for MD using in vitro recovery. Additionally, MD was performed with both i.v. and i.p. dosing routes. As shown in the exert of , the data clearly demonstrate a difference in absorption in the brain interstitial compartment when using two dosing routes: the i.v. injection of the compound leads to Cmax at 12 h (± 4.59) p.a., while the i.p. injection results in a Cmax at 27 h (± 7.06). The cOFM was only carried out i.p. and, in contrast to MD, showed an earlier Cmax at 17 h (± 11.25) p.a. (). The apparent clearance (CL/f) of the mAb via cOFM and MD Back-calculated in the brain interstitium do not differ significantly (; ). Nevertheless, AUC0-t and tissue/serum ratios indicate similar PK profiles between MD Back-calculated and cOFM with i.p. injection: 22 µg. h/mL and 0.03% ISF/Serum ratio for MD Back-calculated; 21 µg. h/mL and 0.03% ISF/Serum ratio for cOFM (). Due to 100% bioavailability of the mAb after i.v. application, the ISF exposure observed in MD Back-calculated corresponds to the highest possible level, with an AUC0-t of 36 µg. h/mL ().
Absolute quantification of trastuzumab in brain ISF using the zero-flow rate method
Interestingly, the exposure of the antibody collected via MD (including back-calculation through recovery) or via cOFM (no back-calculation) is very similar (; ). Therefore, the lack of correction for the cOFM values (no in vitro recovery can be considered) does not seem to affect the overall exposure, even though the dilution of the push-pull system is not considered in the obtained cOFM mAb concentrations. This potentially raises the question if an absolute quantification of the test article in the samples is really achieved with back-calculated MD data. In order to address this question, in vivo absolute quantification methods have been considered. The zero-flow rate methodCitation16,Citation17 was performed at steady state in order to obtain a stable mAb concentration in ISF. The flow rate in each animal was increased stepwise, from 0.1 to 0.2, 0.3, 0.6, 1.0, 1.5 and finally 2.0 µL/min. Between flow rates, an equilibration period of 1 to 6 hrs was performed in order to restore the equilibrium between the fluid composition of the perfusate and the peri-probe ISF. The collected fractions were analyzed and the flow rates vs. concentrations were plotted (). Flow rates were corrected to their real value using the flowmeter data for each analyzed fraction. shows a clear exponential relationship between flow rate and analyte recovery with more than one log10 difference in recovered concentrations at 1 and at 0.1 µL/min. A one-phase decay exponential fit was applied to the plotted data, and the absolute concentration C0 at a theoretical zero flow rate (y = 0) could be extrapolated. At steady state, C0 is 5,813 ng/mL ± 202.7 ().
Figure 5. Absolute quantification of Trastuzumab with cOFM in brain ISF using the Zero-Flow rate method, extrapolating to the theoretical concentration at 0 flow rate (C0) at steady state. 15 hrs after intravenous application of 43 mg/kg dose in mouse (therefore ensuring steady state concentrations in ISF), the flow rate of the push/pull system was progressively increased from 0.1 µL/min to 2 µL/min and recovery at the outlet was measured (n = 11 mice and n = 22 probes)
Concentrations at steady state/terminal time point (CSS) for both MD and cOFM are reported in . ISF CSS are reported in the table as a mean of the last 10 hrs measured concentrations (no correction for recovery) of MD or cOFM. ISF C0 is distinguished between in vitro and in vivo, based on the fact that either an in vitro or in vivo recovery has been used for calculating the absolute concentration in ISF (; blue and green, respectively). The in vitro C0 is of 898.4 ± 113 ng/mL, while the in vivo C0 is of 5,813 ± 203 ng/mL, revealing a 6.5-fold discrepancy between the two methods. The percentage of recovered mAb therefore varies depending on the absolute concentration considered: in vivo and at steady state, the MD probe recovered 3% of 898.4 ± 113 ng/mL (in vitro C0) and 0.5% of 5,813 ± 203 ng/mL (in vivo C0), while the cOFM probe recovered 35.9% of 898.4 ± 113 ng/mL (in vitro C0) and 5.5% of 5,813 ± 203 ng/mL (in vivo C0). Tissue/serum ratios for brain and CSF align well for MD and cOFM (). MD shows an ISF CSS/serum ratio of 0.01% (collected at 1 µL/min) and an ISF C0/serum ratio of 0.49%. The cOFM method demonstrates an ISF CSS/Serum ratio of 0.12% (collected at 0.3 µL/min) and an ISF C0/serum ratio of 2.12%.
Table 2. Steady-state concentrations of terminal tissues, ISF and associated recoveries for both microdialysis and cerebral open flow microperfusion after single injection of trastuzumab. The use of either in vitro or in vivo recovery impacts dramatically the assessment of the absolute ISF concentration of macromolecules in the mouse brain
Discussion
The determination of the concentration of large molecules, like mAbs, in the brain target compartment ISF is crucial for the development of neuroactive drugs, and for the identification and validation of clinically useful biomarkers. Thus, understanding the kinetics of mAbs exposure in the interstitial space is at the center of several therapeutic efforts,Citation14,Citation18,Citation19 and therefore emphasize the necessity for developing preclinical methods in order to access large molecules in ISF. MD using a membrane probe and cOFM using a probe with macroscopic openings are currently the technological options for such scientific challenge. The goal of our study was to assess and compare for the first time the performance of MD and cOFM in collecting mAbs in the ISF of awake and freely-moving mice. Additionally, the important and still open question of absolute concentration in ISF is here addressed.
The first dimension of this study is a comparison at the technical level of the two methods (). For both large-molecule MD and cOFM, the transfer of analytes across the probe follows mechanisms of ultrafiltration and convection flow. However, the two methods produce different type of samples: through MD, filtered samples are created, as most analytes larger than the probe MWCO will not pass across the membrane. This property does not yet give access to the full spectrum of molecules contained in ISF samples, whereas the cOFM, due to its open exchange structure, avoids filtration of the collected fluid. As a result, while MD enables fewer analytical requirements for downstream analysis, cOFM creates the opportunity of sampling more than only large molecules (e.g., mAbs/antigen complexes or immune competent cells). Removing the use of a membrane also mitigates typical MD issues such as biofouling, protein clotting or unspecific binding.
Due to the larger openings at the probe used in this study, both MD and cOFM raise the issue of water loss, and therefore require correction of osmotic pressure. Increasing the fluid viscosity with the addition of bovine serum albumin (BSA) up to 10% in the perfusate has proven to prevent fluid loss from the probe and to increase large analyte recovery.Citation20 If not properly counterbalanced, water loss via the internal hydraulic pressure introduced by the push-pull system can dilute the peri-probe environment and thus alter its physiology, and lead to underestimation of the measured ISF concentrations. Given these considerations, an even lower than recommended BSA percentage in perfusate at the respective flow ratesCitation20 was used in this study in order to properly balance the osmotic benefits of BSA with its potential adverse effects on the composition of the collected samples (specific biomarkers were measured in ISF with and without BSA using the cOFM method (data not shown) and did not reveal significant differences). Moreover, the flow rate was specifically decreased for cOFM (0.3 µL/min instead of 1 µL/min for MD) in order to correct the convective fluid loss without having to increase the BSA percentage in perfusate.
The sensitivity to pressure changes of both MD and cOFM probes requires the use of a push-pull system, which by helping to solve the fluid-loss potential issue, introduces in turn a dilution of the collected samples: the equilibrium between perfusate and ISF will not be achieved as the perfusate is continually delivered through the probe. As a result, only a fraction of the analyte concentration will be recovered in the collected samples, wherever MD or cOFM is being used. It is, however, important to note that, although not absolute, the measured and uncorrected concentrations at steady state (CSS) recovered with cOFM are over 10-fold higher than with MD (), most likely due to the non-filtration of the samples and low unspecific binding of the analyte to the probe material. In line with our results, small lipophilic and small hydrophilic substances have been shown to be more efficiently recovered via cOFM in comparison to MD.Citation21 This opens the possibility of studying brain ISF exposure at treatment-relevant low dose (e.g., i.v. injection of 5 mg/kg; data not shown), and makes it possible to study non-linear PK processes where uptake mechanisms (e.g., transferrin receptors trojan horse approach) can be saturated at high doses.Citation22
An equally critical technical aspect is the calibration of the push-pull system for optimal fluid recovery, which is necessary to avoid leakage of perfusate into the peri-probe environment. State-of-the-art MD typically uses dissociated push and pull elements, which need to be carefully adjusted prior to the experiment. If inappropriately calibrated, an artificial increase in the probe recovery can be measured due to unidirectional convection, as mentioned already in other microdialysis studies.Citation14,Citation23 Such adjustment is crucial, but also time consuming. A synchronized push-pull pump has been developed and implemented by the cOFM supplier, sparing the time and the inaccuracy of manual adjustments. Additionally, each of these pumps possesses two heads, hence permitting the command of two separated push-pull systems, which, in comparison to MD setups (i.e., two syringe pumps and two peristaltic pumps are required for two MD push-pull systems), represents an important gain in space and convenience of manipulation. Such a pump could be easily implemented in MD setups, thus deviating from the state-of-the-art observed in literature.Citation14,Citation15
The use of online flowmeters offers an unprecedented quality control for the ISF-sampling process, as well as a huge gain in time. Former ISF-sampling studies were usually performed with gravimetry control of the samples, which was extremely labor-intensive and did not offer the possibility of immediately identifying fluctuations in sample volumes to potentially solve issues during experiments ( and Supplementary Figure). Due to the miniaturization of the setup and the use of extremely fine material, a drop in the fluid flow could occur during the experiment for multiple reasons. The part of the fluidic system that is located after the probe is especially sensitive. Indeed, the extremely narrow tubing may be clogged by debris collected in the peri-probe environment, the viscosity of the perfusate enriched with ISF can sporadically change, and air may enter the fluidic system due to, for example, loosening of various connectors. Moreover, although controlled to the most possible extend, the stability and integrity of the setup can always be influenced by the continuous movement and changing behavior of the animal in its cage, for example by jamming the tubing or disconnecting the probes. The use of the flowmeters therefore enables intervention in case of flow drop, for example by performing a short flush of the probe or tightening of all connectors.
In terms of additional quality controls, the implementation of systematic tissue pathology assessments enables proper verification of the probe location after every experiment, as well as an evaluation of the potential inflammation processes and tissue damage (e.g., neuronal or microglial activity, glial scar formation) (), which could have an influence on data obtained from the samples. Indeed, the damaged blood vessels and the formation of a glial scar, for example, can impede exchange of analytes, alter metabolism or hinder signaling in the peri-probe environment.Citation24,Citation25 The tissue reaction provoked by the cOFM probe has been extensively studied and revealed a minimal effect even after a long implantation period.Citation26 Such quality controls have so far not been implemented in ISF-sampling studies reported in literature. As a final technical evaluation of both methods, the cost comparison of large pore MD and cOFM places them on an almost equivalent level, with one cOFM kit (guide, dummy, probe, locking wedge) representing about 75% of the price of a MD kit (guide, dummy, probe, cap nut).
The second dimension of this study is a data-based comparison of the two methods for the collection of an exogenously injected mAb. As for basic knowledge of the PK profile of trastuzumab, a PK-tissue screening was performed after i.p. administration (), revealing a typical mAb PK profile in serum.Citation27 Brain (homogenates) and CSF (cisterna magna) exposures were shown comparable over time (). It is important to keep in mind, however, that the concentrations measured in brain homogenates are most likely diluted values of the actual mAb concentrations, since antibodies are located in the extracellular space only (i.e., in ISF): homogenized brain tissue contains intra- and extracellular medium, brain endothelial cell extract, potential residual blood and the residual CSF, therefore comprising a mixture of all brain compartments and cellular fractions. Brain/serum as well as CSF/serum ratios observed in our findings are similar to the typical 0.1–1% reported in the literature for mAbs.Citation28–30 In this study, residual blood after careful brain perfusion (see Materials and Methods) was taken into consideration via visual inspection of the brains and following exclusion of data if required. Quantitatively correcting for residual blood concentrations in brain tissue is a highly relevant topic in the investigation of mAbs brain disposition, as the penetration of such large molecule is very low and could easily be overestimated. We are currently deploying efforts to quantify hemoglobin and albumin in the brain parenchyma in order to back-calculate the amount of contamination, if any. However, such an approach should be taken carefully, as it has been demonstrated that both proteins are also present in brain cells,Citation31,Citation32 thus making an absolute evaluation of the potential blood contamination difficult.
The measurement of ISF using MD and cOFM brings valuable and unprecedent information regarding the concentrations of mAbs beyond the BBB (). Within the MD experiments performed in this study, the difference between dosing routes aligns well with expected values: ISF exposure (Cmax and AUC) is higher after i.v. administration and Tmax is reached faster. The quantification of mAb concentrations in ISF is tightly connected to the concept of recovery, which outlines the relation between the real concentrations of the analyte in the peri-probe ISF and those in the dialyzate, which consists of diluted ISF due to the flow of the microdialysis fluid through the probe. As extensively described in the literature, either absolute or relative recovery are used for defining this relationship between expected and measured ISF concentrations.Citation33 Due to the presence of a membrane in the MD, which results in a concomitant reduction in analyte recovery, the MD requires a relative quantification, i.e., the back-calculation of the concentrations measured using a pre- and post-experimental in vitro recovery. For each probe, a recovery was calculated. We found in vitro recoveries spanning from 3 to 5%, which were individually used for each probe in order to correct the measured ISF concentrations (). On the other hand, cOFM has shown to recover 100% of the analyte when performing in vitro recovery: due to the macroscopic openings of its sampling unit, an immediate equilibration between the outer and inner compartment of the probe in the buffer solution was established. In theory, this should enable to consider the cOFM measured concentrations in ISF as already corrected for recovery. However, as the in vitro recovery does not mirror the complexity of the in vivo peri-probe environment, an in vivo absolute should be considered.
As shown in the Results section, in vivo recovery using the zero-flow rate method necessitates stable analyte concentrations in ISF, as it is not a dynamic measurement of concentrations given the successive change of flow rates. For the same reason, the use of a satellite cohort of animals is needed for the zero-flow rate method, thereby providing an overall recovery for trastuzumab based on the extrapolated absolute concentration C0. A direct correction of each probe, as with the in vitro experiment for the MD, is therefore not possible. Given this consideration and the limited in vitro recovery of MD compared to cOFM, comparison of the PK parameters of the back-calculated MD data with the directly measured cOFM data () was considered to be the most suitable strategy for our study.
Literature data describing the measurement of antibody concentrations in the ISF is currently limited. There are no studies that allow a head-to-head comparison with our data, particularly for the cOFM method. In a study in rats, Chang et al.Citation14 have reported for trastuzumab an ISF/plasma ratio via MD and in striatum over 12-h p.a. of 0.6%, while we observed in mice an ISF/serum ratio in hippocampus over 48 hrs p.a. of 0.03% via both MD and cOFM. Possibly, various experimental parameters could underly this observed discrepancy, among them the difference in used species or in sampling timeframe. For smaller molecules (between 236 and 780 Da) and higher species (monkey), the ISF/plasma ratios over 5 h p.a. has been shown to reach up to 3% when using MD.Citation34 Even with a high recovery of trastuzumab the concentrations of the samples collected with cOFM are not corrected for the push-pull dilution factor. It is therefore interesting to note that the concentrations, AUCs and tissue/serum ratios between MD and cOFM injected i.p. are very similar. This indicates a probable underestimation of the absolute concentrations calculated with the in vitro recovery (), and therefore necessitates the establishment of an in vivo recovery method in ISF.
Besides the overall similar ISF exposure, the PK profile of trastuzumab using cOFM shows some discrepancies with MD: the Tmax (), as well as the concentrations over time, are lower (). Although having its advantages, the absence of membrane at the probe removes the physical barrier to shear forces due to perfusate flowCitation35,Citation36 and might influence the fluid exchanges initially corrected by the presence of BSA in the perfusate.Citation20 Therefore, the use of lower flow rates is recommended (in this experiment, we used 0.3 µL/min compared to 1 µL/min typically used in MD). Such low flow rate still might not be enough to avoid a depletion of the mAb around the probe, as the extraction of the large analyte over time is probably faster than its diffusion to the peri-probe environment through the tortuous extracellular space. Using slower flow rates like 0.1 µL/min would be a possible follow-up experiment to answer this question, as well as an improvement of the analyte recovery (MD extraction for small molecules at this rate is greater than 90%).Citation37 Absolute quantitation using slow or ultraslow microdialysis was attempted in the past, but the authors mentioned the technical and experimental difficulties of such low flow rates with a membrane probe.Citation38
In this study, low flow rates were successfully applied during the absolute quantification experiment using cOFM (zero-flow rate method), 0.1 µL/min flow rates indeed supporting the postulate of a higher recovery of the mAbs, with an extraction reaching in average 28% of the extrapolated in vivo C0 (). The absolute concentration at steady state was shown to be much higher than what was initially calculated with the in vitro recovery (). Besides not taking into consideration in vivo peri-probe processes (absorption, metabolism, uptake, extra-intracellular and capillary exchanges, tortuosity),Citation24 in vitro recoveries performed with a membrane probe are here carried out at a typical flow rate of 1 μL/min, which is probably far from a quantitative extraction. Additionally, in vitro recovery only considers diffusion through the buffer and through the membrane, which do not accurately mirror the probe’s performance in vivo. Resistance to diffusion during microdialysis has indeed been shown as a result of the external medium, rather than the microdialysis membrane.Citation16,Citation39 Altogether, these factors would account for the dilution factor still observed with the in vitro C0 (1/6.5 dilution) compared to the in vivo C0 (). The lower flow rate used in the zero-flow rate experiment (0.1 µL/min) did not enable a “quantitative extraction” (i.e., over 90%, as defined for small moleculesCitation37) of the analyte, as 28% of the extrapolated C0 could be recovered, but would still deserve to be applied for a complete experiment in order to address the possible depletion effect observed at 0.3 µL/min.
Our current cOFM set-up does not enable us to decrease the flow even further, with 0.1 µL/min already being an experimental challenge for ISF-sampling on awake and freely moving animals, with issues including important tubing dead volumes due to the Raturn system and higher risks of clutter of the small inner-sized tubing. Microdialysis on anesthetized animal, where tubing length could be kept to an absolute minimum, could be considered. Additionally, a dynamic absolute quantification of the ISF concentrations measured with cOFM should be implemented. The zero-flow rate method brings the valuable information of C0 in ISF, but requires the mAb concentrations to be already at steady state in ISF. To measure absolute concentration of mAbs under dynamic conditions, other calibration methods should be considered, but need to be adapted to large molecules: the ionic reference technique has been previously used for small molecules, as the assumption is taken that the recovery of certain ions is similar to the analyte of interest.Citation40
This study aimed at comparing two ISF-sampling methods improved for the collection of antibodies in mouse. Both systems present technical and experimental advantages and challenges. Use of MD with large pore membrane has already been reported for the sampling of large molecules with limitations,Citation14,Citation15 which can be partially overcome by cOFM as shown in this study. For the first time we showed that this method is valuable for the collection of mAbs in the ISF and we pinpointed several strengths as compared to the more widely used microdialysis method. For example, the possibility of collecting larger complexes and of enhancing the extraction rate of the analyte has a great potential for assessing not only free ISF concentrations of therapeutic assets, but also of their target engagement, and at injected doses as low as 5 mg/kg. Such new potential in experimental conditions can help with the evaluation and refinement of therapeutic strategies currently under evaluation for neurodegenerative disorders by, for example, assessing antibodies’ target engagement in ISF for specific biomarkers such as tau, alpha-synuclein, and amyloid-β, while testing differences in mAbs affinities or in brain penetration and clearance. The method can also be expanded to other modalities, including RNA therapeutics, antibody-drug conjugates, and even cell therapies, since cells can pass the plastic mesh of the cOFM sampling unit. Extrapolating these data to human, in order to provide clinical guidance, would be the ultimate goal. Moreover, the use of the zero-flow rate method sheds light for the first time on the absolute ISF concentration of non-target binding mAb at steady state. Further experiments should be performed to evaluate the influence of target binding on antibody quantification in ISF. Overall, additional validation studies should be performed with cOFM in order to investigate the optimal experimental conditions but, when considering the collection of large molecules and more, the method does hold great promise over microdialysis.
Materials and methods
Animals
8-week-old male Crl:CD1(ICR) and C57BL/6NCrl mice (Janvier, France) were housed individually under standard environmental conditions (temperature of 22 ± 2°C and humidity of 45–65% in controlled rooms with a 12:12 hdark/light cycle) with ad libitum access to food (Ssniff Diet R/M 2014) and water. Type II static cages with hardwood bedding are used. All animal experiments were performed in full compliance with the Principles of Laboratory Animal Care (NIH publication No. 86–23, revised 1985) in an AAALAC-accredited program with veterinary care and oversight to ensure appropriate animal welfare. All animal studies were approved by the government of Rhineland Palatinate (Landesuntersuchungsamt Koblenz) under the animal license A17-9-005 GV (A5/18) and conducted in accordance with the directive 2010/63/EU of the European Parliament and of the Council on the protection of animals used for scientific purposes, the ordinance on the protection of animals used for experimental or scientific purposes (German implementation of EU directive 2010/63; BGBl. I S. 3125, 3126), the Commission Recommendation 2007/526/EC on guidelines for the accommodation and care of animals used for experimental and other scientific purposes and the German Animal Welfare Act (BGBl. I S. 1206, 1313) amended by Art. 1 G from 17 December 2018 I 2586.
Standard pharmacokinetics study
Mice were injected i.p. with 43 mg/kg trastuzumab (Herceptin®) and sacrificed at 1 h, 24 h, 48 h, 96 h and 168 h (see terminal sampling). The samples were flash-frozen in liquid nitrogen and stored at −80°C until analysis.
ISF-sampling with MD and cOFM probes
Aseptic surgeries
Surgeries were performed in a state-of-the-art surgical unit under strict aseptic conditions. On the day of surgical procedure, mice were injected subcutaneously with 5 mg/kg Carprofen (Rimadyl®; Zoetis, Cat. #: 400684.00.00) 30 min before initiating the anesthesia with Sevorane® (AbbVie, Cat. #: 20026181). After verification of tactile stimulus for consciousness, the anesthesia was continued using a facemask and the animal was prepared for surgery by protecting the eyes (Bepanthen®, Bayer, Cat. #: 01578675) and shaving and disinfecting the skin of the head (Braunol®, Braun Cat. #: 3864154). The mouse was wrapped into plastic foil, transported into the sterile surgical unit and placed in a dual-arm stereotaxic frame (Stoelting, Cat. #: 630L0012) with constant body temperature monitoring (CMA, Cat. #: 8003759). Still under face mask anesthesia, the head was fixed in a flat position with bregma, lambda and lateral points in the same horizontal plane. After a small incision in the skin of the head, the periosteum was softly pushed aside and, while constantly hydrating with phosphate-buffered saline (PBS) (Gibco, Cat. #: 10010–015), two anchor screws (DIN 84 A2, M1x2) were inserted in the frontal area of the skull after drilling their entry points in the skull. Care was taken not to damage the dura matter and the brain. After calibrating the stereotaxic arms to the bregma, two holes were carefully drilled for implantation of guide cannulas and dummy probes of either AtmosLM for MD (PEG-4; Eicom, Cat. #: 600.133.00 and 600.134.00) or cOFM (Joanneum Research Institute, Cat. #: cOFM-P-2-2). The coordinates were optimized based on the mouse atlas for targeting the hippocampi of both hemispheres (X: 3 mm; Y: 3.1 mm; Z: 4 mm). The placement of the cannula was validated using brain sections at the end of the experiments (see 6.1. Probe location and tissue pathology evaluation). An important experimental advantage lays in the structure of the cOFM guide canula as compared to the MD: the tip of the cOFM guide canula is composed of a plastic net, in which the cOFM probe will later be inserted, therefore not damaging the tissue before the in vivo experiment. The MD guide canula has an open end from which the MD probe, once inserted, will move beyond, and therefore locally damage the tissue. While maintained by the stereotaxic arms, the guides were fixed to the skull and to the anchor screws with glass ionomer cement for permanent head attachment (DMG, Cat. #: 110293). Once the cement cured, the subcutaneous tissue was sewed using an absorbable suture (Vicryl 7–0; Johnson & Johnson, Cat. #: EA2531H), while the skin was sewed using a silk non-absorbable suture (Prolene 6–0; Johnson & Johnson, Cat. #: EH7471H).
After the surgery, mice were injected subcutaneously with 1 mL PBS, weighed, and placed back in cages containing cellulose beddings for decreased risk of infection (Safe® Pure, Safe). For an improved acute recovery, boost gels (ClearH2O, Cat. #: 72–04-5022 and 72–02-5022) were placed in the cage and the cages then placed in a humidity-controlled chamber until awakening with ad libitum access to food and water. Post-operative care comprised subcutaneous injection of Carprofen (5 mg/kg, Rimadyl®) 24 h after surgery, and the scoring of the animals for overall wellbeing (external appearance, clinical symptoms, neuronal symptoms and behavior) at 1, 2, 3, and 7 days post-surgery. Mice were left to recover for 13–14 days before in vivo ISF-sampling experiments.
Experimental setups with MD and cOFM probes
ISF-sampling of macromolecules requires a sampling unit with large openings to allow the passage of these large structures. This will inevitably bring experimental challenges, such as high pressure across the sampling unit and fluid leakage. The AtmosLM probe from Eicom and the cOFM probe from the Joanneum Research Institute solve these issues using different strategies. While the use of push-pull fluidic systems minimizes these risks and is therefore used in both cases, the AtmosLM probes use a basic push-pull method and, in order to minimize the ultrafiltration, counterbalance the overpressure at the large pore membrane (1 MDa MWCO) with the addition of a vent hole. On the other hand, cOFM probes possess a sampling unit with macro-openings (200 to 400 µm) and solve the risks of fluid leakage via a tightly controlled fluidic system, employing a custom-made push-pull pump (Joanneum Research Institute, Cat. #: MPP102 PC). Therefore, due to these two different strategies for the ISF-sampling of macromolecules, two different experimental set-ups with different push-pull perfusion systems have been used in this study. For the MD, a CMA 402 syringe pump (Harvard Apparatus, Cat. #: CMA8003110) and 5 mL sterile and single use syringes (Hamilton, Cat. #: CMA8309022) were used as a push pump system in order to perfuse the artificial cerebrospinal fluid (aCSF) (0.52 mM CaCl₂ x 2 H2O, 48.8 mM NaCl, 0.16 mM NaH2PO4 x H2O, 0.48 mM MgSO4 x 7 H2O, 1.2 mM KCl, 10.4 mM NaHCO₃, and 0.2% BSA), while the pull component was ensured by a peristaltic pump (Microbiotech, Cat. #: MAB20). The two probes per mouse both possessed their independent push-pull systems. For the cOFM, a single pump was used for performing a synchronized push and pull (Joanneum Research Institute, Cat. #: MPP102 PC) of both probes per animal. Sterile 10 mL perfusion bags (Joanneum Research Institute, Cat. #: OFM-BAG) were connected to the push tubing and filled with aCSF. For connecting the different components of the systems (pumps and probes), fluorinated ethylene propylene (FEP) tubing was used, and the connections were secured by silicone tubing connectors (Instech Laboratories, Cat. #: MC015/10). For the MD setups, the FEP tubing (Zeus, Cat. #: 125604) were manually cut to the desired lengths, while for the cOFM setups, ready-to-use tubing sets were employed (Joanneum Research Institute, Cat. #: OFM-PP2-5033).
On both types of setups, flowmeters (Sensirion, Cat. #: SLG-0150) were included in the system to monitor the flow of each probe during the entire experiment. The flow was by default set to 1 µL/min for equilibration after probe insertion. Different flows were tested during this study as outlined in the respective sections. Before connection of the sterile probes to the tubing, the whole system was flushed offline with Cold Sterilant (VWR, Cat. #: 148–0062), subsequently washed with water and finally with aCSF 0.2% BSA in order to precoat the tubing. MD probes were first conditioned with ethanol. Both MD and cOFM probes were then flushed with aCSF 0.2% BSA to remove air bubbles and connected to the calibrated push-pull system. The in vitro recovery of the MD probes was carried out for all probes used before and after each in vivo experiment by sampling a standard solution of 1000 ng/mL Trastuzumab prepared in aCSF 0.2% BSA. The in vitro recovery for each MD probe was defined as the ratio of the concentration in the dialyzate over the concentration in the standard solution:
A mean of the percentage of pre- and post-experiment recovery was then further applied to allow the relative quantification of the MD data.
Animal connection and antibody injection
At least 30 min before the connection to the ISF-sampling systems, the mice were injected subcutaneously with Midazolam (1–2 mg/kg; Company Ratiopharm, Cat. #: T249913). A mobile narcotic device (Univentor, Cat. #: 8336000) was then used to initiate and continuously anesthetize mice with Sevorane®. While placed on a warming pad, a collar is fixed around the neck of the animal and dummies are carefully removed from the guides. Probes are placed in their respective guides and secured either using cap nuts (MD; Eicom, Cat. #: 801.315.00) or locking wedges (Joanneum Research Institute, Cat. #: cOFM-LOCK). The anesthesia was then interrupted, and mice were placed into the Raturn systems (BASi, Cat. #: MD-1409) with cellulose bedding, boost food and ad libitum access to food and water. The collar was connected to the tether and the Raturn switched on for appropriate adaptative movement of the cage.
The antibody was injected 15 h to 20 h after connection to the ISF-sampling systems. To do so, animals were gently taken from the Raturn cage and either directly injected i.p. or briefly anesthetized with Isofluorane using a mobile narcotic device for i.v. injection (tail vein). Mice were then placed back into the Raturn cages and observed until recovery.
Sample collection
Continuous sampling of interstitial fluid
ISF samples were continuously collected with a fraction bin time of 60 or 90 minutes and flow rates that varied from 0.1 µL/min to 2 µL/min. The flow was constantly monitored with the flowmeters in order to verify its stability over time and enabling a quick intervention, if any issues appeared to endanger the fluidic exchange at the sampling unit. When the fraction volumes fluctuated over 10% of the expected volume, fraction were excluded from the analysis. While carefully monitored, probes can drop out during the experiment and cannot always be rescued, thus limiting the collection of samples for the mentioned probes to parts of the investigated timeframe. Samples were kept at +4°C in the dual channel fraction collectors connected to the ISF-sampling systems (Microbiotech, Cat. #: MAB85) until being transferred to −80°C for storage.
Terminal sampling
At the end of the ISF-sampling experiment, as well as for each time point of the standard PK study, terminal sampling of blood (cardiac puncture), CSF (cisterna magna puncture) and perfused brain (were performed. The samples were flash-frozen in liquid nitrogen and stored at −80°C until analysis.
The brain perfusion was performed after CSF withdrawal and cardiac puncture. Under constant isoflurane anesthesia, the left ventricle was cut and the outlet of a peristaltic pump previously primed with cold PBS and Heparin (1000 U/mL; RatioPharm, Cat#: N68542.04) was introduced into the carotid artery. After clamping the tubing to the artery, the peristaltic pump was started with a flow of 2.67 mL/min and the systemic circulation was flushed for 10 min. The brain was visually inspected for blood contamination after extraction from the skull.
Quantification of human IgGs by targeted LC-MS/MS
To quantify human IgG1, a targeted LC-MS/MS method using a unique tryptic signature peptide (VVSVLTVLHQDWLNGK) from the heavy chain of the IgG1 backbone was used. Undiluted fetal bovine serum (FBS), wild-type mice brain (Biotrend) or 0.2% FBS in PBS was used as a surrogate matrix for plasma, brain or CSF, respectively, for standard preparation. Calibration curves were obtained spiking the corresponding human IgG from 2.5 to 10 000 ng/mL. Quality controls were prepared by spiking the corresponding human IgG into rat plasma or CSF pools. Quantification of the human IgG was performed in 50 µL of calibration standard or sample. All samples, standards and QCs were spiked with 550 pg of isotopically labeled (13 C-, 15 N-labeled Lysin and Arginin) human IgG.
Frozen mouse brain tissues were thawed on ice and homogenized in lysate buffer (50 mM Tris, pH7.4, 150 mM NaCl, 20 mM NaF, 1 mM Na3VO4, 0.5 mM MgSO4, cOmplete protease inhibitor with EDTA (Roche, Cat. #: 11697498001) and PhosSTOP phosphatase inhibitor (Roche, Cat. #: 04906845001) at 10 µl/mg tissue using a cooled bead ruptor (FastPrep-24 5 G System, MP Biomedicals, Cat. #: SKU 116005500).
Human IgGs from 1:100 diluted plasma (v/v with PBS) or brain tissue were enriched using sepharose-coupled protein-A plus (Thermo Scientific, Cat. #: 22812) prior to sample preparation for mass spectrometry. Briefly, 50 µL of diluted plasma was incubated for 2 hours with 40 µL sepharose-coupled protein-A plus in a glass fiber 96-well filter plate with 3 µm pores (custom-made plates, Macherey and Nagel). After washing protein-A plus-captured human IgGs three-times with PBS, the protein was eluted into a 2 mL 96-well plate Protein LoBind (Eppendorf) using 450 µL IgG eluting buffer (Thermo Scientific, Cat#: 21004).
Calibration standards, CSF or human IgGs-enriched from plasma were denaturated with 25 µL 250 mM dithiothreitol (Sigma-Aldrich, Cat#: 43816) and alkylated with 25 µL 600 mM iodoacetamide (Sigma-Aldrich, Cat#: I6125) before being digested with 25 µg Trypsin/LysC (Promega, Cat. #: Ax499B) and 450 µL Tris-Buffer 100 mM pH 8 at 60°C for 1 h. Samples were desalted on a solid phase extraction plate (10 mg Waters Oasis HLB 30 µm pore-size) according to the manufacturer’s protocol and analyzed on a Waters TQs mass spectrometer operating in multiple reactions monitoring using the following transitions: human IgG 603,34 → 805,44 isotopically labeled human IgG 606,01 → 809,45. Chromatographic separation was achieved on an Acquity Peptide CSH C18 column (2.1 x 150 mm, Waters, # 186006938) with a flow rate of 250 µL/min and a linear gradient elution starting from 90% water/10% acetonitrile with 0.1% formic acid to 50% water/50% acetonitrile with 0.1% formic acid within 10 minutes.
Probe location and tissue pathology evaluation
The brain areas where the probes were inserted were collected and fixed directly after perfusion with 10% Formalin (Sigma-Aldrich, Cat. #: HT501128). The brains were trimmed and embedded according to the localization of the guide cannulas and probes. Serial sections (coronal) at 3–4 µm were obtained using a rotation microtome (MICROM International GmbH) and stained with H&E (Richard-Allan Scientific™ Hematoxylin, Cat. #: 7211; Richard-Allan Scientific™ Eosin-Y alcoholic, Cat. #: 71204).
Selected brain slices were assessed by a veterinary pathologist (German board certified) for probes location and inflammatory processes. A report on morphologic histopathology changes expressed in an overall pathology score and targeting of the desired localization was established using a grading system with five severity grades (minimal, mild, moderate, marked, severe).Citation41,Citation42 Minimal and mild grades were used when the finding was altered from the normal appearance of the tissue (which was usually the case when having a surgery/implantation of guide canula/a probe) but was of low severity and usually with less than 25% involvement of the parenchyma. This type of change would neither be expected to significantly affect the function of the specific organ/tissue nor have a significant effect on the overall health of the animal. A moderate grade was used for findings that were of sufficient severity and/or extent (up to 50% of the parenchyma) and the function of the organ/tissue may be adversely affected, but not to the point of organ failure. The health status of the animal may or may not have been affected, generally findings graded as moderate are not life-threatening. A marked grade was used for findings that were of higher severity and/or extent of more than 50% (51to 75%) of the parenchyma was affected. The health status of the animal may have been affected, it may or may not have been life-threatening. A severe grade was used for findings that were extensive enough to cause significant organ/tissue dysfunction or failure and/or the extent was over 75% (76% to 100%) of parenchyma affected. The health status of the animal is likely affected, and the degree of change may be life-threatening. A score of mild to moderate inflammation and below was regarded as acceptable considering the performed surgery. This score was taken into consideration for evaluation of the microdialysis data.
Data analysis and statistics
Results are presented as mean ± SEM. PK parameters were estimated by semi-parametric methods using a set of macro-routines in a spreadsheet (Pharmkin/MS Excel).
Extrapolation for the absolute quantification was performed with GraphPad Prism 5 using the one phase decay exponential equation:
Y0 is the Y value when X (time) is zero. It is expressed in the same units as Y, Plateau is the Y value at infinite times, expressed in the same units as Y. K is the rate constant, expressed in reciprocal of the X axis time units. If X is in minutes, then K is expressed in inverse minutes. The statistical evaluation of the data was performed with GraphPad Prism 5.
List of abbreviations
| aCSF | = | Artificial cerebrospinal fluid |
| AUC0-t | = | Area under the curve from 0 to t |
| BBB | = | Blood-brain-barrier |
| C0 | = | Absolute concentration |
| CL/f | = | Apparent clearance |
| Cmax | = | Maximum Concentration observed |
| CNS | = | Central nervous system |
| cOFM | = | Cerebral open flow microperfusion |
| CSF | = | Cerebrospinal fluid |
| CSS | = | Concentrations at steady state/terminal time point |
| FBS | = | Fetal bovine serum |
| FEP | = | Fluorinated ethylene propylene |
| H&E | = | Hematoxylin and eosin |
| HER2 | = | Human epidermal growth factor receptor-2 |
| i.p. | = | Intraperitoneal |
| i.v. | = | Intravenous |
| ISF | = | Interstitial fluid |
| mAb(s) | = | Monoclonal antibody(ies) |
| MD | = | Microdialysis |
| MWCO | = | Molecular weight cutoff |
| p.a. | = | Post-application |
| PBS | = | Phosphate-buffered saline |
| PK | = | Pharmacokinetics |
| T/S | = | Tissue to serum ratio |
| t1/2 | = | Half-life |
| Tmax | = | Time of Maximum concentration observed |
Disclosure of interest
Florie Le Prieult, Erica Barini, Loic Laplanche, Kerstin Schlegel, and Mario Mezler are employees of AbbVie and may own AbbVie stock. AbbVie sponsored and funded the study; contributed to the design; participated in the collection, analysis, and interpretation of data, and in writing, reviewing, and approval of the final publication.
Supplemental Material
Download Zip (2.2 MB)Acknowledgments
We would like to thank all AbbVie staff who helped for the execution and analysis of the studies mentioned in this manuscript: Ina Mairhofer, Marcus Meinhardt, Jonas Hoppe, Aysel Güler, Philipp Münzer, Lisa Riesbeck, Franziska Hanke, Klaus Diry, Klaus Magin, and Volker Berweck. We are also grateful to Thomas Altendorfer-Kroath and Thomas Birngruber from JOANNEUM RESEARCH for providing us training with cOFM. No funding to disclose. Special thanks to Karen Bodie of AbbVie for helping with pathological evaluations, Hans-Jürgen Mayer and Christian Schäfer for supporting the implementation of flowmeters into the MD and cOFM setups, and Diana Clausznitzer for all her valuable inputs in discussions around ISF/CSF.
Supplementary material
Supplemental data for this article can be accessed on the publisher’s website
References
- Southwell AL, Patterson PH. Antibody therapy in neurodegenerative disease. Rev Neurosci. 2010;21:273–14.
- Schlegel K, Awwad K, Heym RG, Holzinger D, Doell A, Barghorn S, Jahn TR, Klein C, Mordashova Y, Schulz M, et al. N368-Tau fragments generated by legumain are detected only in trace amount in the insoluble Tau aggregates isolated from AD brain. Acta Neuropathol Commun. 2019;7(1):177. doi:10.1186/s40478-019-0831-2.
- Dong X. Current strategies for brain drug delivery. Theranostics. 2018;8(6):1481–93. doi:10.7150/thno.21254.
- Pardridge WM. Delivery of biologics across the blood-brain barrier with molecular trojan horse technology. BioDrugs. 2017;31(6):503–19. doi:10.1007/s40259-017-0248-z.
- Cao Y, Balthasar JP, Jusko WJ. Second-generation minimal physiologically-based pharmacokinetic model for monoclonal antibodies. J Pharmacokinet Pharmacodyn. 2013;40(5):597–607. doi:10.1007/s10928-013-9332-2.
- Eigenmann MJ, Karlsen TV, Krippendorff BF, Tenstad O, Fronton L, Otteneder MB, Wiig H. Interstitial IgG antibody pharmacokinetics assessed by combined in vivo- and physiologically-based pharmacokinetic modelling approaches. J Physiol. 2017;595(24):7311–30. doi:10.1113/JP274819.
- Lada MW, Kennedy RT. Quantitative in vivo monitoring of primary amines in rat caudate nucleus using microdialysis coupled by a flow-gated interface to capillary electrophoresis with laser-induced fluorescence detection. Anal Chem. 1996;68(17):2790–97. doi:10.1021/ac960178x.
- Parrot S, Bert L, Mouly-Badina L, Sauvinet V, Colussi-Mas J, Lambás-Señas L, Robert F, Bouilloux JP, Suaud-Chagny MF, Denoroy L, et al. Microdialysis monitoring of catecholamines and excitatory amino acids in the rat and mouse brain: recent developments based on capillary electrophoresis with laser-induced fluorescence detection–a mini-review. Cell Mol Neurobiol. 2003;23(4–5):793–804. doi:10.1023/A:1025009221285.
- Chefer VI, Thompson AC, Zapata A, Shippenberg TS. Overview of brain microdialysis. Curr Protoc Neurosci. 2009; Chapter 7, Unit7:1.
- Winter CD, Iannotti F, Pringle AK, Trikkas C, Clough GF, Church MK. A microdialysis method for the recovery of IL-1beta, IL-6 and nerve growth factor from human brain in vivo. J Neurosci Methods. 2002;119(1):45–50. doi:10.1016/S0165-0270(02)00153-X.
- Hillered L, Vespa PM, Hovda DA. Translational neurochemical research in acute human brain injury: the current status and potential future for cerebral microdialysis. J Neurotrauma. 2005;22(1):3–41. doi:10.1089/neu.2005.22.3.
- Clough GF. Microdialysis of large molecules. AAPS J. 2005;7(3):E686–92. doi:10.1208/aapsj070369.
- Jadhav SB, Khaowroongrueng V, Derendorf H. Microdialysis of Large Molecules. J Pharm Sci. 2016;105(11):3233–42. doi:10.1016/j.xphs.2016.08.016.
- Chang HY, Morrow K, Bonacquisti E, Zhang W, Shah DK. Antibody pharmacokinetics in rat brain determined using microdialysis. MAbs. 2018;10(6):843–53. doi:10.1080/19420862.2018.1473910.
- Takeda S, Sato N, Ikimura K, Nishino H, Rakugi H, Morishita R. Novel microdialysis method to assess neuropeptides and large molecules in free-moving mouse. Neuroscience. 2011;186:110–19. doi:10.1016/j.neuroscience.2011.04.035.
- Jacobson I, Sandberg M, Hamberger A. Mass transfer in brain dialysis devices–a new method for the estimation of extracellular amino acids concentration. J Neurosci Methods. 1985;15(3):263–68. doi:10.1016/0165-0270(85)90107-4.
- Shippenberg TS, Thompson AC. Overview of microdialysis. Curr Protoc Neurosci. 2001; Chapter 7, Unit7:1.
- Boespflug EL, Iliff JJ. The emerging relationship between interstitial fluid-cerebrospinal fluid exchange, amyloid-β, and sleep. Biol Psychiatry. 2018;83(4):328–36. doi:10.1016/j.biopsych.2017.11.031.
- Li X, Jusko WJ, Cao Y. Role of interstitial fluid turnover on target suppression by therapeutic biologics using a minimal physiologically based pharmacokinetic Model. J Pharmacol Exp Ther. 2018;367(1):1–8. doi:10.1124/jpet.118.250134.
- Trickler WJ, Miller DW. Use of osmotic agents in microdialysis studies to improve the recovery of macromolecules. J Pharm Sci. 2003;92(7):1419–27. doi:10.1002/jps.10410.
- Altendorfer-Kroath T, Schimek D, Eberl A, Rauter G, Ratzer M, Raml R, Sinner F, Birngruber T. Comparison of cerebral Open Flow Microperfusion and Microdialysis when sampling small lipophilic and small hydrophilic substances. J Neurosci Methods. 2019;311:394–401. doi:10.1016/j.jneumeth.2018.09.024.
- Bien-Ly N, Yu YJ, Bumbaca D, Elstrott J, Boswell CA, Zhang Y, Luk W, Lu Y, Dennis MS, Weimer RM, et al. Transferrin receptor (TfR) trafficking determines brain uptake of TfR antibody affinity variants. J Exp Med. 2014;211(2):233–44. doi:10.1084/jem.20131660.
- Rosenbloom AJ, Sipe DM, Weedn VW. Microdialysis of proteins: performance of the CMA/20 probe. J Neurosci Methods. 2005;148(2):147–53. doi:10.1016/j.jneumeth.2005.04.018.
- De Lange EC, Danhof M, De Boer AG, Breimer DD. Methodological considerations of intracerebral microdialysis in pharmacokinetic studies on drug transport across the blood-brain barrier. Brain Res Brain Res Rev. 1997;25(1):27–49. doi:10.1016/S0165-0173(97)00014-3.
- Mitala CM, Wang Y, Borland LM, Jung M, Shand S, Watkins S, Weber SG, Michael AC. Impact of microdialysis probes on vasculature and dopamine in the rat striatum: a combined fluorescence and voltammetric study. J Neurosci Methods. 2008;174(2):177–85. doi:10.1016/j.jneumeth.2008.06.034.
- Birngruber T, Ghosh A, Hochmeister S, Asslaber M, Kroath T, Pieber TR, Sinner F. Long-term implanted cOFM probe causes minimal tissue reaction in the brain. PLoS One. 2014;9(3):e90221. doi:10.1371/journal.pone.0090221.
- Kamath AV. Translational pharmacokinetics and pharmacodynamics of monoclonal antibodies. Drug Discov Today Technol. 2016;21–22:75–83. doi:10.1016/j.ddtec.2016.09.004.
- Wolak DJ, Pizzo ME, Thorne RG. Probing the extracellular diffusion of antibodies in brain using in vivo integrative optical imaging and ex vivo fluorescence imaging. J Control Release. 2015;197:78–86. doi:10.1016/j.jconrel.2014.10.034.
- Webster CI, Caram-Salas N, Haqqani AS, Thom G, Brown L, Rennie K, Yogi A, Costain W, Brunette E, Stanimirovic DB. Brain penetration, target engagement, and disposition of the blood-brain barrier-crossing bispecific antibody antagonist of metabotropic glutamate receptor type 1. FASEB J. 1927–40;2016:5.
- Wang Q, Delva L, Weinreb PH, Pepinsky RB, Graham D, Veizaj E, Cheung AE, Chen W, Nestorov I, Rohde E, et al. Monoclonal antibody exposure in rat and cynomolgus monkey cerebrospinal fluid following systemic administration. Fluids Barriers CNS. 2018;15(1):10. doi:10.1186/s12987-018-0093-6.
- Tabernero A, Granda B, Medina A, Sánchez-Abarca LI, Lavado E, Medina JM. Albumin promotes neuronal survival by increasing the synthesis and release of glutamate. J Neurochem. 2002;81(4):881–91. doi:10.1046/j.1471-4159.2002.00843.x.
- Vanni S, Zattoni M, Moda F, Giaccone G, Tagliavini F, Haïk S, Deslys JP, Zanusso G, Ironside JW, Carmona M, et al. Hemoglobin mRNA Changes in the Frontal Cortex of Patients with Neurodegenerative Diseases. Front Neurosci. 2018;12:8. doi:10.3389/fnins.2018.00008.
- Müller M, Müller M. SpringerLink Microdialysis in Drug Development, 1st 2013. New York: Springer New York: Imprint: Springer; 2013.
- Thiollier T, Wu C, Porras G, Bezard E, Li Q, Zhang J, Contamin H. Microdialysis in awake macaque monkeys for central nervous system pharmacokinetics. Animal Model Exp Med. 2018;1(4):314–21. doi:10.1002/ame2.12046.
- Myers RD, Adell A, Lankford MF. Simultaneous comparison of cerebral dialysis and push-pull perfusion in the brain of rats: a critical review. Neurosci Biobehav Rev. 1998;22(3):371–87. doi:10.1016/S0149-7634(97)00025-0.
- Kottegoda S, Shaik I, Shippy SA. Demonstration of low flow push-pull perfusion. J Neurosci Methods. 2002;121(1):93–101. doi:10.1016/S0165-0270(02)00245-5.
- Menacherry S, Hubert W, Justice JB. In vivo calibration of microdialysis probes for exogenous compounds. Anal Chem. 1992;64(6):577–83. doi:10.1021/ac00030a003.
- Cremers TI, De Lange E C, De Vries MG, Ebert B, Huinink KD, Van Loon J. P, V D Hart M, Westerink B H. Quantitative microdialysis using modified ultraslow microdialysis: direct rapid and reliable determination of free brain concentrations with the MetaQuant technique. J Neurosci Methods. 2009;178:249–54.
- Benveniste H. Brain microdialysis. J Neurochem. 1989;52(6): 1667–79.
- Schaupp L, Ellmerer M, Brunner GA, Wutte A, Sendlhofer G, Trajanoski Z, Skrabal F, Pieber TR, Wach P. Direct access to interstitial fluid in adipose tissue in humans by use of open-flow microperfusion. Am J Physiol. 1999;276(2):E401–8. doi:10.1152/ajpendo.1999.276.2.E401.
- Shackelford C, Long G, Wolf J, Okerberg C, Herbert R. Qualitative and quantitative analysis of nonneoplastic lesions in toxicology studies. Toxicol Pathol. 2002;30(1):93–96. doi:10.1080/01926230252824761.
- Schafer KA, Eighmy J, Fikes JD, Halpern WG, Hukkanen RR, Long GG, Meseck EK, Patrick DJ, Thibodeau MS, Wood CE, et al. Use of Severity Grades to Characterize Histopathologic Changes. Toxicol Pathol. 2018;46(3):256–65. doi:10.1177/0192623318761348.