
ABSTRACT
Therapeutic immunoglobulin G (IgG) antibodies have comparatively long half-lives because the neonatal Fc receptor (FcRn) binds to the IgG Fc at acidic pH in the endosome and protects IgG from degradation. To further prolong the half-lives, amino acid-substituted antibodies having high affinity to FcRn are being developed, and one such therapeutic antibody (ravulizumab) has been approved. In this study, we investigated the binding property to FcγR and the conformation of seven FcRn affinity-modulated adalimumab variants to clarify the impact of the amino acid substitutions on the function and conformation of IgG Fc. The amino acid substitutions in T254-P261 caused a change in deuterium uptake into some regions of Fc in HDX-MS analysis, but those at T311, M432 and N438 did not cause such a change. The conformations around F245-L255 (FLFPPKPKDTL) were particularly influenced by the amino acid substitution in M256-P261, and the conformational changes of this region were correlated with the decrease of the affinity to FcγRIIIa. Additionally, we investigated the conformational difference of Fc between a Fc fusion protein (etanercept) and a native IgG (adalimumab). Although the Fc fusion proteins were expected to have similar FcRn affinity to IgGs, the affinity of etanercept to FcRn was lower than that of adalimumab, and its half-life was shorter than those of the IgG antibodies. Differences in deuterium uptakes were observed in the two regions where they were also detected in the adalimumab variants, and the conformational differences appeared to be an important factor for the low FcRn affinity of etanercept.
Introduction
Immunoglobulin G (IgG) antibodies have comparatively long half-lives; for example, the half-life of IgG1 is approximately 21 days in healthy humans.Citation1 This prolonged half-life of IgG antibodies can be explained by their interaction with neonatal Fc receptor (FcRn). FcRn, a heterodimer of the MHC-class-I-like heavy chain and the β2-microglobulin (β2m) light chain, plays a critical role in regulating IgG homeostasis.Citation2–4 FcRn binds to the Fc domain of IgG at pH 6.0–6.5, but binds weakly or not at all at pH 7.0–7.5.Citation5 Therefore, FcRn protects IgG from degradation by binding to IgG in the endosomes, then releasing IgG into plasma.Citation6
IgG antibodies have become an important therapeutic option for many diseases, and many types of engineered antibodies have recently been developed. Among these engineered antibodies, amino acid-substituted antibodies having high affinity to FcRn are being developed to prolong the half-lives of IgG antibodies and thereby reduce the required dose and frequency; a prominent example is the recently approved therapeutic antibody ravulizumab.Citation7,Citation8 Ravulizumab (ALXN1210) differs from eculizumab by 4 amino acid substitutions, and like eculizumab is a complement component C5 inhibitor. Two of the amino acid substitutions are M428L and N434S (LS mutation) in the Fc region; these modulate the affinity to FcRn.Citation9 The remaining two amino acid substitutions are in the complementarity-determining region; these substitutions modulate the affinity to the antigen.Citation10 The terminal half-life of ravulizumab shown in the prescribing information is 49.7 ± 8.9 days, which is approximately 4-fold longer than that of eculizumab and other therapeutic antibodies, and the interval of maintenance doses is 8 weeks.Citation7
In addition to ravulizumab, satralizumab, which is an anti-IL-6 receptor antibody with increased affinity to FcRn, has been approved, and therapeutic antibodies with YTE (M252Y/S254T/T256E) mutation, such as MEDI8897 (anti-respiratory syncytial virus (RSV) antibody) and MEDI4893 (anti-Staphylococcus aureus alpha-toxin antibody), are in clinical trials.Citation11–13 Moreover, many other mutations have been studied for their potential to modulate affinity to FcRn, such as the IH (P257I/N434H), N434H, QA(T307Q/N434A) and QL (T250Q/M428L) mutations.Citation14–18 Most of these mutations are located in the FcRn-binding sites (interface of CH2-CH3) of the Fc region, and thus the amino acid substitutions may influence the conformation and other functions of Fc (e.g., the binding to FcγR and C1q). In fact, it has been reported that introduction of a YTE mutation into humanized anti-RSV monoclonal antibody MEDI-524 decreased the affinity to FcγRIIIa, and introduction of some other substitutions also influenced the affinity to Fcγ receptors.Citation19,Citation20 Moreover, the conformational change by YTE mutation has been well studied by crystal structure determination and hydrogen deuterium exchange-mass spectrometry (HDX-MS), and it was reported that the deuterium uptake (conformation) of some regions of Fc were different between the native IgG and YTE variant.Citation21–23 However, studies about the conformational changes of Fc caused by the introduction of amino-acid substitutions in order to enhance FcRn binding have been limited to YTE variants, and the effects of amino acid substitutions intended to enhance FcRn affinity on the conformation of Fc and the relation between the conformational changes and the function of Fc remain to be elucidated.
In this study, we prepared seven engineered antibodies including a YTE variant (six for enhancing and one for impairing FcRn binding) based on an anti-tumor necrosis factor (TNF) therapeutic antibody (adalimumab), and examined their binding to FcγRs and the conformation of their Fc regions. The conformation of Fc was analyzed by HDX-MS, which has been used extensively to analyze protein conformations in solution.Citation24–26
We also evaluated the functional and structural changes of Fc that resulted from substituting another protein for the antigen-binding fragment (Fab). Etanercept is a therapeutic fusion protein consisting of the extracellular portion of the TNF receptor (TNFR) and IgG Fc, and its half-life is shorter (approximately four days) than those of IgG antibodies.Citation27 Previously, we showed that the affinity of etanercept to FcRn was approximately 4-fold lower than that of adalimumab.Citation28 Since the affinity of etanercept to FcRn increased after papain digestion, it seems likely that the receptor domain of the Fc-fusion protein makes a difference in the conformation of the FcRn-binding region of Fc or interferes with the binding between the Fc domain and FcRn by steric hindrance.Citation28 In this study, the conformation of etanercept and the binding properties to Fcγ receptors were compared to those of adalimumab to clarify the conformational and functional changes of the Fc by substitution of the Fab region by TNFR.
Results
Production of engineered antibodies having high or low affinity to FcRn
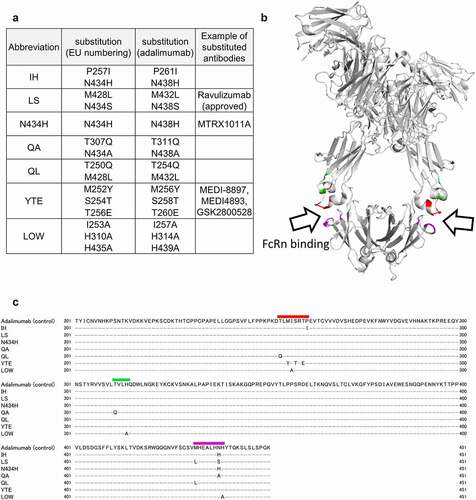
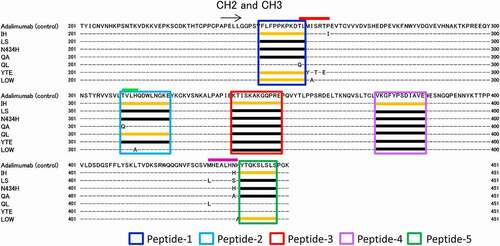
To prolong the half-lives of IgG antibodies while also realizing reductions in the dose and injection frequency, amino acid-substituted antibodies having high affinity to FcRn have been developed. In this study, the seven engineered antibodies (six for enhancing and one for impairing FcRn binding) shown in were analyzed to clarify the impact of the amino acid substitutions on the function and conformation of IgG Fc. Amino acid substitutions of the LOW variant were a mixture of amino acid mutations that have been reported to decrease the affinity to FcRn.Citation29 Although the positions of amino acid substitutions are shown by both the standardized number of IgG1 (EU numbering) and the number of the adalimumab sequence in , the positions are indicated by the number of the adalimumab sequence hereafter. Positions of the amino acid substitutions are shown in the 3-dimensional (3D) structure model of IgG (protein data bank ID: 1HZH) and in the amino acid sequences (, 1c). The amino acid-substitution sites are divided into three regions (indicated by colors) that are proximal to the FcRn-binding region.Citation29
Figure 1. Adalimumab variants used in this study. (a) Abbreviations of adalimumab variants and their amino acid-substitution sites. (b) Positions of the amino acid substitutions shown in the 3D structure model of IgG (protein data bank ID: 1HZH). The positions are shown in color. (c) Amino-acid sequences of adalimumab variants. The substituted amino acids are shown in sequences of the variants, and the regions containing the amino acid substitutions are shown in color. The colors used correspond with those in (b)
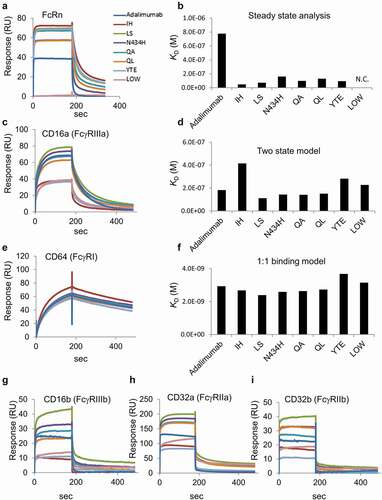
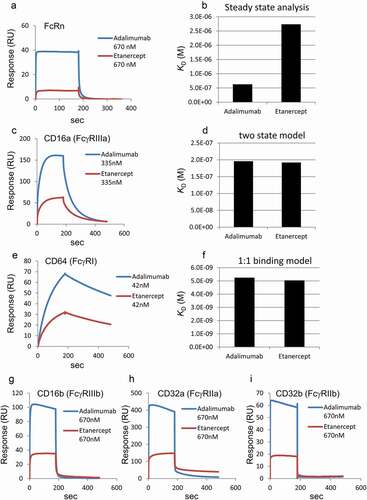
The engineered antibodies were produced as described in the Materials and Methods section. Electrophoretic patterns of the produced antibodies were similar to that of commercially available adalimumab (Humira®) (Supplemental ). The size of these antibodies calculated by dynamic light scattering (DLS) was similar to that of adalimumab (about 10 nm), and the DLS peaks were almost single (the area volume average of the main peaks was almost 100%, as shown in Supplemental ). Moreover, multimers were scarcely detected even in the size-exclusion chromatography analysis (Supplemental ). Therefore, the produced antibodies were considered to have sufficient purity for analyses. Their binding properties to FcRn were analyzed using surface plasmon resonance (SPR). The analytes were injected at the concentrations of 670, 335, 168, 83.8, and 41.9 nM. The sensorgrams at the concentration of 670 nM and the KD values calculated by steady state analyses are shown in . The FcRn affinity of the engineered antibodies with amino acid substitutions to enhance FcRn-binding was higher than that of adalimumab, and the LOW variant did not bind FcRn, as expected.
Figure 2. SPR analyses of the binding between Fc receptors and adalimumab variants. (a) Representative sensorgrams of FcRn binding. Immobilized level of FcRn, approximately 50 RU; Analytes, 670 nM. (b) KD values of FcRn binding calculated by steady state analysis. The analyte concentrations used for the calculation were 10.5, 20.9, 41.9, 83.8, 168, 335 and 670 nM for the IH, LS, N434H, QA, QL and YTE variants, and 41.9, 83.8, 168, 335, 670 and 1340 nM for native adalimumab. N.C., not calculated. (c) Representative sensorgrams of CD16a (FcγRIIIa) binding. Capture level of CD16a: approximately 120 RU; Analytes: 335 nM. (d) KD values of FcγRIIIa binding calculated by a two-state model. The analytes concentrations used for the analyses were 20.9, 41.9, 83.8, 168 and 335 nM. The analyzed fitted curve is shown in Supplemental Figure 3. (e) Representative sensorgrams of CD64 (FcγRI) binding. Capture level of CD64: approximately 60 RU; Analytes: 41.9 nM. (f) KD values of FcγRI binding calculated by a 1:1 binding model. The analytes concentrations used for the analyses were 2.62, 5.23, 10.5, 20.9 and 41.9 nM. The analyzed fitted curve is shown in Supplemental Figure 4. (g–i) Representative sensorgrams of CD16b (FcγRIIIb), CD32a (FcγRIIa) and CD32b (FcγRIIb) binding. Capture levels of CD16b, CD32a and CD32b: approximately 120 RU, 190 RU and 240 RU, respectively. Analytes: 670 nM. Colors of the sensorgrams in (c), (e), (g), (h) and (i) are the same as those in (a)
SPR analyses of the affinity between engineered antibodies and Fcγ receptors
We investigated the impact of the amino acid substitutions that modulate the affinity to FcRn on the FcγR-binding properties of the engineered antibodies. Five species of Fcγ receptors (FcγRI-His, FcγRIIa-His, FcγRIIb-His, FcγRIIIa-His and FcγRIIIb-His) were captured to a sensor chip via anti-His antibody, and then the analytes were injected at the concentration described in the figure legend (). The sensorgrams of FcγRIIa, FcγRIIb, FcγRIIIa and FcγRIIIb varied according to the species of amino acid substitutions (), although those of cγRI were not very different (). Since it was reported that a two-state model could be used to calculate the KD value of FcγRIIIa bindingCitation30–32 and we confirmed that long-term injection delayed the rate of dissociation as seen in the two-state reaction (data not shown), the affinity of FcγRIIIa was calculated using a two-state model. The variants of IH, YTE and LOW showed low responses in the sensorgrams, and the KD values were comparatively higher than those of adalimumab (, and Supplemental ). The KD values of FcγRI calculated using a 1:1 binding model differed slightly among the variants, but the difference was less pronounced than in the case of FcγRIIIa ( and Supplemental ).
Figure 3. Sequence coverage map obtained by HDX-MS of intact adalimumab. The detected peptides were used to compare the deuterium uptake between samples
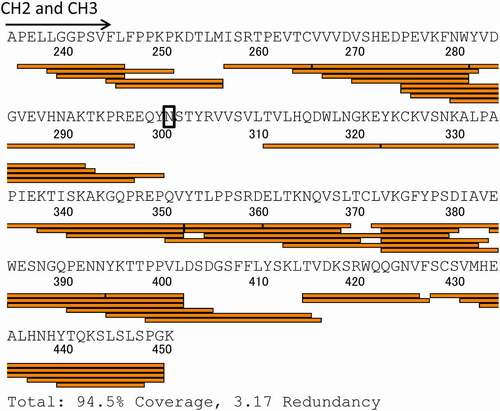
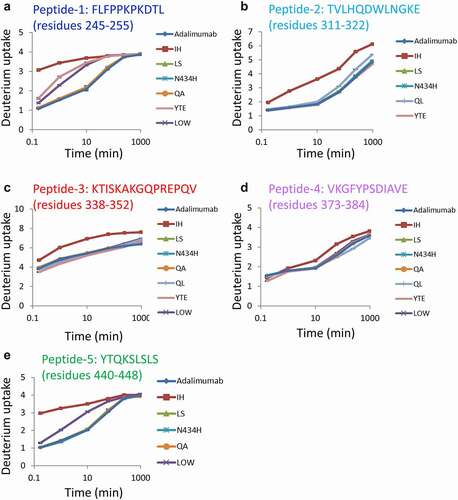
Figure 4. HDX-MS analyses. (a–e) Sequences and uptake plots of the peptides with variable deuterium levels. All samples were analyzed three times, and the data are shown as mean±SD. The residues are shown by the number of the adalimumab sequence
The KD values of FcγRIIa, FcγRIIb and FcγRIIIb could not be calculated because the dissociation rates were too fast to analyze by sensorgram fitting and the usable concentrations of the engineered antibodies were too low to calculate by steady-state analysis. However, the responses of the IH, YTE and LOW variants to FcγRIIa, FcγRIIb and FcγRIIIb tended to be low, as with the responses of these same variants to FcγRIIIa ( and 2i). At least in the case of the IH, YTE and LOW variants, the amino acid substitutions seemed to affect the conformation of the Fc. Next, therefore, ; therefore,we investigated the sites of conformational change of Fc using HDX-MS.
Analyses of the conformation of adalimumab variants using HDX-MS
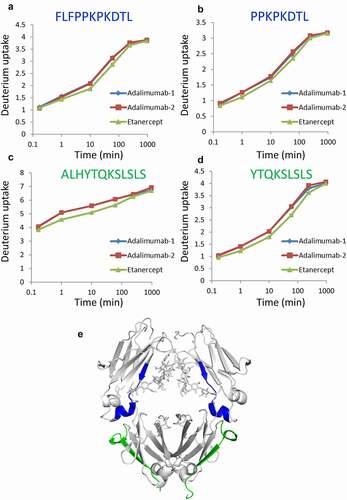
The sequence coverage map obtained by HDX-MS analysis of the control adalimumab is shown in . Other than the N-glycosylation site, almost all sites of the full-length Fc were covered, and the deuterium uptake by the detected peptides was compared among samples. Here, the peptides having amino acid substitutions were excluded from the analysis of deuteration level because different sequence peptides could not be compared directly by HDX-MS analysis. –4e show the sequences and uptake plots of the peptides with variable deuterium levels. At the region of Peptide-1 (residues 245–255: FLFPPKPKDTL), the IH, YTE and LOW variants showed higher uptake of deuterium than adalimumab did (), and at the region of Peptide-5 (residues 440–448: YTQKSLSLS), the IH and LOW variants showed higher uptake (). Since Peptide-5 of the YTE variant could not be detected, possibly due to the lower generation of this peptide by pepsin digestion, the deuterium uptake could not be compared with that of adalimumab. At the sequences of Peptide-2 (residues 311–322: TVHQDWLNGKE), Peptide-3 (residues 338–352: KTISKAKGQPREPQV) and Peptide-4 (residues 373–384: VKGFYPSDIAVE), the IH variant showed significantly higher uptake than adalimumab and the other variants did, and at the sequence of Peptide-2, the QL variants showed slightly higher uptake. The uptake plots of all peptides monitored in this study are shown in Supplemental . The uptake plots of the peptides overlapping with Peptide-1 were similar to that of Peptide-1 shown in .
Figure 5. Regions with variable deuterium levels in the sequences of adalimumab variants. The colored boxes show the regions with variable deuterium levels. The orange lines in the colored boxes show the peptides with deuterium uptake different from that of adalimumab, and the black lines in the boxes show the peptides with deuterium uptake levels similar to those of adalimumab
The regions with variable deuterium levels in the sequences of adalimumab variants are shown in . The colored lines above the sequences are the regions containing the amino acid-substitution sites that are also shown in , and the colored boxes show the regions with variable deuterium levels. Since the deuterium uptakes were monitored using the peptides of adalimumab as the library, the peptides containing the amino acid substitutions (e.g., Peptide-1 of QL variant) could not be detected. Concerning the regions of Peptides 1–5, the peptides having deuterium uptake different from that of adalimumab are shown by an orange line, the peptides having deuterium uptake similar to that of adalimumab are shown by a black line, and the peptides that could not be detected are shown without a line.
The regions with variable deuterium levels are shown in the 3D structure model (). Peptides 1–5 in correspond with those in . The mutation sites and the peptides with variable deuterium levels of each variant are shown in . The amino acid substitutions in the residues T254–P261 described by a red line in and tended to affect the conformation of IgG Fc. The deuterium uptakes of Peptide-1 were particularly variable, and correlated with the affinity to FcγRIIIa ().
Figure 6. The regions with variable deuterium levels in the 3D structure of IgG Fc. (a) All regions with variable deuterium levels. Peptides 1–5 correspond to those in Figure 4 and 5. (b–h) The amino acid substitution sites and the peptides with variable deuterium levels of each variant
Differences in the binding property and conformation of Fc between adalimumab and etanercept
We next compared the binding properties to Fc receptors and the conformation of Fc of etanercept, a TNFR-Fc fusion protein, to those of adalimumab. (panels a and b) shows the FcRn binding of adalimumab and etanercept. The response of the sensorgrams of etanercept was lower than that of adalimumab, and the calculated KD value of etanercept was about fourfold higher than that of adalimumab, as in our previous report.Citation28 The KD values for the binding to FcγRI and FcγRIIIa were similar between adalimumab and etanercept, but the sensorgrams of these therapeutic proteins did not correspond () because of the difference in the association and dissociation rate constants (Supplemental Table 1). Although the KD values of the binding of FcγRIIa, FcγRIIb and FcγRIIIb to adalimumab and etanercept could not be estimated because of the fast dissociation, the sensorgrams of the two proteins were different (). These data indicate that the fusion of the receptor region (i.e., the extracellular domain of TNFR) to the Fc affects the binding between Fc and Fc receptors.
Figure 7. SPR analyses of the binding of adalimumab and etanercept to Fc receptors. (a) Representative sensorgrams of FcRn binding. (b) KD values of FcRn binding calculated by steady state analysis. (c) Representative sensorgrams of CD16a (FcγRIIIa) binding. Capture level of CD16a: approximately 250 RU. (d) KD values of FcγRIIIa binding calculated by a two-state model. (e) Representative sensorgrams of CD64 (FcγRI) binding. Capture level of CD64: approximately 80 RU. (f) KD values of FcγRI binding calculated by a 1:1 binding model. (g–i) Representative sensorgrams of CD16b (FcγRIIIb), CD32a (FcγRIIa) and CD32b (FcγRIIb) binding. Capture levels of CD16b, CD32a and CD32b: approximately 400 RU, 600 RU and 480 RU, respectively
To determine the differences in the conformation of Fc, HDX-MS analyses were performed. The uptake plots of all peptides monitored are shown in Supplemental . The deuterium uptake plots of peptides that exhibited a difference between adalimumab and etanercept are shown in –8d. There were two regions that showed differences in deuterium uptake levels (the peptides shown in (a) and (b), and those in (c) and (d) are overlapped). The identical sample (i.e., adalimumab) in different analytical runs showed almost the same results (Adalimumab-1 and Adalimumab-2 in –8d), but the deuterium uptakes of etanercept were different from those of adalimumab. The differences of uptake tended to be smaller than those observed in the adalimumab variants, but the differences between adalimumab and etanercept were statistically significant (e.g., the p-values calculated by t-test at the time points of 1, 10 and 60 min were <0.01 in all peptides shown in –8d). The regions described above are shown in the 3D structure model of IgG Fc (). The regions having different deuterium uptake between adalimumab and etanercept were the same regions shown as Peptide-1 and Peptide-5 in .
Figure 8. Regions with different deuterium levels between adalimumab and etanercept. (a–d) Uptake plots of deuterium. Peptides shown in (a) and (b), and those in (c) and (d) are overlapped. All samples were analyzed three times, and the data are shown as mean±SD. Two sets of the analysis of adalimumab are shown in (a–d) as Adalimumab-1 and Adalimumab-2. (e) The regions are shown in the 3D structure model of IgG Fc
Discussion
In this study, we first examined the conformation and the function of the Fc of FcRn affinity-modulated adalimumab variants having amino acid substitutions in three regions (T254–P261, T311–H314 and/or M432–H439) where substitutions are frequently introduced in order to enhance FcRn affinity. With the exception of the binding to FcγRI, the differences of the binding of the adalimumab variants to all the FcγRs (FcγRIIIa, FcγRIIIb, FcγRIIa, and FcγRIIb) showed a similar tendency. In particular, the IH, YTE and LOW variants tended to show a lower response than the other variants, as shown in the sensorgrams of . The calculated KD values of the binding of these variants to FcγRIIIa were highest for IH, followed in order by YTE and LOW, as shown in . This order was the same for the deuterium uptake from 0.17 to 10 min of Peptide-1 (). Since Peptide-1 is located near the interaction sites between IgG and FcγRIIIa,Citation33,Citation34 the conformational change of Peptide-1 might relate to the binding to FcγRIIIa. It has been reported that the affinity of YTE variants to FcγRIIIa is lower than that of native IgGs and that the antibody-dependent cell-mediated cytotoxicity (ADCC) activity of YTE variants is markedly lower than that of native IgGs.Citation19,Citation35 The variants showing low affinity to FcγRIIIa in this study were thought to have low ADCC activity.
On the other hand, Peptide-1 is also located near the interaction sites between IgG and FcγRI, but the affinity of the adalimumab variants to FcγRI was not related to the level of deuterium uptake of Peptide-1. Although the overall receptor–ligand interaction site is similar in all Fcγ receptors, there are differences between FcγRI and the other Fcγ receptors. For example, it was reported that the total interaction surface in the complex of Fc with FcγRI is the greatest among all Fcγ receptors,Citation36 and it was reported that the unique interaction between the FG loop of FcγRI and the carbohydrate units of the Fc glycans substantially contributed to the high affinity between FcγRI and antibodies.Citation37 Therefore, the conformational change of Peptide-1 might not strongly affect the affinity between FcγRI and antibodies.
Similarly, the deuterium uptakes of Peptide-5 of the IH and LOW variants were higher than that of adalimumab. In a previous report that revealed a difference between a native IgG and the YTE variant by HDX-MS analysis, a large increase in deuterium uptake was observed in the region equivalent to Peptide-1 of the YTE variant, and an increase in the region equivalent to Peptide-5 was also detected.Citation23 Although Peptide-5 of the YTE variant could not be detected in this study, it is likely that the conformation around Peptide-5 is different between adalimumab and its YTE variant. In the case of the IH variant, the N438H substitution was located near Peptide-5 (). However, the N434H variant containing the same substitution did not exhibit a difference in the deuterium uptake of Peptide-5 (). Moreover, the deuterium uptake of Peptide-5 of the LS and QA variants, which contained the substitutions N438S and N438A, respectively, was also similar to that of adalimumab (). Therefore, the conformational change around Peptide-5 of the IH variant was not caused by the N438H substitution, but was related to the P261I substitution. There are five regions showing different deuterium uptake in the IH variant. Since Peptide-1 and Peptide-2 are structurally proximal to the P261I substitution, there is a possibility that the conformations of Peptide-1 and Peptide-2 are directly affected by this substitution. However, the structural locations of Peptide-3, Peptide-4 and Peptide-5 are far from the P261I substitution. Since Peptide-3, Peptide-4 and Peptide-5 are comparatively close to Peptide-1, there is a possibility that the conformational changes are mainly caused by the conformational changes of Peptide-1. In the case of Peptide-5, the deuterium uptake of the IH and LOW variants of this peptide were especially similar to those of Peptide-1 in this study, and the deuterium uptake of the YTE variant was thought to be higher than that of a native IgG, adalimumab, as described above. The conformational difference around Peptide-1 might tend to change the conformation of Peptide-5.
In the comparison of the 3D structure between the YTE variant and a native IgG, it was reported that the structural difference was only slight, and the greatest difference between Cα atoms (1.1 Å) occurred for the residues at position 254 (position 258 of adalimumab).Citation21 Therefore, we considered that the conformational change of the YTE variant around Peptide-1 was probably not a long-range change. Such a slight difference was enough to affect the binding to FcγRs and possibly changed the conformation of the other regions, though the distance of the change in the IH and LOW variants might be longer than that in YTE variant.
There was a possibility that the change of the conformation and the binding to FcγRIIIa were caused directly by the amino acid substitutions, and via the change of glycan structure. The difference of glycan structure among the variants was possibly caused by the conformational difference of the variants, but the difference of the expression conditions between the purchased adalimumab and the variants might influence the glycan structures. The galactose contents of the variants were higher than that of adalimumab (Supplemental Table 2). It was reported that the deuterium uptakes around FLFPPKPKDTL (Peptide-1) are low in the highly (>99%) galactosylated antibody.Citation38 Considering that the deuterium uptakes of the LS, N434H and QA variants were not different from that of adalimumab, the difference of galactose contents of these variants would not have been sufficiently large to influence their structures. Moreover, since the deuterium uptakes of the YTE and IH variants at Peptide-1 were higher than that of adalimumab, the conformational change seems not to have occurred through the change in glycan structure.
On the other hand, it was reported that antibodies with high galactose contents tended to have high affinity to FcγRIIIa.Citation38,Citation39 Since the IH, YTE and LOW variants have higher galactose contents than adalimumab, their low affinity to FcγRIIIa was not related to the difference of galactose contents. Moreover, the afucosylated antibody is known to have high affinity to FcγRIIIa, and the binding of the fully afucosylated antibody was previously analyzed using a method similar to that used here.Citation40 In adalimumab and the variants, the contents of antibodies with afucosylated complex type glycans that were reported to have the highest affinity to FcγRIIIa were low, and those with high mannose type glycans were 5.4-12.9%. Considering the difference between afucosylated and fucosylated antibodies reported by Kanda et al.,Citation40 the influence of afucosylated glycans on the affinity to FcγRIIIa was likely not large. Therefore, the conformational changes induced by the amino acid substitutions were thought to be important for the difference of the binding to FcγRIIIa.
The YTE variants have been reported to possess high affinity to FcRn at neutral pH and to show high deuterium uptakes.Citation23 In this study, the YTE and IH variants had high deuterium uptakes among the variants in which amino-acid substitutions were introduced in order to enhance FcRn binding. The IH variant has also been reported to have high affinity to FcRn at neutral pH,Citation14 and in our experiment, the binding of the IH variant to FcRn was highest among the variants at pH 7.4 (data not shown). The conformational change of the YTE and IH variants might have increased the binding at neutral pH, which is negative for enhancing the half-life in vivo. Also in this respect, the conformational change of Fc should be avoided. The introduction of amino acid substitutions into T254–P261 tends to cause conformational change, especially around Peptide-1. This result was supported by reports that the methionine-oxidized IgG1 containing the oxidized methionine at M253 (M256 of the adalimumab sequence) exhibited different deuterium uptake at Leu-243, Phe-244 and Lys-247 (Leu-246, Phe-247 and Lys-250 in the adalimumab sequence located in Peptide-1).Citation26,Citation38 Moreover, in our results, the higher conformational change of Peptide-1 appeared to influence the conformation of the other regions of Fc. It is thus thought to be suitable to introduce amino-acid substitutions in the regions other than T254–P261 (e.g., M432–N438) in order to enhance the FcRn affinity.
We also evaluated the functional and structural change of Fc by substitution of the Fab region to TNFR in this study. The FcRn-binding site is distant from the fused sites between TNFR and the Fc, although the FcγRs-binding sites are comparatively proximal. However, both the binding property to FcRn and FcγRs were different between etanercept and adalimumab. The conformational difference of the adalimumab and etanercept Fcs was detected by the HDX-MS. The regions having different deuterium uptake were the same as in Peptide-1 and Peptide-5 of the engineered adalimumab shown in , although unlike the IH, YTE and LOW variants, Peptide-1 and Peptide-5 of etanercept showed lower deuterium uptakes compared with those of adalimumab. Considering the FcRn-binding sites (the CH2-CH3 interface of Fc), it is reasonable that these differences of conformation caused the low affinity to FcRn of etanercept, although it is not to be denied that the steric hindrance by the TNFR region occurs simultaneously.
This is the first report to clarify the conformational difference between adalimumab and etanercept. Considering that TNFR is fused to the N-terminus of Fc, it appears that the fusion of TNFR distorts the structure around Peptide-1 and the structural change around Peptide-1 affects the structure around Peptide-5. It is thought that the conformational difference is an important factor for the lower FcRn affinity and the shorter half-life of etanercept. Since there are Fc fusion proteins having affinity to FcRn comparable to that of IgG1 antibody (e.g., rFIX-FcCitation41), the suppression of the distortion caused by the fusion with proteins appears to lessen the decline in the affinity to FcRn.
In conclusion, we clarified the conformation change of Fc by the amino acid substitutions for modulating the affinity to FcRn and the substitution of the Fab region to TNFR, and the relation between the conformational change and the function of Fc. These findings will be useful for antibody engineering related to the FcRn affinity and for further understanding of the relation between the conformation and the function of Fc.
Materials and methods
Materials
Adalimumab (Abbott AG, Baar, Switzerland) and etanercept (Takeda Pharmaceutical, Osaka, Japan) were purchased via reagent distributors. Recombinant human FcRn was expressed using stably transfected Chinese hamster ovary (CHO) cells provided by Pamela J. Bjorkman (California Institute of Technology, Pasadena, CA) and was purified according to the method previously reported.Citation28 Recombinant human Fcγ receptors (CD16a, CD16b, CD32a, CD32b and CD64) with His tags were purchased from Sino Biological (Wayne, PA).
Preparation of engineered antibodies with modulated affinity to FcRn
DNA fragments encoding the variable region of the heavy-chain and light-chain of adalimumab were synthesized by Integrated DNA Technologies, and subcloned into pFUSE-CHIg-hG1 and pFUSE2-CLIg-hk vectors (InvivoGen), respectively. Since the allotype of the constant region encoded by pFUSE-CHIg-hG1 (E356 and M358) was different from adalimumab, the relevant parts were substituted to D356 and L358 by a synthesized DNA fragment. The expression vectors encoding the engineered adalimumab variants reported as hhigh-affinityvariants to FcRn (the IH, LS, N434H, QA, QL and YTE variants), and that encoding the engineered adalimumab, which does not bind to FcRn (the LOW variant), were constructed by substitution using synthesized DNA fragments (Eurofins Genomics, Tokyo). All the engineered antibodies were expressed using the FreeStyle MAX CHO Expression System (Invitrogen, Carlsbad, CA). Briefly, CHO-S cells were co-transfected with the plasmid vectors expressing the heavy chain and light chain of engineered adalimumab by using the FreeStyle MAX Reagent (Invitrogen), and they were then cultured for 1 week in FreeStyle CHO Expression Medium (37°C, 8% CO2). The cell culture supernatant was collected by centrifugation (400 x g for 10 min) and filtered with a 0.22-μm bottletop filter (Corning, Tewksbury, MA), and then applied to a HiTrap Protein A HP column (GE Healthcare, Buckinghamshire, UK) equilibrated with 20 mM phosphate buffer (pH 7.2). Since only the expressed LOW variant did not bind to a HiTrap Protein A HP column, a HiTrap protein G HP column was used for purification of the LOW variant. After the column was washed with 20 mM phosphate buffer (pH 7.2), mAbs were eluted by 0.1 M sodium citrate (pH 4.0) (for the protein A column) or 0.1 M glycine-HCl (pH 2.5) (for the protein G column), and neutralized by 1 M Tris-HCl (pH 8.0), followed by buffer exchange to phosphate buffer (pH 7.2) using a centrifugal filter (Amicon® Ultra-15; Millipore).
SPR assays
Analysis of affinity to FcRn
SPR assays were performed using a BIAcore T200 instrument (GE Healthcare). The purified recombinant hFcRn was diluted with 10 mM sodium acetate (pH 5.0), and was immobilized onto a CM5 biosensor chip (GE Healthcare) using an amine coupling kit according to the manufacturer’s instruction at relatively low densities (mainly 50–100 RU) in order to avoid mass transport limitation. The reference cell was treated with N-hydroxysuccinimide/1-ethyl-3-(3-dimethylaminopropyl) carbodiimide and ethanol amine using an amine coupling kit without injecting the FcRn. The engineered antibodies and etanercept were diluted with the running buffer (50 mM sodium phosphate/150 mM NaCl, pH 6.0) and injected over 180 sec at 25°C. The running buffer was allowed to flow at a rate of 30 μl/min. For regeneration, the regeneration buffer (100 mM Tris/200 mM NaCl, pH 8.0) was injected for 120 sec. Kinetic constants were calculated from the sensorgrams by means of a steady state model using BIAcore T200 evaluation software. To determine the KD between IgG and FcRn by SPR, various methods are used, such as the bivalent analyte model, heterogenous ligand model and steady-state analysis.Citation42–44 Since the sensorgrams of the adalimumab variants were highly different from that of adalimumab, we did not choose the sensorgram fitting.
Analysis of affinity to Fcγ receptors
The affinity of the engineered antibodies and etanercept to Fcγ receptors was analyzed using a His capture kit (GE Healthcare). Anti-histidine antibody was immobilized at about 8000RU to each flow cell using an amine coupling kit. Recombinant human Fcγ receptors with His-tags were diluted with HBS-EP+ to 0.25–2 μg/ml and were captured for 60 sec at a flow rate of 10 μl/ml. The running buffer, HBS-EP+ (10 mM HEPES, 150 mM NaCl, 3 mM EDTA, 0.05% surfactant P20, pH 7.4) (GE Healthcare), was allowed to flow at 30 μl/min. The engineered antibodies and etanercept were injected for 180 sec, and the flow cells were regenerated with 10 mM glycine-HCl, pH 1.5, for 60 sec. The capture levels of Fcγ receptors for the comparison between adalimumab and etanercept were raised because the responses of etanercept were low.
Since the number of samples was large in the analysis of affinity between the engineered adalimumab and Fc receptors, the samples were analyzed 2 times in the reverse order to prevent the effect of stability of diluted samples in the autosampler. The KD values are shown as the average from the two analyses, though the KD values calculated by the two analyses were almost unchanged.
HDX-MS analyses
HDX-MS analysis was performed according to our previous report.Citation39 Sample preparation was automatically carried out using the CTC PAL sample manager (LEAP Technologies, Morrisville, NC). Briefly, the adalimumab variants or etanercept at 2 mg/mL was diluted 20-fold with phosphate buffer saline in D2O (pD 7.4) for HDX reaction. The dilutions were separately incubated at 10°C for 0, 0.17, 1, 10, 60 and 240 min. Deuterium-labeled samples were quenched by addition of quenching buffer (4°C) containing 300 mM Tris (2-carboxyethyl) phosphine hydrochloride (Sigma-Aldrich) and 4 M guanidine-HCl (Thermo Fisher Scientific, Pleasanton, CA). All time points were measured with three independent experiments. The quenched sample solutions were subjected to online pepsin digestion and analyzed by LC/MS using a nanoACQUITY UPLC system (Waters, Milford, MA) and SynaptG2-S Q-TOF mass spectrometer (Waters). Online pepsin digestion was performed using a Poroszyme Immobilized Pepsin Cartridge (2.1 × 30 mm; Applied Biosystems, Foster City, CA) in formic acid solution (pH 2.5) for 2 min at 10°C at a flow rate of 300 μL/min. A reversed-phase ACQUITY UPLC BEH C18 column (1.0 × 100 mm, 1.7 mm; Waters) was used as an analytical column. The mobile phase A buffer was 0.1% formic acid solution and the mobile phase B was 0.1% formic acid containing 90% acetonitrile. The deuterated peptides generated by the pepsin digestion were eluted at a flow rate of 30 μL/min with a gradient from 13% to 85% of B buffer for 8 min. The mass spectrometry measurement of the peptides was performed under the following conditions: electrospray voltage of 3.0 kV, positive ion mode, trap collision energy of 4.0 V, sampling cone of 40 V, source temperature of 80°C, desolvation temperature of 100°C, and mass range of m/z 100–2,000. Tandem mass spectrometry (MS/MS) was performed by MSE experiment with a series of low–high collision energies ramping from 10 to 40 V. For the database search and the analysis of deuteration level, ProteinLynx Global Server (PLGS) 2.5.3 software (Waters) with an in-house database of the amino acid sequence of Adalimumab and DynamX 2.0 software (Waters) were used, respectively.
Supplemental Material
Download MS Word (6.1 MB)Acknowledgments
We thank Mr. Noriyuki Iwasaki and Ms. Yoshiko Tousaka for their technical assistance. We thank Dr. Pamela Bjorkman for the generous gift of the cell line expressing FcRn.
Supplementary material
Supplemental data for this article can be accessed on the publisher’s website
Additional information
Funding
References
- Morell A, Terry WD, Waldmann TA. Metabolic properties of IgG subclasses in man. J Clin Invest. 1970;49(4):673–14. doi:10.1172/JCI106279.
- Simister NE, Mostov KE. An Fc receptor structurally related to MHC class I antigens. Nature. 1989;337(6203):184–87. doi:10.1038/337184a0.
- Junghans RP, Anderson CL. The protection receptor for IgG catabolism is the beta2-microglobulin-containing neonatal intestinal transport receptor. Proc Natl Acad Sci U S A. 1996;93(11):5512–16. doi:10.1073/pnas.93.11.5512.
- Ghetie V, Popov S, Borvak J, Radu C, Matesoi D, Medesan C, Ober RJ, Ward ES. Increasing the serum persistence of an IgG fragment by random mutagenesis. Nat Biotechnol. 1997;15(7):637–40. doi:10.1038/nbt0797-637.
- Raghavan M, Bonagura VR, Morrison SL, Bjorkman PJ. Analysis of the pH dependence of the neonatal Fc receptor/immunoglobulin G interaction using antibody and receptor variants. Biochemistry. 1995;34(45):14649–57. doi:10.1021/bi00045a005.
- Lobo ED, Hansen RJ, Balthasar JP. Antibody pharmacokinetics and pharmacodynamics. J Pharm Sci. 2004;93(11):2645–68. doi:10.1002/jps.20178.
- Highlights of Prescribing Information “ULTOMIRIS ™ (ravulizumab-cwvz) injection, for intravenous use”. 2018; [accessed 2021 May 9]. https://www.accessdata.fda.gov/drugsatfda_docs/label/2018/761108s000lbl.pdf.
- Stern RM, Connell NT. Ravulizumab: a novel C5 inhibitor for the treatment of paroxysmal nocturnal hemoglobinuria. Ther Adv Hematol. 2019;10:2040620719874728. doi:10.1177/2040620719874728.
- Zalevsky J, Chamberlain AK, Horton HM, Karki S, Leung IW, Sproule TJ, Lazar GA, Roopenian DC, Desjarlais JR. Enhanced antibody half-life improves in vivo activity. Nat Biotechnol. 2010;28(2):157–59. doi:10.1038/nbt.1601.
- Sheridan D, Yu ZX, Zhang Y, Patel R, Sun F, Lasaro MA, Bouchard K, Andrien B, Marozsan A, Wang Y, et al. Design and preclinical characterization of ALXN1210: a novel anti-C5 antibody with extended duration of action. PloS One. 2018;13(4):e0195909. doi:10.1371/journal.pone.0195909.
- Soto JA, Galvez NMS, Pacheco GA, Bueno SM, Kalergis AM. Antibody development for preventing the human respiratory syncytial virus pathology. Molecular Medicine. 2020;26(1):35. doi:10.1186/s10020-020-00162-6.
- Yu XQ, Robbie GJ, Wu Y, Esser MT, Jensen K, Schwartz HI, Bellamy T, Hernandez-Illas M, Jafri HS. Safety, tolerability, and pharmacokinetics of MEDI4893, an investigational, extended-half-life, anti-staphylococcus aureus alpha-toxin human monoclonal antibody, in healthy adults. Antimicrob Agents Chemother. 2017;61(1):61. doi:10.1128/AAC.01020-16.
- Dumet C, Pottier J, Gouilleux-Gruart V, Watier H. Insights into the IgG heavy chain engineering patent landscape as applied to IgG4 antibody development. mAbs. 2019;11(8):1341–50. doi:10.1080/19420862.2019.1664365.
- Datta-Mannan A, Witcher DR, Tang Y, Watkins J, Jiang W, Wroblewski VJ. Humanized IgG1 variants with differential binding properties to the neonatal Fc receptor: relationship to pharmacokinetics in mice and primates. Drug Metab Dispos. 2007;35(1):86–94. doi:10.1124/dmd.106.011734.
- Deng R, Loyet KM, Lien S, Iyer S, DeForge LE, Theil FP, Lowman HB, Fielder PJ, Prabhu S. Pharmacokinetics of humanized monoclonal anti-tumor necrosis factor-{alpha} antibody and its neonatal Fc receptor variants in mice and cynomolgus monkeys. Drug Metab Dispos. 2010;38(4):600–05. doi:10.1124/dmd.109.031310.
- Yeung YA, Wu X, Reyes AE 2nd, Vernes JM, Lien S, Lowe J, Maia M, Forrest WF, Meng YG, Damico LA. et al. A therapeutic anti-VEGF antibody with increased potency independent of pharmacokinetic half-life. Cancer Res. 2010;70(8):3269–77. doi:10.1158/0008-5472.CAN-09-4580.
- Hinton PR, Xiong JM, Johlfs MG, Tang MT, Keller S, Tsurushita N. An engineered human IgG1 antibody with longer serum half-life. J Immunol. 2006;176(1):346–56. doi:10.4049/jimmunol.176.1.346.
- Datta-Mannan A, Witcher DR, Tang Y, Watkins J, Wroblewski VJ. Monoclonal antibody clearance. Impact of Modulating the Interaction of IgG with the Neonatal Fc Receptor. J Biol Chem. 2007;282:1709–17.
- Dall’Acqua WF, Kiener PA, Wu H. Properties of human IgG1s engineered for enhanced binding to the neonatal Fc receptor (FcRn). J Biol Chem. 2006;281(33):23514–24. doi:10.1074/jbc.M604292200.
- Grevys A, Bern M, Foss S, Bratlie DB, Moen A, Gunnarsen KS, Aase A, Michaelsen TE, Sandlie I, Andersen JT. Fc Engineering of Human IgG1 for Altered Binding to the Neonatal Fc Receptor Affects Fc Effector Functions. J Immunol. 2015;194(11):5497–508. doi:10.4049/jimmunol.1401218.
- Oganesyan V, Damschroder MM, Woods RM, Cook KE, Wu H, Dall’acqua WF. Structural characterization of a human Fc fragment engineered for extended serum half-life. Mol Immunol. 2009;46(8–9):1750–55. doi:10.1016/j.molimm.2009.01.026.
- Oganesyan V, Damschroder MM, Cook KE, Li Q, Gao C, Wu H, Dall'Acqua WF. Structural insights into neonatal Fc receptor-based recycling mechanisms. J Biol Chem. 2014;289(11):7812–24. doi:10.1074/jbc.M113.537563.
- Walters BT, Jensen PF, Larraillet V, Lin K, Patapoff T, Schlothauer T, Rand KD, Zhang J. Conformational Destabilization of Immunoglobulin G Increases the Low pH Binding Affinity with the Neonatal Fc Receptor. J Biol Chem. 2016;291(4):1817–25. doi:10.1074/jbc.M115.691568.
- Kaltashov IA, Bobst CE, Abzalimov RR. H/D exchange and mass spectrometry in the studies of protein conformation and dynamics: is there a need for a top-down approach? Anal Chem. 2009;81(19):7892–99. doi:10.1021/ac901366n.
- Houde D, Arndt J, Domeier W, Berkowitz S, Engen JR. Characterization of IgG1 conformation and conformational dynamics by hydrogen/deuterium exchange mass spectrometry. Anal Chem. 2009;81(7):2644–51. doi:10.1021/ac802575y.
- Mo J, Yan Q, So CK, Soden T, Lewis MJ, Hu P. Understanding the Impact of Methionine Oxidation on the Biological Functions of IgG1 Antibodies Using Hydrogen/Deuterium Exchange Mass Spectrometry. Anal Chem. 2016;88(19):9495–502. doi:10.1021/acs.analchem.6b01958.
- Lee H, Kimko HC, Rogge M, Wang D, Nestorov I, Peck CC. Population pharmacokinetic and pharmacodynamic modeling of etanercept using logistic regression analysis. Clin Pharmacol Ther. 2003;73(4):348–65. doi:10.1016/S0009-9236(02)17635-1.
- Suzuki T, Ishii-Watabe A, Tada M, Kobayashi T, Kanayasu-Toyoda T, Kawanishi T, Yamaguchi T. Importance of neonatal FcR in regulating the serum half-life of therapeutic proteins containing the Fc domain of human IgG1: a comparative study of the affinity of monoclonal antibodies and Fc-fusion proteins to human neonatal FcR. J Immunol. 2010;184(4):1968–76. doi:10.4049/jimmunol.0903296.
- Martin WL, West AP Jr., Gan L, Bjorkman PJ. Crystal structure at 2.8 A of an FcRn/heterodimeric Fc complex: mechanism of pH-dependent binding. Mol Cell. 2001;7(4):867–77. doi:10.1016/S1097-2765(01)00230-1.
- Heider KH, Kiefer K, Zenz T, Volden M, Stilgenbauer S, Ostermann E, Baum A, Lamche H, Kupcu Z, Jacobi A, et al. A novel Fc-engineered monoclonal antibody to CD37 with enhanced ADCC and high proapoptotic activity for treatment of B-cell malignancies. Blood. 2011;118(15):4159–68. doi:10.1182/blood-2011-04-351932.
- Gurjar SA, Derrick JP, Dearman RJ, Thorpe R, Hufton S, Kimber I, Wadhwa M. Surrogate CD16-expressing effector cell lines for determining the bioactivity of therapeutic monoclonal antibodies. J Pharm Biomed Anal. 2017;143:188–98. doi:10.1016/j.jpba.2017.06.004.
- Stelter S, Paul MJ, Teh AY, Grandits M, Altmann F, Vanier J, Bardor M, Castilho A, Allen RL, Ma JK. Engineering the interactions between a plant-produced HIV antibody and human Fc receptors. Plant Biotechnol J. 2020;18(2):402–14. doi:10.1111/pbi.13207.
- Sondermann P, Huber R, Oosthuizen V, Jacob U. The 3.2-A crystal structure of the human IgG1 Fc fragment-Fc gammaRIII complex. Nature. 2000;406:(6793):267–73. doi:10.1038/35018508.
- Isoda Y, Yagi H, Satoh T, Shibata-Koyama M, Masuda K, Satoh M, Kato K, Iida S. Importance of the side chain at position 296 of antibody Fc in interactions with FcgammaRIIIa and other fcgamma receptors. PloS One. 2015;10(10):e0140120. doi:10.1371/journal.pone.0140120.
- Booth BJ, Ramakrishnan B, Narayan K, Wollacott AM, Babcock GJ, Shriver Z, Viswanathan K. Extending human IgG half-life using structure-guided design. mAbs. 2018;10(7):1098–110. doi:10.1080/19420862.2018.1490119.
- Kiyoshi M, Caaveiro JM, Kawai T, Tashiro S, Ide T, Asaoka Y, Hatayama K, Tsumoto K. Structural basis for binding of human IgG1 to its high-affinity human receptor FcgammaRI. Nat Commun. 2015;6(1):6866. doi:10.1038/ncomms7866.
- Lu J, Chu J, Zou Z, Hamacher NB, Rixon MW, Sun PD. Structure of FcgammaRI in complex with Fc reveals the importance of glycan recognition for high-affinity IgG binding. Proc Natl Acad Sci U S A. 2015;112(3):833–38. doi:10.1073/pnas.1418812112.
- Houde D, Peng Y, Berkowitz SA, Engen JR. Post-translational modifications differentially affect IgG1 conformation and receptor binding. Mol Cell Proteomics: MCP. 2010;9(8):1716–28. doi:10.1074/mcp.M900540-MCP200.
- Aoyama M, Hashii N, Tsukimura W, Osumi K, Harazono A, Tada M, Kiyoshi M, Matsuda A, Ishii-Watabe A. Effects of terminal galactose residues in mannose alpha1-6 arm of Fc-glycan on the effector functions of therapeutic monoclonal antibodies. mAbs. 2019;11(5):826–36. doi:10.1080/19420862.2019.1608143.
- Kanda Y, Yamada T, Mori K, Okazaki A, Inoue M, Kitajima-Miyama K, Kuni-Kamochi R, Nakano R, Yano K, Kakita S, et al. Comparison of biological activity among nonfucosylated therapeutic IgG1 antibodies with three different N-linked Fc oligosaccharides: the high-mannose, hybrid, and complex types. Glycobiology. 2007;17(1):104–18. doi:10.1093/glycob/cwl057.
- Houde D, Berkowitz SA. Conformational comparability of factor IX-Fc fusion protein, factor IX, and purified Fc fragment in the absence and presence of calcium. J Pharm Sci. 2012;101(5):1688–700. doi:10.1002/jps.23064.
- West AP Jr., Bjorkman PJ. Crystal structure and immunoglobulin G binding properties of the human major histocompatibility complex-related Fc receptor. Biochemistry. 2000;39(32):9698–708. doi:10.1021/bi000749m.
- Martin WL, Bjorkman PJ. Characterization of the 2:1 Complex between the Class I MHC-Related Fc Receptor and Its Fc Ligand in Solution †. Biochemistry. 1999;38(39):12639–47. doi:10.1021/bi9913505.
- Piche-Nicholas NM, Avery LB, King AC, Kavosi M, Wang M, O’Hara DM, Tchistiakova L, Katragadda M. Changes in complementarity-determining regions significantly alter IgG binding to the neonatal Fc receptor (FcRn) and pharmacokinetics. mAbs. 2018;10(1):81–94. doi:10.1080/19420862.2017.1389355.