
ABSTRACT
The rapidly evolving nature of antibody drug development has resulted in technologies that generate vast numbers (hundreds to thousands) of lead antibody candidates during early discovery. These candidates must be rapidly pared down to identify the most drug-like candidates for in-depth analysis of their safety and efficacy, which can only be performed on a limited number of antibodies due to time and resource requirements. One key biophysical property of successful antibody therapeutics is high specificity, defined as low levels of nonspecific binding or polyspecificity. Although there has been some progress in developing assays for detecting antibody polyspecificity, most of these assays are limited by poor sensitivity or assay formats that require proprietary antibody surface display methods, and some of these assays use complex and poorly defined polyspecificity reagents. Here we report the PolySpecificity Particle (PSP) assay, a sensitive flow cytometry assay for evaluating antibody nonspecific interactions that overcomes previous limitations and can be used for evaluating diverse types of IgGs, multispecific antibodies and Fc-fusion proteins. Our approach uses micron-sized magnetic beads coated with Protein A to capture antibodies at extremely dilute concentrations (<0.02 mg/mL). Flow cytometry analysis of polyspecificity reagent binding to these conjugates results in sensitive detection of differences in nonspecific interactions for clinical-stage antibodies. Our PSP assay strongly discriminates between antibodies with different levels of polyspecificity using previously reported polyspecificity reagents that are either well-defined proteins or highly complex protein mixtures. Moreover, we also find that a unique reagent, namely ovalbumin, results in the best assay sensitivity and specificity. Importantly, our assay is much more sensitive than standard assays such as ELISAs. We expect that our simple, sensitive, and high-throughput PSP assay will accelerate the development of safe and effective antibody therapeutics.
INTRODUCTION
The growing number of approved antibody therapeutics, including those that have revolutionized the treatment of human disorders ranging from cancer to autoimmune and infectious diseases, continues to fuel interest in improving the drug development process to more efficiently and reliably advance antibody lead candidates to the clinic.Citation1 There is particular interest in assessing antibody developability properties during early antibody discovery stages to remove suboptimal candidates with poor stability, specificity, solubility, aggregation, viscosity, pharmacokinetics, and/or immunogenicity properties.Citation2–6 This has motivated the development of innovative methods for assessing some of these key molecular properties at the stage of antibody discovery, especially using only small amounts of dilute and partially purified antibodies that are commonplace at this early stage in antibody development.Citation7–14
Nevertheless, early-stage assessment of antibody developability properties remains a key challenge. Of particular interest is the development of robust methods for assessing antibody polyspecificity. We herein define polyspecificity as the propensity of antibodies to interact nonspecifically with non-antigen biomolecules. A comprehensive study of antibody developability properties revealed that approved antibody drugs, on average, display lower levels of polyspecificity than antibodies in clinical development that have advanced at least to Phase 2 clinical trials.Citation15 This suggests that developing antibody candidates with low levels of polyspecificity may help improve the success of antibody drugs in the clinic.
There are a number of reported methods for assessing antibody polyspecificity.Citation16–21 The most common ones are enzyme-linked immunosorbent assays (ELISAs), which evaluate binding of antibodies to diverse types of immobilized biomolecules such as proteins, lipids, sugars, DNA, and/or virus particles.Citation16,Citation17 The advantages of ELISAs are their simplicity and ability to evaluate antibody polyspecificity using diverse types of immobilized reagents without the need to label the reagents and detect their binding in solution. However, compared to the detection of highly specific affinity interactions, the sensitivity of ELISAs to detect nonspecific interactions is much weaker, which limits their widespread utility for sensitively evaluating antibody polyspecificity. Several other methods have been reported that adapt traditional methods for measuring affinity protein interactions to evaluating antibody nonspecific interactions, including bio-layer interferometry, surface plasmon resonance, and affinity chromatography (in the form of cross-interaction chromatography).Citation18–21
Despite this progress, there remains a substantial need for more sensitive and robust methods for evaluating antibody polyspecificity. Given the high sensitivity of flow cytometry, investigators have sought to develop flow cytometry methods for assessing antibody polyspecificity.Citation11,Citation15,Citation18,Citation22,Citation23 The most well-studied flow cytometry method to date, referred to as the polyspecificity reagent (PSR) assay, uses a proprietary yeast display technology to evaluate the binding of full-length IgGs displayed on yeast to biotinylated mixtures of proteins in solution, the latter of which are generated from either a mixture of soluble (cytosolic) and insoluble (membrane) protein fractions from Chinese Hamster Ovary (CHO) cells or only the latter fraction of membrane proteins.Citation11 There are several notable advantages of the PSR assay: 1) it can be used during in vitro antibody library sorting to deselect suboptimal candidates; 2) it strongly differentiates between different preclinical and clinical-stage antibodies; and 3) it uses complex protein mixtures to detect diverse types of nonspecific interactions. Moreover, nonspecific interactions detected by the PSR assay have been positively correlated with increased antibody clearance rates in animal models,Citation18 demonstrating its significance in improving the discovery and development of antibody candidates with drug-like properties.
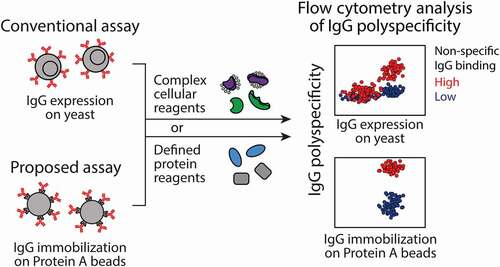
Nevertheless, the PSR assay suffers from three main limitations that we seek to address in this work. First, it uses a proprietary yeast display method that requires the expression of full-length IgGs on yeast.Citation11 While it is possible to display antigen-binding fragments (Fabs) on yeast using nonproprietary technologies,Citation24–29 we find that monovalent antibody fragments (Fabs and single-chain variable fragments) bind much weaker to polyspecificity reagents than their corresponding bivalent counterparts, which severely limits the use of this assay without the proprietary IgG yeast display technology. Second, the PSR assay cannot be used to evaluate the polyspecificity of soluble IgGs, multispecific antibodies and Fc-fusion proteins that have been discovered or produced using more traditional discovery methods. Third, the PSR assay uses complex protein mixtures generated from CHO cells that are difficult to produce in a reproducible manner. Despite progress in replacing these complex mixtures with more defined protein reagents such as chaperones (e.g., Hsp90),Citation22 we find that reagents such as Hsp90 are also difficult to produce at high yield and purity, and expensive to purchase at scales necessary for characterizing hundreds to thousands of antibody variants during early antibody discovery. To address the first two challenges, we have sought to replace yeast cells with micron-sized magnetic beads coated with Protein A that could be used to capture and assay the polyspecificity of diverse types of antibodies and Fc-fusion proteins using flow cytometry (). To address the third challenge, we evaluated several types of potential polyspecificity reagents, including well-defined and inexpensive proteins that are widely available. Herein, we report the development of a sensitive flow cytometry assay, which we refer to as the PolySpecificity Particle (PSP) assay, for evaluating antibody polyspecificity using a simple and well-defined protein reagent.
Figure 1. Overview of the PolySpecificity Particle (PSP) assay for evaluating antibody nonspecific interactions. In the PSP assay, mAbs are immobilized on micron-sized magnetic beads coated with Protein A and then the conjugates are incubated with different types of polyspecificity reagents. The levels of antibody nonspecific interactions are evaluated via fluorescence detection using standard flow cytometry methods. The primary advantages of the PSP assay relative to the conventional PolySpecificity Reagent (PSR) assay are that the PSP assay does not require proprietary technologies for displaying full-length IgGs on yeast and it is compatible with the soluble IgGs and other soluble Fc-fusion proteins (including bispecific and multispecific antibodies)
RESULTS
Flow cytometry-based polyspecificity analysis of IgGs immobilized on Protein A beads
The first step toward developing a flow cytometry assay for sensitively detecting antibody nonspecific interactions is to identify micron-size beads that are suitable for antibody immobilization and flow cytometry analysis. We chose Dynabeads (average diameter of 2.8 microns) coated with Protein A due to their simplicity and high-efficiency capture of antibodies in an oriented manner for preferential display of variable regions that mediate key differences in nonspecific binding between different monoclonal antibodies (mAbs).Citation15,Citation29–32 Herein we report clinical-stage antibodies by their names despite the fact that we use the Fv regions of the antibodies (using the previously reported sequencesCitation15) and a common IgG1 framework (Fig. S1) regardless of their actual isotype, which results in differences in sequences between the antibodies evaluated in this work and the actual antibody drug molecules.
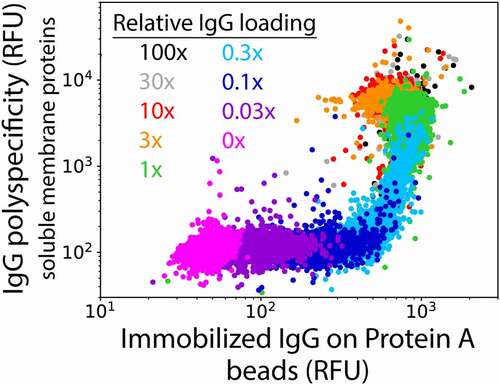
To evaluate the potential of this flow cytometry approach, we first loaded a polyreactive control antibody (ixekizumab) on Protein A beads and incubated the conjugates with the standard soluble membrane protein (SMP) reagent isolated from CHO cells at a similar concentration (~0.1 mg/mL) as reported previously ().Citation11,Citation22 Encouragingly, we detected antibody nonspecific binding at relatively low levels of IgG loading (0.1× of bead-binding capacity or 0.015 μg/mL IgG) and these interactions were much stronger at high IgG loading (1–100× of bead-binding capacity or 0.15–15 μg/mL IgG). It is notable that the IgG loading on the beads (x-axis) is much more uniform than commonly observed on the surface of yeast for antibody fragments or full-length antibodies due to expression differences between different yeast cells in the latter case. This greatly simplifies the analysis of antibody nonspecific interactions using this assay.
Figure 2. Impact of mAb loading on flow cytometry detection of antibody nonspecific interactions with soluble membrane proteins. mAb immobilization on Protein A beads was detected using a F(ab’)2 antibody specific for human Fc (Alexa Fluor 488) and mAb binding to biotinylated soluble membrane proteins was detected using streptavidin (Alexa Fluor 647). The measurements were evaluated as a function of the mAb concentration relative to the IgG binding capacity of the Protein A beads. The experiments were performed three times, and a representative example is shown
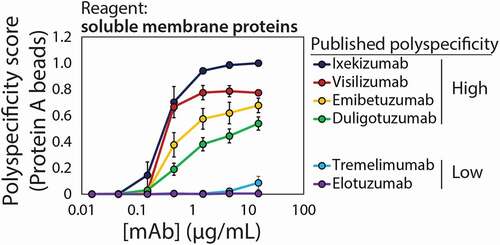
We next evaluated if this flow cytometry method could be used to differentiate between mAbs with high and low reported levels of polyspecificity, as judged by the original yeast surface display assay (). Six mAbs were chosen for evaluation with a range of reported specificities (Fig. S2). Two of the mAbs are reported to display low polyreactivity [elotuzumab (PSR value of 0) and tremelimumab (PSR value of 0.15)] relative to four mAbs that are reported to display high polyreactivity [duligotuzumab (PSR value of 0.33), visilizumab (PSR value of 0.42), emibetuzumab (PSR value of 0.64) and ixekizumab (PSR value of 0.81)].Citation15,Citation17 Encouragingly, mAbs with high reported polyspecificity displayed much higher levels of nonspecific binding than mAbs with low reported polyspecificity, especially at mAb loading concentrations of 0.46 to 15 μg/mL (3–100x of bead binding capacity). To maximize sensitivity, the highest concentration of 15 μg/mL was used in all subsequent analysis. Finally, we tested the impact of varying the concentration of the soluble membrane protein reagent and found little impact on the measurements (Fig. S3).
Figure 3. Detection of antibody nonspecific interactions for mAbs reported to display high and low levels of polyspecificity. The measurements were performed using biotinylated soluble membrane proteins. The PSP scores are average values for each mAb normalized between a polyreactive control mAb (ixekizumab) with a score of 1 and a specific mAb (elotuzumab) with a score of 0. The experiments were repeated three times, the data are average values, and the error bars are standard deviations
To simplify the comparison of these nonspecific interaction measurements between different experiments, we sought to normalize the median signals for each mAb between two control antibodies. Herein we report our measurements in terms of a PSP score, which is the median value for each mAb of interest normalized between a polyreactive control mAb (ixekizumab) with a score of 1 and a specific mAb (elotuzumab) with a score of 0.
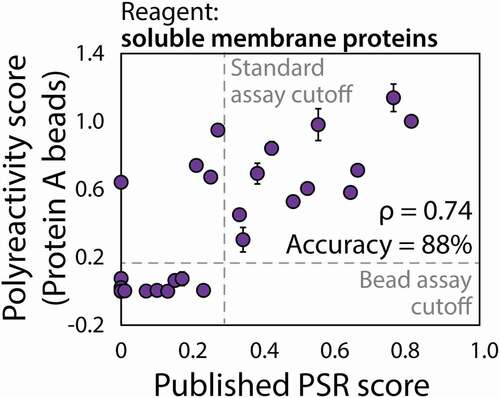
Next, we tested a larger panel of 32 clinical-stage antibodies, summarized in Fig. S2, using our PSP assay, and compared the results to the previously reported PSR scores (). The two sets of data were strongly correlated with a Spearman (ρ) correlation coefficient of 0.72 (p-value of 1.5 × 10⁻⁶). Moreover, we evaluated the classification accuracy for correctly identifying the specific and polyreactive antibodies using the previously reported cutoff for identifying mAbs with high polyspecificity, namely PSR scores >0.27. A cutoff PSP score for high polyspecificity of >0.19 for our assay maximizes the classification accuracy, which correctly classifies 28 of the 32 antibodies (88% accuracy).
Figure 4. Novel flow cytometry method detects mAb nonspecific interactions in a manner that is strongly correlated with previous measurements using a proprietary method. Measurements of antibody interactions with soluble membrane proteins using Protein A beads in this work are shown on the y-axis, while the corresponding published measurements using a proprietary yeast display technology are reported on the x-axis.Citation15 The PSP scores were calculated as described in . The flow cytometry measurements performed using Protein A beads are averages of three experiments, and the error bars are standard deviations
Flow cytometry assay strongly differentiates between mAbs with different levels of polyspecificity
Given that flow cytometry is a more specialized method that requires relatively expensive equipment compared to that required for conducting typical ELISAs, we sought to directly compare both methods to evaluate if the use of flow cytometry is justified for this application (). We first evaluated the ability of two ELISAs to detect differences between the panel of 32 clinical-stage mAbs using the soluble membrane protein reagent (). The first format (ELISA #1, ) more closely mirrored the flow cytometry assay procedure, as mAbs were first immobilized via Protein A capture and then nonspecific interactions were detected with biotinylated soluble reagents. In contrast, the second ELISA format (ELISA #2, ) involved immobilizing the polyspecificity reagent first and then evaluating nonspecific interactions with soluble mAbs. For our ELISA measurements, the correlations with the published PSR assay measurements were modest (ρ = 0.56 for ELISA #1 and ρ = 0.32 for ELISA #2), but higher for ELISA #1 in which mAbs were immobilized using Protein A.
Figure 5. Comparison of ELISA and previously published flow cytometry measurements of antibody nonspecific interactions. (a, b) ELISA measurements of antibody nonspecific interactions using two assay formats: (a) ELISA #1 format in which Protein A is immobilized, mAbs are captured and mAb interactions with soluble membrane proteins are detected; and (b) ELISA #2 format in which soluble membrane proteins are immobilized and interactions with soluble (non-immobilized) mAbs are detected. In (A) and (B), the ELISA measurements are compared to previously reported flow cytometry measurements (soluble membrane proteins).Citation15 The ELISA measurements are averages of three experiments and the error bars are standard deviations
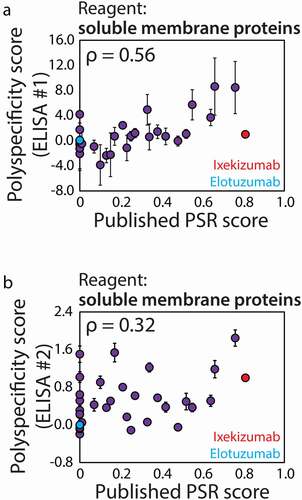
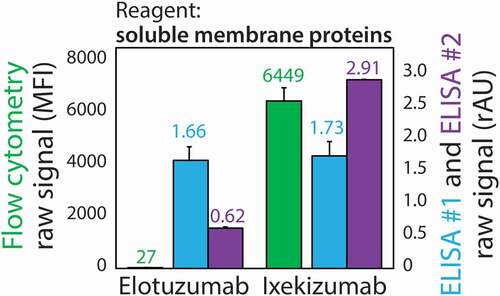
The origin of the overall improved performance of our flow cytometry assay could, in part, be due to its much higher dynamic range relative to the corresponding ELISA (). This is evident when evaluating the raw (non-background subtracted) signals generated via the flow cytometry and ELISA methods for control antibodies with low (elotuzumab) and high (ixekizumab) levels of nonspecific interactions.Citation15 The latter antibody was reported to display the highest levels of nonspecific interactions out of a large panel of clinical-stage antibodies. The raw signals obtained by the flow cytometry assay are two orders of magnitude different while those obtained by the ELISAs are similar due to high background and limitations with absorbance measurements. The ratio of the signals for the polyreactive antibody (ixekizumab) relative to the specific antibody (elotuzumab) was 259 for the flow cytometry assay, and much lower for the ELISAs (1.04 for ELISA #1 and 4.7 for ELISA #2), revealing significant differences in the dynamic ranges for the two assays. For completeness, we have also reported the correlations between the ELISAs and our flow cytometry assay (ρ = 0.80 for ELISA #1 and ρ = 0.35 for ELISA #2; Fig. S4).
Figure 6. Comparison of the ability of the PSP flow cytometry and ELISA methods to differentiate between mAbs with low and high levels of nonspecific interactions. Raw binding signals for two control antibodies with low (elotuzumab) and high (ixekizumab) levels of polyreactivity measured using ELISAs and flow cytometry. ELISA #1 and #2 are defined in . The measurements are averages of three experiments and the error bars are standard deviations
Identification of well-defined protein reagents for evaluating antibody polyspecificity
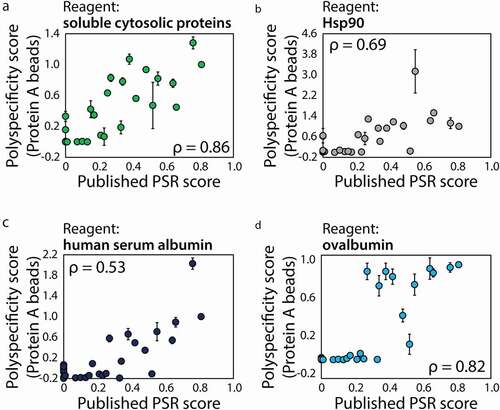
Despite the encouraging performance of our PSP assay, it is still limited by the complexity of the soluble membrane protein reagent generated using CHO cells. We and others find that this reagent is difficult to prepare, especially in a reproducible manner (data not shown). Therefore, we evaluated if other complex reagents, which may be easier to prepare reproducibly, or well-defined protein reagents may yield even stronger correlations with the published PSR measurements ().Citation15 We first evaluated soluble cytosolic proteins (SCP) isolated from CHO cells and observed modestly improved performance (ρ = 0.86; ) relative to measurements using soluble membrane proteins (ρ = 0.74; ). Based on previous reports that Hsp90 can be used to replace the soluble membrane protein reagent,Citation22 we evaluated Hsp90 in our flow cytometry assay () and observed modestly reduced performance (ρ = 0.69). We also tested two albumins, namely human serum albumin (HSA; ) and ovalbumin (). The performance for HSA (ρ = 0.53) was generally similar to Hsp90 and not as strong as the soluble cytosolic protein (ρ = 0.86) and soluble membrane protein (ρ = 0.74) reagents. Interestingly, ovalbumin displayed similar performance (ρ = 0.82) as the best polyspecificity reagent (SCP, ρ = 0.86). We also evaluated ovalbumin in two ELISA formats and found that it performed poorly (Fig. S5), suggesting that ovalbumin itself is not sufficient to improve the ELISA performance. This suggests that ovalbumin, which is a well-defined and inexpensive reagent, in combination with our flow cytometry method may be particularly valuable for evaluating IgG polyspecificity.
Figure 7. Evaluation of complex and defined protein reagents for detecting antibody nonspecific interactions using the PSP assay. (a) Soluble cytosolic proteins (SCP), (b) Hsp90, (c) HSA and (d) ovalbumin were evaluated for detecting antibody nonspecific interactions relative to previous flow cytometry measurements using yeast surface display (soluble membrane proteins).Citation11,Citation15 The PSP scores (y-axes) were calculated as described in , and are averages of three experiments and the error bars are standard deviations
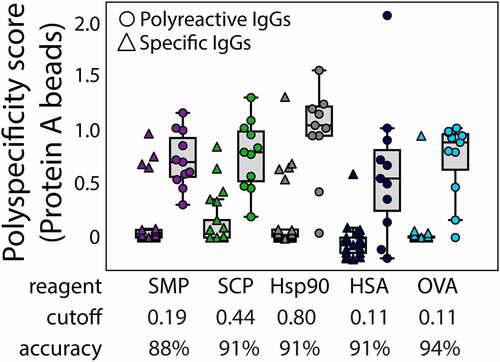
We also evaluated the classification accuracy of the different reagents given the potential importance of using our PSP assay for identifying antibodies with high or low polyspecificity during developability analysis (). Notably, the highest classification accuracy is obtained using ovalbumin (94%), which correctly classifies 30 of 32 clinical-stage mAbs. Three of the other reagents, including two defined protein reagents (Hsp90 and HSA) and one complex reagent (soluble cytosolic proteins) performed similarly (91% accuracy), while the soluble membrane reagent performed modestly worse (88%). Normalized results of 32 antibodies for all four reagents can be found in Table S1.
Figure 8. Accuracies of the PSP flow cytometry measurements for classifying mAbs with low and high polyspecificity. mAbs were defined as polyreactive if their published PSR values (soluble membrane proteins) were >0.2715 and the classification accuracies and cutoff values for the PSP measurements in this work are reported for each reagent. The PSP scores were calculated as described in Fig. 3. The abbreviated reagents are soluble membrane proteins (SMP), soluble cytosolic proteins (SCP), human serum albumin (HSA), and ovalbumin (OVA)
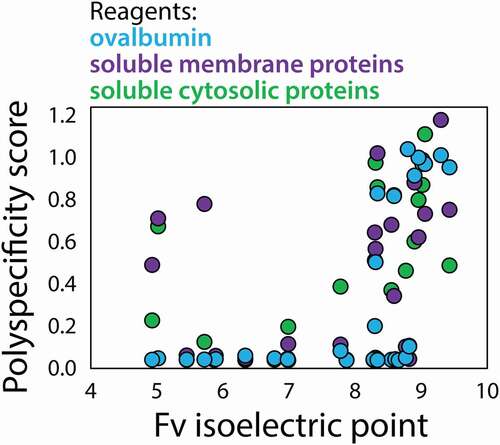
Given previous reports that antibodies with high isoelectric points (pIs) have an increased likelihood of high levels of antibody nonspecific interactions,Citation16,Citation32–35 we evaluated the correlation between Fv pI and our polyspecificity measurements (). Interestingly, ovalbumin, soluble cytosolic proteins and soluble membrane proteins primarily detect polyreactive mAbs with high Fv pIs. Notably, the four mAbs with Fv pIs >9 (and six mAbs with Fv pIs >8.9) all displayed high levels of nonspecific interactions. The fact that ovalbumin binds to antibodies with high pIs is logical given its acidic pI (~4.5). Similarly, it is likely that the high binding activity of soluble membrane proteins for antibodies with high Fv pIs is due the typical negatively charged properties of cell-surface proteins. Interestingly, the soluble cytosolic and membrane protein reagents also detect mAbs with some of the most acidic pIs (Fv pI <6). Overall, these findings demonstrate that these reagents generally detect mAbs with similar charge properties and especially mAbs with highly positively charged Fv regions.
Figure 9. Impact of Fv isoelectric point on antibody nonspecific interactions. Ovalbumin, soluble cytosolic proteins and soluble membrane proteins preferentially detect a subset of mAbs with high Fv isoelectric points, while soluble cytosolic proteins and soluble membrane proteins also detect a subset of mAbs with low Fv isoelectric points. The PSP scores were calculated as described in Fig. 3, and the isoelectric points were calculated based on the Fv sequences
DISCUSSION
Our findings demonstrate the power of flow cytometry for sensitively detecting mAb nonspecific interactions. In our experience, the quality of flow cytometry data using Protein A magnetic beads is generally much higher for both affinity and non-affinity interaction measurements than the corresponding data obtained from methods such as ELISAs. This is likely due to a combination of factors, including differences in detection, washing, and background signals. In particular, we find that the Protein A magnetic beads result in very low background signals when detecting nonspecific binding of biotinylated reagents using fluorescently-labeled streptavidin, which results in signal-to-background ratios of >100 for mAbs with high levels of nonspecific interactions (). This is a notable level of detection sensitivity for nonspecific antibody interaction measurements and is more typical of affinity measurements using flow cytometry or ELISA measurements. This high sensitivity results in robust and reproducible measurements of antibody nonspecific interactions at a level that is superior to ELISAs and other previously reported methods.
There are several other aspects of our PSP assay that deserve further consideration. First, the required antibody concentration is extremely dilute (0.46–15 μg/mL), which is key for antibody candidate analysis during the discovery and protein engineering stages of development. Given the low required sample volume (85 μL per antibody per replicate), the assay requires only ~0.1–4 μg of antibody for triplicate measurements. Second, the nature of the affinity immobilization of mAbs on Protein A beads means that it may not be necessary to purify the antibodies prior to analysis. A similar approach has been reported for affinity-capture self-interaction nanoparticle spectroscopy (AC-SINS) that involves affinity immobilization of mAbs from cell culture supernatants to evaluate antibody self-association without purification,Citation12 and we expect that a similar approach could be used with our PSP assay. Third, the use of Protein A for protein immobilization makes the assay easily amenable to polyspecificity measurements for various protein types multispecific antibodies and Fc-fusion proteins. Fourth, the throughput of the measurements is favorable (up to 96 antibody samples in 3 h) given that flow cytometry is simple to automate. Finally, the use of control antibodies to normalize the signals, as we have done using elotuzumab and ixekizumab antibodies with a common IgG1 framework (Fig. S1), is important to obtain highly reproducible data between different experiments.
It is also notable that ovalbumin proved to be the most useful polyspecificity reagent in our study and even more useful than more complex reagents, including the original PSR reagent composed of soluble membrane proteins. While it is unclear why ovalbumin performs best, it may be due to its unique combination of properties. These properties include the fact that ovalbumin is an acidic protein (pI of ~4.5) and negatively charged at physiological conditions, as discussed above. Moreover, ovalbumin (like other albumins) presents hydrophobic patches on its surface that may also be important for detecting nonspecific interactions. Finally, ovalbumin has several post-translational modifications, including N-acetylation, phosphorylation, and N-linked glycosylation,Citation36 and these diverse chemical moieties may also enable detection of diverse types of nonspecific interactions that have previously been detected using more complex reagents. Regardless, the simple and well-defined nature of ovalbumin is much more attractive and practical than complex reagents such as soluble membrane proteins isolated from CHO cells, and much less expensive and widely available at high purity than chaperones such as Hsp90. This discovery combined with our sensitive flow cytometry assay is expected to accelerate the evaluation of antibody polyspecificity during the discovery and engineering of antibodies for diverse biomedical and therapeutic applications.
In conclusion, our PSP assay addresses several limitations of previous methods for evaluating antibody nonspecific interactions, including issues related to antibody display technologies, sensitivity, reproducibility, and reagent complexity. Our assay yields similar results as more complex methods that require proprietary IgG yeast display technology and poorly defined mixtures of biotinylated cellular components. We expect that our assay will be useful for evaluating large panels of antibody variants to define the molecular determinants of antibody polyspecificity, which we are currently pursuing in our lab. More generally, we expect that our assay, which can be conducted in parallel with affinity analysis using the same Protein A conjugates, will be useful for evaluating antibody candidates during antibody discovery and protein engineering campaigns to identify high-affinity variants with drug-like specificity.
MATERIALS AND METHODS
Soluble membrane and cytosolic protein reagents
The SMP reagent was prepared as previously described.Citation11 Briefly, 109 CHO cells (Gibco, A29133) were pelleted and washed sequentially with PBSB [phosphate-buffered saline (PBS) with 1 mg/mL bovine serum albumin] and Buffer B (50 mM HEPES, 0.15 M NaCl, 2 mM CaCl2, 5 mM KCl, 5 mM MgCl2, 10% Glycerol, pH 7.2). Buffer B was then supplemented with protease inhibitor (Sigma Aldrich, 4693159001) for all subsequent experiments, as denoted as Buffer B+ . The cells were pelleted again and resuspended in 5 mL of Buffer B+. The resuspended cells were homogenized for four cycles (30 s per cycle) and then sonicated for three cycles (30 s per cycle). The suspension was then centrifuged at 40,000× g for 1 h. The supernatant, containing the SCP fraction, and the pellet, containing the SMP fraction, were collected. The protein concentration of the SCP fraction was measured via bicinchoninic acid (BCA) (Fisher, PI23235) assay and diluted to a final concentration of 1 mg/mL.
The membrane protein fraction was resuspended in 3 mL of Buffer B+ with a Dounce homogenizer kit (30 strokes). The protein concentration was determined with a detergent-compatible BCA method (BioRad, 5000116) and diluted to a final concentration of 1 mg/mL with the Solubilization Buffer (50 mM HEPES, 0.15 M NaCl, 2 mM CaCl2, 5 mM KCl, 5 mM MgCl2, 1% n-dodecyl-β-D-maltopyranoside). The suspension was mixed overnight via end-over-end rotation at 4°C. The suspension was centrifuged at 40,000× g for 1 h and the supernatant was collected, which contained the SMP fraction. The protein concentration was measured with the detergent-compatible BCA method and diluted to 1 mg/mL.
Biotinylated protein reagents
Sulfo-NHS-LC-biotin (Thermo Fisher, PI21335) was dissolved in distilled water at ~11.5 mg/mL. For biotinylation of the cellular protein reagents, the stock solution of Sulfo-NHS-LC-biotin (150 μL) was added to SMP (4.5 mL) or SCP (4.5 mL) mixtures and incubated for 45 min at room temperature, rotating end-over-end. Next, the reactions were quenched with hydroxylamine (10 μL of 1.5 M at pH 7.2). Finally, the biotinylated reagents were aliquoted and stored at −80°C for up to 6 months. Ovalbumin (Sigma, A5503) and human serum albumin (HSA; Sigma, A4327) were dissolved at 5 mg/mL in PBS (pH 7.4). For biotinylation of defined protein reagents, the stock solution of Sulfo-NHS-LC-biotin (590 μL) was added to ovalbumin (5 mL) and HSA (5 mL) solutions and incubated for 30 min at room temperature (rotated end-over-end). The reactions were quenched with hydroxylamine (50 μL of 1.5 M at pH 7.2), buffer exchanged into PBS, and diluted to 1.3 mg/mL. The biotinylated reagents were aliquoted and stored at −80°C for up to 6 months.
Hsp90 (Sigma-Aldrich, SRP5191) was diluted to 0.1 mg/mL. Sulfo-NHS-LC-biotin (Thermo Fisher, PI21335) was dissolved in PBS at ~2.5 mg/mL. Stock biotin solution (10 μL) was added to the Hsp90 solution (4 mL) and incubated for 30 min at room temperature (rotated end-over-end). The reaction was quenched with hydroxylamine (5 μL of 1.5 M at pH 7.2), and buffer exchanged into PBS. The biotinylated reagents were aliquoted and stored at −80°C for up to 6 months.
IgG expression and purification
The variable regions of clinical-stage antibodies were cloned into pTT5 mammalian expression plasmids with the constant domains of a common IgG1 framework. The cloning was performed using two restriction sites, namely a SalI restriction site (NEB, R3138) immediately following the leader sequence and preceding the variable regions and the preexisting NheI restriction site (NEB, R3131) for variable heavy domain and BsiWI (NEB, R3553) for variable light domains. The additional SalI site added two amino acids (Val-Asp) at the antibody N-terminus after the leader sequence.
The HEK293-6E cell line (L-11565, National Research Council of Canada) was cultured in F17 media (Thermo Fisher, 50591354) supplemented with L-glutamine (Gibco, 250300801), Kolliphor (Thermo Fisher, NC0917244), and G418 (Gibco, 10131035) at 37°C with 5% CO2 and shaking at 250 rpm using disposable 50 mL conical tubes (Corning, Thermo Fisher, 7203954). Cells (30 mL culture volume) were transiently transfected with 15 μg of total DNA using 45 μg polyethylenimine (PEI MAX, Polysciences Inc., 247651). For most mAbs, heavy and light chain plasmids were used in equal ratios (7.5 μg each) but, in select cases, 90% of total DNA was replaced with empty pTT5 plasmid (0.75 μg of light-chain plasmid, 0.75 μg of heavy-chain plasmid and 13.5 μg of empty plasmid). In other cases, four times more light-chain plasmid was used than heavy-chain plasmid (12 μg of light-chain plasmid and 3 μg of heavy-chain plasmid) to increase the final antibody yield.
Cell cultures were fed with 20% w/v yeastolate (Gibco, Thermo Fisher, 292804) on day 1 or 2 post-transfection, and cultures were harvested on day 5. After centrifugation to remove cellular debris, mAbs were batch purified from culture supernatants using Protein A agarose resin (Thermo Fisher, PI20334). Next, the mAbs were further purified via preparative size-exclusion chromatography (SEC) with a Shimadzu Prominence HPLC System outfitted with a LC-20AT pump, SIL-20AC autosampler and FRC-10A fraction collector. For analytical SEC, 100 µL of antibodies (diluted to 0.1 mg/mL in PBS) were loaded onto the column (Superdex 200 Increase 10/300 GL column; GE, 28990944) and analyzed at 0.75 mL/min using a PBS running buffer supplemented with 200 mM arginine (pH 7.4). Absorbance was monitored at 220 and 280 nm. After SEC purification, mAbs were buffer exchanged twice into PBS using Zeba desalting columns (Thermo Fisher 89890), snap frozen with liquid nitrogen, and stored at −80°C. The % monomer for the antibodies used in this study are reported in Figure S2.
Flow cytometry measurements of antibody polyspecificity
Protein A magnetic beads (Invitrogen, 10002D) were washed three times and diluted to 54 μg/mL in PBSB. Beads (30 μL) were incubated with antibodies (85 μL, 15 μg/mL) overnight. The coated beads were then washed twice by centrifugation (3500x g for 4 min) and resuspended in PBSB. Reagents (0.1 mg/mL ovalbumin, 0.1 mg/mL HSA, 0.1 mg/mL SMP, 0.1 mg/mL SCP and 0.09 mg/mL Hsp90) were incubated with the washed beads. SMP, SCP, and Hsp90 were incubated at 4°C for 20 min, as previously reported.Citation11,Citation22 Ovalbumin and HSA were incubated with the Protein A beads for 3 h at room temperature. The beads were then washed once and incubated with 0.001x streptavidin-AF647 (Invitrogen, S32357) and 0.001x goat anti-human Fc F(ab’)2 AF-488 (Invitrogen, H10120) on ice for 4 min. Finally, the beads were washed once more, resuspended in PBSB, and analyzed via flow cytometry to measure their median fluorescent intensities (MFI). IgGs with the elotuzumab and ixekizumab variable regions and a common IgG1 framework were analyzed in each experiment as controls. Polyspecificity scores were calculated as the MFI for a given mAb minus the MFI for elotuzumab divided by the difference in MFI values for ixekizumab and elotuzumab.
ELISA measurements of antibody polyspecificity
Two ELISA formats were evaluated in this study. In ELISA #1, Protein A coated 96-well plates (Thermo Fisher, 15130) were washed three times with PBSB. mAbs (85 μL of 15 μg/mL) were incubated in ELISA plates (1 h at 23°C). The plates were then washed three times with PBSB. Polyspecificity reagents (SMP at 0.1 mg/mL, ovalbumin at 0.13 mg/mL) were incubated in the plates for 15 min at 37°C. Next, the plates were washed 3× with PBSB, and then streptavidin-HRP (0.001×; BioLegend, 405210) was added for 15 min at 37°C. Finally, the plates were washed 3× with PBSB, TMB was added and quenched with 2 M H2SO4 after 1–2 min, and absorbances were measured at 450 nm.
In ELISA #2, MaxiSorp 96-well plates (Thermo 439454) were washed 3× with PBSB. Polyspecificity reagents (SMP at 0.1 mg/mL, ovalbumin at 0.13 mg/mL) were incubated (1 h at 23°C). The plates were washed 3× with PBSB. Antibodies (85 μL of 15 μg/mL) were incubated in the ELISA plates (15 min at 37°C). Next, the plates were washed 3× with PBSB, and then streptavidin-HRP (0.001×; s, 405210) was added for 15 min at 37°C. Finally, the plates were washed 3× with PBSB, and then TMB was added and quenched with 2 M H2SO4 after 5 min. The absorbances were measured at 450 nm.
Supplemental Material
Download Zip (2.1 MB)Acknowledgments
We thank members of the Tessier lab for their assistance editing the manuscript. This work was supported by the Biomolecular Interaction Technology Center at the University of Delaware.
Supplementary material
Supplemental data for this article can be accessed on the publisher’s website.
Disclosure statement
No potential conflict of interest was reported by the author(s).
Additional information
Funding
References
- Kaplon H, Muralidharan M, Schneider Z, Reichert JM. Antibodies to watch in 2020. mAbs. 2020;12:1703531. doi:10.1080/19420862.2019.1703531.
- Goulet DR, Atkins WM. Considerations for the design of antibody-based therapeutics. J Pharm Sci. 2020;109:74–10.
- Dyson MR, Masters E, Pazeraitis D, Perera RL, Syrjanen JL, Surade S, Thorsteinson N, Parthiban K, Jones PC, Sattar M, et al. Beyond affinity: selection of antibody variants with optimal biophysical properties and reduced immunogenicity from mammalian display libraries. mAbs. 2020;12:1829335. doi:10.1080/19420862.2020.1829335.
- Bailly M, Mieczkowski C, Juan V, Metwally E, Tomazela D, Baker J, Uchida M, Kofman E, Raoufi F, Motlagh S, et al. Developability profiles through early stage discovery screening. mAbs. 2020;12:1743053. doi:10.1080/19420862.2020.1743053.
- Shan L, Mody N, Sormani P, Rosenthal KL, Damschroder MM, Esfandiary R. Developability assessment of engineered monoclonal antibody variants with a complex self-association behavior using complementary analytical and in silico tools. Mol Pharm. 2018;15:5697–710. doi:10.1021/acs.molpharmaceut.8b00867.
- Lecerf M, Kanyavuz A, Lacroix-Desmazes S, Dimitrov JD. Sequence features of variable region determining physicochemical properties and polyreactivity of therapeutic antibodies. Mol Immunol. 2019;112:338–46. doi:10.1016/j.molimm.2019.06.012.
- Sule SV, Dickinson CD, Lu J, Chow C-K, Tessier PM. Rapid analysis of antibody self-association in complex mixtures using immunogold conjugates. Mol Pharm. 2013;10:1322–31. doi:10.1021/mp300524x.
- Sule SV, Sukumar M, WFt W, Marcelino-Cruz AM, Sample T, Tessier PM. High-throughput analysis of concentration-dependent antibody self-association. Biophys J. 2011;101:1749–57. doi:10.1016/j.bpj.2011.08.036.
- He F, Hogan S, Latypov RF, Narhi LO, Razinkov VI. High throughput thermostability screening of monoclonal antibody formulations. J Pharm Sci. 2010;99:1707–20. doi:10.1002/jps.21955.
- He F, Woods CE, Becker GW, Narhi LO, Razinkov VI. High-throughput assessment of thermal and colloidal stability parameters for monoclonal antibody formulations. J Pharm Sci. 2011;100:5126–41. doi:10.1002/jps.22712.
- Xu Y, Roach W, Sun T, Jain T, Prinz B, Yu TY, Torrey J, Thomas J, Bobrowicz P, Vásquez M, et al. Addressing polyspecificity of antibodies selected from an in vitro yeast presentation system: a FACS-based, high-throughput selection and analytical tool. Protein Eng Des Sel. 2013;26:663–70. doi:10.1093/protein/gzt047.
- Wu J, Schultz JS, Weldon CL, Sule SV, Chai Q, Geng SB, Dickinson CD, Tessier PM. Discovery of highly soluble antibodies prior to purification using affinity-capture self-interaction nanoparticle spectroscopy. Protein Eng Des Sel. 2015;28:403–14. doi:10.1093/protein/gzv045.
- Chung S, Nguyen V, Lin YL, Lafrance-Vanasse J, Scales SJ, Lin K, Deng R, Williams K, Sperinde G, Li JJ, et al. An in vitro FcRn- dependent transcytosis assay as a screening tool for predictive assessment of nonspecific clearance of antibody therapeutics in humans. mAbs. 2019;11:942–55. doi:10.1080/19420862.2019.1605270.
- Estep P, Caffry I, Yu Y, Sun T, Cao Y, Lynaugh H, Jain T, Vásquez M, Tessier PM, Xu Y. An alternative assay to hydrophobic interaction chromatography for high-throughput characterization of monoclonal antibodies. mAbs. 2015;7:553–61. doi:10.1080/19420862.2015.1016694.
- Jain T, Sun T, Durand S, Hall A, Houston NR, Nett JH, Sharkey B, Bobrowicz B, Caffry I, Yu Y, et al. Biophysical properties of the clinical-stage antibody landscape. Proc Natl Acad Sci U S A. 2017; 114:944–49. 10.1073/pnas.1616408114.
- Wardemann H, Yurasov S, Schaefer A, Young JW, Meffre E, Nussenzweig MC. Predominant autoantibody production by early human B cell precursors. Science. 2003;301:1374–77. doi:10.1126/science.1086907.
- Hötzel I, Theil FP, Bernstein LJ, Prabhu S, Deng R, Quintana L, Lutman J, Sibia R, Chan P, Bumbaca D, et al. A strategy for risk mitigation of antibodies with fast clearance. mAbs. 2012;4:753–60. doi:10.4161/mabs.22189.
- Kelly RL, Sun T, Jain T, Caffry I, Yu Y, Cao Y, Lynaugh H, Brown M, Vásquez M, Wittrup KD, et al. High throughput cross-interaction measures for human IgG1 antibodies correlate with clearance rates in mice. mAbs. 2015;7:770–77. doi:10.1080/19420862.2015.1043503.
- García-Ojeda PA, Hardy S, Kozlowski S, Stein KE, Feavers IM. Surface plasmon resonance analysis of antipolysaccharide antibody specificity: responses to meningococcal group C conjugate vaccines and bacteria. Infect Immun. 2004;72:3451–60. doi:10.1128/IAI.72.6.3451-3460.2004.
- Jacobs SA, Wu SJ, Feng Y, Bethea D, O’Neil KT. Cross-interaction chromatography: a rapid method to identify highly soluble monoclonal antibody candidates. Pharm Res. 2010;27:65–71. doi:10.1007/s11095-009-0007-z.
- Kim DM, Yao X, Vanam RP, Marlow MS. Measuring the effects of macromolecular crowding on antibody function with biolayer interferometry. mAbs. 2019;11:1319–30. doi:10.1080/19420862.2019.1647744.
- Kelly RL, Geoghegan JC, Feldman J, Jain T, Kauke M, Le D, Zhao J, Wittrup KD. Chaperone proteins as single component reagents to assess antibody nonspecificity. MAbs. 2017;9:1036–40. PMC5627595. doi:10.1080/19420862.2017.1356529.
- Shehata L, Maurer DP, Wec AZ, Lilov A, Champney E, Sun T, Archambault K, Burnina I, Lynaugh H, Zhi X, et al. Affinity maturation enhances antibody specificity but compromises conformational stability. Cell Rep. 2019;28:3300–8.e4. doi:10.1016/j.celrep.2019.08.056.
- Mei M, Li J, Wang S, Lee KB, Iverson BL, Zhang G, Ge X, Yi L. Prompting Fab yeast surface display efficiency by ER retention and molecular chaperon co-expression. Front Bioeng Biotechnol. 2019;7:362. doi:10.3389/fbioe.2019.00362.
- Krah S, Grzeschik J, Rosowski S, Gaa R, Willenbuecher I, Demir D, Toleikis L, Kolmar H, Becker S, Zielonka S. A streamlined approach for the construction of large yeast surface display Fab antibody libraries. Methods Mol Biol. 2018;1827:145–61. doi:10.1007/978-1-4939-8648-4_8.
- Sivelle C, Sierocki R, Ferreira-Pinto K, Simon S, Maillere B, Nozach H. Fab is the most efficient format to express functional antibodies by yeast surface display. mAbs. 2018;10:720–29. doi:10.1080/19420862.2018.1468952.
- Rosowski S, Becker S, Toleikis L, Valldorf B, Grzeschik J, Demir D, Willenbücher I, Gaa R, Kolmar H, Zielonka S, et al. A novel one-step approach for the construction of yeast surface display Fab antibody libraries. Microb Cell Fact. 2018;17:3. doi:10.1186/s12934-017-0853-z.
- Wang B, DeKosky BJ, Timm MR, Lee J, Normandin E, Misasi J, Kong R, McDaniel JR, Delidakis G, Leigh KE, et al. Functional interrogation and mining of natively paired human VH:VL antibody repertoires. Nat Biotechnol. 2018;36:152–55. doi:10.1038/nbt.4052.
- Zhang Y, Wu L, Gupta P, Desai AA, Smith MD, Rabia LA, Ludwig SD, Tessier PM. Physicochemical rules for identifying monoclonal antibodies with drug-like specificity. Mol Pharm. 2020;17:2555–69. doi:10.1021/acs.molpharmaceut.0c00257.
- Rabia LA, Desai AA, Jhajj HS, Tessier PM. Understanding and overcoming trade-offs between antibody affinity, specificity, stability and solubility. Biochem Eng J. 2018;137:365–74. PMC6338232. doi:10.1016/j.bej.2018.06.003.
- Raybould MIJ, Marks C, Krawczyk K, Taddese B, Nowak J, Lewis AP, Bujotzek A, Shi J, Deane CM. Five computational developability guidelines for therapeutic antibody profiling. Proc Natl Acad Sci U S A. 2019;116:4025–30. doi:10.1073/pnas.1810576116.
- Rabia LA, Zhang Y, Ludwig SD, Julian MC, Tessier PM, Daggett V. Net charge of antibody complementarity-determining regions is a key predictor of specificity. Protein Eng Des Sel. 2018;31:409–18. doi:10.1093/protein/gzz002.
- Datta-Mannan A, Thangaraju A, Leung D, Tang Y, Witcher DR, Lu J, Wroblewski VJ. Balancing charge in the complementarity-determining regions of humanized mAbs without affecting pI reduces non-specific binding and improves the pharmacokinetics. mAbs. 2015;7(3):483–93. doi:10.1080/19420862.2015.1016696.
- Birtalan S, Zhang Y, Fellouse FA, Shao L, Schaefer G, Sidhu SS. The intrinsic contributions of tyrosine, serine, glycine and arginine to the affinity and specificity of antibodies. J Mol Biol. 2008;377:1518–28. doi:10.1016/j.jmb.2008.01.093.
- Birtalan S, Fisher RD, Sidhu SS. The functional capacity of the natural amino acids for molecular recognition. Mol Biosyst. 2010;6:1186–94. doi:10.1039/b927393j.
- Yang Y, Barendregt A, Kamerling JP, Heck AJ. Analyzing protein micro-heterogeneity in chicken ovalbumin by high-resolution native mass spectrometry exposes qualitatively and semi-quantitatively 59 proteoforms. Anal Chem. 2013;85:12037–45. PMC388 0056. doi:10.1021/a c403057y.