
ABSTRACT
Monoclonal antibody (mAb) interchain disulfide bond reduction can cause a loss of function and negatively impact the therapeutic’s efficacy and safety. Disulfide bond reduction has been observed at various stages during the manufacturing process, including processing of the harvested material. The factors and mechanisms driving this phenomenon are not fully understood. In this study, we examined the host cell proteome as a potential factor affecting the susceptibility of a mAb to disulfide bond reduction in the harvested cell culture fluid (HCCF). We used untargeted liquid-chromatography-mass spectrometry-based proteomics experiments in conjunction with a semi-automated protein identification workflow to systematically compare Chinese hamster ovary (CHO) cell protein abundances between bioreactor conditions that result in reduction-susceptible and reduction-free HCCF. Although the growth profiles and antibody titers of these two bioreactor conditions were indistinguishable, we observed broad differences in host cell protein (HCP) expression. We found significant differences in the abundance of glycolytic enzymes, key protein reductases, and antioxidant defense enzymes. Multivariate analysis of the proteomics data determined that upregulation of stress-inducible endoplasmic reticulum (ER) and other chaperone proteins is a discriminatory characteristic of reduction-susceptible HCP profiles. Overall, these results suggest that stress response pathways activated during bioreactor culture increase the reduction-susceptibility of HCCF. Consequently, these pathways could be valuable targets for optimizing culture conditions to improve protein quality.
Introduction
Chinese hamster ovary (CHO) cell culture is one of the most commonly used platforms for producing recombinant biotherapeutics such as monoclonal antibodies (mAbs).Citation1 Over the past several decades, the volumetric efficiency of industrial CHO cell cultures has increased dramatically, primarily due to enhanced viable cell density and extended viability of the cultures.Citation2,Citation3 The process conditions used to operate high-density CHO cultures, however, can result in metabolic stresses.Citation4 For example, metabolic byproducts can accumulate in fed-batch cultures to levels that inhibit cell growth and harm viability.Citation5 Further, control over the quality of mAbs in the harvest material has emerged as another potential issue.
Reduction of mAb interchain disulfide bonds has been observed at various stages during downstream processing following bioreactor harvest.Citation6 Studies aimed at identifying the factors that contribute to this phenomenon have largely focused on the role of downstream processing conditions. For example, Trexler-Schmidt et al.Citation7 attributed antibody disulfide reduction to intracellular reducing enzymes (primarily thioredoxin reductase/thioredoxin) that are released when cell lysis occurs due to harsh centrifugation conditions during harvest. Accordingly, efforts to minimize the formation of low molecular weight (LMW) disulfide reduction products have focused on modifying harvest-related processing steps. One proposed solution is to maintain a highly oxidative environment in the harvested cell culture fluid (HCCF) through air sparging for the purpose of shifting the equilibrium of reversible redox reactions toward oxidation.Citation8 Another strategy is to minimize the activity of host cell-derived reducing enzymes by reducing storage temperature,Citation6,Citation9,Citation10 adding chemical inhibitors (e.g., cystine, copper sulfate, ethylenediamine tetraacetic acid) or removing cofactors for the enzymes (e.g., metal ions).Citation7
Less attention has been paid to upstream events, although several studies have identified antibody class, light-chain type, cell line and cell culture process as potentially contributing factors.Citation11–13 Isotopic labeling experiments using dithiothreitol as a reducing agent showed that the disulfide bonds between light and heavy chains were more susceptible to reduction and that this susceptibility depended on the type of light chain.Citation13 A study of the reduction susceptibility of immunoglobin G (IgG) molecules in antibody-depleted cell culture fluid found that disulfide bonds between heavy chain and λ light chain are more susceptible to thioredoxin-dependent reduction than heavy chain and κ light chain.Citation14 Reduction of interchain disulfide bonds during post-harvest processing is rarely seen with antibodies in HCCF from standard bench-scale reactors.Citation7 In comparison, the phenomenon is more readily observed in harvests from large-scale cultures, although the reason for this is unclear. Hutterer et al.Citation14 conducted a series of spike-in experiments comparing the reduction susceptibility of a mAb in different cell lysates from several cell lines and culture conditions, and demonstrated that different lysates exhibit varying reducing activity. Recently, Cura et al.Citation15 reported on a modified fed-batch cell culture process that results in reduction-susceptible harvest material, where the same vessel is used for N-1 seed culture and fed-batch production. Disulfide reduction in the HCCF from this modified culture was abrogated when the sample was stored under a high dissolved oxygen (DO) condition, suggesting that the disulfide reduction could be catalyzed by reducing enzymes present in the harvest material. Using this experimental model, the authors identified metabolic indicators (e.g., higher ratio of lactate to pyruvate in the culture medium and elevated glyceraldehyde dehydrogenase (GADPH) expression) that are altered in the reduction-susceptible process and correlate with disulfide bond reduction during post-harvest processing. Handlogten et al.Citation16 have also reported that increasing the set points for DO, oxidized thiols (e.g., cystine), and/or metal ions prevented mAb reduction in the bioreactor, indicating that the redox status of the cells and/or culture medium could directly affect the disulfide bonds of the recombinant protein. Altogether, these observations suggest that the metabolic state of CHO cells in the reactor can influence the disulfide reduction susceptibility of the HCCF. However, the connection between cell metabolism in the bioreactor and mAb disulfide bond reduction susceptibility in the HCCF remains poorly understood.
One possible link is that metabolic indicators, such as elevated GAPDH expression, reflect a state of heightened metabolic burden and oxidative stress in the cells.Citation17–19 Metabolic burden and oxidative stress are intimately related in industrial CHO cell cultures. Reactive oxygen species (ROS) can derive from increased oxidative phosphorylation and adenosine triphosphate (ATP) generation needed to drive recombinant protein biosynthesis, as well as direct oxidation of medium components and metabolite byproducts.Citation20 Oxidative stress can also result from protein processing in the endoplasmic reticulum (ER), as the oxidoreductases catalyzing protein disulfide bond formation (e.g., ER oxidoreductin 1 and ERO1) generate hydrogen peroxide as a byproduct. In turn, oxidative stress can activate stress response pathways in the ER to further increase ROS generation.Citation21,Citation22 This raises the possibility that oxidative stress experienced by the cells early in the culture can become amplified and persist to induce the buildup of stress response proteins, which include protein degrading enzymes such as reductases (e.g., thioredoxins). These enzymes can be released from lysed cells and result in a disulfide bond reduction-susceptible HCCF.Citation7
In this study, we used label-free liquid chromatography-mass spectrometry (LC-MS) experiments in conjunction with the fed-batch culture models described by Cura et al.Citation15 to determine which, if any, metabolic and stress response pathways were differentially expressed in the bioreactor culture that yielded a disulfide reduction-susceptible HCCF. We found significant differences in the expression of glycolytic enzymes and major reductases between cultures, resulting in reduction-susceptible and reduction-free HCCF. Multivariate analysis of proteomics data from these two culture conditions showed broad differences in protein expression and found an upregulation of chaperone proteins in cells from the reduction-susceptible condition. The chaperone proteins included heat shock proteins (HSPs), which suggests that reduction susceptibility of the HCCF could result from cellular stress response.
Results
Cells cultured under a reduction-susceptible bioreactor condition show-altered expression of metabolic enzymes and disulfide reducing enzymes
A recombinant CHO cell line expressing an IgG molecule was used to investigate the effects of cell culture process on the susceptibility of mAb disulfide bond reduction in the HCCF. We previously observedCitation15 that culturing the cells in the same vessel for N-1 seed and fed-batch production (‘rolled’ bioreactor condition) resulted in disulfide reduction-susceptible HCCF. In contrast, transferring the N-1 seed culture into a fresh vessel for fed-batch production (‘control’ bioreactor condition) resulted in reduction-free HCCF. In general, we observed that disulfide reduction-susceptibility correlated with the expression and activity of the thioredoxin system. The growth profiles and antibody titers of these two bioreactor conditions were indistinguishable. However, we observed significant differences in several metabolic indicators, including the ratio of extracellular lactate to pyruvate, GAPDH expression, 6-phosphogluconate dehydrogenase expression, and glucose-6-phosphate dehydrogenase activity, suggesting a metabolic shift to the pentose phosphate pathway in disulfide reduction-susceptible HCCF.Citation15
Based on these previous findings, we investigated if other glycolytic enzymes contributing to the production of lactate were also upregulated in the rolled condition. This analysis focused on days 7, 8, and 9 of fed-batch culture, corresponding to the stationary phase when the rate of mAb titer increase is maximal (refer to Cura et al.Citation15 for bioreactor data). Untargeted LC-MS experiments were performed to measure the host cell protein (HCP) expression profiles from replicate bioreactor runs of reduction-susceptible (rolled, N = 2) and reduction-free (control, N = 2) conditions. These data were analyzed for enzymes in lower glycolysis (involving 3-carbon molecules), as pyruvate is an end product of this pathway. The untargeted experiments detected four of the seven enzymes in lower glycolysis (). The abundance profiles of aldolase (ALDOB, ) and phosphoglycerate kinase (PGK1, ) did not show a statistically significant difference between the two conditions. Consistent with the previous study by Cura et al.,Citation15 we detected greater abundance of GAPDH in cells from the rolled condition on days 7 and 8 (). The day 9 abundance of GADPH protein was indistinguishable in the two conditions. The GADPH profiles of the two conditions were significantly different (p < .05) as determined by linear regression of abundance differences (Supplementary Figure S1). A similar trend was detected for enolase (ENO1, and S1).
Figure 1. Abundance of lower glycolysis enzymes (a-d) and reductases (e, f). Error bars show SEM (N = 2). Asterisk (*) indicates significant difference (p < .05) in the time profile of protein abundance
Under oxidative stress conditions, GAPDH functions as a metabolic switch to redirect flux into pathways that generate reducing power for antioxidant systems.Citation17–19 These systems include thioredoxins (TRX) and related reductases, which have been identified as host cell-derived factors that contribute to disulfide bond reduction susceptibility of HCCF.Citation6,Citation9,Citation23 We found a significant, nearly two-fold increase in the abundance of thioredoxin reductase 1 (TRXR1, ) and glutathione-disulfide reductase (GSR, ) in cells from the reduction-susceptible condition in the day 7 sample. Both are disulfide reducing enzymes that defend against oxidative damage, suggesting a potential link between oxidative stress and the metabolic changes we observed.
Analysis of untargeted proteomics data shows broad differences in protein abundance between bioreactor conditions of reduction-susceptible and reduction-free HCCF
The above observations showed differences in abundance and expression profiles of several host cell enzymes between reduction-susceptible and reduction-free HCCF. We next investigated if there were broad differences in HCP abundance between the two bioreactor conditions. To this end, we analyzed the variance in the untargeted proteomics data using principal component analysis (PCA). Each batch of LC-MS data was separately analyzed to take into account potentially confounding batch effects.Citation24 Score plots of the first two principal components (PCs) showed that samples from the same batch grouped closely together (Supplementary Figure S2). Nevertheless, distinct groupings by bioreactor condition were detectable within each batch. This is more clearly observed in separate scatter plots of PC scores for each batch. For data set 1 (), separation between the reduction-susceptible (rolled) and reduction-free (control) conditions occurs along the second principal component (PC2), with rolled and control samples having positive and negative PC2 scores, respectively. Together, PC1 (50.2%) and PC2 (29.3%) account for 79.5% of the total variance. For data set 2 (), the first two PCs account for a similar fraction (75.7%) of total variance. However, the separation along PC2 is weaker, with the day 9 sample from the reduction-free condition having a negative PC2 score. To corroborate the sample groupings suggested by the PCA score plots, we performed a multivariate test (permutational multivariate analysis of variance, PERMANOVA), which found that the protein abundance profiles of the rolled and control conditions are significantly different (p-value = 0.022 for data set 1 and 0.014 for data set 2).
Figure 2. (a, b) Scatter plots of first two principal component scores (PC1 and PC2) for data set 1 (a) and data set 2 (b). Values in parentheses show percent variance explained by the corresponding principal component axes. Circles and squares show control and rolled samples, respectively. (c, d) First latent variable (LV1) scores from PLS-DA of data set 1 (c) and data set 2 (d). Panels (e) and (f) show the corresponding LV1 loadings determined from PLS-DA for all peptides in the respective data sets
We next performed a discriminant analysis (PLS-DA) to identify peptides that contribute to the separation between the two bioreactor conditions. Score plots from PLS-DA () showed clear sample groupings along the first latent variable (LV1). For both data sets, samples from the rolled condition projected onto LV1 with lower (more negative scores). Similar to the PCA results, the rolled samples showed a smaller variance in the scores compared to the control samples. The scores of control samples decreased from day 7 to 9. For data set 1 (), the day 9 sample projected with a negative score, closer to the rolled samples. Taken together, the multivariate analysis results suggested that cells from the two bioreactor conditions have distinct protein abundance profiles.
Figure 3. Mean abundance profiles (normalized as described in Section ‘Untargeted Proteomics Data Processing and Annotation’) of significant discriminatory proteins grouped into five clusters. Each line represents one of 85 proteins shown in Table S2. Clusters were obtained using k-means clustering. Optimality of cluster number was determined using the Calinski-Harabasz criterion. The numbers of proteins in each cluster are shown in parentheses next to cluster number
Inspection of LV1 loadings from PLS-DA showed that a subset of peptides contributed disproportionately to the separation between the control and rolled condition samples (). The peptides corresponding to the 50 most positive and 50 most negative loadings were selected for further analysis to determine if the profiles of proteins represented by these peptides were significantly different between sample groups over days 7, 8, and 9 of bioreactor culture.
Stress response proteins are enriched in the set of proteins differentially abundant between cells from reduction-susceptible and reduction-free conditions
To compare the abundance time profiles of discriminatory proteins over days 7, 8, and 9, the proteomics data sets were first processed using a semi-automated procedure for peptide identification and protein annotation (). Data from two sets of bioreactor runs were separately annotated to account for potential batch-to-batch differences in detected peptides. A total of 1,558 and 1,567 unique peptides were detected with high confidence in data set 1 and data set 2, respectively. The loadings criterion identified largely overlapping sets of discriminatory peptides across the two data sets, resulting in a discriminatory set of 125 unique peptides having loadings that are in the top 50 most positive or 50 most negative category in either data set. The abundance time profiles of proteins corresponding to these peptides were then compared between the two bioreactor conditions using ANCOVA. This identified 85 discriminatory proteins detected in all 12 samples (across both data sets) that exhibited significantly different (p < .05) abundance profiles between the two bioreactor conditions (supplementary Table S2). p-values were calculated by ANCOVA. A cutoff value of p = .05 was used as the significance threshold.
We next performed a k-means clustering analysis to determine which, if any, of the significant discriminatory proteins exhibited similar abundance profiles across the bioreactor conditions and time points. The optimal number of clusters was determined using the Calinski-Harabasz index (Supplementary Figure S3, panel A). A Silhouette plot (Supplementary Figure S3, panel B) confirmed k = 5 as the correct number of clusters that produces the smallest cluster assignment error (no overlap between clusters). The trends in each cluster are shown in (). The composition of each cluster is shown in the heatmap of Supplementary Figure S4.
Cluster 1, comprising the largest number of proteins (27), did not show a discernible overall trend, although individual proteins in the cluster show different abundance time profiles between the two bioreactor conditions. Cluster 2 proteins decreased in abundance from day 7 to 9 for the control conditions, whereas they either remained low (relative to control day 7) or increased from day 7 to 9 for the rolled condition. Cluster 3, comprising the fewest proteins (7), remained low in the control condition (relative to rolled day 9) and increased from day 7 to 9 in the rolled condition. Cluster 4 proteins increased steadily in the control condition, whereas they remained elevated (relative to control day 7) for the rolled condition. Cluster 5 proteins showed the same trend as cluster 4 for the control conditions, but steadily decreased in abundance over time for the rolled condition.
To determine if proteins in the same cluster participate in related biological processes, we performed a gene ontology (GO) analysis. The GO terms for the proteins are presented in Supplementary Table S2. This analysis showed that a majority of cluster 1 comprised metabolic enzymes, with 13 of 27 proteins catalyzing reactions in glycolysis, pyruvate metabolism, or the TCA cycle. Cluster 2 largely comprised proteins annotated with GO terms related to protein processing. Cluster 3 included cell signaling, protein processing, and metabolic proteins. The dominant biological process of cluster 4 was again protein processing, specifically in the ER, and included several proteins associated with cellular stress response. Cluster 5 did not associate with a dominant GO term in the biological process domain. However, several of the proteins in the cluster were annotated with GO terms related to protein processing.
To determine statistically significant GO terms, an enrichment analysis was performed using the STRING database. After correcting for false discovery rate (FDR), the lowest significant p-values (<10–4) were calculated for translation, translational elongation, and cellular metabolic process (Table S3). All three terms were associated with cluster 4. Other significant GO terms were protein folding, biological regulation, and oxidation-reduction process. A majority of the proteins associated with the significant GO terms belonged to families of HSPs or Eukaryotic elongation factor (EEF) complexes. These results suggested that elevation of chaperones is a significant discriminatory characteristic of HCPs from the rolled (reduction-susceptible) condition. p-values were calculated using Fisher’s exact test and adjusted for FDR using the Benjamini–Hochberg procedure.
Protein–protein interaction analysis identifies a network of heat shock and ER chaperone proteins
We next investigated which, if any, of the proteins in the above identified clusters interacted with each other. This analysis focused on proteins in clusters 4 and 5, which showed a general upregulation in the reduction-susceptible condition. These proteins showed a steady increase in abundance for the control condition and higher abundance on day 7 (compared to day 7 control) for the rolled condition. The protein–protein interaction network was generated using STRINGCitation25 and rendered into an undirected graph using Cytoscape (, supplementary Figure S5). A single network connecting a majority (17/21) of the proteins in cluster 4 was detected based on STRING’s confidence scores of known interactions between proteins. This network comprised proteins related to protein processing (EEFs and ATP-dependent chaperone complex), protein synthesis (ribosomal proteins and nucleolar protein), or stress response (HSPs, hypoxia upregulated protein). This network also connected several proteins in cluster 5, including HSP 90 alpha (HSPCA), ribosomal proteins L3, and L10, and an ATP synthase subunit. Taken together with the k-means clustering results, the protein–protein interaction analysis suggests that the cells from the reduction-susceptible bioreactor were subjected to elevated cellular stress.
Figure 4. Significant interactions between proteins in clusters 4 and 5. Functional protein interaction network analysis was performed on the basis of interaction data in the STRING database (version 11.0). Cytoscape was used to visualize the resulting connected graph. Dark and light nodes are proteins from cluster 4 and 5, respectively. A line between two nodes indicates that the pair has at least one known or predicted interaction. A thicker line indicates that there is higher confidence in the interaction, e.g., due to experimental evidence for protein-protein binding
Discussion
Previous studies have implicated protein disulfide reductases such as TRX in the reduction of antibodies in HCCF.Citation9,Citation10,Citation23,Citation26 The study by Cura et al.Citation15 found that reduction-susceptible HCCF from a rolled tank bioreactor condition contained higher levels of TRX and increased metabolic markers, including GAPDH and lactate/pyruvate ratio. These data suggest that a metabolic shift in cells during production, caused by bioreactor conditions, can result in antibody reduction susceptibility after harvest. However, the mechanisms responsible for the observed metabolic shift and increased abundance of reductases in the disulfide reduction-susceptible HCCF were unclear.
To address these questions, we compared the abundance of HCPs in samples from control and rolled bioreactor conditions that result in reduction-free and reduction-susceptible HCCF, respectively. We focused on three timepoints (days 7, 8, and 9) that correspond to the shift to stationary phase of bioreactor culture. Multivariate discriminant analyses (PLS-DA) performed on normalized protein abundances showed a clear separation between samples from the control and rolled bioreactor conditions (), indicating that the cells grown under these two conditions had broadly different protein expression profiles. Comparisons of the top discriminatory proteins (having the most positive or negative LV1 loadings) using ANCOVA identified 85 proteins having significantly different trends in their relative abundance between the reduction-susceptible and reduction-free bioreactor conditions. Clustering the proteins followed by GO term enrichment analysis pointed to an upregulation of ER proteins on day 7 as a discriminatory trend of the rolled bioreactor condition. Moreover, this group of early upregulated proteins (cluster 4, , Supplementary Figure S3) included several HSPs associated with cellular stress response. Taken together, these findings suggest that the increased abundance of reductases () and metabolic shift observed in reduction-susceptible HCCF could be correlated with cell stress.
CHO cell proteomics
LC-MS has been widely used to study proteomes of CHO cells. However, identification and annotation of detected peptides remain challenging due to the complexity of the data. For example, tryptic digests of whole-cell lysates result in peptides having sequences that are common to multiple proteins. A related problem is quantification, which is difficult because a protein can be represented by multiple peptides detected at varying intensities. In this study, we developed a semi-automated workflow to systematically annotate data from label-free, untargeted LC-MS experiments and select confidently identified peptides (FDR of incorrectly identified peptides <1% and confidence level >95%) for protein quantification. The number of unique CHO cell proteins identified in our study (~1,600) is comparable to previous studies. Comparing the host cell proteomes of CHO K1, CHO S, and CHO/dhFR− cells, Xu et al.Citation27 detected 1,307 proteins that were expressed in all three cell lines. Park et al.Citation28 analyzed HCPs released from viable and lysed CHO DG44 and DXB11 cells, and identified ~2,000 proteins that accumulated in fed-batch cultures of the cells. A similar number of proteins were identified in a study by Lakshmanan et al.Citation29 that compared the host cell proteomes of K1, DXB11, and DG44 cell lines.
These and other previous studies were generally concerned with studying growth- or recombinant product-related differences by, for example, comparing cultures at different growth stages,Citation27,Citation28 characterizing the effects of a temperature shiftCitation30,Citation31 or depletion of a growth-regulating miRNA/mRNA,Citation32,Citation33 or monitoring the glycoproteins in the culture medium.Citation34–36 In contrast, our study focused on differences in HCP abundance between cultures that exhibit essentially identical growth and productivity profiles, yet result in HCCF having varying susceptibility to disulfide reduction of the mAb product, a demonstrated issue for protein quality in biomanufacturing.Citation37,Citation38 Consistent with our earlier observation regarding metabolic indicators,Citation15 we found significant differences in the abundance of several glycolytic enzymes. Furthermore, we found differences in the abundance of proteins that function in protein folding and cellular stress response.
There have been only a limited number of proteomics studies on CHO cell stress response. One study on the effects of butyrate and zinc sulfate exposure found that expression of ENO1 and TRX correlated with cellular stress induced by these two additives. More recently, Xie et al.Citation39 reported that exposure of CHO cells to methyl tert-butyl ether, an oxidant and cytotoxic chemical, induced the upregulation of antioxidant enzymes and HSP family A members 8 and 9 (HSPA8 and HSPA9). In this study, we detected a greater abundance of both HSPs, as well as ENO1 and TRXR1, in the reduction-susceptible bioreactor condition.
Early upregulation of chaperones indicates cell stress
Enrichment analysis showed that the proteins upregulated on day 7 in the rolled condition (clusters 4 and 5) were significantly associated with translation and metabolic processes (Tables S2 and S3). These proteins include stress-inducible protein folding and processing-related proteins located in the ER (HSP90B1, HYOU1, and RPN2), cytosol (CCT2, CCT5, and HSPCA), and mitochondria (HSPA9). In addition to chaperone function, the ER proteins (HSP90B1 and HYOU1) and heat shock proteins (HSPCA and HSPA9) also regulate Ca2+ signaling and are essential for protein assembly and folding as well as degradation of misfolded proteins.Citation40–42 The chaperones CCT2 and CCT5 interact with heat-shock proteins (e.g., HSP90B1) to regulate Ca2+ signaling in response to stress in the ER. In CHO cells, HSP90B1 is induced by glucose limitation or ER stress.Citation43,Citation44 Expression of HSPA9 in CHO cells is increased with accumulation of unfolded protein in the ER.Citation45 Recently, Xie et al.Citation39 highlighted HSPA9 as a marker of oxidative stress in CHO cells. Upregulation of HYOU1 occurs under hypoxia,Citation46 as well as ER stress-induced unfolded protein response. Wei et al.Citation47 showed that these ER chaperones were upregulated as cells aged during extended CHO cell culture.
In addition to heat shock (thermal stress), chaperone upregulation can be caused by oxidative stress, and thus one possible explanation for our observations is that cells in the rolled condition experienced greater oxidative stress earlier in the culture. Combined with the enhanced demand for oxidative protein folding by enzymes, such as ERO1 due to recombinant protein overexpression, the oxidative stress could exacerbate ROS accumulation in the ER. It has been shown that the oxidative stress response in the ER is accompanied by upregulation of chaperones,Citation48 possibly to resolve ROS-induced misfolding of proteins.Citation49,Citation50 Potentially exacerbating the oxidative stress is the depletion of ROS scavenging enzymes in the rolled bioreactor condition, including superoxide dismutase, catalase, glutathione peroxidase (GPx7), and peroxiredoxin (Supplementary Figure S6).
The source of increased oxidative stress in the rolled bioreactor condition is unclear. One possible explanation is that draining the bioreactor during inoculation while continuously heating the vessel induced a heat shock response. During the drain and refill process, cells on or near the vessel’s interior glass surface could experience temperatures above 40°C (data not shown). Previous studies have shown that temperatures in this range can elicit a heat shock response that, once triggered, could result in lasting effects on cell metabolism and stresses in the early part of the production culture.Citation51,Citation52 Alternatively, the transient elevation in reactor temperature at the beginning of culture could have catalyzed the formation of oxidant chemicals that promote oxidation of medium components over the duration of bioreactor culture. As ROS production can be induced by many abiotic stresses, it is possible that both mechanisms, as well as other bioreactor culture-related stresses, contribute to the upregulation of antioxidant enzymes and chaperones.
ER stress and oxidative stress are potential drivers for increased abundance of reductases in the reduction-susceptible HCCF
Our findings regarding the upregulation of ER chaperones and stress response proteins in the rolled bioreactor condition, which could explain the increased abundance of protein disulfide reductases in the HCCF, are summarized in (). We detected an earlier (day 7) increase in the abundance of calmodulin (CAM) and elongation factor 2 (EEF2) in the rolled bioreactor compared to the control bioreactor. CAM is a Ca2+ activated messenger protein implicated in oxidative stress response of CHO cells.Citation53 In the presence of ROS, such as H2O2, CAM mediates the activation of EEF2 via Ca2+/CAM-dependent protein kinase III (CAMK) (, #1). In the ER, the decrease in Ca2+ weakens the association of ER chaperone binding immunoglobin protein (BiP) with unfolded and aggregated proteins (, #2), resulting in an increase of unfolded proteins.Citation54 Degrading or refolding these proteins requires the calreticulin (CRT)/calnexin (CNX) quality control cycle (, #3).Citation27 We detected an increase in the abundance of CRT in the rolled condition, along with other chaperones (HSPs), which suggests an ER stress response (i.e., unfolded protein response) typically associated with ROS accumulation.Citation49
Figure 5. Oxidative stress response and protein reduction pathways in cells from the reduction-susceptible bioreactor condition. Blue arrows indicate proteins detected at greater (up arrow) or lower (down arrow) abundance in cells from the rolled condition compared to control. Some signaling pathway components (e.g., TRX) that we were unable to quantify are included in the figure to connect the detected proteins according to known pathways of oxidative stress signaling and ER stress response. The proteins were grouped into subsystems (numbers in circles) based on their pathway membership (Supplementary Table S2) and cellular compartment. The subsystems and their interactions are discussed Section ‘ER Stress and Oxidative Stress are potential Drivers for Increased Abundance of Reductases in the Reduction-Susceptible HCCF’. BiP: immunoglobin protein; CAM: calmodulin; CAMK: CAM-dependent protein kinase III; CAT: catalase; CNX: calnexin; CRT: calreticulin; EFF2: Elongation factor 2; ERO1: ER oxidoreductin 1; GPx: glutathione peroxidase; GSH: glutathione; GSSG: glutathione disulfide; GSR: Glutathione-disulfide reductase; GST: glutathione s-transferase; HSPs: heat-shock proteins; NADPH: nicotinamide adenine dinucleotide phosphate; PDI: protein disulfide isomerase; TRX: thioredoxin; TRXR: thioredoxin reductase; UPR: unfolded protein response
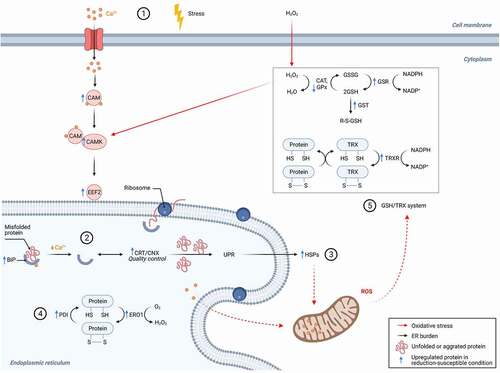
Protein folding activity in the ER can itself be a source of ROS generation. Folding and re-folding of unfolded or misfolded proteins within the ER is facilitated by protein disulfide isomerase (PDI), which catalyzes disulfide bond formation and isomerization.Citation55 Oxidative folding by PDI results in the reduction of the isomerase, which needs to be regenerated to its oxidized form by oxidizing enzymes such as ERO1. This, in turn, generates H2O2 as a byproduct (, #4). We also found increased abundance of several antioxidant enzymes in the rolled condition, including TRXR1, GSR, and glutathione-S-transferase (). In concert with the glutathione (GSH) reductase system, the TRXR system protects against oxidative damage to macromoleculesCitation56 by reducing oxidized cysteine and methionine residues (, #5).
It should be noted that antibody reduction likely occurs in harvested material (HCCF) after cells are lysed.Citation7,Citation15 Specifically, thioredoxins and GSH released from lysed CHO cells into the cell culture fluid have been shown to reduce antibody interchain disulfide bonds.Citation23,Citation26 Greater abundance of TRXR1 in cells from the rolled bioreactor could thus result in a HCCF having an enhanced capacity for TRX-catalyzed mAb disulfide bond reduction, especially when the HCCF sample is stored and processed under non-oxidizing conditions. Activity of TRX in the HCCF would be further enhanced in the presence of free thiols, as well as enzymes capable of regenerating these thiols. This scenario is consistent with our observation that the cells from the rolled bioreactor showed a greater abundance of GSR, which regenerates the free thiol GSH from the oxidized glutathione dimer (GSSG).
In conclusion, we have shown that cells at stationary phase (several days before harvest) have a significantly different HCP expression profile in a reduction-susceptible bioreactor condition compared to cells in a reduction-free condition. The proteins that most significantly discriminate between the two bioreactor conditions include HSPs that function as intracellular chaperones. The abundance of these proteins trended higher in the reduction-susceptible condition. Taken together with increased abundance of antioxidant enzymes, this suggests that the cells from the reduction-susceptible conditions experienced greater oxidative stress. When these cells are lysed during harvest, the release of TRXR and GSR could establish a more reductive environment in the HCCF. Our previous study showed that TRXR protein expression and activity were both significantly elevated in reduction-susceptible HCCF samples compared to reduction-free samples.Citation15 Whether the oxidative stress results from direct induction of a heat shock response, oxidizing chemicals in the culture medium, or other abiotic stresses remains to be elucidated and warrants further studies. Prospectively, mitigating these stresses during the cell culture could benefit post-harvest HCCF processing and improve control over product quality.
Materials and methods
Cell line and cell culture medium
Chemically defined Bristol–Myers Squibb-proprietary basal and feed cell culture media and a proprietary recombinant CHO cell line expressing an IgG antibody were used in these experiments. Unless otherwise noted, all chemicals and reagents were purchased from Sigma–Aldrich (St. Louis, MO).
Bench-scale bioreactors and cultivation conditions
Recombinant, suspension adapted IgG producing CHO cells were cultured in 250 mL, 1 L and 3 L shake flasks. The shake flask cultures were placed in a shaking incubator (Kuhner, Basel, and CH) at 36.5°C and agitation rate 150 rpm in a humidified atmosphere of 5% CO2. Bench-scale bioreactor cultivations for both N-1 seed and fed-batch production were carried out in separate 5 L stirred glass bioreactors (Sartorius, Goettingen, DE). This two-vessel cultivation was designated as the ‘reduction-free (control)’ condition.Citation15 For cultivation of CHO cells producing IgG molecules susceptible to disulfide reduction, the same vessel was used for the N-1 seed and fed-batch production. The N-1 seed bioreactor was drained of its content until only enough volume remained to inoculate a fed-batch production bioreactor. This was followed by addition of fresh, room temperature medium to the same vessel to reach the starting volume for a 5 L production bioreactor. This single vessel cultivation was designated as the ‘disulfide reduction-susceptible (rolled)’ condition.
The 5 L bioreactors were equipped with pH and dissolved oxygen (DO) probes for online monitoring and control. Sparging of CO2 gas was used for upper end pH control. Agitation, aeration, and oxygen sparging were used to control pCO2 and air saturation to the desired ranges. Cell density and viability were monitored by daily offline measurements (Vi-Cell XR, Beckman Coulter, Atlanta, GA, USA). Offline measurements for pH, air saturation, and pCO2 were performed on a pHOx pH/gas analyzer (Nova Biomedical, Waltham, MA, USA). Glucose, lactate, and pyruvate profiles were measured with Cedex Bio HT (Roche, Indianapolis, IN, USA). Cell culture samples (7–10 mL) were collected daily. The samples were immediately centrifuged at 660 g, 4°C for 10 minutes to obtain separate aliquots of medium supernatant and cell pellet. The supernatant and pellet samples were stored at −80°C until further analysis.
Host cell protein extraction and sample preparation
Proteins were extracted from cell pellet samples using an organic solvent mixture of methanol, chloroform, and water (47.6:47.6:4.8 v/v/v) as described previouslyCitation57 with modifications for a high-density suspension-adapted cell culture. Cell pellets from the 5 L production bioreactors were thawed and rinsed with ice-cold 1× phosphate-buffered saline. Calculated amounts of methanol/water (91:9 v/v) and chloroform were added to arrive at the final solvent mixture. Samples were vortexed for 15 seconds, and then subjected to three freeze-thaw cycles to lyse the cells. The lysed sample was transferred to a fresh sample tube and centrifuged for 10 min at 15,000 g and 4°C. After removing the supernatant, equal volumes (650 µL) of extraction buffer and TRizol® reagent were added to solubilize and to denature the protein pellet. The extraction buffer was an aqueous solution of 50 mM Tris (pH 7.6), 0.5% (w/v) sodium dodecyl sulfate, and 1% (v/v) β-mercaptoethanol. After incubating for 1 h at 37°C, the sample was vortexed for 15 seconds and centrifuged for 15 min at 14,000 g and 4°C to obtain phase separation. The bottom phase containing proteins was collected in a fresh sample tube, mixed with 1 mL of ice-cold acetone, stored overnight at −20°C, and centrifuged the next day for 15 min at 14,000 g and 4°C to pellet the precipitated proteins. After discarding the supernatant, the pellet was washed three times with 1 mL ethanol, and dried in a SpeedVac concentrator (Eppendorf, Hauppauge, NY). The dried proteins were reduced by incubating the sample for 30 min at 37°C with 50 µL of an 8 M urea and 50 mM dithiothreitol (Sigma–Aldrich) solution in 50 mM Tris-HCl (Trizma hydrochloride, Sigma–Aldrich). Then, 5 µL of 500 mM iodoacetamide (Sigma–Aldrich) were added and the mixture was incubated for 15 min at room temperature in the dark to alkylate cysteine residues. The reduced and alkylated proteins were digested by adding trypsin (10 µg protease per 1 mg protein) in 1 M Tris-HCl with 1 mM calcium chloride and incubating the sample overnight at 37°C. The digestion was quenched by lowering the pH to 2 using formic acid. The sample was centrifuged for 5 min at 14,000 g and 4°C to pellet any remaining undigested protein. The supernatant was collected and stored at −20°C for LC-MS analysis.
Untargeted proteomics using LC-MS
The digested peptides were analyzed on a triple quadrupole time-of-flight (TOF) MS system (TripleTOF® 5600+, AB Sciex, Framingham, MA) coupled to a binary pump high-performance LC system (Agilent 1260). The samples were run in a randomized order. Detection of the peptides was performed in positive electrospray ionization (ESI+) mode using information-dependent acquisition (IDA). Full-scan (TOF) MS spectra (300–1,250 m/z) were acquired for precursor ions having charge states of +2 to +5. Mass tolerance was set to 50 mDa. The scans excluded isotopes within 4 Da. Dependent (IDA) scans were triggered when an ion count exceeded 100 cps. Prior to ionization, the peptides were separated on a reverse-phase (RP) column (Ascentis® Express C18, 2.7 μm 100 Å 150 × 2.1 mm, Sigma–Aldrich) using a gradient method. The column oven temperature was set to 35°C. Mobile phase A was a 0.1% (v/v) formic acid solution in water and mobile phase B was a 0.1% (v/v) formic acid solution in acetonitrile. The flow rate was set to 200 µL/min. The solvent gradients are described in Supplementary Table S1.
Untargeted proteomics data processing and annotation
Untargeted LC-MS proteomics data from replicate bioreactor runs of reduction-free (control, N = 2) and disulfide reduction-susceptible (rolled, N = 2) conditions were acquired in two batches. Raw data from the LC-MS experiments were processed through a series of quality control and annotation steps to identify the detected peptides and determine the abundance of proteins represented by the peptides (). An ion library covering all samples in a batch was generated in ProteinPilot (version 5.1, AB Sciex) from IDA scan data of every detected precursor ion for which an exact mass was determined (, step 1). The ions were assigned peptide sequences and corresponding protein identities by searching Chinese hamster (Cricetulus griseus) protein sequences in the UniProtKB/Swiss-Prot database using ProteinPilot’s Paragon algorithm (step 2). The ions having assigned peptide sequences were collected into a feature table, where each feature is specified by a chromatographic retention time (0.5 min. window), accurate mass (m/z value, tolerance 10 ppm), peak height in the corresponding extracted ion chromatogram (XIC), and the assigned peptide sequence. The features were then filtered based on peak height (100 cps threshold) to remove ions (peptides) detected with poor signal.
Figure 6. Data processing workflow for untargeted LC-MS proteomics of CHO cell extracts
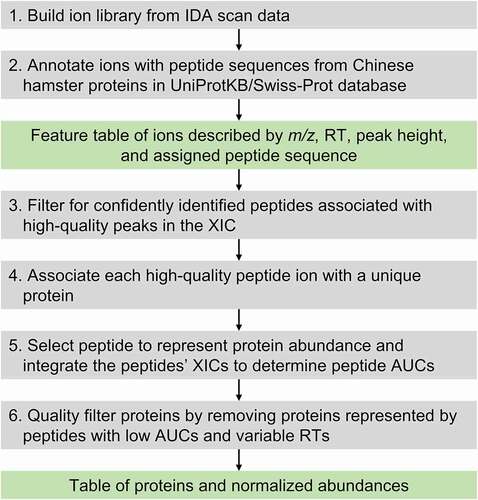
The feature table was further analyzed using a script written in MATLAB (R2019b, MathWorks, Natick, MA) to select confidently identified high-quality peptides (step 3), determine the proteins represented by the selected peptides (step 4), and quantify the relative abundance of the proteins (step 5). For step 3, the following criteria were applied to determine that a peptide was confidently detected: 1) a peptide is represented by a distinct combination of accurate mass and retention time (RT), i.e., the peptide’s m/z and RT differ by more than 0.1 and 0.5 min, respectively, compared to all other peptides in the feature table; 2) a peptide belongs to only one protein; 3) a peptide is observed more than once, e.g., two different charge states are detected.
For step 4, the following criteria were applied to determine that protein was confidently represented by the detected peptides: 1) the protein was identified based on at least two peptides; 2) at least two peptides associated with the protein have a confidence score greater than 95%. Peptides meeting the above criteria and belonging to confidently detected proteins were quantified in MultiQuant (version 2.1 AB Sciex) by manually integrating the peptides’ peak areas (AUCs) in the corresponding XICs (step 5). The peptide AUCs of a sample were normalized twice, first by the sum of all peptide AUCs for the sample, and then the total ion current from the TOF survey scan. An additional set of quality filters was applied to exclude peptides that do not have an AUC above blank in at least 80% of samples, and peptides with RTs deviating more than 0.5 min between samples were also excluded (step 6). The peptide with the largest average normalized AUC across all samples was selected to represent the corresponding protein’s abundance. Finally, the abundance of a protein in a sample was scaled to the largest abundance across all samples in the same batch.
Statistical analysis
Expression profiles of glycolytic enzymes from reduction-free and reduction-susceptible conditions were compared by first calculating the differences in relative abundance between the conditions at matching time points, and then performing a linear regression through these points with culture time as the predictor variable. Differences in abundance were calculated separately for each batch of proteomics data, resulting in a regression model fitted to six data points for each glycolytic enzyme. A cutoff p-value of 0.05 was used to determine that a regression line had a significant (non-zero) slope, and thus indicated a protein expression profile differed between the two bioreactor conditions. This analysis was performed in Prism (version 8, GraphPad, San Diego, CA). Principle components analysis (PCA) was performed on the LC-MS data (normalized AUCs of peptides) using MATLAB to visualize sample groupings.Citation58 In addition, permutational multivariate analysis of variance (PERMANOVA) was performed using the FATHOM Toolbox for MATLAB to test if there was a statistically significant difference in HCP abundance profiles between reduction-susceptible and reduction-free conditions.Citation59
Subsequently, a partial least squares discriminant analysis (PLS-DA) was performed using the NIPALS algorithm implemented in MATLAB to identify peptides (and corresponding proteins) that discriminate samples from disulfide reduction-susceptible and reduction-free bioreactor conditions. Mean centering was used as the data scaling method. Discriminatory proteins contributing to the separation between sample groups were selected based on loadings of the first latent variable. The loadings were first sorted from the smallest (most negative) to the largest (most positive), and then the top 50 most positive and negative loadings were selected. The abundance time profiles of proteins corresponding to these loadings were tested for statistical significance between the two bioreactor conditions using analysis of covariance (ANCOVA). This analysis treated each replicate time point as an individual data point, resulting in a regression model fitted to six data points for each discriminatory protein of interest.Citation60 For a protein of interest, the ANCOVA test compared the slopes and intercepts of two regression lines corresponding to the protein’s abundance time profiles in cells from reduction-susceptible and reduction-free bioreactor conditions. A cutoff p-value of 0.05 was used to determine that a pair of regression lines are significantly different and thus indicate that the protein’s expression profile differed across the two bioreactor conditions. A k-means clustering analysis was performed on these significant proteins to identify groups that exhibit similarly different expression patterns between the two conditions. Euclidean distance was used as the similarity metric. The Calinski-Harabasz index was used to determine the optimal number of clusters,Citation61 and Silhouette coefficient values were calculated to confirm that correct clusters have been obtained with no overlap between clusters. This analysis only considered significant proteins detected in both sets of replicate bioreactor runs (Supplementary Table S2). Interactions between proteins within clusters having similarly different expression profiles between reduction-susceptible and reduction-free bioreactor conditions were analyzed using the STRING database (version 11.0, https://string-db.org) and visualized using Cytoscape (version 3.8.1, https://cytoscape.org).Citation62
Abbreviations
Supplemental Material
Download Zip (28.7 KB)Acknowledgments
The authors are grateful for the financial support of this work provided by Bristol–Myers Squibb, Devens, MA, USA. The author thanks Karin Yanaki, Lee lab at Tufts University, for her kind support with regard to protein annotation.
Disclosure statement
No potential conflict of interest was reported by the author(s).
Supplementary material
Supplemental data for this article can be accessed on the publisher’s website
Additional information
Funding
References
- Yusufi FNK, Lakshmanan M, Ho YS, Loo BLW, Ariyaratne P, Yang Y, Ng SK, Tan TRM, Yeo HC, Lim HL, et al. Mammalian systems biotechnology reveals global cellular adaptations in a recombinant CHO cell line. Cell Syst. 2017;4(5):530–14. doi:10.1016/j.cels.2017.04.009. PMID: 28544881.
- Lee H-W, Bhatia H, Park S-Y, Kamga M-H, Reimonn T, Sha S, Zhuangrong H, Galbraith S, Liu H, Yoon S. Process analytical technology and quality by design for animal cell culture. In: Lee GM, Kildegaard HF, editors. Cell culture engineering: recombinant protein production. Weinheim (Germany): Wiley-VCH Verlag GmbH & Co. KGaA; 2019. p. 365–90. doi:10.1002/9783527811410.ch15.
- Morris C, Polanco A, Yongky A, Xu J, Huang Z, Zhao J, McFarland KS, Park S-Y, Warrack B, Reily M, et al. Big data analytics identifies metabolic inhibitors and promoters for productivity improvement and optimization of monoclonal antibody (mAb) production process. Bioresour Bioprocess. 2020;7(1):1–13. doi:10.1186/s40643-020-00318-6.
- Das TK, Narhi LO, Sreedhara A, Menzen T, Grapentin C, Chou DK, Antochshuk V, Filipe V. Stress factors in mAb drug substance production processes: critical assessment of impact on product quality and control strategy. J Pharm Sci. 2020;109(1):116–33. doi:10.1016/j.xphs.2019.09.023. PMID: 31593689.
- Mulukutla BC, Kale J, Kalomeris T, Jacobs M, Hiller GW. Identification and control of novel growth inhibitors in fed-batch cultures of Chinese hamster ovary cells. Biotechnol Bioeng. 2017;114(8):1779–90. doi:10.1002/bit.26313. PMID: 28409820.
- O’Mara B, Gao Z, Kuruganti M, Mallett R, Nayar G, Smith L, Meyer JD, Therriault J, Miller C, Cisney J, et al. Impact of depth filtration on disulfide bond reduction during downstream processing of monoclonal antibodies from CHO cell cultures. Biotechnol Bioeng. 2019;116(7):1669–83. doi:10.1002/bit.26964. PMID: 30883673.
- Trexler-Schmidt M, Sargis S, Chiu J, Sze-Khoo S, Mun M, Kao Y-H, Laird MW. Identification and prevention of antibody disulfide bond reduction during cell culture manufacturing. Biotechnol Bioeng. 2010;106:452–61. doi:10.1002/bit.22699. PMID: 20178122.
- Mun M, Khoo S, Do Minh A, Dvornicky J, Trexler-Schmidt M, Kao Y-H, Laird MW. Air sparging for prevention of antibody disulfide bond reduction in harvested CHO cell culture fluid. Biotechnol Bioeng. 2015;112(4):734–42. doi:10.1002/bit.25495. PMID: 25384896.
- Kao Y-H, Hewitt DP, Trexler-Schmidt M, Laird MW. Mechanism of antibody reduction in cell culture production processes. Biotechnol Bioeng. 2010;107(4):622–32. doi:10.1002/bit.22848. PMID: 20589844.
- Chung WK, Russell B, Yang Y, Handlogten M, Hudak S, Cao M, Wang J, Robbins D, Ahuja S, Zhu M. Effects of antibody disulfide bond reduction on purification process performance and final drug substance stability. Biotechnol Bioeng. 2017;114(6):1264–74. doi:10.1002/bit.26265. PMID: 28186329.
- Du C, Huang Y, Borwankar A, Tan Z, Cura A, Yee JC, Singh N, Ludwig R, Borys M, Ghose S, et al. Using hydrogen peroxide to prevent antibody disulfide bond reduction during manufacturing process. MAbs. 2018;10(3):500–10. doi:10.1080/19420862.2018.1424609. PMID: 29336721.
- Liu H, May K. Disulfide bond structures of IgG molecules: structural variations, chemical modifications and possible impacts to stability and biological function. MAbs. 2012;4(1):17–23. doi:10.4161/mabs.4.1.18347. PMID: 22327427.
- Liu H, Chumsae C, Gaza-Bulseco G, Hurkmans K, Radziejewski CH. Ranking the susceptibility of disulfide bonds in human IgG1 antibodies by reduction, differential alkylation, and LC-MS analysis. Anal Chem. 2010;82(12):5219–26. doi:10.1021/ac100575n. PMID: 20491447.
- Hutterer KM, Hong RW, Lull J, Zhao X, Wang T, Pei R, Le ME, Borisov O, Piper R, Liu YD, et al. Monoclonal antibody disulfide reduction during manufacturing: untangling process effects from product effects. MAbs. 2013;5(4):608–13. doi:10.4161/mabs.24725. PMID: 23751615.
- Cura AJ, Xu X, Egan S, Aron K, Jenkins L, Hageman T, Huang Y, Chollangi S, Borys M, Ghose S, et al. Metabolic understanding of disulfide reduction during monoclonal antibody production. Appl Microbiol Biotechnol. 2020;104(22):9655–69. doi:10.1007/s00253-020-10916-1. PMID: 32997205.
- Handlogten MW, Wang J, Ahuja S. Online control of cell culture redox potential prevents antibody interchain disulfide bond reduction. Biotechnol Bioeng. 2020;117(5):1329–36. doi:10.1002/bit.27281. PMID: 31956991.
- Schneider M, Knuesting J, Birkholz O, Heinisch JJ, Scheibe R. Cytosolic GAPDH as a redox-dependent regulator of energy metabolism. BMC Plant Biol. 2018;18(1):1-14. doi:10.1186/s12870-018-1390-6. PMID: 30189844.
- Nakajima H, Itakura M, Kubo T, Kaneshige A, Harada N, Izawa T, Azuma Y-T, Kuwamura M, Yamaji R, Takeuchi T. Glyceraldehyde-3-phosphate dehydrogenase (GAPDH) aggregation causes mitochondrial dysfunction during oxidative stress-induced cell death. J Biol Chem. 2017;292(11):4727–42. doi:10.1074/jbc.M116.759084. PMID: 28167533.
- Zhang J-Y, Zhang F, Hong C-Q, Giuliano AE, Cui X-J, Zhou G-J, Zhang G-J, Cui Y-K. Critical protein GAPDH and its regulatory mechanisms in cancer cells. Cancer Biol Med. 2015;12:10–22. doi:10.7497/j..2095-3941.2014.0019. PMID: 25859407.
- Chevallier V, Andersen MR, Malphettes L. Oxidative stress‐alleviating strategies to improve recombinant protein production in CHO cells. Biotechnol Bioeng. 2020;117(4):1172–86. doi:10.1002/bit.27247. PMID: 31814104.
- Senft D, Ronai ZA. UPR, autophagy, and mitochondria crosstalk underlies the ER stress response. Trends Biochem Sci. 2015;40(3):141–48. doi:10.1016/j.tibs.2015.01.002. PMID: 25656104.
- Yoo DY, Bin CS, Jung HY, Kim W, Lee KY, Kim JW, Moon SM, Won MH, Choi JH, Yoon YS, et al. Protein disulfide-isomerase A3 significantly reduces ischemia-induced damage by reducing oxidative and endoplasmic reticulum stress. Neurochem Int. 2019;122:19–30. doi:10.1016/j.neuint.2018.11.002. PMID: 30399388.
- Koterba KL, Borgschulte T, Laird MW. Thioredoxin 1 is responsible for antibody disulfide reduction in CHO cell culture. J Biotechnol. 2012;157(1):261–67. doi:10.1016/j.jbiotec.2011.11.009. PMID: 22138638.
- Goh WWB, Wong L. Protein complex-based analysis is resistant to the obfuscating consequences of batch effects — a case study in clinical proteomics. BMC Genomics. 2017;18(2):1–15. doi:10.1186/s12864-017-3490-3. PMID: 28361693.
- Szklarczyk D, Gable AL, Lyon D, Junge A, Wyder S, Huerta-Cepas J, Simonovic M, Doncheva NT, Morris JH, Bork P, et al. STRING v11: protein–protein association networks with increased coverage, supporting functional discovery in genome-wide experimental datasets. Nucleic Acids Res. 2019;47(D1):D607–D613. doi:10.1093/nar/gky1131. PMID: 30476243.
- Handlogten MW, Zhu M, Ahuja S. Glutathione and thioredoxin systems contribute to recombinant monoclonal antibody interchain disulfide bond reduction during bioprocessing. Biotechnol Bioeng. 2017;114(7):1469–77. doi:10.1002/bit.26278. PMID: 28262915.
- Xu N, Ma C, Ou J, Sun WW, Zhou L, Hu H, Liu XM. Comparative proteomic analysis of three Chinese hamster ovary (CHO) host cells. Biochem Eng J. 2017;124:122–29. doi:10.1016/j.bej.2017.05.007. PMID: 28736500.
- Park JH, Jin JH, Lim MS, An HJ, Kim JW, Lee GM. Proteomic analysis of host cell protein dynamics in the culture supernatants of antibody-producing CHO cells. Sci Rep. 2017;7(1):44246. doi:10.1038/srep44246. PMID: 28281648.
- Lakshmanan M, Kok YJ, Lee AP, Kyriakopoulos S, Lim HL, Teo G, Poh SL, Tang WQ, Hong J, Tan AH, et al. Multi‐omics profiling of CHO parental hosts reveals cell line‐specific variations in bioprocessing traits. Biotechnol Bioeng. 2019;116(9):2117–29. doi:10.1002/bit.27014. PMID: 31066037.
- Kantardjieff A, Jacob NM, Yee JC, Epstein E, Kok Y-J, Philp R, Betenbaugh M, Hu W-S. Transcriptome and proteome analysis of Chinese hamster ovary cells under low temperature and butyrate treatment. J Biotechnol. 2010;145(2):143–59. doi:10.1016/j.jbiotec.2009.09.008. PMID: 19770009.
- Goey CH, Tsang JMH, Bell D, Kontoravdi C. Cascading effect in bioprocessing-The impact of mild hypothermia on CHO cell behavior and host cell protein composition. Biotechnol Bioeng. 2017;114(12):2771–81. doi:10.1002/bit.26437. PMID: 28843000.
- Coleman O, Costello A, Henry M, Lao NT, Barron N, Clynes M, Meleady P. A proteomic profiling dataset of recombinant Chinese hamster ovary cells showing enhanced cellular growth following miR-378 depletion. Data Br. 2018;21:2679–88. doi:10.1016/j.dib.2018.11.115. PMID: 30761351.
- Kallehauge TB, Li S, Pedersen LE, Ha TK, Ley D, Andersen MR, Kildegaard HF, Lee GM, Lewis NE. Ribosome profiling-guided depletion of an mRNA increases cell growth rate and protein secretion. Sci Rep. 2017;7(1):1–12. doi:10.1038/srep40388. PMID: 28091612.
- Kelly PS, Dorival‐García N, Paré S, Carillo S, Ta C, Alarcon Miguez A, Coleman O, Harper E, Shannon M, Henry M, et al. Improvements in single‐use bioreactor film material composition leads to robust and reliable Chinese hamster ovary cell performance. Biotechnol Prog. 2019;35(4):1–17. doi:10.1002/btpr.2824. PMID: 31017345.
- Gronemeyer P, Ditz R, Strube J. DoE based integration approach of upstream and downstream processing regarding HCP and ATPE as harvest operation. Biochem Eng J. 2016;113:158–66. doi:10.1016/j.bej.2016.06.016.
- Albrecht S, Kaisermayer C, Reinhart D, Ambrose M, Kunert R, Lindeberg A, Bones J. Multiple reaction monitoring targeted LC-MS analysis of potential cell death marker proteins for increased bioprocess control. Anal Bioanal Chem. 2018;410(13):3197–207. doi:10.1007/s00216-018-1029-3. PMID: 29607450.
- Lakbub JC, Shipman JT, Desaire H. Recent mass spectrometry-based techniques and considerations for disulfide bond characterization in proteins. Anal Bioanal Chem. 2018;410(10):2467–84. doi:10.1007/s00216-017-0772-1. PMID: 29256076.
- Hagihara Y, Saerens D. Engineering disulfide bonds within an antibody. Biochim Biophys Acta (BBA)-Proteins Proteomics. 2014;1844(11):2016–23. doi:10.1016/j.bbapap.2014.07.005. PMID: 25038323.
- Xie G, Hong WX, Zhou L, Yang X, Huang H, Wu D, Huang X, Zhu W, Liu J. An investigation of methyl tert-butyl ether-induced cytotoxicity and protein profile in Chinese hamster ovary cells. Mol Med Rep. 2017;16(6):8595–604. doi:10.3892/mmr.2017.7761. PMID: 29039499.
- Rapp UK, Kaufmann SHE. Glucose-regulated stress proteins and antibacterial immunity. Trends Microbiol. 2003;11(11):519–26. doi:10.1016/j.tim.2003.09.001. PMID: 14607069.
- Dorner AJ, Wasley LC, Raney P, Haugejorden S, Green M, Kaufman RJ. The stress response in Chinese hamster ovary cells. Regulation of ERp72 and protein disulfide isomerase expression and secretion. J Biol Chem. 1990;265(35):22029–34. doi:10.1016/S0021-9258(18)45843-7. PMID: 2254345.
- Showalter AE, Martini AC, Nierenberg D, Hosang K, Fahmi NA, Gopalan P, Khaled AS, Zhang W, Khaled AR. Investigating Chaperonin-Containing TCP-1 subunit 2 as an essential component of the chaperonin complex for tumorigenesis. Sci Rep. 2020;10(1):798. doi:10.1038/s41598-020-57602-w. PMID: 31964905.
- Marzec M, Eletto D, Argon Y. GRP94: an HSP90-like protein specialized for protein folding and quality control in the endoplasmic reticulum. Biochim Biophys Acta - Mol Cell Res. 2012;1823(3):774–87. doi:10.1016/j.bbamcr.2011.10.013. PMID: 22079671.
- Komatsu K, Kumon K, Arita M, Onitsuka M, Omasa T, Yohda M. Effect of the disulfide isomerase PDIa4 on the antibody production of Chinese hamster ovary cells. J Biosci Bioeng. 2020;130(6):637–43. doi:10.1016/j.jbiosc.2020.08.001. PMID: 32878739.
- Meleady P, Henry M, Gammell P, Doolan P, Sinacore M, Melville M, Francullo L, Leonard M, Charlebois T, Clynes M. Proteomic profiling of CHO cells with enhanced rhBMP-2 productivity following co-expression of PACEsol. Proteomics. 2008;8(13):2611–24. doi:10.1002/pmic.200700854. PMID: 18546152.
- Easton DP, Kaneko Y, Subjeck JR. The hsp110 and Grp170 stress proteins: newly recognized relatives of the Hsp70s. Cell Stress Chaperones. 2000;5(4):276–90. doi:10.1379/1466-1268(2000)005<0276:thagsp>2.0.co;2. PMID: 11048651.
- Wei YYC, Naderi S, Meshram M, Budman H, Scharer JM, Ingalls BP, McConkey BJ. Proteomics analysis of Chinese hamster ovary cells undergoing apoptosis during prolonged cultivation. Cytotechnology. 2011;63(6):663–77. doi:10.1007/s10616-011-9385-2. PMID: 21853334.
- Tomanek L, Podrabsky JE, Stillman JH, Tomanek L. Proteomic responses to environmentally induced oxidative stress. J Exp Biol. 2015;218(12):1867–79. doi:10.1242/jeb.116475. PMID: 26085664.
- Voth W, Jakob U. Stress-activated chaperones: a first line of defense. Trends Biochem Sci. 2017;42(11):899–913. doi:10.1016/j.tibs.2017.08.006. PMID: 28893460.
- Cao SS, Kaufman RJ. Endoplasmic reticulum stress and oxidative stress in cell fate decision and human disease. Antioxid Redox Signal. 2014;21(3):396–413. doi:10.1089/ars.2014.5851. PMID: 24702237.
- Peksel B, Gombos I, Péter M, Veigh L, Á T, Brameshuber M, Balogh G, Schütz GJ, Horváth I, Veigh L, et al. Mild heat induces a distinct “eustress” response in Chinese Hamster Ovary cells but does not induce heat shock protein synthesis. Sci Rep. 2017;7(1):1–12. doi:10.1038/s41598-017-15821-8. PMID: 29142280.
- Park HG, Han SI, Oh SY, Kang HS. Cellular responses to mild heat stress. Cell Mol Life Sci. 2005;62(1):10–23. doi:10.1007/s00018-004-4208-7. PMID: 15619003.
- Kang KR, Lee SY. Effect of serum and hydrogen peroxide on the Ca2+/calmodulin-dependent phosphorylation of eukaryotic elongation factor 2(eEF-2) in Chinese hamster ovary cells. Exp Mol Med. 2001;33(4):198–204. doi:10.1038/emm.2001.33. PMID: 11795480.
- Kaufman RJ, Back SH, Song B, Han J, Hassler J. The unfolded protein response is required to maintain the integrity of the endoplasmic reticulum, prevent oxidative stress and preserve differentiation in β-cells. Diabetes Obes Metab. 2010;12:99–107. doi:10.1111/j.1463-1326.2010.01281.x. PMID: 21029306.
- Stech M, Kubick S. Cell-free synthesis meets antibody production: a review. Antibodies. 2015;4(1):12–33. doi:10.3390/antib4010012.
- Fernando MR, Nanri H, Yoshitake S, Nagata-kuno K, Minakami S. Thioredoxin regenerates proteins inactivated by oxidative stress in endothelial cells. Eur J Biochem. 1992;209(3):917–22. doi:10.1111/j.1432-1033.1992.tb17363.x. PMID: 1425698.
- Manteiga S, Lee K. Monoethylhexyl phthalate elicits an inflammatory response in adipocytes characterized by alterations in lipid and cytokine pathways. Environ Health Perspect. 2017;125(4):615–22. doi:10.1289/EHP464. PMID: 27384973.
- Reimonn TM, Park S-Y, Agarabi CD, Brorson KA, Yoon S. Effect of amino acid supplementation on titer and glycosylation distribution in hybridoma cell cultures—Systems biology-based interpretation using genome-scale metabolic flux balance model and multivariate data analysis. Biotechnol Prog. 2016;32(5):1163–73. doi:10.1002/btpr.2335. PMID: 27452371.
- Anderson MJ. A new method for non-parametric multivariate analysis of variance. Austral Ecol. 2001;26:32–46. doi:10.1111/j.1442-9993.2001.01070.pp.x.
- Zar JH. Biostatistical analysis. 5th. Upper Saddle River (NJ): Prentice Hall; 2010.
- Liu Y, Li Z, Xiong H, Gao X, Wu J Understanding of internal clustering validation measures. In: Webb GI, Liu B, Zhang C, Dimitrios G, Wu X, eds. Proceedings of the 2010 IEEE 10th International Conference on Data Mining (ICDM); 2010 Dec 14-17; Sydney, Australia: IEEE Press, 2010. p. 911–16. doi: 10.1109/ICDM.2010.35.
- Cline MS, Smoot M, Cerami E, Kuchinsky A, Landys N, Workman C, Christmas R, Avila-Campilo I, Creech M, Gross B, et al. Integration of biological networks and gene expression data using cytoscape. Nat Protoc. 2007;2(10):2366–82. doi:10.1038/nprot.2007.324. PMID: 17947979.