
ABSTRACT
Four antibodies that inhibit interleukin (IL)-23 are approved for the treatment of moderate-to-severe plaque psoriasis. Here, we present non-clinical data comparing ustekinumab, guselkumab, tildrakizumab and risankizumab with regard to thermostability, IL-23 binding affinity, inhibitory-binding mode, in vitro potency and in vivo efficacy. Risankizumab and guselkumab exhibited 5-fold higher affinity for IL-23 and showed more potent inhibition of IL-23 signaling than ustekinumab and tildrakizumab. Risankizumab and guselkumab completely blocked the binding of IL-23 to IL-23Rα as expected, whereas tildrakizumab did not. In vitro, risankizumab and guselkumab blocked the terminal differentiation of TH17 cells in a similar manner, while tildrakizumab had minimal impact on TH17 differentiation. In a human IL-23-induced ear-swelling mouse model, risankizumab and guselkumab were more effective than ustekinumab and tildrakizumab at reducing IL-17, IL-22, and keratinocyte gene expression. Our results indicate that the four clinically approved antibodies targeting IL-23 differ in affinity and binding epitope. These attributes contribute to differences in in vitro potency, receptor interaction inhibition mode and in vivo efficacy in preclinical studies as described in this report, and similarly may affect the clinical performance of these drugs.
Introduction
Psoriasis is one of the most common autoinflammatory diseases and affects more than 125 million people worldwide. Citation1 This chronic immune-mediated condition is characterized by inflammatory skin lesions with hyperplasia of keratinocytes in the epidermis and infiltration of leukocytes, especially T cells into the dermis.Citation2 The initiation of disease pathogenesis involves the activation of dermal dendritic cells to secrete factors that support the differentiation of T helper 17 (TH17) cells.Citation3 One of these factors, the cytokine interleukin (IL)-23, is thought to be required for the maintenance and generation of pathogenic TH17 cells that produce the inflammatory cytokines IL-17 and IL-22, which in turn stimulate keratinocyte responses including proliferation and secretion of psoriasis associated mediators. Blocking the activity of IL-23 with neutralizing antibodies therefore offers an attractive therapeutic intervention for psoriasis.Citation4
Four antibodies that inhibit IL-23 through interaction with either the p19 or p40 subunit have been approved by the U.S. Food and Drug Administration for the treatment of moderate-to-severe plaque psoriasis in adults. Ustekinumab, approved in 2009 and previously known as CNTO 1275, was generated using Medarex’s transgenic HuMab-Mouse. It is a human IgG1, k monoclonal antibody that binds to the p40 subunit of IL-12 and IL-23.Citation5,Citation6 Guselkumab, approved in 2017 and previously known as CNTO 1959, is a human IgG1, λ antibody derived from the MorphoSys HuCAL phage display antibody library. It binds to the p19 subunit of IL-23 and inhibits the binding to the IL-23Rα receptor subunit.Citation7 Tildrakizumab, approved in 2018 and also known as MK-3222, is a humanized IgG1, k monoclonal antibody that is specific for the p19 subunit of IL-23.Citation8 Risankizumab, approved in 2019 and described as BI 655066, is a high-affinity antibody that binds to the p19 subunit and blocks its interaction with IL-23Rα receptor subunit.Citation9 It is a humanized IgG1, k antibody with L234A, L235A mutations to reduce unnecessary and unwanted FcγR interactions.
The p19 antibodies showed superiority against several standard-of-care biologics in clinical studies, as described for guselkumab versus anti-tumor necrosis factor (TNF) adalimumab,Citation10–12 tildrakizumab versus anti-TNF etanercept,Citation13 and risankizumab versus ustekinumabCitation14–16 and adalimumab.Citation17 The reported Psoriasis Area and Severity Index (PASI) 90 responses after long-term treatment are 43–62% for ustekinumab,Citation18–20 76% for guselkumab,Citation11,Citation21 52–59% for tildrakizumab,Citation13 and 81% for risankizumab.Citation15 In addition to nonclinical attributes, such as affinity, potency and epitope, the clinical response rates are also driven by a variety of factors, including dose, dosing frequency, and serum half-life of the drug (). Citation22–24
Table 1. Biochemical, biophysical, and clinical parameters of the IL-23 antibodies
In this study, we compared ustekinumab, guselkumab, tildrakizumab and risankizumab in relevant assays used in a preclinical setting. The results from thermostability studies, target-binding studies, cellular potency assays, a TH17 differentiation assay and a human IL-23-induced ear-swelling mouse model shed light on the molecular attributes that may contribute to these antibodies’ clinical efficacy.
Results
Antibody stability and potential deamidation sites
The conformational and colloidal stabilities of ustekinumab, guselkumab, tildrakizumab and risankizumab were assessed using differential scanning calorimetry (DSC) and nano differential scanning fluorimetry (nanoDSF) (, Supplemental Figure S1). All four antibodies displayed high onset temperatures of unfolding (Tonset-DSC > 56°C), suggesting they have good conformational stability, as well as high onset temperatures of protein aggregation TAgg (>70°C) as measured by nanoDSF, indicating good colloidal stability. Among these four antibodies, risankizumab has the highest Tonset-DSC (66.0°C) and TAgg (83.9°C). Guselkumab contains several potential deamidation sites in complementarity-determining region 2 of the heavy and light chains. However, prolonged in vitro incubation at pH 8.0 and pH 9.5 followed by liquid chromatography-mass spectrometry (LC-MS) analysis indicated that these residues were not prone to deamidation, as less than 15% deamidation was observed (Supplemental Table S1).
Antibody interactions with IL-23 and Fc receptors
A central mechanism of therapeutic anti-IL-23 antibodies is the neutralization of free IL-23. The binding affinity for IL-23 may therefore be a major determinant of clinical efficacy. To assess the binding kinetics of the antibodies to human IL-23, we performed surface plasmon resonance (SPR) measurements at 37°C. The antibodies were captured on the chip surface using a goat anti-human IgG Fc polyclonal antibody. Different concentrations of the analyte, either single-chain (sc) or heterodimeric human IL-23, were interacted in consecutive cycles with surface-displayed IL-23 antibodies. The individual association (ka) and dissociation (kd) rate constants and the equilibrium dissociation constant (KD) were calculated using global fitting to a 1:1 binding model. Risankizumab and guselkumab exhibited high affinity to human scIL-23 with mean KDs of 21 pM and 35 pM, respectively, whereas tildrakizumab and ustekinumab showed about a 5-fold lower affinity for scIL-23 than risankizumab with mean KDs of 136 pM for tildrakizumab and 106 pM for ustekinumab ( and Supplemental Figure S2). The affinities of the antibodies for heterodimeric IL-23 were slightly lower than for scIL-23 but followed a similar trend. The difference in KD between risankizumab and tildrakizumab/ustekinumab is mainly driven by risankizumab having an 8- to 13-fold slower dissociation rate constant (kd), indicating that risankizumab forms a more stable immune complex with IL-23.
Table 2. Binding affinity and kinetics of IL-23 antibodies measured by SPR
Guselkumab, tildrakizumab and ustekinumab, which are human IgG1 with intact Fc, exhibited high monomeric binding to high-affinity FcγRs and low monomeric binding to low-affinity FcγRs, while risankizumab, which possesses the L234A, L235A mutations,Citation9 displayed the expected reduced binding to human FcγRI and FcγRIIIA V176 and undetectable binding to low-affinity FcγRs (data not shown). These Fc differences are not expected to result in a different biological outcome because FcγR-mediated effector function is not thought to be part of the mechanism of action of the IL-23 antibodies, as they bind a soluble cytokine and do not form multimeric antibody/antigen complexes.
Antibody interactions with the neonatal Fc receptor (FcRn) in the low pH environment of the endosome and subsequent dissociation at the neutral pH on the cell surface after recycling play a critical role in maintaining the long serum half-life of IgGs.Citation25 All IL-23 antibodies showed similar binding affinities of about 5 μM to FcRn at pH 6.0 and little binding at pH 7.4 in an SPR assay (data not shown). However, when antibodies were bound to an FcRn column and subjected to a pH gradient, guselkumab showed a delayed elution at physiological pH. In contrast, ustekinumab, tildrakizumab and risankizumab immediately eluted when the pH reached 7.4 (Supplemental Figure S3). Guselkumab’s slower dissociation from FcRn may contribute to its shorter half-life in psoriasis patients ().
Antibody activity in cell-based bioassays
The in vitro potency of the antibodies was compared in two different bioassays. The first, a STAT3-driven luciferase reporter assay, used HeLa cells recombinantly expressing the human IL-23Rα and IL-12Rβ1 receptors (). Risankizumab inhibited IL-23-induced STAT3 signaling with an IC50 of 23 pM. Risankizumab was 2.6-fold more potent than guselkumab (p ≤ 0.05), 9-fold more potent than tildrakizumab (p ≤ 0.0001) and 14-fold more potent than ustekinumab (p ≤ 0.0001) based on calculated IC50s of 59 pM, 203 pM and 316 pM, respectively (). The second pSTAT3 assay used human whole blood from healthy donors and measured increased pSTAT3 in CD45+ CD161hi cells, which are IL-17 producing CD4+TH17Citation26 and CD8+ TC17 cells.Citation27 Upon stimulation with IL-23, risankizumab and guselkumab demonstrated similar potency with IC50 of 6 pM and 10 pM, respectively, whereas tildrakizumab and ustekinumab were about 6-fold less potent than risankizumab with IC50s of 39 pM and 40 pM (p ≤ 0.001) (). A comparison of the IC80 values showed a similar trend, but with a greater potency differential. While risankizumab and guselkumab were able to achieve 80% inhibition in these assays at concentrations that were twice as high as their IC50 concentration, tildrakizumab and ustekinumab required significantly higher antibody concentrations to achieve 80% inhibition. As a result, risankizumab was able to achieve 80% inhibition at concentrations that were 16- to 35-fold lower than those required for tildrakizumab and ustekinumab as based on the calculated IC80 values ().
Table 3. In vitro cellular potency of IL-23 antibodies
Figure 1. In vitro potency of the IL-23 antibodies. (a) Dose-dependent inhibition of STAT3 luciferase reporter expression in HeLa cells with the stimulation of 1 ng/mL IL-23 (n = 3). (b) Dose-dependent inhibition of pSTAT3 expression by FACS in CD45+ CD161hi cells from human whole blood with the stimulation of 1 ng/mL IL-23 (n = 6 with 3 healthy donors). Data are plotted as mean ± SEM. Antibody potency was determined by calculating the inhibitory concentration that results in 50% inhibition (IC50) and 80% inhibition (IC80) with 95% confidence interval (CI). Data and statistical analysis are summarized in ()
Antibody epitope mapping
The antibody epitopes on IL-23 were compared (). Ustekinumab’s epitope is on the p40 subunit of IL-23,Citation30 while guselkumab, tildrakizumab and risankizumab all recognize the p19 subunit, albeit at slightly different epitopes. Tildrakizumab’s epitope has been determined by x-ray crystallography in which K39, T42, W45, S46, P49, E101, S114-D118, P120, G122, Q123, H125, A126, L129 were identified as important contact residues within 4 Å of antigen.Citation28 Risankizumab’s epitope has been determined by hydrogen deuterium exchange mass spectrometry (HDX-MS) to encompass I108-A126 and P137-S151.Citation9 Guselkumab’s epitope, which was determined by HDX-MS in this study, involves residues in two peptide regions, Y100-L124 and S151-F172 (Supplemental Figure S4).
Figure 2. Epitope alignment of IL-23 Rα and IL-23 antibodies on the IL-23p19 sequence. The epitopes of guselkumab (white boxes) and risankizumab (black boxes)Citation9 as determined by HDX-MS. The epitopes of tildrakizumabCitation28 and IL-23 RαCitation29 as determined by x-ray crystallography are shown in black bars
Figure 3. The binding mode of antibodies, IL-23 and IL-23 receptors characterized by SPR and FACS. (a) the SPR sensorgram of antibody/IL-23 complexes binding to IL-23 Rα (left) or IL-12Rβ1-Fc (right) immobilized on the chip. (b) IL-23/antibody complexes, comprising Zenon-labeled antibody (10 nM) and human scIL-23 at concentrations ranging from 1.25 to 20 nM, were added to HEK293 cells expressing either one or two IL-23 receptor subunits for one hour on ice prior to FACS analysis
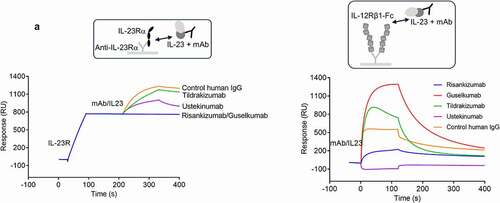
Figure 3. Continued
Figure 4. Treatment of naïve T cells in TH17 polarizing conditions with IL-23 antibodies results in loss of terminally differentiated IL-17+ cells and accumulation of TH17 differentiation intermediates. (a) The inhibition of IL-17A, IL-17 F and IL-22 cytokine secretion by IL-23 antibodies at day 4 of TH17 polarization analyzed by multiplex. (b) The inhibition of IL-17A, IL-17 F, and IL-23 R expressing cells by IL-23 antibodies at day 4 of TH17 polarization analyzed by mass (IL-17A, IL-17 F; n = 5) or flow (IL-23 R; n = 6) cytometry. ns. not significant. * p ≤ 0.05; ** p ≤ 0.01; *** p ≤ 0.005; **** p ≤ 0.001. (c) UMAP dimension reduction of all events from mass cytometry analysis of all day 4 treatment groups shows the landscape of populations arising during TH17 differentiation. PhenoGraph cell clustering identified 28 populations as shown in the legend. The Wanderlust algorithm was run using PhenoGraph population 2 as the seed population, and populations were then numbered according to the Wanderlust predicted order of differentiation. The red line indicates a likely path of differentiation. The terminally differentiated clusters expressing IL-17A (cluster 27), IL-17 F (cluster 26) or IL-17A and IL-17 F (cluster 28) are shown along with the expression of IL-17A and IL-17 F. (d) The UMAP plot of mass cytometry data from (c) is shown for individual treatment groups, which demonstrates the redistribution of populations as a result of treatment with IL-23 antibodies. Terminally differentiated IL-17hi clusters are highlighted with black rectangles. (e) Volcano plots show the fold change of PhenoGraph clusters following treatment with risankizumab compared to the TH17 control, guselkumab compared to the TH17 control, and risankizumab compared to guselkumab treatment. A false discovery rate (FDR) of 0.05 is shown with the dotted line to indicate the threshold for significant change. Populations that changed significantly are shown in green. n = 5 in c-e
Figure 4. Continued
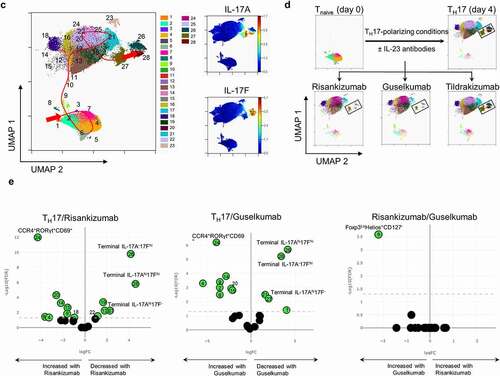
Figure 5. Risankizumab and guselkumab differentially inhibited IL-23 induced skin inflammation. (a) Ear swelling of vehicle- and IL-23-injected animals that were administrated with either PBS (Veh+Veh) or various doses of antibodies are represented by day 0 to day 4 area under the curve ear thickness measurement (D0-D4 AUC). Data are shown as bar graph with mean + SEM. Values of mean percentages of inhibition (compared to the IL-23 injected alone animals) of the significantly reduced groups are also labeled on the graph. Data are pooled from two studies of four antibodies with total 11–12 animals in each dosing group. Significance was analyzed using one-way ANOVA with Tukey’s or Dunnetts multiple comparison post hoc analysis. (b) The percentage inhibition of IL-17A, IL-22, S100A7a and β-Defensin 4 mRNA expression from (a) are plotted against the plasma concentrations of the antibody dosed groups in the IL-23 injected animals. Each point represents the mean values of the dosing group from pooled studies. Non-linear regression curve fittings of the four antibodies are also indicated on the plot using four parameter fit algorithm. (c) The percentage inhibitions of ear thickness AUC, and inhibition of IL-17A, IL-22, S100A7a and β-Defensin 4 mRNA expression from the head-to-head comparison studies between 0.1 mg/kg dosed risankizumab and guselkumab are plotted as bar graphs. Data are pooled from two studies with total 11–12 animals in each group and shown as mean + SEM. Significance was analyzed using two-way ANOVA with Sidak’s multiple comparison post hoc analysis. * p ≤ 0.05; ns, no significance, i.e., p > .05. (d) The percentage inhibition of IL-17A, IL-22, S100A7a and β-defensin 4 mRNA expression from individual animals of the head-to-head comparison studies that were dosed with antibodies at 0.1 and 1 mg/kg are plotted against the plasma concentrations of the antibodies of correlated animals. Data are pooled from two studies with 5–6 animals per group in each study
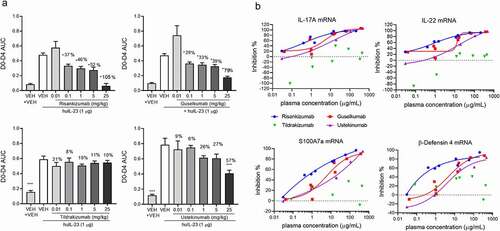
Figure 5. Continued
The binding interface of IL-23Rα and IL-23 has been reported.Citation29 Both risankizumab and guselkumab showed overlapping epitopes with IL-23Rα (). Specifically, I108 and P113 are residues on IL-23 covered by risankizumab, guselkumab and IL-23Rα. Residues Y100, L103, Q154-Q157, L159-L161, K164-K165, R167-S168 are additionally shared between guselkumab and IL-23Rα. Interestingly, tildrakizumab and IL-23Rα do not share critical contact residues on IL-23, despite tildrakizumab showing inhibitory activity in cellular potency assays.
IL-23 receptor activation and antibody inhibitory binding mode characterization
IL-23 receptor activation requires assembly of the ternary complex consisting of IL-23Rα, IL-23 and IL-12Rβ1. The IL-23p19 subunit is known to interact with IL-23Rα, and the IL-23p40 subunit interacts with IL-12Rβ1.Citation29 Binding affinities of these two interacting pairs were measured by SPR to be 0.8 nM for the IL-23/IL-23Rα and 19 nM for the IL-23/IL-12Rβ1 pair (Supplemental Figure S5). To further characterize the cytokine/receptor interaction, we also measured the dissociation constants of the ternary complex assembly. The binding affinity of IL-12Rβ1 for IL-23Rα-bound scIL-23 was determined by SPR to be 56 nM, while IL-23Rα’s affinity for IL-12Rβ1-bound scIL-23 was 6 nM (Supplemental Figure S5).
To investigate whether antibody-bound IL-23 would be blocked from binding to its receptors, we conducted binding studies using both recombinant IL-23 receptor proteins and IL-23 receptor expressing HEK293 cells.
The binding of antibody/IL-23 complexes to immobilized IL-23Rα or IL-12Rβ1 was assessed by SPR. IL-23 pre-incubated with a saturating amount of ustekinumab or a control human IgG1 antibody showed binding to IL-23Rα as expected since ustekinumab bound to the p40 subunit would not interfere with the p19/IL-23Rα interaction. IL-23/risankizumab and IL-23/guselkumab complexes did not show any binding to IL-23Rα, indicating both risankizumab and guselkumab completely blocked the binding of IL-23 to IL-23Rα (). Our result is consistent with previously reported data for these antibodies.Citation7,Citation9 Surprisingly, the IL-23/tildrakizumab complex was still able to bind IL-23Rα, even in the presence of a saturating amount of tildrakizumab. To better understand the inhibitory effect of tildrakizumab on the IL-23/IL-23Rα interaction, the affinity of IL-23 for IL-23Rα was determined in the presence and absence of a saturating amount of tildrakizumab. The presence of tildrakizumab reduced IL-23’s affinity for IL-23Rα by approximately 200-fold from 0.8 nM to 190 nM (Supplemental Figure S5), suggesting that tildrakizumab may inhibit the p19/IL-23Rα interaction through a negative allosteric modulation rather than a competitive inhibition. Additionally, we investigated whether antibodies would bind to IL-23Rα-bound IL-23. Consistently, risankizumab and guselkumab did not show binding to the IL-23Rα-bound cytokine, while tildrakizumab and ustekinumab showed binding (Supplemental Figure S6). The binding of antibody/IL-23 complexes to immobilized IL-12Rβ1 was similarly assessed by SPR. IL-23 complexes with guselkumab, tildrakizumab and, to a lesser extent, risankizumab were able to bind to IL-12Rβ1 (). The IL-23/ustekinumab complex did not bind since ustekinumab is a competitive inhibitor of IL-23p40/IL-12Rβ1 binding.Citation5,Citation6,Citation30
The binding of IL-23/antibody complexes to HEK293 cell lines expressing either one or both IL-23 receptor subunits was further assessed by fluorescence-activated cell sorting (FACS) (). IL-23/antibody complexes comprising Zenon-labeled antibody (10 nM) and human scIL-23 at concentrations ranging from 1.25 to 20 nM were added to cells for 1 hour on ice prior to FACS analysis. As expected, IL-23 in complex with ustekinumab showed strong binding to cells expressing IL-23Rα, whereas IL-23 in complex with risankizumab or guselkumab did not. Under this experimental condition, IL-23/tildrakizumab did not show observable binding to cells expressing IL-23Rα. IL-23 precomplexed with the labeled anti-p19 antibodies showed binding to cells expressing IL-12Rβ1 to a different extent. These differences were not due to a difference in antibody labeling efficiency (data not shown). IL-23/guselkumab binding was strong, IL-23/tildrakizumab intermediate and IL-23/risankizumab binding was very low, suggesting that risankizumab’s binding to the p19 subunit may create a steric hindrance or conformational change between the p40 subunit and IL-12Rβ1. Similar binding patterns were observed when IL-23 was first allowed to bind to cells expressing the individual receptors and bound IL-23 was detected using the labeled antibodies (Supplemental Figure S7).
TH17 differentiation
We used an in vitro human TH17 differentiation assay to understand how IL-23 antibodies may affect the differentiation of naïve CD4+ T (Tnaïve) cells toward TH17 cells. In this assay, Tnaïve cells were isolated from cord blood, activated with anti-CD3- and anti-CD28-coated beads and polarized into TH17 cells with a TH17-skewing cocktail in the presence or absence of 1 µM risankizumab, guselkumab, or tildrakizumab.Citation31 Accumulated cytokines were analyzed by multiplex assay at day 4 postdifferentiation. Treatment with control human IgG did not affect the release of TH17 cytokines (data not shown). Secretion of IL-17A, IL-17F and IL-22 into the supernatants was greatly inhibited by risankizumab and guselkumab, while tildrakizumab showed only partial inhibition of IL-17 F and IL-22, and almost no inhibition of IL-17A secretion (). To gain a deeper understanding of the phenotypic changes that occur during this process, we performed standard flow cytometry and high-dimensional mass cytometry (CyToF) analysis on day 4 of the culture using a panel of antibodies as indicated (Supplemental Table S2). Consistent with the secreted cytokine levels in the supernatants, the frequencies of IL-17A+ and IL-17 F+ cells were significantly reduced by risankizumab and guselkumab, while tildrakizumab elevated the percentage of IL-17A+ cells and only partially inhibited the differentiation of IL-17 F+ TH17 cells (). It has been reported that the IL-23/TH17 axis plays a crucial role in regulating the immunopathogenesis of psoriasis, and IL-23R expression and signaling is a critical component of pathogenic TH17 cells.Citation3,Citation32,Citation33 We confirmed the surface expression of IL-23R in differentiated TH17 cells with an anti-IL-23R antibody (Supplemental Figure S8a). Risankizumab displayed a better inhibitory effect on the generation of IL-23R+ TH17 cells than tildrakizumab, but similar or slightly better than guselkumab ().
To understand the effects of IL-23 signaling blockade on TH17 differentiation in more detail, a uniform manifold approximation and projection (UMAP) dimension reduction analysis was performed on day 0 (Tnaïve) and day 4 (TH17 control and risankizumab-, guselkumab- or tildrakizumab-treated) cells. PhenoGraph cell clustering revealed 28 populations within the TH17 cultures, and Wanderlust trajectory analysis indicated the likely path of differentiation of Tnaïve cells to TH17 cells in vitro (, Supplemental Figure S8b,c). Among the 28 clusters, distinct populations of terminally differentiated IL-17A−17 Fhi (cluster 26), IL-17Ahi17F− (cluster 27) and IL-17Ahi17Fhi (cluster 28) cells were identified and were greatly reduced when cells were polarized in the presence of risankizumab or guselkumab (). In contrast, tildrakizumab had minimal impact on terminally differentiated TH17 cells by day 4 of culture, as its profile is nearly identical to the TH17 control UMAP plot ().
A heatmap of cluster frequencies provided an objective view of which treatments behaved most similarly with respect to the phenotypic distribution of cells in culture (Supplemental Figure S9a). Volcano plots showing differences in cluster frequencies as a ratio of the TH17 control were generated. In risankizumab- or guselkumab-treated cultures, cluster 26, 28 and to a lesser extent cluster 27 were significantly decreased, while an intermediate CCR4+RORγt+CD69+ TH17 population (cluster 24) had accumulated the most (). It is not known whether cluster 24 is a nonpathogenic TH17 subset or an intermediate population differentiating toward an IL-23-dependent pathogenic population. While treatment with risankizumab and guselkumab resulted in very similar phenotypic changes in vitro, one cluster was significantly different in frequency (). Cluster 9, an early differentiation intermediate with a Treg-like phenotype (Foxp3loHelios+CD127−) accumulated more with guselkumab treatment than with risankizumab. In contrast to risankizumab and guselkumab, treatment with tildrakizumab only caused an increase in two very early differentiation intermediates, CCR6−IL-23RloCD69+ (cluster 6) and CCR6+IL-23R−CD69− (cluster 3) populations (Supplemental Figure S9b).
In vivo activity in IL-23-induced ear inflammation model
We previously described a psoriasis-like skin inflammation model in C57BL/6 mice by daily intradermal injection of murine IL-23 into the ear.Citation34,Citation35 This 5-d model demonstrates an IL-23-induced skin inflammation with increased ear thickness, leukocyte infiltration and elevated expression of IL-23/Th17 pathway genes, including IL-17A, IL-17 F, IL-22, S100A7a and β-defensin-4. The proinflammatory transcriptome of the model closely reflects the transcriptome of human psoriasis.Citation34,Citation36 To investigate the effects of human IL-23 antibodies that do not cross-react with mouse IL-23, a modification was made using intradermal injection of human IL-23 at 1 µg/d for 4 d. The inflammation in response to human IL-23 injection was comparable to the murine IL-23-induced skin inflammation (Supplemental Figure S10).
To study the effects of risankizumab, guselkumab, tildrakinumab and ustekinumab on human IL-23-induced skin inflammation, dose response studies with the individual mAbs were conducted. Antibodies at doses of 0.01, 0.1, 1, 5 and 25 mg/kg were injected intraperitoneally (i.p.) 4 hours prior to the IL-23 ear injection on day 0 and day 2. Both risankizumab and guselkumab antibodies reduced IL-23-induced ear swelling in a dose-dependent manner () at similar plasma concentrations () and showed robust reduction in IL-23-induced proinflammatory and keratinocyte gene expression, including IL-17A, IL-22, S100A7a and β-defensin 4 (). At high plasma concentrations, in the range of 10–1000 µg/mL, both risankizumab and guselkumab reduced IL-17A, IL-22, S100A7a and β-defensin 4 to a similar level (>70%). Surprisingly, risankizumab achieved a more pronounced reduction of the above gene expression than guselkumab at a lower plasma concentration of about 1 µg/mL. In contrast to risankizumab and guselkumab, the impact of tildrakinumab and ustekinumab on IL-23 mediated skin inflammation was reduced. Tildrakinumab was ineffective in blocking both inflammation and gene expression changes, while ustekinumab generated a more modest response, marked by significant changes in ear thickness at only the highest dose group. In addition, changes to gene expression were reduced in the ustekinumab-treated group, compared to risankizumab and guselkumab, at lower drug exposures.
Table 4. Antibody plasma concentrations (μg/mL) in the IL-23 induced ear inflammation model
In subsequent head-to-head studies, risankizumab and guselkumab were dosed at 0.1 and 1 mg/kg (achieving the targeted plasma concentrations of about 1 µg/mL and 14 µg/mL, respectively) to confirm and further investigate the differences between the observed efficacy at the lower plasma exposure levels. At the 0.1 mg/kg dose, inhibition of IL-23-induced ear swelling trended higher (not significant) in risankizumab- (33%) than guselkumab- (10%) treated animals, while risankizumab reduced IL-17A, IL-22, S100A7a and β-defensin 4 gene expressions to a significantly greater extent than guselkumab (64%, 63%, 54% and 62% for risankizumab compared to 16%, 23%, 15% and 7% for guselkumab, respectively) (). Analysis of gene expression relative to antibody plasma concentrations revealed a more uniform inhibition of inflammatory gene expression with risankizumab at 1 µg/ml compared to a greater range of inhibition in the guselkumab group. Meanwhile, the range of gene expression inhibition was more similar between risankizumab and guselkumab groups at the higher plasma concentration of about 14 µg/mL ().
Discussion
The antibodies that inhibit IL-23 through interaction with either the p19 or p40 subunit described in this study have all shown efficacy in patients with moderate or severe plaque psoriasis. Direct head-to-head clinical study between these antibodies has only been performed for risankizumab and ustekinumab, resulting in PASI 90 responses after 52 weeks of treatment of 81% for risankizumab vs 44% for ustekinumab.Citation15 It has been speculated that the lower response rate observed with ustekinumab may be due to the fact that ustekinumab, through its interaction with the p40 subunit, also inhibits IL-12. In contrast to IL-23, which stimulates IL-17 production by T lymphocytes, IL‐12 has a regulatory role by specifically suppressing IL‐17 secretion.Citation37 An alternate theory is that the difference in performance could be due to the lack of IL-39 inhibition. Any p40-specific antibody would not be able to inhibit this newly described cytokine comprising p19 (shared with IL-23) and EBI3 (shared with IL-27 and IL-35), which has been implicated in a mouse model of experimental lupus.Citation38 The existence of IL-39 in humans remains controversial, as some report that IL-39 has not been detected in humans and a recombinantly expressed version has no activity on human cells,Citation39 while others report upregulation and interaction of p19 and EBI3 in human keratinocytes stimulated with poly (I:C).Citation40 Whether human IL-39 exists and plays a role in the inflammatory disease process in psoriatic skin remains to be investigated.
The lower response rate observed with ustekinumab in psoriasis patients may also be partly due to suboptimal dose selection and its affinity for IL-23. Risankizumab has about 5-fold higher affinity than ustekinumab. Under equilibrium and nonsaturating dosing conditions, higher affinity antibodies bind more IL-23 until the affinity ceiling is reached.Citation41 Furthermore, the off-rate of the risankizumab/IL-23 complex is 10-fold slower than that of the ustekinumab/IL-23 complex, indicating that the risankizumab/IL-23 complex, once formed, is more stable.
The antibody affinities correlate with the in vitro bioactivities observed in STAT3 assays. For instance, in the whole blood STAT3 assay risankizumab and guselkumab had IC50s of 6 pM and 10 pM, while tildrakizumab and ustekinumab had IC50s of 39 pM and 40 pM. However, to achieve 80% inhibition in the assay, the required concentrations were 12 pM for risankizumab, 20 pM for guselkumab, 195 pM for tildrakizumab and 246 pM for ustekinumab. These results show that risankizumab and guselkumab were able to reach their IC80 at concentrations that were only twice as high as their IC50, whereas for tildrakizumab and ustekinumab the concentrations required to reach 80% inhibition were 5-fold higher than their IC50, suggesting that to achieve full neutralization of IL-23 with a lower affinity antibody requires significantly higher antibody concentrations. Whether the requirement for significantly higher antibody concentration to achieve optimal IL-23 neutralization by ustekinumab and tildrakizumab translates to their performance in patients is not known and would require carefully controlled clinical studies. In this context, it is noteworthy that tildrakizumab’s clinical efficacy at a 2-fold higher dose did not increase significantly (PASI 90 of 52–59% at 100 mg and 59% at 200 mg dose).Citation13
Risankizumab and guselkumab inhibit the interaction of IL-23 with IL-23Rα through competitive inhibition of IL-23, as neither shows simultaneous binding with IL-23Rα to IL-23. In contrast, the tildrakizumab-bound IL-23 is still capable of binding to IL-23Rα, albeit at a 200-fold weaker affinity. Indeed, tildrakizumab’s epitope on IL-23 does not have any overlapping residues with the IL-23Rα interaction site. These data suggest that tildrakizumab may be an allosteric inhibitor of IL-23. In the HEK293 cell-binding study, the tildrakizumab/IL-23 complex did not show binding to the cells expressing IL-23Rα. Given the weak affinity between the tildrakizumab/IL-23 complex and IL-23Rα (KD = 190 nM), little binding on HEK293 cells is expected at the cytokine concentrations tested (<20 nM). It is not clear whether tildrakizumab’s inhibition of IL-23 signaling is negatively affected by its epitope on IL-23.
Bloch et al. reported that the assembly of the IL-23 ternary complex follows a typical two-step heterodimeric receptor activation mechanism in that IL-23 binds to IL-23Rα first followed by the recruitment of IL-12Rβ1.Citation29 The binding affinities as measured using isothermal titration calorimetry (ITC) were KD ITC = 44 nM for the interaction of IL-23 with IL-23Rα and KD ITC = 25 nM for the subsequent recruitment of IL-12Rβ1, while the interaction of IL-23 through its p40 subunit with IL-12Rβ1 was very low affinity with KD ITC = 2 μM.Citation29 In our study, we determined the binding affinities of IL-23 with individual receptor subunits using SPR to be 0.8 nM for IL-23/IL-23Rα and 19 nM for IL-23/IL-12Rβ1. The difference in affinities from the two studies may be due to the use of different recombinant protein material and methods applied. Others have reported the affinity of the interaction between IL-12 through its p40 subunit and IL-12Rβ1 to be in the low nanomolar range.Citation42
Using HEK293 cells expressing the individual receptor subunits, we investigated whether antibody/IL-23 complexes (comprised of 10 nM antibody and 5–20 nM IL-23) were able to bind to the individual receptor subunits. Ustekinumab/IL-23 showed strong binding to IL-23Rα expressing cells, while guselkumab/IL-23 and tildrakizumab/IL-23, respectively, showed strong and moderate binding to the IL-12Rβ1-expressing cells. In contrast, risankizumab/IL-23 showed a very low binding to IL-12Rβ1 and no binding to IL-23Rα-expressing cells, suggesting that risankizumab/IL-23 complexes do not interact with IL-23 receptor-expressing cells. In addition, risankizumab has reduced binding to the high-affinity FcγRs and undetectable binding to the low-affinity FcγRs due to the L234A, L235A mutations in the hinge. Nevertheless, it is not clear whether the almost complete lack of cell surface receptor interaction by risankizumab has any impact on its effectiveness, mechanism of action or tissue distribution.
In the in vivo studies using an IL-23-mediated psoriasis-like skin model in mice, we demonstrated differential outcomes with respect to the efficacy driven by risankizumab, guselkumab, tildrakizumab and ustekinumab. Compared to tildrakizumab and ustekinumab, both risankizumab and guselkumab were able to robustly inhibit IL-23-induced ear swelling and pathway gene expression of IL-17A, IL-22, S100A7a and β-defensin 4. Surprisingly, while both risankizumab and guselkumab achieved comparable systemic exposure levels at any given dose, at the lower dose of 0.1 mg/kg, where plasma concentrations were about 1 μg/mL, risankizumab showed significantly greater inhibition of IL-23 pathway gene expression than guselkumab. This is of particular interest, as in the clinical setting the human trough plasma concentrations of risankizumab and guselkumab are about 1–2 μg/mL as indicated in the approved labels. Further investigation revealed that the higher extent of inhibition by risankizumab compared to guselkumab was not due to the L234A, L235A mutations in the risankizumab hinge region, as a non-mutated IgG1 form of risankizumab also showed similar inhibition at a dose of 0.1 mg/kg (data not shown).
One potential explanation for the differential gene expression effect of risankizumab over guselkumab, at 0.1 mg/kg, is the tissue distribution of these antibodies. In an exploratory study, we observed greater accumulation of risankizumab than guselkumab in the diseased ear tissue at 48 hours post-dosing (Supplemental Figure S11a,b). The increased accumulation of risankizumab was dependent on IL-23-induced inflammation, as risankizumab did not accumulate in the non-inflamed contralateral ear of the same animal. While the accumulation of antibodies in the ear could only be measured in animals dosed at 1 mg/kg due to the limitation of the detection method, it is tempting to speculate that at 0.1 mg/kg dose there is a connection between the extent of skin tissue distribution of risankizumab and its impact on reducing IL-23 pathway gene expression.
Our in vitro TH17 differentiation assay provided a unique insight into the effect of IL-23 neutralization on the development of different cell populations along the differentiation path from naïve T cells to TH17 cells. Risankizumab and guselkumab had very similar effects on the inhibition of TH17 cell differentiation, showing significantly decreased IL-17A, IL-17 F, and IL-22 secretion and inhibition of the terminal TH17 subset formation, while tildrakizumab had very little effect on TH17 cell differentiation and only partially accumulated very early TH17 intermediates with low IL-23R expression. Using CyTOF analysis, it appeared that risankizumab and guselkumab had a greater effect on IL-17 F+ than IL-17A+ cells, suggesting that the IL-17 Fhi subsets (IL-17A+Fhi and IL-17A−Fhi) could be the initial TH17 populations affected by IL-23 neutralization. In vitro IL-23 neutralization also caused a shift toward the adoption of alternate T helper pathways. For instance, we observed an increase in Foxp3 and Gata3 expression in cultures treated with either risankizumab or guselkumab (data not shown), while Cluster 9, an early differentiation intermediate with a Treg-like phenotype (Foxp3loHelios+CD127−) accumulated more with guselkumab treatment than with risankizumab treatment. This suggests that cells may be re-routed toward a Treg-like lineage upon IL-23 neutralization.
Tildrakizumab’s poor inhibition in the 4-d TH17 differentiation assay and the 4-d in vivo mouse ear swelling model was surprising in light of its sub-nanomolar binding affinity to IL-23 and bioactivity in whole blood. Tildrakizumab inhibits human IL-23 activation of mouse splenocytes in vitro as described in patent US8293883B2, and we confirmed that active tildrakizumab was present in the mouse sera at the end of the study, suggesting that in these studies of longer duration tildrakizumab is not able to effectively inhibit IL-23 signaling, potentially due to its epitope and unusual mechanism of inhibition.
Overall, our study results indicate that the four clinically approved antibodies ustekinumab, guselkumab, tildrakizumab, and risankizumab differ in affinity for IL-23 and binding epitopes. These key attributes contribute to differences in in vitro potency affecting STAT3 signaling and TH17 cell differentiation, receptor interaction inhibition mode and in vivo efficacy in the mouse ear inflammation model. Carefully planned clinical studies are required to further investigate the impact of observed pre-clinical differences on these drugs’ clinical performance.
Materials and methods
Proteins, cell lines and human specimen materials
Human single-chain (sc) IL-23 (IL-12p40(23‐328)‐(GGGGS)×4‐IL-23p19(21‐189)‐TEV‐FLAG‐8His based on UnitProt (P29460, Q9NPF7)) was expressed in HEK293 cells and purified using Histrap FF (GE) and Superdex 200. Heterodimeric human IL-23 was purchased from ThermoFisher (cat. No. 14–8239-63). Human IL-23Rα protein was purchased from LSBio (LS-G40259-50). Human IL-12Rβ1-Fc was purchased from R&D system (ays0619011). The anti-IL-23R antibodies 20E5 and 3C11 were expressed in HEK293 cells.Citation43 Clinical-grade ustekinumab, guselkumab and tildrakizumab were purchased from Clinigen Inc. Risankizumab was produced as a clinical drug substance at Boehringer Ingelheim. An in-house produced version of ustekinumab, with equal potency compared to clinical-grade ustekinumab, was used in the mouse ear-swelling model. Control human IgG1 (anti-tetanus toxoid and anti-CMV) was expressed in HEK293 cells.
Stable HEK293 cell lines expressing human IL-23Rα (NP_653302) with an N-terminal HA tag and/or human IL-12Rβ1 (NP_005526.1) were generated using standard procedures.Citation44 The expression levels of IL-23Rα and IL-12Rβ1 were measured by FACS using anti-HA-PE and anti-CD212-APC antibodies (Miltenyi Biotec), respectively.
Thermostability assays and forced degradation studies of deamidation prone sequences
DSC and nanoDSF measurements were performed as previously described.Citation45 Briefly, antibody samples were prepared at a concentration of 1 mg/mL in 4.4 mM Succinate, 225 mM Sorbitol, 0.02% Polysorbate 20, pH 6.0 (risankizumab) or 3.87 mM L-histidine, 7.15 mM L-histidine monohydrochloride monohydrate, 7.9% w/v sucrose, 0.05% w/v polysorbate 80, pH 5.8 (ustekinumab, guselkumab, and tildrakizumab). The thermal ramps were performed from 20°C to 95°C with a scan rate of 1°C/min. DSC thermograms were normalized by concentration and fitted to three peaks using a non-two-state unfolding model. Unfolding transition points (Tonset-DSC and Tm) were determined using MicroCal PEAQ-DSC software. TAgg was obtained by monitoring the back-reflection of near ultraviolet (UV) light using back reflection optics in Prometheus NT.48 with Prometheus PR. Control software (NanoTemper Technologies).
Guselkumab was incubated at 5 mg/mL in 0.1 M Tris buffer pH 8.0 for up to 10 d. The samples were digested and peptides were analyzed by LC-MS to assess deamidation.
Affinity and kinetics measurement by SPR
Binding kinetics of IL-23 antibodies for recombinant human sc or heterodimeric IL-23 were determined by SPR at 37°C using an anti-Fc capture assay approach as described.Citation45 Briefly, IL-23 antibodies were captured on an anti-human Fc chip. IL-23, ranging in concentration from 36 nM to 0.15 nM in a randomized 3-fold dilution series, was injected over both reference and test surface for 5 minutes at 50 µL/minute. The dissociation was monitored for 1 hour at 50 µL/minute. Data were double referenced and fitted globally to a 1:1 binding model using Biacore T200 Evaluation software to determine the binding kinetic rate constants ka (M−1s−1) and kd (s−1) and the equilibrium dissociation constant KD (M). Mean and standard deviations from 5 (scIL-23) or 3 (heterodimeric IL-23) independent experiments are reported.
FcRn affinity chromatography
FcRn column chromatography was performed essentially as described.Citation46 Briefly, FcRn/β2 microglobulin was expressed, purified, biotinylated and coupled to streptavidin sepharose. The resin was packed into a Tricorn 5/50 column (GE Healthcare) and equilibrated with 20 mM MES buffer, 150 mM NaCl, pH 5.5. Antibody samples (100–250 µg) were adjusted to pH 5.5 by dilution with equilibration buffer and applied to the FcRn column using the AKTA Pure system at a flow rate of 0.25 mL/min. The column was washed with 10 mL equilibration buffer. Antibodies were eluted with a linear pH gradient to 20 mM Tris, 150 mM NaCl, pH 8.8, within 120 mins.
In vitro bioassay with IL-23-induced human whole blood
Whole blood from three healthy human donors was obtained through Sanguine Biosciences in K3EDTA Vacuette® tubes (Greiner, 455036). Donors were selected based on whole-blood response to scIL-23 stimulation to ensure at least 5-fold increase of pSTAT3 expression compared to unstimulated samples. Test antibodies were serially diluted and preincubated with 10 ng/mL IL-23 in phosphate-buffered saline (PBS) supplemented with 1% bovine serum albumin (BSA) at 37°C for 1 hour. The antibody/IL-23 complex was diluted 10-fold with 200 µL human whole blood such that the final concentration of IL-23 was 1 ng/mL, and the antibody concentrations ranged from 20 nM to 0.076 pM. Anti-CD161-Alexa Fluor 647 (BioLegend, 339910) was added to the reaction and incubated for 20 minutes at 37°C. Reaction was stopped by adding Phosflow lyse/fix buffer (BD Biosciences, 558049). Cells were permeabilized using 90% methanol/10% water (Honeywell) and washed with PBS supplemented with 1% BSA. Cells were stained with anti-CD45 PerCp/Cy5.5 (BioLegend, 304028) and anti-pSTAT3 PE (pY705) (BD Biosciences, 562072). Samples were acquired on a FACSCanto II using DIVA software (BD Biosciences). pSTAT3 fluorescence intensity in CD45+CD161hi cells was analyzed using FlowJo software (BD Biosciences). The data were expressed as percentage control response where unstimulated samples were defined as 0% and IL-23 stimulated samples without added antibodies were defined as 100%. IC50 and IC80 values were calculated using a four-parameter equation by Prism 8 software (GraphPad Software).
In vitro bioassay with IL-23 receptor expressing cell line
A cell-based reporter gene assay (RGA) was developed by transiently overexpressing the two subunits of the IL-23 receptor (IL-12Rβ1 and IL-23Rα) in a commercially available HeLa (human epithelial) cell line stably expressing a STAT3-linked firefly luciferase response element (Signosis Inc). IL-23R HeLa STAT3 luciferase cells were thawed and maintained in growth media (DMEM media supplemented with D-glucose 4.5 g/L, L-glutamine 2 mM, sodium pyruvate 1 mM, 10% fetal bovine serum (FBS)) at 37°C in a 5% CO2 incubator. A 3-fold serial dilution of IL-23 mAbs in growth media was pre-incubated with an equal volume of 4 ng/mL human scIL-23 for 1 hour in a dilution plate (Costar). Fifty microliters of the mAbs/IL-23 complexes were added in triplicate to wells of a 96-well white assay plate (Nunc) and IL-23R HeLa STAT3 luciferase cells (25,000 cells in 50 µL) were added to each well. The final concentration of IL-23 was 1 ng/mL (17.4 pM) alone or with a titration curve of antibodies ranging from 3 nM to 0.15 pM (risankizumab, guselkumab, control human IgG) or from 27 nM to 1.4 pM (tildrakizumab and ustekinumab). Assay plates were incubated for 5 hours at 37°C, 5% CO2, transferred to room temperature and 100 µL/well of One Glo Luminescence substrate (Promega) was added. The plates were covered with foil to block the light and sealed with a plate sealer. Plates were shaken for at least 2 minutes on a plate shaker to mix and lyse the cells before the readout on a Microbeta2 luminometer (Perkin Elmer). IC50 and IC80 values were calculated as indicated in the whole blood assay.
Epitope mapping by HDX-MS
All HDX-MS experiments were performed using a nanoACQUITY UPLC system with HDX technology (Waters Corporation). Forty micromolar of scIL-23 was incubated with or without 40 µM of guselkumab in equilibration buffer (10 mM potassium phosphate, pH 7.2). 6 µL of the samples were diluted with 54 µL equilibration buffer or deuterated labeling buffer (10 mM potassium phosphate buffer, pD 7.2) in triplicates at 20°C for different periods of time: 0 second, 10 seconds, 1 minute, 10 minutes, 1 hour and 10 hours. The sample was quenched with 50 µL of quench buffer (100 mM potassium phosphate, 4 M guanidine hydrochloride and 500 mM TCEP, pH 2.4) and incubated for 10 minutes at 1°C. A total of 100 µL quenched sample was injected into UPLC equipped with an EnzymateTM BEH pepsin column (2.1 mm × 30 mm, Waters Corporation) for online digestion at 15°C. The desalting and separation were carried out at 0.2°C using a BEH C18 VanGaurdTM pre-column (2.1 mm × 5 mm, 1.7 µm, Waters Corporation) and an ACQUITY BEH C18 analytical column (1.0 mm × 100 mm, 1.7 µm, Waters Corporation). Peptides were separated using a 12-minute linear acetonitrile gradient (5–40%) containing 0.1% formic acid at 40 µL/minute. The eluent was directly sprayed into a Synapt G2 mass spectrometer (Waters Corporation) with electrospray ionization and lock-mass correction using Leu-Enkephalin solution. Mass spectra were acquired in MSE mode with ion mobility over an m/z range of 50 to 2000. Blanks of 0.1% formic acid in water were injected in between each LC-MS run using the same analytical gradient to minimize the carryover. All peptides were identified from non-deuteration controls using ProteinLynx Global Server 3.0.2 software (Waters Corporation). Deuterium uptake for each peptide was determined based on the difference between the centroid of the isotopic distribution of undeuterated and deuterated samples using DynamX 3.0 software (Waters Corporation). Potential epitope is determined if the deuterium uptake difference exceeds 0.5 Da for a single time point and 1.1 Da for the sum of deuterium uptake differences of 5 HDX time points. All spectra and data processing were manually confirmed and validated for epitope identification.
Binding mode characterization of IL-23 antibodies
To investigate whether antibody-bound IL-23 still binds IL-23Rα, the SPR assay format was set up with the following four steps. First, the anti-IL-23R antibody 20E5, which is noncompetitive with IL-23 binding to IL-23Rα, was covalently immobilized on the CM5 biosensor chip via amino groups. IL-23 R antibody 20E5 (25 µg/mL), diluted in 10 mM sodium acetate, pH 4.5, was injected for 420 s across the activated surface. Approximately 10,000 RU of IL-23 Rα antibody 20E5 was immobilized on the chip surface on flow cells 2, 3, and 4. A modified CM surface with similarly conjugated control human IgG antibody in flow cell 1 was used as a reference surface. Second, human IL-23 Rα protein at 100 nM in HBS-EP+ was injected for 60 s over the IL-23 Rα antibody coated surface. Third, human IL-23 at 30 nM and test antibodies at 300 nM (saturating concentration) were equilibrated in HBS-EP+ at 25 ◦C for 5 hours and were injected for 120 s, followed by 60 s dissociation in HBS-EP+ at a flow rate of 50 µL/minute. Fourth, the surface was regenerated by injection of 10 mM glycine-HCl pH1.5 over the test and reference flow cells.
The binding kinetics of IL-23 and IL-23 Rα was assessed in the presence of tildrakizumab. The assay format was according to the following four steps: 1) capture of tildrakizumab onto a testing flow cell of an anti-human Fc chip and reach a density of about 1500 RU; 2) load scIL-23 or heterodimeric IL-23 to test flow cell to a density of around 150 RU; 3) analyte injection (IL-23 Rα or buffer) over both reference and test surface, 150 µL at 50 µL/minute, after which the dissociation was monitored for 10 minutes at 50 µL/minute; 4) regeneration of capture surface by 10 mM glycine-HCl, pH 1.5 injections over both reference and test surface. IL-23 Rα injections ranged in concentration from 100 nM to 1 nM in a randomized 3-fold dilution series. The binding kinetics of IL-23 and IL-23 Rα without tildrakizumab was measured by capturing IL-23 Rα onto a chip with the anti-IL-23 R antibody 20E5 to a ligand density of 100 RU. Analyte (IL-23 or buffer) was injected from 300 nM to 4 nM in a 3-fold dilution series. All other parameters were the same as described above.
To investigate whether antibody-bound IL-23 binds to IL-12Rβ1, 300 nM of IL-23 and 900 nM of antibodies were equilibrated in HBS-EP+ at 25°C for 5 hours. The complex was then injected onto a chip surface where IL-12Rβ1-Fc was covalently linked through amine chemistry on flow cell 2. Biacore 8 K was used for data collection. The active flow cell 2 signal was referenced against flow cell 1 without IL-12Rβ1-Fc.
IL-23/antibody complex binding to IL-23 receptor was also evaluated on HEK293 cells. IL-23 antibodies and control human IgG1 antibody were labeled with Zenon antibody labeling technology (Thermo Fisher Scientific) according to the manufacturer’s instructions. IL-23/antibody complexes were prepared by mixing 10 nM labeled antibody with human IL-23 at concentrations of 0, 1.25, 2.5, 5, 10, and 20 nM in MACS cell separation buffer (Miltenyi Biotec), resulting in antibody-binding site/IL-23 molar ratios of 1:0, 16:1, 8:1, 4:1, 2:1, and 1:1, respectively. IL-23/antibody mixtures were pre-incubated on ice for 1 hour. The cells were plated in 96-well round-bottom plates (Corning) at 200,000 cells per well and washed once with MACS cell separation buffer. IL-23/antibody complex (100 µL/well) were added and incubated for 1 hour on ice. Cells were washed twice with 200 µL MACS cell separation buffer, and IL-23/antibody binding was assessed by FACS (BD Accuri C6) and analyzed by FlowJo V10.
TH17 differentiation assay
Mononuclear cells were prepared from human cord blood (LifeSouth Community Blood Centers) on Ficoll-Paque gradients, and naïve CD4+ T cells were isolated using an EasySep Human Naïve CD4+ T cell isolation kit (StemCell). To generate TH17 cells, naïve CD4+ T cells were activated with anti-CD3/CD28-coated beads (Gibco) in X–VIVO 20 serum-free hematopoietic cell media (Lonza) and cultured for 4 d in the presence of a TH17-skewing cocktail containing 10 ng/mL hTGF-β, 10 ng/mL hIL-1β, 10 ng/mL hIL-2, 1 µg/mL anti-hIL-4, 1 µg/mL anti-hIFN-γ (R&D Systems) and 10 ng/mL human scIL-23. To assess the effect of anti-IL-23 antibodies on TH17 cell differentiation, risankizumab, guselkumab, tildrakizumab, or control human IgG (1 μM) was added into the culture on day 0. Harvested supernatants secreted from cells at indicated timepoints were subjected to cytokine quantification with the Multiplex Assay Kit (EMD Millipore). Cells were stained with LIVE/DEAD Fixable Blue (Thermo Fisher Scientific), followed by Human TruStain FcX Fc Receptor Blocking Solution (BioLegend). Surface staining was performed by incubation with PE/Cyanine7 anti-human CD196 (CCR6) antibody (BioLegend) and biotinylated anti-IL23R antibody (3C11) on ice for 1 hour, followed by Alexa Fluor 647 Streptavidin (BioLegend) for an additional 30 minutes on ice. Flow cytometric measures were performed on LSRFortessa (BD Biosciences) and analyzed using FlowJo software (BD Biosciences). Percent (%) inhibition of the secreted cytokines is calculated in the comparison of cytokine from the TH17-only group with those from anti-IL23 antibodies-treated groups after subtraction of day 0 level. Similarly, percentage inhibition of the frequency of IL-23 R+ cells is calculated based on differences between with and without anti-IL23 antibodies-treated groups after the subtraction of the frequency of different subsets from day 0 samples.
CyTOF assays
Metal-conjugated antibodies were purchased from Fluidigm or conjugated using the MaxPar X8 antibody-labeling kit (Fluidigm) according to manufacturer instructions.
Thirty minutes prior to harvesting cell cultures, 5-Iodo-2ʹ-deoxyuridine (IdU) (Fluidigm) was added to cell cultures to identify cells in S-phase. Dead cell staining was done by resuspending samples in 1 mL of Fluidigm cell staining buffer (CSB) along with 1 µL of Cell-ID Cisplatin (Fluidigm), incubating for 30 seconds followed by 2 washes with 2 mL of CSB. For intracellular staining, the eBioscience Foxp3 staining set (Thermo Fisher) was used according to their protocol, except a 20-minute incubation with Fixation/Permeabilization reagent was used instead of the recommended 30 minutes to minimize impact on sensitive cell surface epitopes. Both surface and intracellular staining were carried out at room temperature for 30 minutes, followed by 2 washes with 2 mL of CSB. Following intracellular staining samples were fixed with 1 mL of 4% paraformaldehyde for 15 minutes. Cell intercalation with natural abundance iridium was done according to the Fluidigm protocol and incubated overnight. To bank cells at −80°C so that cells could be acquired in batches, intercalated cells were washed twice with 2 mL CSB and then resuspended in 0.5 mL of cell freezing solution (FBS with 10% DMSO) and stored at −80°C until acquisition.
The frozen samples were thawed quickly in 2 mL of CSB and centrifuged at 600 × g. Samples were then washed and centrifuged two more times in Cell Acquisition Solution (Fluidigm) and left pelleted until acquisition. Prior to sample acquisition, the Helios mass cytometer was tuned using Tuning Solution (Fluidigm) and the tuning protocol in version 6.7.1014 of the CyToF-installed software. Immediately prior to acquisition, samples were resuspended in 1 mL of Cell Acquisition Solution containing EQ Four Element Calibration Beads (Fluidigm). As many events as possible were collected for each sample, up to a limit of 105 cells/sample. Following acquisition, samples were normalized to the EQ Four Element Calibration Beads using the CyToF-installed software.
After gating on viable singlet cells in Cytobank, all subsequent analysis was done in OMIQ. The percentage inhibitions of the frequency of IL-17A+ and IL-17 F+ cells were calculated using the same formula used for IL-23 R+ cells. The dimension reduction algorithm UMAP was run on all files using markers indicated in the antibody panel (Supplemental Table S2). The default OMIQ settings were used for all algorithmic analysis. PhenoGraph cell clustering was then performed on all files using the same markers as used for the dimension reduction. Following cell clustering, the trajectory inference algorithm Wanderlust was run on just day 0 and TH17 control files. The same markers used for the dimension reduction were used for trajectory inference. PhenoGraph cluster 2 was used as a starting point because it was the most abundant cluster represented in the day 0 sorted naïve CD4+ T cells. The EdgeR tool in OMIQ was used to create volcano plots to identify significantly different cluster frequencies between two groups.
Animal models
Wild-type female C57BL/6 mice, 8–12 weeks of age (18–22 g) were purchased from Charles River Labs. Animals were housed in a pathogen-free environment of an American Association for Accreditation of Laboratory Animal Care-approved facility, five per cage on aspen chip bedding (Sanichip) with individual ventilation and were kept in a room with an average temperature of 72°F on a 12-hour light-dark cycle. The mice had free access to diet (2014 Teklad global 14% protein rodent diets from Envigo), and water. The animals were acclimated to laboratory conditions for at least 1 week before the testing. All studies were conducted in a blinded manner.
IL-23-induced skin inflammation model was similar to previously described with slight modification.Citation35 In brief, 1 μg human recombinant IL-23 (AbbVie) solution or sterile PBS + 0.1% BSA (vehicle) was intradermally injected into the dorsal side of a single ear in an isoflurane-anesthetized mouse with a 32-gauge needle, once a day for four consecutive days starting on day 0. Ear thickness was measured daily and mice were then humanely euthanized on day 4 for tissue harvesting. To assess the effect of antibodies, i.p. injections of various doses of IL-23 antibodies and control human IgG1 (human anti-CMV) were performed on day 0 and day 2, 4 hours prior to the IL-23 ear injection.
Measurement of gene expression
Animal whole ears were homogenized, and the expression of various genes was determined using QuantiGene multiplex kit (ThermoFisher Scientific). All procedures followed manufacturer’s instructions. Data were acquired using FlexMAP 3D cytometer (Luminex). All data were normalized by GeoMean to two housekeeping genes, Hprt and Gapdh. Normalized data were then compared to the control group (i.e., vehicle-treated Sham animals) and fold changes were calculated. The fold changes were then used to calculate the percentage of inhibition for the genes of interest.
Probe sets used in the Quantigene multiplex analysis were designed by the vendor. Detailed information about the genes that were measured is listed in Supplemental Table S3.
Histology and immunohistochemistry
Collected ears were fixed in 4% paraformaldehyde for 20 hours at room temperature, transferred to 30% sucrose at 4°C for at least 24 hours and embedded in Tissue-Tek OCT Compound. Tissue blocks were stored at −80°C. Immunohistochemistry (IHC) was performed on fixed frozen 5 μm sections using a Leica Bond RX Fully Automated Research Stainer (Leica Biosystems) at ambient temperatures. Following a series of washes and pretreatments with dual endogenous block (Dako), 70% methanol in 3% hydrogen peroxide (freshly made), Protease I (Ventana) and Protein Blocks (Dako), tissue sections were incubated with 0.5 ug/ml purified rabbit anti-human or the negative isotype control rabbit anti-hamster IgG (H + L) mouse adsorbed antibody (Southern Biotech). Antibody binding was detected with Bond Polymer Refine Red detection using alkaline phosphatase-linked compact polymer and visualized with Leica red (Leica Biosystems). Slides were then counterstained with hematoxylin.
IHC image acquisition and quantification
Slides were imaged using the Pannoramic 250 whole slide scanner at 20× magnification (3D Histech). Image analysis (IA) was performed on the digitized images to quantitate the extent of dosed antibody in the ear tissue. The IA involved a three-step algorithm approach using Visiopharm software (VisioPharm). The first algorithm isolated the tissue from the background and delineated the tissue as a ROI (Region of Interest) around the detected tissue and filtered out all artifacts, white space, and non-tissue pixels. The second algorithm detected red (+) stained tissue versus non-stained tissue regions, and in the third and final step, the ratio of the area occupied by the red (+) pixels were normalized to the total tissue area.
Statistics
Prism 8 (GraphPad Software) was used for all the statistical analyses. IC50 and IC80 for the reporter and whole blood assays were calculated based on the nonlinear regression. Least square means (LS means) and their 95% confidence intervals (CIs) were estimated after log10 transformation in a mixed effect model with subject as a random effect. The LS means and their CIs were then transformed back to the original scale for reporting purpose. The LS means of IC50 or IC80 for the risankizumab-treated group were head-to-head compared with those of each individual antibody treated group. The p-values were generated from Student t-test and the Tukey HSD test after adjusting for multiple comparisons.
All in vivo studies have been repeated and confirmed. Data were analyzed using one-way and two-way ANOVAs followed by Tukey’s and Sidak’s multiple comparison post hoc analyses, respectively, if the ANOVA revealed significance. A p-value less than 0.05 was considered significant.
Study approval
Human whole blood samples were acquired from healthy donors under an AbbVie Institutional Review Board-approved protocol. Cord blood samples were provided by LifeSouth Community Blood Centers under Blood Center Board of Directors approved the protocol. The appropriate written informed consent was obtained from all the donors prior to the studies. The studies were performed in adherence to the Declaration of Helsinki Principles.
Abbreviations
Supplemental Material
Download Zip (13 MB)Acknowledgments
The authors would like to thank the following AbbVie colleagues: Debra Touw, Limary Medina, Sahana Bose, Joel Cohen-Solal, Meha Chhaya, Daniel Serna, Liang Zhang, Soumya Mitra, Munish Puri, and Stephanie Paulsboe for technical contributions, James Fann and Jie Cheng for statistical support and Eric Goedken for scientific discussions. This work was funded by AbbVie Inc. AbbVie participated in the study design, research, data collection, analysis, interpretation of data, writing, reviewing, and approving the publication.
Disclosure statement
Mark Konrad, Denise Perron, Yibing Wang, Jun Zhang and Gary Overmeyer are former AbbVie employees and may own AbbVie stock. All other listed authors are AbbVie employees and may own AbbVie stock.
Data availability
The data that support the findings of this study are available from the authors on reasonable request; see author contributions for specific data sets.
Supplementary material
Supplemental data for this article can be accessed on the publisher’s website.
References
- Website International Federation of Psoriasis Associations (IFPA) Our Cause: Psoriasis. [ Accessed 03]. https://ifpa-pso.com/our-cause
- Chiricozzi A, Romanelli P, Volpe E, Borsellino G, Romanelli M. Scanning the Immunopathogenesis of Psoriasis. Int J Mol Sci. 2018;19(1):1. doi:10.3390/ijms19010179.
- Di Cesare A, Di Meglio P, Nestle FO. The IL-23/Th17 axis in the immunopathogenesis of psoriasis. J Invest Dermatol. 2009;129(6):1339–16. doi:10.1038/jid.2009.59.
- Chiricozzi A, Saraceno R, Chimenti MS, Guttman-Yassky E, Krueger JG. Role of IL-23 in the pathogenesis of psoriasis: a novel potential therapeutic target? Expert Opin Ther Targets. 2014;18(5):513–25. doi:10.1517/14728222.2014.889686.
- Benson JM, Peritt D, Scallon BJ, Heavner GA, Shealy DJ, Giles-Komar JM, Mascelli MA. Discovery and mechanism of ustekinumab: a human monoclonal antibody targeting interleukin-12 and interleukin-23 for treatment of immune-mediated disorders. MAbs. 2011;3(6):535–45. doi:10.4161/mabs.3.6.17815.
- Benson JM, Sachs CW, Treacy G, Zhou H, Pendley CE, Brodmerkel CM, Shankar G, Mascelli MA. Therapeutic targeting of the IL-12/23 pathways: generation and characterization of ustekinumab. Nat Biotechnol. 2011;29(7):615–24. doi:10.1038/nbt.1903.
- Benson J, Carton J, Cunningham M, Orlovsky Yevgeniya I, Rauchenberger R, Sweet R Human anti-il-23 antibodies, compositions, methods and uses. US 9353181 B2, 2012/06/15, 2016.
- Kopp T, Riedl E, Bangert C, Bowman EP, Greisenegger E, Horowitz A, Kittler H, Blumenschein WM, McClanahan TK, Marbury T, et al. Clinical improvement in psoriasis with specific targeting of interleukin-23. Nature. 2015;521(7551):222–26. doi:10.1038/nature14175.
- Singh S, Kroe-Barrett RR, Canada KA, Zhu X, Sepulveda E, Wu H, He Y, Raymond EL, Ahlberg J, Frego LE, et al. Selective targeting of the IL23 pathway: generation and characterization of a novel high-affinity humanized anti-IL23A antibody. MAbs. 2015;7(4):778–91. doi:10.1080/19420862.2015.1032491.
- Gordon KB, Duffin KC, Bissonnette R, Prinz JC, Wasfi Y, Li S, Shen YK, Szapary P, Randazzo B, Reich K. A phase 2 trial of guselkumab versus adalimumab for plaque psoriasis. N Engl J Med. 2015;373(2):136–44. doi:10.1056/NEJMoa1501646.
- Blauvelt A, Papp KA, Griffiths CE, Randazzo B, Wasfi Y, Shen YK, Li S, Kimball AB. Efficacy and safety of guselkumab, an anti-interleukin-23 monoclonal antibody, compared with adalimumab for the continuous treatment of patients with moderate to severe psoriasis: results from the phase III, double-blinded, placebo- and active comparator-controlled VOYAGE 1 trial. J Am Acad Dermatol. 2017;76:405–17.
- Reich K, Armstrong AW, Foley P, Song M, Wasfi Y, Randazzo B, Li S, Shen YK, Gordon KB. Efficacy and safety of guselkumab, an anti-interleukin-23 monoclonal antibody, compared with adalimumab for the treatment of patients with moderate to severe psoriasis with randomized withdrawal and retreatment: results from the phase III, double-blind, placebo- and active comparator-controlled VOYAGE 2 trial. J Am Acad Dermatol. 2017;76:418–31.
- Reich K, Papp KA, Blauvelt A, Tyring SK, Sinclair R, Thaci D, Nograles K, Mehta A, Cichanowitz N, Li Q, et al. Tildrakizumab versus placebo or etanercept for chronic plaque psoriasis (reSURFACE 1 and reSURFACE 2): results from two randomised controlled, phase 3 trials. Lancet. 2017;390(10091):276–88. doi:10.1016/S0140-6736(17)31279-5.
- Papp KA, Blauvelt A, Bukhalo M, Gooderham M, Krueger JG, Lacour J-P, Menter A, Philipp S, Sofen H, Tyring S, et al. Risankizumab versus ustekinumab for moderate-to-severe plaque psoriasis. N Engl J Med. 2017;376(16):1551–60. doi:10.1056/NEJMoa1607017.
- Gordon KB, Strober B, Lebwohl M, Augustin M, Blauvelt A, Poulin Y, Papp KA, Sofen H, Puig L, Foley P, et al. Efficacy and safety of risankizumab in moderate-to-severe plaque psoriasis (UltIMMa-1 and UltIMMa-2): results from two double-blind, randomised, placebo-controlled and ustekinumab-controlled phase 3 trials. Lancet. 2018;392(10148):650–61. doi:10.1016/S0140-6736(18)31713-6.
- McKeage K, Duggan S. Risankizumab: first global approval. Drugs. 2019;79(8):893–900. doi:10.1007/s40265-019-01136-7.
- Reich K, Gooderham M, Thaçi D, Crowley JJ, Ryan C, Krueger JG, Tsai T-F, Flack M, Gu Y, Williams DA, et al. Risankizumab compared with adalimumab in patients with moderate-to-severe plaque psoriasis (IMMvent): a randomised, double-blind, active-comparator-controlled phase 3 trial. The Lancet. 2019;394(10198):576–86. doi:10.1016/S0140-6736(19)30952-3.
- Leonardi CL, Kimball AB, Papp KA, Yeilding N, Guzzo C, Wang Y, Li S, Dooley LT, Gordon KB, Investigators PS. Efficacy and safety of ustekinumab, a human interleukin-12/23 monoclonal antibody, in patients with psoriasis: 76-week results from a randomised, double-blind, placebo-controlled trial (PHOENIX 1). Lancet. 2008;371(9625):1665–74. doi:10.1016/S0140-6736(08)60725-4.
- Papp KA, Langley RG, Lebwohl M, Krueger GG, Szapary P, Yeilding N, Guzzo C, Hsu M-C, Wang Y, Li S, et al. Efficacy and safety of ustekinumab, a human interleukin-12/23 monoclonal antibody, in patients with psoriasis: 52-week results from a randomised, double-blind, placebo-controlled trial (PHOENIX 2). Lancet. 2008;371(9625):1675–84. doi:10.1016/S0140-6736(08)60726-6.
- Koutruba N, Emer J, Lebwohl M. Review of ustekinumab, an interleukin-12 and interleukin-23 inhibitor used for the treatment of plaque psoriasis. Ther Clin Risk Manag. 2010;6:123–41.
- Nakamura M, Lee K, Jeon C, Sekhon S, Afifi L, Yan D, Lee K, Bhutani T. Guselkumab for the treatment of psoriasis: a review of phase III trials. Dermatol Ther (Heidelb). 2017;7(3):281–92. doi:10.1007/s13555-017-0187-0.
- Yao Z, Hu C, Zhu Y, Xu Z, Randazzo B, Wasfi Y, Chen Y, Sharma A, Zhou H. Population pharmacokinetic modeling of guselkumab, a human IgG1lambda monoclonal antibody targeting IL-23, in patients with moderate to severe plaque psoriasis. J Clin Pharmacol. 2018;58(5):613–27. doi:10.1002/jcph.1063.
- Khalilieh S, Hodsman P, Xu C, Tzontcheva A, Glasgow S, Montgomery D. Pharmacokinetics of Tildrakizumab (MK-3222), an anti-IL-23 monoclonal antibody, after intravenous or subcutaneous administration in healthy subjects. Basic Clin Pharmacol Toxicol. 2018;123(3):294–300. doi:10.1111/bcpt.13001.
- Suleiman AA, Minocha M, Khatri A, Pang Y, Othman AA. Population pharmacokinetics of risankizumab in healthy volunteers and subjects with moderate to severe plaque psoriasis: integrated analyses of phase I-III clinical trials. Clin Pharmacokinet. 2019;58, 1309–1321.
- Roopenian DC, Akilesh S. FcRn: the neonatal Fc receptor comes of age. Nat Rev Immunol. 2007;7(9):715–25. doi:10.1038/nri2155.
- Romagnani S, Maggi E, Liotta F, Cosmi L, Annunziato F. Properties and origin of human Th17 cells. Mol Immunol. 2009;47(1):3–7. doi:10.1016/j.molimm.2008.12.019.
- Billerbeck E, Kang Y-H, Walker L, Lockstone H, Grafmueller S, Fleming V, Flint J, Willberg CB, Bengsch B, Seigel B, et al. Analysis of CD161 expression on human CD8+ T cells defines a distinct functional subset with tissue-homing properties. Proc Natl Acad Sci U S A. 2010;107(7):3006–11. doi:10.1073/pnas.0914839107.
- Presta Leonard G Engineered Anti-il-23p19 Antibodies. US 8293883 B2, 2008/02/21, 2012.
- Bloch Y, Bouchareychas L, Merceron R, Skladanowska K, Van den Bossche L, Detry S, Govindarajan S, Elewaut D, Haerynck F, Dullaers M, et al. Structural activation of pro-inflammatory human cytokine IL-23 by cognate IL-23 receptor enables recruitment of the shared receptor IL-12Rβ1. Immunity. 2018;48(1):45–58 e6. doi:10.1016/j.immuni.2017.12.008.
- Luo J, Wu SJ, Lacy ER, Orlovsky Y, Baker A, Teplyakov A, Obmolova G, Heavner GA, Richter HT, Benson J. Structural basis for the dual recognition of IL-12 and IL-23 by ustekinumab. J Mol Biol. 2010;402(5):797–812. doi:10.1016/j.jmb.2010.07.046.
- Manel N, Unutmaz D, Littman DR. The differentiation of human T(H)-17 cells requires transforming growth factor-beta and induction of the nuclear receptor RORgammat. Nat Immunol. 2008;9(6):641–49. doi:10.1038/ni.1610.
- McGeachy MJ, Chen Y, Tato CM, Laurence A, Joyce-Shaikh B, Blumenschein WM, McClanahan TK, O’Shea JJ, Cua DJ. The interleukin 23 receptor is essential for the terminal differentiation of interleukin 17–producing effector T helper cells in vivo. Nat Immunol. 2009;10(3):314–24. doi:10.1038/ni.1698.
- Lee Y, Awasthi A, Yosef N, Quintana FJ, Xiao S, Peters A, Wu C, Kleinewietfeld M, Kunder S, Hafler DA, et al. Induction and molecular signature of pathogenic TH17 cells. Nat Immunol. 2012;13(10):991–99. doi:10.1038/ni.2416.
- Gauld SB, Gauvin D, Olson L, Leys L, Paulsboe S, Liu Z, Edelmayer RM, Wetter J, Salte K, Wang Y, et al. Mechanistic and pharmacological assessment of murine IL-23 mediated psoriasiform dermatitis; implications for drug discovery. J Dermatol Sci. 2018;92(1):45–53. doi:10.1016/j.jdermsci.2018.08.001.
- Wang Y, Edelmayer R, Wetter J, Salte K, Gauvin D, Leys L, Paulsboe S, Su Z, Weinberg I, Namovic M, et al. Monocytes/Macrophages play a pathogenic role in IL-23 mediated psoriasis-like skin inflammation. Sci Rep. 2019;9(1):5310. doi:10.1038/s41598-019-41655-7.
- Suarez-Farinas M, Arbeit R, Jiang W, Ortenzio FS, Sullivan T, Krueger JG, Fang D. Suppression of molecular inflammatory pathways by Toll-like receptor 7, 8, and 9 antagonists in a model of IL-23-induced skin inflammation. PLoS One. 2013;8(12):e84634. doi:10.1371/journal.pone.0084634.
- Hoeve MA, Savage ND, De Boer T, Langenberg DM, de Waal Malefyt R, Ottenhoff TH, Verreck FA. Divergent effects of IL-12 and IL-23 on the production of IL-17 by human T cells. Eur J Immunol. 2006;36(3):661–70. doi:10.1002/eji.200535239.
- Wang X, Wei Y, Xiao H, Liu X, Zhang Y, Han G, Chen G, Hou C, Ma N, Shen B, et al. A novel IL-23p19/Ebi3 (IL-39) cytokine mediates inflammation in Lupus-like mice. Eur J Immunol. 2016;46(6):1343–50. doi:10.1002/eji.201546095.
- Bridgewood C, Alase A, Watad A, Wittmann M, Cuthbert R, McGonagle D. The IL-23p19/EBI3 heterodimeric cytokine termed IL-39 remains a theoretical cytokine in man. Inflamm Res. 2019;68(6):423–26. doi:10.1007/s00011-019-01235-x.
- Ramnath D, Tunny K, Hohenhaus DM, Pitts CM, Bergot AS, Hogarth PM, Hamilton JA, Kapetanovic R, Sturm RA, Scholz GM, et al. TLR3 drives IRF6-dependent IL-23p19 expression and p19/EBI3 heterodimer formation in keratinocytes. Immunol Cell Biol. 2015;93(9):771–79. doi:10.1038/icb.2015.77.
- Tabrizi MA, Klakamp SL. Considerations for construct and affinity design goals. In: Tabrizi MA, Bornstein GG, Klakamp SL, editors. Development of antibody-based therapeutics: translational considerations & challenges. Adis, Singapore: Springer Singapore; 2018. p. 19–40.
- Presky DH, Minetti LJ, Gillessen S, Wilkinson VL, Wu CY, Gubler U, Chizzonite R, Gately MK. Analysis of the multiple interactions between IL-12 and the high affinity IL-12 receptor complex. J Immunol. 1998;160:2174–79.
- Presta Leonard G Engineered Anti-il-23r Antibodies. WO 2008/106134 A2, 2008/02/26, 2008.
- Stockmann H, Todorovic V, Richardson PL, Marin V, Scott V, Gerstein C, Lake M, Wang L, Sadhukhan R, Vasudevan A. Cell-surface receptor–ligand interaction analysis with homogeneous time-resolved FRET and metabolic glycan engineering: application to transmembrane and gpi-anchored receptors. J Am Chem Soc. 2017;139(46):16822–29. doi:10.1021/jacs.7b09359.
- Zhou L, Zhang J, DiGiammarino E, Kavishwar A, Yan B, Chumsae C, Ihnat PM, Powers D, Harlan J, Stine WB. PULSE SPR: a high throughput method to evaluate the domain stability of antibodies. Anal Chem. 2018;90(20):12221–29. doi:10.1021/acs.analchem.8b03452.
- Schlothauer T, Rueger P, Stracke JO, Hertenberger H, Fingas F, Kling L, Emrich T, Drabner G, Seeber S, Auer J, et al. Analytical FcRn affinity chromatography for functional characterization of monoclonal antibodies. MAbs. 2013;5(4):576–86. doi:10.4161/mabs.24981.