
ABSTRACT
The multi-attribute method (MAM), a recent advance in the application of liquid chromatography-mass spectrometry within the pharmaceutical industry, enables the simultaneous monitoring of multiple product quality attributes in a single analytical method. While MAM is coupled with automated data processing and reporting, the sample preparation, based on proteolytic peptide mapping, remains cumbersome and low throughput. The standard sample preparation for MAM relies on protein denaturation, reduction, and alkylation prior to proteolytic digestion, but often a desalting step is required to maintain enzymatic activity. While most of the sample preparation can be automated on a standard robotic liquid handling system, a streamlined approach for protein desalting and temperature modulation is required for a viable, fully automated digestion. In this work, for the first time, a complete tip-based MAM sample preparation is automated on a single robotic liquid handling system, leveraging a deck layout that integrates both heating and cooling functionalities. The fully automated method documented herein achieves a high-throughput sample preparation for MAM, while maintaining superior method performance.
Abbreviations: MAM: multi-attribute method; PQAs: product quality attributes; CE: capillary electrophoresis; IEX: ion-exchange chromatography; HILIC-FLR: hydrophilic interaction liquid chromatography coupled to a fluorescence detector; RP-LC/UV: reversed-phase liquid chromatography coupled to a UV detector; MS: mass spectrometry; NPD: new peak detection; GdnHCl: guanidine hydrochloride; TIC: total ion current; pAb: polyclonal antibody; IgG: immunoglobulin G; DTT: dithiothreitol; IAA: iodoacetic acid; TFA: trifluoroacetic acid; A280: absorbance at 280 nm wavelength; 96MPH: 96-channel multi-probe head; CPAC: Cold Plate Air Cooled; HHS: Hamilton Heater Shaker; DWP: Deep-Well Plate; PCR: Polymerase Chain Reaction; NTR: Nested Tip Rack; Met: methionine; Trp: tryptophan; N-term pQ: N-terminal glutamine cyclization; Lys: lysine; PAM: peptidylglycine α-amidating monooxygenase; G0F: asialo-, agalacto-, bi-antennary, core substituted with fucose; G1F: asialo-, mono-galactosylated bi-antennary, core substituted with fucose; G2F: asialo-, bi-galactosylated bi-antennary, core substituted with fucose; G0: asialo-, agalacto-, bi-antennary; Man5: oligomannose 5; Man8: oligomannose 8; TriF: asialo-, tri-galactosylated tri-antennary, core substituted with fucose.
Introduction
Within the pharmaceutical industry, the field of biotherapeutics is rapidly expanding. Biotherapeutics, which span an array of modalities ranging from protein/peptide-based therapeutics to nucleic acid-based therapeutics, pose unique analytical challenges to achieving comprehensive product characterization. In particular, the heterogeneous nature of the products, due to the large relative size, polypeptide terminal heterogeneity, and presence of modification hotspots and consensus sequences, can cause problems. Modifications such as deamidation, oxidation, and other product quality attributes (PQAs), should be well characterized and monitored throughout the development of biotherapeutics to assess: 1) effects on structure-function; 2) any relationships with the manufacturing and purification process conditions; and 3) any changes related to stability at recommended and accelerated storage conditions. This information is critical to ensure product quality, safety, and efficacy.
Traditionally, PQAs can be monitored using an array of chromatographic and electrophoretic separation techniques. Commonly implemented analytical procedures include capillary electrophoresis (CE) or ion-exchange chromatography (IEX) to analyze charge variants and product-related impurities,Citation1 hydrophilic interaction liquid chromatography coupled to a fluorescence detector (HILIC-FLR) for N-glycan analysis,Citation2 and reversed-phase liquid chromatography coupled to a UV detector (RP-LC/UV) for methionine oxidation and the confirmation of the product identity. Given the nature of the PQAs and the specificity of the individual analytical techniques, these methods are often run in tandem to provide comprehensive characterization of the product.
Recently, the multi-attribute method (MAM) was developed to monitor PQAs by liquid chromatography-mass spectrometry (LC-MS) peptide mapping.Citation3 The combination of the chromatographic separation of peptides and the high resolving power of contemporary mass spectrometers enable numerous PQAs to be monitored within a single experiment. This ability could ultimately allow MAM to replace multiple traditional analytical procedures.Citation3–9 MAM also overcomes limitations associated with several conventional methods. For instance, released glycan analysis by HILIC-FLR relies on the enzymatic release of N-linked glycans prior to analysis, resulting in the cumulative distribution of protein glycoforms. However, information related to N-glycan occupancy at specific residues is lost, which can be important if multiple N-linked glycan consensus sequences are present on the product. Similarly, charge variant analysis by IEX assesses global levels of acidic and basic species, but does not provide site specificity or identities of specific PQAs.Citation3 As MAM is performed at the peptide level, all information related to PQA identity, site specificity and relative abundance is retained. In addition to monitoring known PQAs, MAM includes New Peak Detection (NPD) allowing non-targeted detection of unmonitored quality attributes and impurities in the product.Citation3
Given that analysis by MAM is performed at the peptide level, proteins must first be digested into peptides, which can be accomplished using an enzymatic or chemical digestion. Trypsin is widely used for peptide mapping experiments, cleaving C-terminal to lysine and arginine residues.Citation10 While trypsin is a highly specific enzyme, it has several limitations that must be considered. The enzymatic activity is enhanced at alkaline pH conditions and elevated temperatures, resulting in artificial protein modifications, or artifacts, as a result of the sample preparation.Citation11,Citation12 Furthermore, the presence of guanidine hydrochloride (GdnHCl), which is frequently used to denature biotherapeutics prior to enzymatic digestion, results in reduced enzymatic activity.Citation13,Citation14 Thus, many procedures have focused on reducing incubation times and removing GdnHCl via a buffer exchange.Citation12 While many of the sample preparation steps can be automated on standard robotic liquid handling systems, protein buffer exchange step is more challenging to automate.Citation15–17 Buffer exchange with size exclusion columns has not been compatible with automation on a robotic system because these columns often require centrifugation for equilibration, loading and elution of the desalting product. The use of a 96-well dialysis plate containing micro-dialysis cartridges submerged in dialysis buffer to automate this buffer exchange step during MAM sample preparation was recently reported.Citation15 While the study demonstrated the feasibility of completely automating the MAM sample preparation on a single liquid handling system, the buffer exchange step alone took 2 hours to complete, potentially introducing additional method artifacts. Here, we report a tip-based buffer exchange approach using the novel SizeX IMCStip to expedite the buffer exchange. A more rapid, yet complete buffer exchange with the SizeX IMCStip uses standard pipetting, where samples are loaded on top of the size exclusion resin bed and zero-pressure tip pickup with controlled air displacement are exploited to precisely elute and separate large molecules from denaturants within 10 minutes.
In this work, the entire MAM sample preparation was automated on a single robotic liquid handling system. Our intent was to reduce the hands-on sample preparation time and improve the reproducibility of the digestion. To evaluate the digestion quality, both LC-MS total ion current (TIC) profiles and relative abundances of PQAs were compared. Specifically, PQAs were compared between the manual preparation and two distinct Hamilton robotic systems. The precision of the automated sample preparation method was evaluated by monitoring PQA abundances. While the automated sample preparation method we used performs well in terms of the digestion quality, our aim here is to document that a method can be efficiently transferred from a manual to automated procedure. Therefore, we fully expected that the exact sample preparation method can be optimized to suit the needs of individual products, if needed.
Results
Protein recovery from buffer exchange using bio-spin columns or sizeX100 IMCStips
The performance of the SizeX100 IMCStips was compared to the Bio-Spin 6 columns using the manual preparation method (). Protein A-purified polyclonal human IgG (pAb1) was denatured, reduced and alkylated in bulk. 100 µL aliquots of the bulk pAb1 were desalted manually using the Bio-Spin 6 columns (n = 2) or on the Hamilton Microlab STAR using SizeX100 IMCStips; shows the Hamilton deck layout. Eight tips from three different lots of SizeX100 IMCStips were placed in the pattern denoted in . The concentrations of samples measured by A280 and the recovered volume after desalting were used to calculate the total protein recovery ().
Figure 1. Schematic of MAM sample preparation using manual or automated methods. Within the manual method, denaturation, reduction, alkylation and proteolytic digestion are performed manually while the buffer exchange step could be carried out using either Bio-Spin 6 columns (20-minute process) or SizeX IMCStips on Hamilton STAR (8-minute process) to enable a direct comparison of the desalting performance. The automated method refers to a complete preparation, including denaturation, reduction, alkylation, buffer exchange and proteolytic digestion, performed hands-off on Hamilton STAR
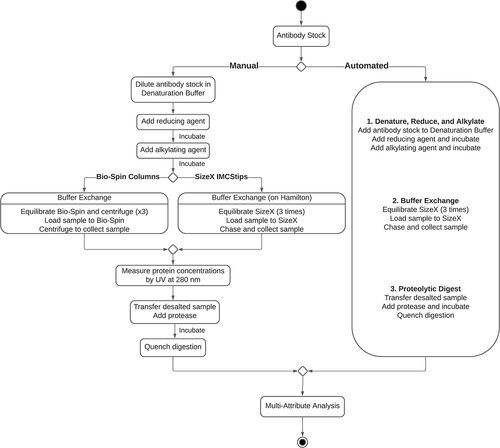
Figure 2. Example of minimal hardware configuration of automated MAM sample preparation deck layout on Hamilton Microlab STAR. CPAC: Cold Plate Air Cooled; HHS: Hamilton Heater Shaker; DWP: Deep-Well Plate; PCR: Polymerase Chained Reaction; NTR: Nested Tip Rack
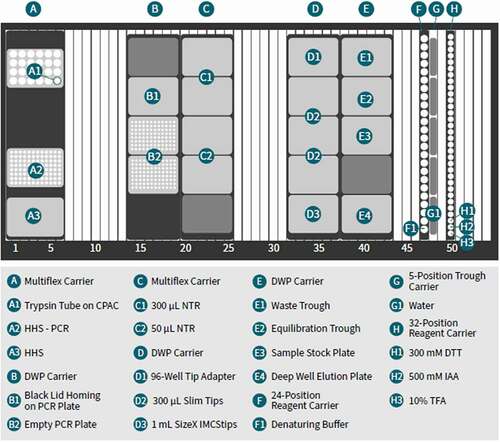
Figure 3. Comparison of antibody recovery buffer exchanged using manual (Bio-Spin) and automated (SizeX100 IMCStips) methods. Error bars indicate ± 1 S.D. (a) SizeX100 IMCStips locations of three different lots on a 96 multi-probe head of Hamilton STAR. Recovered volumes in µL (b) and Recovered concentration in mg/mL (c) are plotted for each lot of SizeX, average of all SizeX and Bio-Spin columns. (d) Average recovery percentages
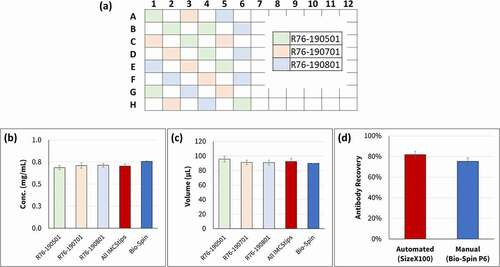
The average concentration recovered from SizeX100 IMCStips was 0.70 mg/mL with 4% RSD, which is slightly lower than sample concentration recovered from the Bio-Spin 6 columns (0.76 mg/mL) (). The average volume recovered across the three lots of SizeX100 IMCStips (92.5 µL) was slightly higher than that of Bio-Spin 6 columns (90 µL), with minimal lot-to-lot variance (4% relative standard deviation (RSD)) (). In this experiment, the concentration recovered following the SizeX100 IMCStips was consistently around 82% of the loading concentration, which could enable the elimination of the off-line concentration measurement after the buffer exchange step when doing a fully automated digestion ().
The average total recovery percentages from the two buffer exchange procedures were comparable (79 ± 3% for SizeX IMCStips vs 82% for Bio-Spin controls) (). The experiment demonstrates consistency in antibody recovery when using the SizeX IMCStips.
Total ion chromatograms of digested antibody samples
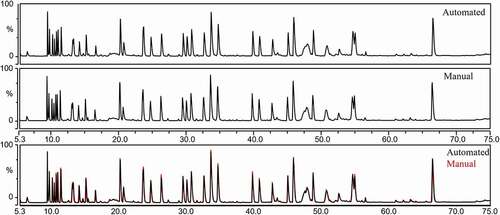
Internally, the digestion method and LC-MS parameters were optimized on the manual sample preparation across a diverse set of IgG subclasses, including IgG1, IgG2 and IgG4 molecules, and optimized to ensure near complete alkylation of cysteines and limit the number of missed cleavages (Figure S1). GdnHCl removal efficiency was based on a qualitative measurement, where starting material or pre- size exclusion chromatography (SEC) sample (blue line) shows a peak at 250 nm, and this peak is decreased without affecting the peak at 280 nm for the post-SEC sample (red line) (Figure S2). Due to the presence of Tris buffer, the absorbance for desalted sample shows a strong absorbance at 210–215 nm (Figure S2). The desalting efficiency was also monitored by comparing the peptide profiles between manual process and the automated process. After incorporating SizeX IMCStips into a fully automated MAM sample preparation program, the performance of the automation was assessed by comparing the manual method to the automated method for the monoclonal antibody (mAb1) (manual: n = 6 by two analysts, automated: n = 3). The protein recovery (data not shown) and TIC profiles between the two methods were comparable (, Figure S3).
Figure 4. Representative total ion chromatograms of tryptic-digested peptides from digested mAb1 prepared manually (Bio-Spin 6 column) and automatically (SizeX IMCStips). The data, presented in both a stacked view and overlaid view, show high similarity between the two methods
Precision of PQA relative abundances
Precision in the relative abundance of PQA quantitation is an important factor when evaluating MAM sample preparation automation. Precision of an analytical method may be considered at three levels: repeatability, intermediate precision, and reproducibility.Citation9 Here, we evaluated both intermediate precision and repeatability of the sample preparation. Intermediate precision was evaluated by comparing PQA relative abundances of automated preparations on two independent Hamilton STAR systems to multiple manual sample preparations. Importantly, in all instances, mAb1 was digested across multiple days to demonstrate the precision of the method over time. Repeatability (intra-day, intra-system precision) for the automated preparation was demonstrated by monitoring PQA relative abundances from 11 independently digested samples on the Hamilton robotic system, which were then analyzed in a single LC-MS sequence.
Relative abundances of select PQAs are shown in and . These modifications include both methionine and tryptophan (Trp) oxidation, deamidation, ammonia loss (succinimide), N-terminal pyroQ, C-terminal proline amidation, C-terminal lysine, and a sequence variant. Similarly, relative abundances of select N-glycopeptides are shown in and . A total of 18 glycopeptides were monitored and all with a relative abundance of greater than 0.1% are presented. Importantly, MAM enables the detection of the aglycosylated peptide, which was approximately 1.5% for mAb1.
Table 1. Repeatability (intra-method precision) and intermediate precision (inter-method precision) by measured relative abundance percentages of PQAs, including post-translational and chemical modifications. SD: standard deviation, RSD: relative standard deviation. * indicates manual preparation by six analysts
Table 2. Repeatability (intra-method precision) and intermediate precision (inter-method precision) by measured relative abundance percentages of glycopeptides. SD: standard deviation, RSD: relative standard deviation. * indicates manual preparations by six analysts
Figure 5. Comparison of relative abundance percentages in log10 scale showing repeatability (intra-method precision) of automated preparation on Hamilton 2 and intermediate precision (inter-method precision) between manual preparation and automated preparations on two independent Hamilton STAR systems. (a) PQAs including post-translational and chemical modifications, and (b) Fc glycosylation patterns are shown. Error bars indicate ± 1 S.D
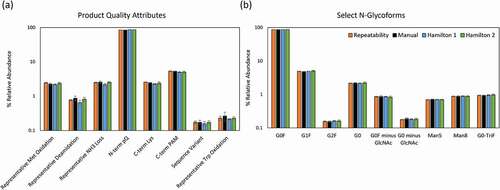
The relative abundances and associated % RSDs of the PQAs and glycopeptides are comparable between the manual preparation and the automated preparation performed on two Hamilton systems, designated Hamilton 1 and Hamilton 2 (). For the automated method, all PQAs had less than 15% RSD except for a low level deamidation site, which had poor chromatographic resolution from the unmodified peptide. Furthermore, Trp oxidation variability was significantly reduced from 29.8% RSD in manual preparations to 5.1% RSD and 10.7% RSD in Hamilton 1 and Hamilton 2, respectively (). All presented glycopeptides (> 0.1% abundance) had less than 10% RSD within the intermediate precision experiment (). In addition, there was no significant difference in relative abundances of other digestion artifacts, including missed cleavages and under-alkylation, between manual and automated preparations (data not shown). Taken together, the intermediate precision data demonstrate excellent performance and reproducibility of the automated method.
TICs from repeatability experiment in Figure S4 showed high similarity. The RSDs of all PQAs for 11 repeatability samples were below 10%, except for Trp oxidation (13.6%) (). While methionine is added to the sample preparation to reduce artifactual methionine oxidation, the addition of methionine may not control tryptophan oxidation induced during the sample preparation or during time spent in the autosampler. All presented glycopeptides (> 0.1% abundance) had less than 5% RSD within the repeatability experiment ( and Table S1).
New peak detection
In addition to monitoring known PQAs, MAM includes NPD to ensure that there are no changes in unmonitored quality attribute or product impurities.Citation8 NPD contributes to building product-specific, institutional, and holistic scientific knowledge. In this instance, NPD was used to ensure consistent digestion profiles across sample preparations.
When comparing the manual and automated sample preparations ( and Figure S3), NPD was performed to ensure that there were no differences within the digestion of a single mAb. When applied in this format, NPD can be used within the method development process to ensure there are no differences in the digestion quality (i.e., missed cleavages) or method performance (i.e., alkylation efficiency). Importantly, specific setting for new peak detection were used to look for species ≥ 0.1% of the TIC signal and that had a 5× fold change, in line with parameters previously.Citation18 No new peaks were observed between the six manual preparations prepared by two analysts and the three automated preparations performed on the Hamilton 1 system. These data demonstrate the ability of the automation to reliably reproduce the manual sample preparation.
In the repeatability dataset, the file associated with the first mAb1 digest was compared to the subsequent ten preparations. No new peaks were detected within any of the injections, demonstrating the ability of the automated method to consistently digest the antibody within a single day. Furthermore, the absence of new peaks in either data set suggests that the digestion and alkylation efficiency are similar within all digests, which supports the overall consistency of the TIC profiles (Figure S3 and Figure S4). These data, along with the repeatability data for PQA relative abundances, demonstrate the ability of the automated method to reliably digest multiple samples on a given day.
Discussion
In the past decade, use of MAM in biotherapeutic characterization has expanded because of its ability to monitor multiple PQAs in a single analytical method. This powerful method could be used throughout the product lifecycle, from early product and process development to product release and stability. Despite the method’s broad applications for biotherapeutics, the current implementation of MAM sample preparation relies on manual sample preparation, which is time-consuming, labor intensive and prone to error. Specifically, the predominant barrier to automation is a robust and precise buffer exchange step. Here, we demonstrate a first-in-class, automated workflow on a single platform to propel MAM as a robust analytical tool to ensure product safety, potency, and efficacy. This automation was primarily enabled through the use of SizeX IMCStips for protein buffer exchange and the implementation of a streamlined Hamilton robotic system that offers temperature modulation for various incubation steps. The conversion to SizeX IMCStips on the Hamilton system offers several additional benefits, including the elimination of the centrifugation and off-line equilibration steps associated with typical desalting products. Furthermore, the automated method is better suited for a high-throughput format, allowing 96 samples to be prepared simultaneously, as the full 96-well plate can be buffer exchanged in less than 10 minutes. Thus, the complete program run time is largely dependent on the number of samples and the duration of each incubation step. Processing time approximation is possible with automated systems because the time for the steps, such as incubations, plate movement, lid handling, desalting processing, and liquid transfers, is predictable. Therefore, it is possible to calculate the digestion time for any number of samples. Approximate processing time of the automated MAM method for 8, 24, 48, and 96 samples is 140, 170, 210, and 280 minutes, respectively. While the impact to processing time is significant, the MAM digest leverages a low artifact digestion, so the impact to attribute quantitation would be minimal. Furthermore, manual preparation of similar sample sizes would also be associated with a significant, and likely larger, impact to sample preparation time.
When the automated method was applied to a mAb, the TIC profile and PQA relative abundances were consistent between the automated and manual method preparations. The data herein demonstrate excellent performance of the automated method, as the relative abundances of PQAs were similar across two Hamilton systems and consistent with the manual preparation. Furthermore the % RSDs of PQAs were excellent, with less than 15% RSD across all PQAs, except for one deamidation site. In general it was observed that attributes that do not change on stability (i.e., N-glycopeptides) exhibited lower % RSDs, as did PQAs with higher relative abundances.Citation19 The repeatability data, consisting of 11 independently prepared automated digests from a single Hamilton system on a single day, showed high reproducibility with below 10% RSD for nearly all PQAs. In addition to PQA quantitation, no new peaks were observed, demonstrating the ability of the automation to reproduce the manual sample preparation reliably and consistently. The novel automated MAM sample preparation consistently produces high quality digestions in a high-throughput format, eliminating any error from human intervention. While the automated sample preparation method we used performs well in terms of the digestion quality, our intention was to document that a method can be efficiently transferred from a manual to automated method. Therefore, we expect that the exact sample preparation method can be optimized to suit the needs of individual products, if needed. The automation of MAM sample preparation eases the adaptation of MAM for biotherapeutic characterization and routine monitoring. Additional decrease in LC analytical run time would further increase processing throughput of this method.
Materials and methods
Materials
Protein A-purified polyclonal human IgG (pAb1) was purchased from ImmunoReagents, Inc (Raleigh, NC). Cat. No. Hu-003-C.01. Monoclonal antibody (mAb1, a full-length IgG2 molecule) was produced and purified at Pfizer and stored at < −80°C until use. Water with 0.1% formic acid (Honeywell Chromasolv LC-MS), and acetonitrile with 0.1% formic acid (Honeywell Chromasolv LC-MS Ultra) were purchased from Thermo Fisher Scientific (Waltham, MA). Trifluoroacetic acid (TFA), Pierce DTT no-weigh format, 8.0 M GdnHCl solution, and Pierce retention time calibration mixture were from Thermo Fisher Scientific (Waltham, MA). Dithiothreitol (DTT), sodium iodoacetate, and L-methionine were purchased from MilliporeSigma (St. Louis, Mo). Sequencing-grade modified trypsin was purchased from Promega (Madison, WI). 1 M Tris (hydroxymethyl) aminomethane hydrochloride (Tris-HCl), pH 8.4 stock solution and 1 M Tris-HCl, pH 7.9 stock solution were obtained from Teknova (Hollister, CA). SizeX100 IMCStips were from Integrated Micro-Chromatography Systems (Irmo, SC). Bio-Spin 6 columns were obtained from Bio-Rad (Hercules, CA). Pierce LTQ Velos ESI Positive Ion Calibration solution was purchased from Pierce Biotechnology (Waltham, MA).
Reduction, alkylation, buffer exchange and trypsin digestion
Both the manual and automated MAM preparation methods presented here used the previously described digestion procedureCitation3,Citation12 with slight modifications (). In the manual digestion method, pAb1 or mAb1 (100 µg of antibody) were mixed with denaturation buffer containing 7 M GdnHCl and reduced using 500 mM DTT for 30 minutes at 30°C. After incubation, 500 mM sodium iodoacetic acid (IAA) was added to the sample, which was then incubated in the dark at 25°C. The samples were then quenched with 100 mM DTT. The alkylated sample was immediately desalted and buffer exchanged using Bio-Spin 6 columns with pH 7.9 digestion buffer to remove excess GdnHCl, DTT and IAA. The concentration of desalted samples was determined by absorption at 280 nm (A280). The antibody was then digested with trypsin (1:10 w/w enzyme to sample ratio) at 37°C for 60 minutes. TFA was added at a final concentration of 0.2% to quench the digestion. The digested samples were analyzed immediately by LC-MS or stored at < −80°C. A manual digest was also performed using the identical procedure with the substitution of SizeX100 IMCStips for the Bio-Spin 6 column to enable a direct comparison of the desalting products ().
The automated sample preparation was completely performed on the Hamilton robotic system (Hamilton Company) and maintained all reagent concentrations, digestion conditions, and enzyme ratios. Migration of SEC to a pipette tip, where the packed resin bed is composed of polyacrylamide with 6 kDa molecular weight cutoff inside the 1 mL pipette tip, eliminated the need for centrifugation step associated with manual spin column-based buffer exchange step. This adaptation of buffer exchange to a pipette tip enables the complete automation of sample preparation while minimizing processing time, whereas the previous method using centrifugation required off-deck, manual intervention. The automated program was installed and tested on the Hamilton Microlab STAR system at two locations. The hardware configuration of Hamilton Microlab STAR deck layout is shown in . The robot is equipped with a 96 multi-probe head (96MPH) and an 8-channel, independent spacing pipetting arm with a maximum transfer volume of 1 mL per channel. A maximum of 96 samples can be simultaneously desalted on SizeX IMCStips using a 96 MPH of the robot.
Reversed-phase LC
Mobile phase A contained 0.1% formic acid in water and mobile phase B contained 0.1% formic acid in acetonitrile. The following LC conditions were used: flow rate 0.25 mL/minute, column temperature 50°C during separation and auto-sampler kept at 4°C. For separation analysis, a nominal load of 3 µg of the digest, based on final sample concentration, was injected onto a Zorbax C18 300-SB, 300 Å pore size, 1.8 µm particle, 2.1 mm × 150 mm column (Agilent). The gradient started at 1% B until 5 minutes, then increased gradually to 10% in 1 minute. Next, the gradient was ramped up from 10% B to 35% B in 64 minutes. The column was then washed and equilibrated prior to the next injection.
Mass spectrometry
The tryptic peptides were separated and monitored by RP-HPLC coupled to MS (Thermo Scientific Exactive Plus). The MS capillary temperature was maintained at 225°C with an S-lens RF level at 50. The MS spectra collection was performed at 140,000 resolution in positive polarity mode with an automatic gain control target of 3e6, maximum ion time of 200 ms and scan range of 250 to 1,800 m/z. All MS data shown herein were collected on a single Exactive Plus instrument.
Chromeleon data processing
In-depth product characterization of mAb1 has been completed previously using BioPharma Finder (Thermo Scientific) to generate a product specific processing and report method in Chromeleon 7.2.10 (Thermo Scientific). Thus, raw data files from the Exactive Plus MS were processed using the available processing and report methods to quantitate PQA relative abundances. In the processing method, the precursor mass tolerance was set to 10 ppm and integration was performed using the ICIS detection algorithm. Multiple charge states and isotopes for each component were used for peptide quantitation. The relative abundances of PQAs were calculated by dividing the area of the modified peptide by the summed area of all forms of the peptide (both modified and unmodified). The relative abundances of the glycopeptides were calculated by dividing the area of a select glycopeptide by the summed area of the aglycosylated peptide and all associated glycopeptides. Proper integration was confirmed by visual inspection and all components were required to have a peptide mass accuracy of ≤ 5 ppm and an isotope dot product score ≥ 0.9. The processing method covered a wide range of modifications, including methionine and tryptophan oxidation, asparagine deamidation, N- and C-terminal heterogeneity, an amino-acid sequence variant, and N-glycopeptides.
For NPD, non-targeted MS processing in Chromeleon 7.2.10 was performed with a TIC intensity setting of 0.1%, a maximum number of frames of 10,000 and an m/z width (ppm) of 10. Frames were filtered out unless they met all the following settings: PR Element = 0, PR Size > 1, Charge between 2 and 6, and Ratio not between 0.2 and 5 (thus fold change is > 5×).
Declaration of conflicting interests
The authors declared the following potential conflicts of interest with respect to the research, authorship, and/or publication of this article: P.S. and L.A.L. is employed by IMCS, Inc.
Supplemental Material
Download Zip (2.3 MB)Acknowledgments
We thank Richard Rogers at Bristol-Myers Squibb Company for his feedback in the development of this method. We also appreciate assistance from Casey Snodgrass, Caitlin Costelle, and Kalie Somerville at Hamilton Company. We thank Nataliya Parahuz, Himakshi Patel, and Wenqin Ni for their contribution to performing manual preparations. We thank Jason Rouse, Justin Sperry, Carly Daniels, Keith Johnson, and Olga Friese for their review of the manuscript.
Supplementary material
Supplemental data for this article can be accessed on the publisher’s website
References
- Zhao SS, Chen DDY. Applications of capillary electrophoresis in characterizing recombinant protein therapeutics. Electrophoresis. 2014;35:96–9. PMID: 24123141. doi:10.1002/elps.201300372.
- Sandra K, Vandenheede I, Sandra P. Modern chromatographic and mass spectrometric techniques for protein biopharmaceutical characterization. J Chromatogr A. 2014;1335:81–103. PMID: 24365115. doi:10.1016/j.chroma.2013.11.057.
- Rogers RS, Nightlinger NS, Livingston B, Campbell P, Bailey R, Balland A. Development of a quantitative mass spectrometry multi-attribute method for characterization, quality control testing and disposition of biologics AU - Rogers, Richard S. mAbs. 2015;7:881–90. PMID: 26186204. doi:10.1080/19420862.2015.1069454.
- Wang T, Chu L, Li W, Lawson K, Apostol I, Eris T. Application of a quantitative LC–MS multiattribute method for monitoring site-specific glycan heterogeneity on a monoclonal antibody containing two N-linked glycosylation sites. Anal Chem. 2017;89:3562–67. PMID: 28199092. doi:10.1021/acs.analchem.6b04856.
- Li Y, Huang Y, Ferrant J, Lyubarskaya Y, Zhang YE, Li SP, Wu SL. Assessing in vivo dynamics of multiple quality attributes from a therapeutic IgG4 monoclonal antibody circulating in cynomolgus monkey. mAbs. 2016;8:961–68. PMID: 27030286. doi:10.1080/19420862.2016.1167298.
- Wang Y, Li X, Liu YH, Richardson D, Li H, Shameem M, Yang X. Simultaneous monitoring of oxidation, deamidation, isomerization, and glycosylation of monoclonal antibodies by liquid chromatography-mass spectrometry method with ultrafast tryptic digestion. mAbs. 2016;8:1477–86. PMID: 27598507. doi:10.1080/19420862.2016.1226715.
- Dong J, Migliore N, Mehrman SJ, Cunningham J, Lewis MJ, Hu P. High-throughput, automated protein a purification platform with multiattribute LC–MS analysis for advanced cell culture process monitoring. Anal Chem. 2016;88:8673–79. PMID: 27487007. doi:10.1021/acs.analchem.6b01956.
- Rogers RS, Abernathy M, Richardson DD, Rouse JC, Sperry JB, Swann P, Wypych J, Yu C, Zang L, Deshpande R. A view on the importance of “Multi-Attribute Method” for measuring purity of biopharmaceuticals and improving overall control strategy. AAPS J. 2017;20:7. PMID: 29192343. doi:10.1208/s12248-017-0168-3.
- Rogstad S, Yan H, Wang X, Powers D, Brorson K, Damdinsuren B, Lee S. Multi-attribute method for quality control of therapeutic proteins. Anal Chem. 2019;91:14170–77. PMID: 31618017. doi:10.1021/acs.analchem.9b03808.
- Dong MW. Tryptic mapping by reversed phase liquid chromatography. Adv Chromatogr. 1992;32:21–51. http://www.ncbi.nlm.nih.gov/pubmed/1727329
- Burkhart JM, Schumbrutzki C, Wortelkamp S, Sickmann A, Zahedi RP. Systematic and quantitative comparison of digest efficiency and specificity reveals the impact of trypsin quality on MS-based proteomics. J Proteomics. 2012;75:1454–62. PMID: 22166745. doi:10.1016/j.jprot.2011.11.016.
- Ren D, Pipes GD, Liu D, Shih LY, Nichols AC, Treuheit MJ, Brems DN, Bondarenko PV. An improved trypsin digestion method minimizes digestion-induced modifications on proteins. Anal Biochem. 2009;392:12–21. PMID: 19457431. doi:10.1016/j.ab.2009.05.018.
- Mangel WF, Singer PT, Cyr DM, Umland TC, Toledo DL, Stroud RM, Pflugrath JW, Sweet RM. Structure of an acyl-enzyme intermediate during catalysis: (guanidinobenzoyl)trypsin. Biochemistry. 1990;29:8351–57. PMID: 2252895. doi:10.1021/bi00488a022.
- Turk D, Stürzebecher J, Bode W. Geometry of binding of the Nα-tosylated piperidides of m-amidino-, p-amidino- and p-guanidino phenylalanine to thrombin and trypsin. FEBS Lett. 1991;287:133–38. PMID: 1879520. doi:10.1016/0014-5793(91)80033-y.
- Qian C, Niu B, Jimenez RB, Wang J, Albarghouthi M. Fully automated peptide mapping multi-attribute method by liquid chromatography–mass spectrometry with robotic liquid handling system. J Pharm Biomed Anal. 2021;198:113988. PMID: 33676166. doi:10.1016/j.jpba.2021.113988.
- Bomans K, Haberger M, Bonnington L, Wagner K, Kailich T, Wegele H. Multi-attribute monitoring of antibody modifications by semi-automated liquid chromatography mass spectrometry peptide mapping. Am Pharm Rev. 2016;19:16–21. https://www.americanpharmaceuticalreview.com/Featured-Articles/331529-Multi-Attribute-Monitoring-of-Antibody-Modifications-by-Semi-Automated-Liquid-Chromatography-Mass-Spectrometry-Peptide-Mapping/
- Millán-Martín S, Jakes C, Carillo S, Buchanan T, Guender M, Kristensen DB, Sloth TM, Ørgaard M, Cook K, Bones J. Inter-laboratory study of an optimised peptide mapping workflow using automated trypsin digestion for monitoring monoclonal antibody product quality attributes. Anal Bioanal Chem. 2020;412:6833–48. PMID: 32710279. doi:10.1007/s00216-020-02809-z.
- Mouchahoir TE, Schiel J, Rogers R, Heckert AJ, Place B, Ammerman A, Li X, Robinson T, Schmidt BM, Chumsae C, et al. New peak detection performance metrics from the MAM consortium interlaboratory study. J Am Soc Mass Spectrom. 2021;32:913–28. PMID: 33710905. doi:10.1021/jasms.0c00415.
- Tajiri-Tsukada M, Hashii N, Ishii-Watabe A. Establishment of a highly precise multi-attribute method for the characterization and quality control of therapeutic monoclonal antibodies. Bioengineered. 2020;11:984–1000. PMID: 32942957. doi:10.1080/21655979.2020.1814683.