
 ?Mathematical formulae have been encoded as MathML and are displayed in this HTML version using MathJax in order to improve their display. Uncheck the box to turn MathJax off. This feature requires Javascript. Click on a formula to zoom.
ABSTRACT
Biotherapeutics are an important class of molecules for the treatment of a wide range of diseases. They include low molecular weight peptides, highly engineered protein scaffolds and monoclonal antibodies. During their discovery and development, assessments of the biophysical attributes is critical to understanding the solution behavior of therapeutic proteins and for de-risking liabilities. Thus, methods that can quantify, characterize, and provide a basis to inform risks and drive the selection of more optimal antibody and alternative scaffolds are needed. Nuclear Magnetic Resonance (NMR) spectroscopy is a technique that provides a means to probe antibody and antibody-like molecules in solution, at atomic resolution, under any formulated conditions. Here, all samples were profiled at natural abundance requiring no isotope enrichment. We present a numerical approach that quantitates two-dimensional methyl spectra. The approach was tested with a reference dataset that contained different types of antibody and antibody-like molecules. This dataset was processed through a procedure we call a Random Sampling of NMR Peaks for Covariance Analysis. This analysis revealed that the first two components were well correlated with the hydrodynamic radius of the molecules included in the reference set. Higher-order principal components were also linked to dynamic features between different tethered antibody-like molecules and contributed to decisions around candidate selection. The reference set provides a basis to characterize molecules with unknown solution behavior and is sensitive to the behavior of a molecule formulated under different conditions. The approach is independent of protein design, scaffold, formulation and provides a facile method to quantify solution behavior.
Introduction
Protein-based therapeutics like monoclonal antibodies (mAbs) have found important clinical applications for a myriad of diseases. Their approval for clinical use has increased dramatically, with over 30 new mAbs being approved since 2018.Citation1–3 The traditional IgG mAb scaffold adopts a canonical fold in which two heavy and two light chains associate to create two antigen-binding fragments (Fab), composed of the variable heavy (VH) and variable light chain (VL) that can bind to a target.Citation4 The Fabs are attached by a flexible hinge to the Fc domain, which is composed of heavy chain constant regions (CH2, CH3) that dimerize. In addition, the conventional mAb scaffold can also be modified by mutation to elicit unique functional behavior, including increasing half-life,Citation5 organized higher-order multimer structure formationCitation6 and reduced Fc receptor engagement,Citation7 but other modifications have been documented.Citation8–11 The clinical success of mAb therapeutics has spurred innovation and the engineering of a multitude of different therapeutic proteins that engage targets using unique structural folds. Therapeutic proteins cover a spectrum of scaffolds that range from small single variable heavy chain domains (approximate molecular weight (MW): 12–15 kDa), typically referred to as single-domain VHH monomers,Citation12 to self-associating mAbs (MW: 100s – 1000 kDA hexameric IgG, IgM, respectively).Citation6,Citation13 Some of these scaffolds or their fragments, can also be tethered to form multidomain proteins that are referred to as multivalent molecules when they bind two or more antigens.Citation14 Tethering allows creation of molecules that can engage multiple different epitopes on the same target or cross-link different targets. Furthermore, antibody-drug conjugates also present an exciting method to deliver payloads to specific cells.Citation15,Citation16 The availability of different protein scaffolds presents an exciting opportunity to discover novel therapeutics with differentiated mechanisms of action.Citation17,Citation18 However, antibody and antibody-derived protein therapeutics can present a developability challenge that can only be overcome by leveraging biophysical and structural methods that characterize, quantify and differentiate their solution behavior.Citation19,Citation20 Novel methods that can help differentiate between candidates using simple comparators that are sensitive across different formulation conditions are thus needed.
The biophysical characterization of therapeutic proteins serves a critical role in guiding decisions within discovery and developability efforts.Citation20–24 Chromatography, electrophoresis, thermal-melt fluorimetry, mass spectrometry and light-scattering techniques largely anchor many platforms that are used to qualify proteins that have therapeutic potential.Citation25–29 These approaches can capture the average state of the protein, informing on size, charge and distribution of aggregated states. Some of these approaches are also sufficiently sensitive to detect site-specific modifications that can manifest as liabilities.Citation26 Generally, these techniques are combined to develop fit-for-purpose platforms to qualify protein behavior. Over the past few years, Nuclear Magnetic Resonance (NMR) spectroscopy has emerged as a useful tool to profile a range of mAbs and other biologics. NMR is a technique that can profile molecules in solution, independent of formulation, while maintaining atomic resolution.Citation30,Citation31 NMR can also be sensitive to species that are sparsely populated (>1%) as long as they maintain favorable NMR relaxation properties.Citation32 One-dimensional (1D) NMR-based methods are information rich and have been used to profile mAb and mAb-like molecules.Citation33 Herein, we will denote the collection of different classes of mAb, mAb-like and mAb fragment molecules, referred to here as Ab(L/F)s. The 1D spectrum can report on the overall fold and, with careful normalization, molecules with a common overall structural topology can be compared.Citation31 In unique situations, if particular resonance peaks can be identified, site-specific modifications can be monitored for changes over time and detect different effects that affect the molecule studied.Citation31 However, spectral overlap can still be a limitation with detailed analyses.
The application of Diffusion-NMR (commonly referred to as Diffusion Ordered Spectroscopy (DOSY) NMR) has also been demonstrated to be useful in directly measuring the translational diffusion rate of biological molecules.Citation34 An advantage of DOSY NMR is the ability to profile molecules that are <1 kDa to several MDa, and it is sensitive to the distribution of translational diffusion rates that could be sampled by any detectable species.Citation34 This can enable the quantification of stably formed aggregates. Coupled withCitation1H NMR relaxation-based approaches, this provides additional ways to probe the average differences within mAb and mAb-like molecules.Citation34,Citation35 Modern NMR instrumentation has dramatically improved the sensitivity of conventional NMR experiments. This breakthrough, coupled with sparse sampling techniques, has enabled the detection of two-dimensional (2D) [1H, 13C]-HSQC or [1H, 13C]-HMQC fingerprint spectrum (also referred to as a methyl fingerprint spectrum), which report on the behavior of individual terminal methyl and/or aliphatic groups within mAbs and Fabs at natural abundance.Citation30 This obviates the necessity to isotope label the samples using recombinant or cell-free expression systems. Although, examples of Ab(L/F)s being isotope labeled have been documented, this process is very challenging and not accessible to the many targets and scale typically required in a discovery setting.Citation31,Citation36,Citation37 Natural abundance 2D NMR applied to mAbs and Fabs has largely been championed by the Marino group, where they demonstrated multiple applications including detected differences in mAb glycosylation, reported a statistical approach to assess large NMR signal differences between a set of biologics samples, and established the robustness and variability of 2D [1H, 13C]-HSQC fingerprinting for biosimilar comparison.Citation30,Citation36,Citation38–41 However, extracting and comparing quantitative aspects between different types of Ab(L/F)s still remains a challenge.
A collection of 2D [1H, 13C] correlation spectra for a variety of Ab(L/F)s, with orthogonally qualified solution behavior, would provide a basis of comparison against novel molecules. We propose that the linewidths and relative peak intensities of the resonances from 2D correlation spectra should be used as a measure of contrasting solution behavior between different Ab(L/F)s. This is because the NMR linewidth is a direct reporter on the overall rotational tumbling time of the molecule and conformational exchange events.Citation32 The overall rotational tumbling time is directly related to the shape/size of the molecule and is the primary source contributing to relaxation phenomena, which occurs on the nanoseconds timescale. Conformational exchange manifests as an addendum to the NMR linewidth and reports on lowly populated transient processes that occur on the micro- to millisecond timescale. These processes can involve self-association and intra-/interdomain fluctuations that can induce unique structural states.Citation42–44
From the above summary, linewidths and relative peak intensities, from different Ab(L/F)s could be used as proxies for NMR relaxation rates. Here, we propose that large random sampling of a subset of these spectral parameters and their incorporation into a Principal Covariance Analysis (PCA) simplifies their interpretation. This analysis provided a simplified basis to compare different Ab(L/F)s, and a trend emerged in which the largest components of the input data directly correlate with molecular hydrodynamic properties. By using a collection of different Ab(L/F)s, we could test the behavior of molecules with unknown behavior. The analysis also shows a sensitivity to changes in construct design that contribute to decisions around candidate selection. Furthermore, it is shown that the approach is sensitive enough to readout changes associated with a mAb formulated under three different conditions.
Results
Random sampling of principal components reveals an excellent correlation with hydrodynamic properties of Ab(L/F)s
We acquired natural abundance 2D [1H, 13C]-HMQC datasets for 20 different molecules that span four different Ab(L/F) classes with MWs between 12 and 150 kDa (Table S1). displays examples of 2D NMR datasets from the four different classes of Ab(L/F)s evaluated here. The set included individual VHH domains (; red), multivalent or tethered VHH domains (; blue), antigen-binding fragment (Fab; ; green) and full-length mAb (; cyan). From the 2D NMR datasets, only qualitative differences between the classes of molecules are evident in . The classes were specifically chosen to enable construction of a set that could distinguish features based on their modular construction. As a rough approximation, the selected classes are composed of single to multiples of small immunoglobulin domain(s) that are folded or tethered together.
Figure 1. (a-d) [1H, 13C]-HMQC correlation spectra for four different classes of Ab(L/F)s recorded at natural abundance. The four different classes of Ab(L/F)s that are represented include an individual VHH domain (a; red), multivalent VHH domains (b; blue), a fragment antigen binding domain (Fab) (c; green) and a full monoclonal antibody (mAb) (d; cyan). The [1H, 13C]-HMQC datasets reveal resonance peaks which correspond to individual methyl groups and reveal that high quality structural fingerprint spectra of Ab(L/F)s (with molecular weights (MW) spanning approximately 12–150 kDa) can be collected without the need of isotope labeling. As we progress from the smaller MW Ab(L/F)s (a, b) to the large fAb (c) and mAb (d) particles the number of peaks can vary and the “relative sharpness” of the peaks change significantly. The change in peak quality is related to its intensity and linewidth, which can be quantitated by the apparent linewidth (LWapp) for both the 1H and 13C dimensions. (e) No correlation exists between LWapp for both 1H and 13C dimensions across individual peak resonances and is largely indistinguishable between different types of protein therapeutics. The plot has the LWapp plotted for twenty different protein therapeutic molecules. The data points are colored with respect to the type of protein therapeutic as defined in panels a-d. (f) Low correlation is observed between the average LWapp between 13C and 1H for twenty different Ab(L/F)s. Each data point represents the average LWapp and the error bars are derived from the standard deviation across all values for a given Ab(L/F) sample
![Figure 1. (a-d) [1H, 13C]-HMQC correlation spectra for four different classes of Ab(L/F)s recorded at natural abundance. The four different classes of Ab(L/F)s that are represented include an individual VHH domain (a; red), multivalent VHH domains (b; blue), a fragment antigen binding domain (Fab) (c; green) and a full monoclonal antibody (mAb) (d; cyan). The [1H, 13C]-HMQC datasets reveal resonance peaks which correspond to individual methyl groups and reveal that high quality structural fingerprint spectra of Ab(L/F)s (with molecular weights (MW) spanning approximately 12–150 kDa) can be collected without the need of isotope labeling. As we progress from the smaller MW Ab(L/F)s (a, b) to the large fAb (c) and mAb (d) particles the number of peaks can vary and the “relative sharpness” of the peaks change significantly. The change in peak quality is related to its intensity and linewidth, which can be quantitated by the apparent linewidth (LWapp) for both the 1H and 13C dimensions. (e) No correlation exists between LWapp for both 1H and 13C dimensions across individual peak resonances and is largely indistinguishable between different types of protein therapeutics. The plot has the LWapp plotted for twenty different protein therapeutic molecules. The data points are colored with respect to the type of protein therapeutic as defined in panels a-d. (f) Low correlation is observed between the average LWapp between 13C and 1H for twenty different Ab(L/F)s. Each data point represents the average LWapp and the error bars are derived from the standard deviation across all values for a given Ab(L/F) sample](/cms/asset/9becc4a9-b798-4f7d-ab55-4752a79ae23b/kmab_a_1978132_f0001_oc.jpg)
These datasets report on individual methyl-bearing amino acids and some methylene groups within each molecule. The smaller molecules () maintain a smaller number of peaks as compared to larger counter parts because Fab and mAb molecules () contain more methyl groups. An important difference between all class of molecules is the heterogeneity in peak intensities and resonance peak linewidths in both 1H and 13C dimensions. For each observed resonance, within a 2D spectrum, two linewidths can be extracted corresponding to the 1H nuclei and its bonded 13C atom. The linewidth of a resonance peak is directly associated to NMR relaxation phenomenon that are modulated by different physical processes that affect the molecule.Citation32 Many approaches have been developed to accurately measure relaxation rates, which can be analyzed to determine parameters that define molecular reorientation and conformational exchange.Citation32,Citation44 However, with Ab(L/F)s at natural abundance, the accurate extraction of these rates in an artifact-free fashion would require unrealistically long acquisition times for small molecules. For a majority of larger Ab(L/F)s, this would also not be amenable because of signal-to-noise restrictions. It is important to note that linewidths from [1H, 13C]-HMQC datasets report on multiple relaxation pathways because of the generation of anti-phase and in-phase coherences during chemical shift labeling in both direct (1H) and indirect (13C) dimensions, and are not directly comparable to NMR-based methods, which extract precise relaxation rates.Citation45 Therefore, we refer to linewidths extracted from a [1H, 13C]-HMQC spectrum as an apparent linewidth (LWapp). This complexity can also complicate procedures that analyze line-shapes of resonance peaks, unless time-dependent changes in coherence evolution are taken into account.Citation46 However, as long as experimental acquisition parameters are constant, across all datasets, comparison is possible. Therefore, we propose that linewidths and relative intensities of resonance peaks detected from [1H, 13C]-HMQC () can serve as a proxy to report on the aforementioned physical processes and can provide a basis to quantitatively compare different Ab(L/F)s.
An automated procedure is required to enable facile analysis of natural abundance [1H, 13C]-HMQC spectra of antibody and antibody-like molecules. In order to remove human bias from the peak selection protocol, [1H, 13C]-HMQC spectra we used the automatic peak selection tool from the NMRPipe software package,Citation47 where resonances were selected based on a minimum signal-to-noise ratio criteria and were identified from within a constant spectral window (see Materials and Methods). A comparison of the linewidths from detected resonance peaks rendered no clear pattern that would enable quantitative comparison amongst different antibody and antibody-like molecules (). The raw individual LWapp values make it difficult to draw meaningful conclusions about molecular behavior. However, we note that the single VHH domain resonances maintain smaller 13C LWapp as compared to the larger molecules (Fab and mAb, green and cyan ), and when the average LWapp, in both dimensions, is compared (), a qualitative binning is achievable. In general, the average LWapp for smaller Ab(L/F)s, like VHH domains, show some separation between larger molecules. However, within a specific class the dispersion among the data points is poor and highly overlapped. Therefore, quantitative comparison by bulk LWapp parameters is of very limited value. In order to provide a basis, for which 2D spectra of Ab(L/F)s at natural abundance can be directly compared, we developed and evaluated a numerical approach that could highlight changes within spectral parameters.
An approach that can uniformly “normalize” the data from any 2D spectrum could allow the detection of unique differences, potentially providing the ability for more quantitative comparison between Ab(L/F)s. We hypothesize that using peak parameters from an array of different molecules, which maintain different structural scaffolds, could allow the identification of subtle differences between molecules. A variety of numerical approaches have been developed to assign quantitative similarities or dissimilarities between datasets that are complex in nature or that are dependent on many variables.Citation48 In particular, Principal Component Analysis (PCA) is a powerful approach that can take the same type of data from any number of samples composed of any number of observables that are dependent on any number of variables and can reduce their complexity by projecting their components into a simplified representation that allows facile detection of correlated or uncorrelated aspects between the input datasets.Citation48 Data subjected to a PCA are simplified, whereby the number of random variables that contribute to the data are reduced by projection into a lower dimensionality space. This projection identifies the minimum number of components that contribute to the input datasets and can establish how they might be distinguishable from other ones used in the calculation (i.e., how much is the variance between them). The power to distinguish subtle differences that are not readily apparent from the original data has led to PCA being used in a myriad of applications.Citation49,Citation50 PCA approaches have also been applied to 2D NMR spectra in cases when the atomic peak assignments are accessible. For example, PCA has been applied to ascertain complex-binding mechanisms during NMR-based titrations where changes to one assigned polypeptide sequence are monitored upon step-wise addition of a ligand.Citation51 This technique can also be used to evaluate the behavior of one molecule that is subjected to different solution or instrument conditions.Citation38,Citation40 One criterion for PCA is that the input data array, across all samples, must have an equivalent number of values. Therefore, the direct application of PCA to 2D NMR, of different Ab(L/F)s, is not straightforward because the structural scaffolds, size and behavior of samples will generate a different number of resonance peaks within each spectrum. Here, peak assignment of many Ab(L/F) samples is not readily feasible, as uniform isotope labeling is not always possible, and/or the MW of the molecule can be large making assignment experiments intractable. Furthermore, we aim for any approach to remain indifferent to the type of molecules that could be tested, and thus, any method would benefit if it could operate without the need to label.
In order to avoid the necessity of peak assignment and enable comparisons of the natural abundance [1H, 13C]-HMQC spectrum of any Ab(L/F), we combined the PCA with a procedure in which a subset of resonance peaks is selected, at random, from each spectrum and their PCs are calculated (see Materials and Methods). This random sampling of spectral information is repeated in a Monte Carlo fashion and the distributions of the calculated eigenvectors that arise from the repeated PCA are analyzed. We have termed the procedure “A Random Sampling of NMR Peaks for Covariance Analysis”. Hereafter, we will refer to this procedure as a Covariance Analysis (CA) method. From each spectrum, the LWapp in both 1H and 13C dimensions and normalized peak amplitude (normalized to maximum peak intensity) were used as input data for this procedure.
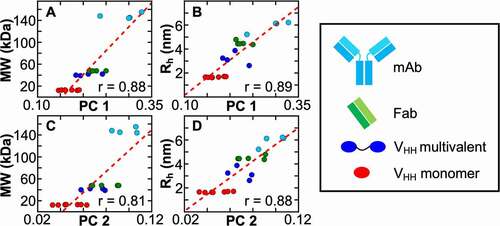
All molecules were processed through this CA and the top PCs were analyzed (). The first four PCs account for approximately 90% of the entire reference dataset and remain constant with limited variability throughout different iterations of the calculation (Figure S2). The values of the first two PCs that were determined from this CA method showed a separation between the different classes of antibody and antibody-like molecules. We hypothesized that since the input data are proxies for NMR relaxation phenomena, which is largely affected by the size and shape of the molecule,Citation32 the first two PCs could correlate with parameters that are sensitive to this attribute. To that end, we determined the apparent hydrodynamic radius (Rh) for all the reference molecules using Diffusion NMR in order to compare with the results from the CACitation34 (see Materials and Methods for details regarding the Diffusion NMR data). We compared the magnitude of the eigenvectors that were extracted for the reference set of antibody and antibody-like molecules and their MWs () and to their Rh (). Interestingly, a very high correlation is observed between the first two PCs and these macroscopic properties with Pearson correlation coefficients (r) between 0.81 and 0.89. This demonstrates that peak parameters that are extracted from 2D NMR datasets and that are processed through this CA method are sensitive to properties of molecules. However, MW does not completely capture the distribution of values that came from this method. Although, the Pearson correlation coefficients of PC1 and PC2 between MW and Rh, are nearly equivalent, a reduced variance is observed when PC1 and PC2 are compared to the apparent Rh of the molecule (). This is because Rh is sensitive to not only the size, but the overall shape of the molecule, which is dependent on the tertiary and quaternary structure of the molecule. This approach also allows us to generalize features from the reference dataset. The red dashed lines in are linear fits to the data and permit back calculation of an observable parameter like Rh. The variance for larger molecules like multidomain VHH (; blue points), Fab (; green points) and mAb (; cyan points) molecules are reduced. However, the variance remains high in both PC1 and PC2 for individual VHH domains when they are compared to MW and Rh. This indicates that there may be other effects that contribute to PC1 and PC2 for individual VHH domains that are not captured by Rh. Our numerical approach is an application of PCA that can quantify natural abundance NMR data from a range of different Ab(L/F)s and reveals how relative shape and size can be discerned and rank ordered.
Figure 2. The molecular weight (MW) (a, c) and hydrodynamic radius (Rh) (b, d) of an array of Ab(L/F)s correlate very well with the first Principal Components (PC) derived from natural abundance 2D correlation spectra. All data points within the plots were generated from the CA protocol involving twenty different natural abundance 2D datasets. The points are colored with respect to the class of Ab(L/F). They include VHH domains, multivalent VHH domains, fragment antigen binding (Fab) domains, and monoclonal antibodies and are colored red, blue, green and cyan, respectively. A comparison of the MW and Rh with respect to the first two Principal Components (PC) reveals a strong correlation. Although a high Pearson correlation coefficient (r) is observed for MW it is improved when Rh is used as it is a better measure of the shape/size of a molecule in solution
Visualizing the first two PCs and the effect of higher order principal components
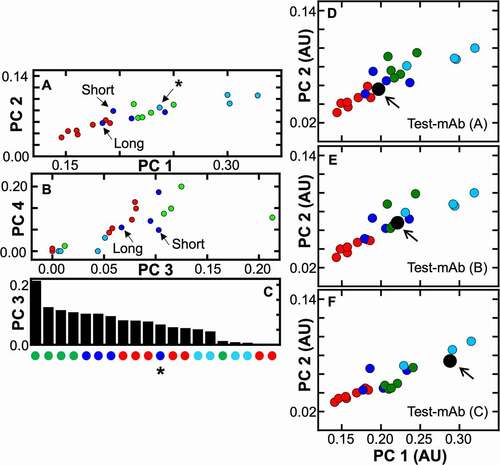
Our CA protocol can be applied to Ab(L/F)s with unknown solution behavior. By having a well profiled reference set, a test molecule, with unknown behavior can be benchmarked against previously characterized molecules (vide infra). However, within the reference set of molecules tested here, a comparison of PC1 and PC2 already highlights that some molecules within the same class can have unique features (). Directly plotting PC1 against PC2 () constructs a “molecular ruler”; a measurement that is very sensitive to subtle differences due to the inclusion of multiple types of molecules in the analysis. The plot is linear in nature, indicating correlation between the largest contributor to LWapp, the molecule’s overall tumbling time, and Rh. The linearity is due to the fact that the MW of proteins, between 10s to 100s kDa, will cause LWapp to scale ; τc and ω are the overall tumbling time and the Larmor frequency for a given type of nucleus. This presentation provides a facile way to evaluate any additional molecule or to identify a unique feature within a molecule, when they are compared to one another. For example, one of the mAbs included in the reference set was the NISTmAb,Citation52 a well-studied biologics reference standard. Interestingly, the NISTmAb (cyan point highlighted by the black arrow labeled by an asterisk ()) falls within a region where smaller Ab(L/F)s are located and is distinct from the other mAb molecules. This result agrees with reports of NISTmAb Rh measurement (by Dynamic Light Scattering) of 4.9 nm, which is lower than the 5.1 to 5.5 nm range for typical IgG mAbs.Citation53,Citation54 This is distinct from the Fabs that were included in the reference set (; green points). The Fabs largely cluster together indicating that, within these select molecules, they share a similar Rh. A similar trend is observed for the individual VHH domains (red points; ), but with improved separation between them as compared to direct evaluation against MW or Rh ().
Figure 3. PC3 and PC4 do not report the same correlation as compared to PC1 and PC2. PC3 and PC4 are also sensitive to the impact of interdomain interactions between multivalent VHH molecules. (a) Three multivalent VHH molecules (highlighted with arrows in the second subset) consist of the same individual VHH domains but with different linker lengths. The data point highlighted with an arrow attached to an asterisk corresponds to the NISTmAb (b) A comparison of PC3 and PC4 show a deterioration away from the correlation with Rh (Figure 1). Arrows indicate two multivalent VHH molecules whose linker lengths differ. (c) The bottom subset represents a rank-ordering of the magnitude from PC3. A general trend appears where certain classes of Ab(L/F)s can be separated by the magnitude of PC3. This may indicate that in general Fabs, multivalent VHH domains, individual VHH domains, and mAbs larger to smaller inter-domain fluctuations, respectively. However, this approach is only sensitive to dynamic fluctuations that can manifest on a timescale that can significantly impact a resonance’s linewidths. The absence of significant value to PC3 for mAbs could indicate that their fluctuations may occur on another timescale (faster than μs or longer than ms).The blue point with an asterisk is a multivalent VHH domain that has behavior similar to single VHH domains. (d-f) The sensitivity of this CA to detect differences of Test-mAb formulated under different conditions. In d-f the natural abundance spectrum of Test-mAb within a different condition (Test-mAb d-f) was added as an additional dataset and compared against the twenty original Ab(L/F) datasets. The average apparent behavior of Test-mAb formulated under different conditions can be distinguished based on a comparison of where the dataset lies with respect to the plot of PC1 and PC2
When PC1/PC2 are compared, increased scatter is observed for the multivalent VHH molecules (blue points; ). This class of Ab(L/F) can be tethered by engineered amino acid linkers, and the effect of linker composition and length with respect to solution conformation of the whole molecule remains poorly understood.Citation15,Citation18,Citation55 It is important to have tools that can isolate differences in a molecule’s valency and linker length. This can affect the presentation of the antigen-binding surface, which can affect affinity, but also introduce aberrant intermolecular interaction that could lead to aggregation or stability issues.Citation56–58 In particular, understanding the effect of linker length can be empirical and relies on orthogonal in vitro datasets that could provide degenerate results. We used this CA to differentiate different multivalent VHH constructs and their solution behavior.
Differentiation between multivalent VHH constructs with varying linker lengths
Candidate selection between two multivalent VHH molecules (; highlighted by a black arrow), that have identical domain topology, but that have linkers that vary in length is not straightforward. Linker length can modulate potential interactions between individual domains but when these interactions are absent, each domain can act independently and behave as if they were isolated in solution.Citation58,Citation59 Importantly, these dynamic events can influence peak parameters within NMR data. The large variance in the magnitude of the NMR peak parameters for multivalent VHH domains () is a strong indicator that their dynamics are complex. For multivalent VHH constructs, interdomain interactions are not desired because they can affect target binding and solution stability.Citation56 Therefore, it would be advantageous to identify multivalent VHH domains that do not cluster near their individual VHH counterparts and be able to flag them for the existence of interdomain fluctuations. In , the two molecules are labeled as short and long. Both molecules maintain identical domain topology, but the long molecule contains a four-fold longer linker as compared to the short molecule. Earlier studies (Figure S3) revealed that the short linker construct sampled states that were larger in the effective MW. This solution behavior was devoid in the longer linker construct (Figure S3), and is attributed to intermolecular interactions that restrict individual domains to tumble independently, causing it to sample configurations that are larger in apparent size. This solution-based characteristic was flagged as a risk for the short linker construct. These molecules were included in order to pressure test the sensitivity of the CA approach. Indeed, the short linker along the PC1/PC2 trajectory lies toward the right of the long linker (), recapitulating the same observation as was seen from orthogonal datasets (Figure S3). An advantage of the CA method is that the peak parameters can be sensitive to lowly populated (<10%) transiently sampled self-associated configurations that interconvert (fast kinetic transitions; microseconds-milliseconds).Citation42,Citation60 However, establishing increased confidence in the ability to differentiate these possible features with the CA method are needed. To that end, we further investigated the higher order PCs in order to evaluate if additional confidence regarding dynamic features of molecules can be differentiated.
The first four PCs accounted for 90% of all input data. Although, PC1 and PC2 are strongly correlated and report on the shape and size of different Ab(L/F)s (), we investigated if the third and fourth PCs provide additional differentiation toward solution behavior. In , PC3 and PC4 are plotted against each other and are significantly less correlated compared to PC1 and PC2. This indicates that these higher-order PCs may report on different aspects of the peak parameters that were input for this CA. Visual inspection of shows a regrouping as to how the different classes of Ab(L/F)s cluster. Fab and multidomain VHH molecules fall to the right of the plot, single domain VHH molecules cluster to decreased values and mAbs group to having no significant variance within PC3 and PC4. Since the input data are sensitive to the amplitude and timescale of motional processes, we hypothesized that the higher order PCs may reflect features that are encoded from dynamic events that add to LWapp rather than size and shape information.
We tested whether higher order PCs may reveal dynamic features by simulating different distributions of synthetic methyl relaxation rates and relative peak intensities and then processing the data through our numerical CA (see the Supplemental Figure S4). In brief, distributions of relaxation rates of 1H and 13C nuclei were randomly generated for three different classes of Ab(L/F)s including individual VHH domains, Fabs, and mAb molecules. A bimodal distribution was used to model the relaxation behavior of molecules with increased internal or interdomain dynamics. The simulation parameters we used were rudimentary and do not completely capture the intricate complexities that can modulate Ab(L/F)s (Figure S4). However, the simulation did recapitulate a critical observation that was made from the experimental data. A positive correlation between PC1 and PC2 (Figure S4; r = 0.86) from the simulated dataset was recovered and is very similar to the experimental reference datasets in . This again supports that LWapp is an appropriate metric to capture size/shape differences between Ab(L/F)s. Projection of PC3 against PC4 from the simulated data revealed plots with increased scatter for the larger Fab and mAb molecules that were modeled to maintain dynamic processes and fell to the right of the PC3/PC4 plot. The short and long linker multivalent () VHH domains are also further separated along PC3 and PC4, providing additional confidence that this protocol can discern interdomain interactions. The absence of features, within PC3 and PC4, for the molecules tested here, may indicate that dynamic events are not well sampled within their natural abundance [1H, 13C]-HMQC datasets. Interestingly, Fab molecules that were included in the reference set display significant values for PC3 and PC4 (), indicating that some dynamic process may affect these select Fabs. Ordering by decreasing magnitude of PC3 reiterates this observation, providing a way to rapidly identify differences between the different class of Ab(L/F)s (). Rank ordering highlights outliers that differ amongst a single class of Ab(L/F)s. In particular, the long chain multivalent VHH domain (; blue point with an asterisk) has diminished dynamics as compared to the shorter chain multivalent VHH constructs, which may suffer from aberrant interdomain interactions. A combination of rank ordering PC3 by magnitude and the higher order components PC3/PC4 provides increased confidence in defining solution behavior for multivalent VHH domains with differing linker lengths.
A random sampling of NMR peaks for covariance analysis is sensitive to change in formulation
Development of Ab(L/F)s requires assessments of protein behavior in a variety of different buffers. Techniques that detect changes of a molecule, under different formulated conditions are required in order to identify the best means to develop a molecule. 1D NMR-based methods have been previously used to measure changes to a mAb because of formulation.Citation31 The PROFILE method was applied to evaluate one mAb, under two unspecified conditions, and the authors reported that small changes in a correlated parameters (4%) could be discerned from 1D 1H NMR spectra. We propose that 2D NMR fingerprints processed through this approach are also sensitive to certain formulation conditions because differences in the NMR data are related to physical mechanisms that depend directly on shape/size, reorientation time or molecular dynamics (, S1; ). We evaluated three samples of a mAb (called Test-mAb) formulated under three different conditions labeled A (), B () and C (), but with the mAb concentration kept constant. Each 2D dataset was processed through this CA, compared alongside the original reference set of Ab(L/F)s, and then the PC1/PC2 trajectory was plotted. Each new dataset was added as an additional input array. Importantly, each condition did not induce any significant change to the rank of the other Ab(L/F)s across PC1 and PC2 (Figure S5). This indicates that the addition of one new molecule still preserved the PC1/PC2 trajectory, permitting quantitation of any new mAb. It is possible to add all three conditions to the input array simultaneously for the calculation, but we prefer to add one at a time because their behavior is not known a priori and comparison of the single dataset is easier. Each condition for the Test-mAb plotted in a unique position along PC1/PC2 (; enlarged black point), with conditions A to C falling in ascending order along the PC1/PC2 trajectory. This indicates that the three different conditions perturb Test-mAb in such a way that their resonance peak properties are affected to different amounts. Importantly, the magnitude of PC1/PC2 eigenvectors reported changes greater than 50% between conditions A through C. The CA approach revealed that condition A causes the Test-mAb to have an apparent behavior similar to molecules that are smaller than other mAbs, while condition C causes the Test-mAb to display characteristics comparable to the mAbs included in the reference set. It should be stressed that the conditions tested here likely stem from changes in the molecule’s overall tumbling time or changes in dynamic processes that can contribute to LWapp. We propose that this level of differentiation is an important feature because it allows a molecule’s behavior to be flagged, due to formulation. For example, if a molecule falls along an extreme of the PC1/PC2, the magnitude of the eigenvectors can be recorded for each formulation and used for comparison. Also, it could be useful to use this approach to flag molecules that have extreme deviations on PC1/PC2 from their known MWeff. This is because values that are too large (e.g., aggregation, slowed behavior) or too small (e.g., degradation) could be due to aberrant effects. This could also be accentuated by the effect of excipients that alter viscosity of the solution. Importantly, a change of multimeric or aggregated state could be identified by this approach, as that is highly sensitive to the input LWapp.
Discussion
Natural abundance NMR of Ab(L/F)s have a growing role in the qualification of different molecules.Citation30,Citation41 This approach provides the ability to monitor the behavior of Ab(L/F)s at atomic resolution, under near-native or different formulated conditions. We have demonstrated that a collection of [1H, 13C]-HMQC datasets, of different antibody and antibody-like molecules () can be directly compared. A numerical approach that uses resampling of resonance peak parameters coupled with PCA creates a common basis that projects and simplifies these datasets. An advantage is that this approach is sensitive to the molecular size, shape and dynamics of the input molecules. Random sampling of resonance peak perturbations through this CA method identified an excellent correlation along the PC1/PC2 trajectory () that is well correlated with the relative shape/size of different Ab(L/F)s (). Analysis of other PCs also revealed some sensitivity to differences to interdomain interactions between multivalent VHH molecules (). A comparison of the first four modes highlighted that this approach can flag undesired behavior in multivalent VHH constructs (). Simple simulations of LWapp qualitatively corroborated these findings (Figure S4), but further investigations are required to reveal the exact nature that define these higher order PCs. We also evaluated this method’s ability to detect changes of the same molecule formulated under different conditions (). The formulations that were tested induced significant changes in LWapp and caused the Test-mAb () to project in different locations along the PC1/PC2 trajectory. This presents an opportunity to inform on how formulation can affect Ab(L/F)s using data that is sensitive to rotational tumbling properties in solution as opposed to more traditional techniques (e.g., laser-based, UV and/or optical).
The selection of molecules that were used here establish a proof of concept on how parameters from 2D NMR datasets can be quantified across different Ab(L/F)s. However, this technique could be enhanced with a larger number of unique but qualified molecules within the reference set. The addition of molecules with different behavior will enhance the precision to which new molecules, of unknown behavior, can be mapped. A limitation of this approach is that only processes with a significant amplitude can modulate LWapp and the relative peak intensity. For example, processes like self-association, multi-domain protein fluctuations, or intrinsic large amplitude changes like slowed loop dynamics could contribute to these NMR observables, but if these processes occur on a fast timescale (<μs) or too slow (>100s ms), they will not have significant impact on the input peak parameters. We anticipate that more accurate modeling of Ab(L/F)s through coarse-grained or atomistic molecular dynamics simulations, coupled with back calculation of NMR-based observables, could reveal the sensitivity of this CA to the intrinsic dynamic properties of Ab(L/F)s.
Our method requires protein concentrations greater than 1 mg/ml for small VHH domains and greater than approximately 20 mg/ml for mAbs (Table S1), although high-quality natural abundance datasets could be recorded with the NISTmAb at only 10 mg/mL. Based on these sample requirements, this technique could have applications in late discovery/early process development, whereby it could be plugged into existing workflows or used to obtain orthogonal insight into a molecule’s behavior (Figure S6). The sensitivity to subtle differences and weak physical processes makes it attractive when chromatographic or light scattering type experiments cannot discern differences. Another advantage of NMR-based solution characterization of Ab(L/F)s is that the sample requires no modification to its environment, unlike chromatographic techniques, which subject the Ab(L/F) to a column matrix environment that can induce unwanted interactions with the matrix. This presents a unique opportunity for our approach to be applied to coformulations where resonance parameters could be monitored in bulk (all resonance peaks) or for each molecule independently (assuming a sufficient number of unique resonances are observed; see Materials and Methods). That would allow each molecule’s behavior, under a given formulation, to be compared and quantitated. Bulk NMR relaxation rates can be measured via integration of different spectral regions for an Ab(L/F)s spectrum. For molecules that exhibit uniform relaxation behavior, it is possible to draw conclusions because the rate measured is an accurate average value for the molecule. However, Ab(L/F)s are dynamic in nature and the use of a bulk relaxation rate fails to capture an accurate assessment of their molecular behavior.Citation35
Comparing multiple Ab(L/F) types to one another with this parameter alone is not trivial. 1D PROFILE and Diffusion NMR are rapid tools that can be used to obtain a general idea about sample properties (e.g., folded-ness and size),Citation31,Citation34 but the data derives from 1D information that can cause complications in analysis because of signal overlap. Here, we aimed to expand upon these efforts by taking advantage of high-quality 2D methyl spectra that are accessible for a broad range of Ab(L/F)s (). First, use of the NMR peak parameters from these datasets ensures that the input data are collected at residue-level resolution. Then, use of the CA method presented here allows a foundation to be established regarding how a quantitative comparison can be made between different 2D methyl spectra. Typically, using high-resolution NMR data for decision-making when comparing non-identical molecules or when trying to discern differences in the context of formulation has been challenging. We propose that our approach can alleviate these difficulties by providing an orthogonal platform for quantitative comparison of Ab(L/F)s that can enable decisions around the discovery and developability of these types of molecules. Novel scaffolds, including non-antibody molecules (e.g., Alphabody,Citation61 DARPin,Citation62 biased cytokinesCitation63,Citation64), are attractive options for biological signaling modulation. Understanding their behavior will require additional spectroscopic tools that can illuminate their differences as compared to more conventional scaffolds. A random sampling of NMR Peaks for covariance analysis is a tool that functions independent of scaffold. We envision that this tool can contribute to the decision-making around the discovery of molecules that may have therapeutic potential.
Materials and methods
Nuclear Magnetic Resonance Spectroscopy: All antibody and antibody-like molecules were queried with 2D SOFAST-HMQC experiments. A total of 50 complex points were used in the indirect (t1,max = 13.3 ms) with 1,024 complex points for the direct dimension (t2,max = 63.9 ms). For each point in the indirect dimension, 2,048 transients were acquired. All 2D spectra were collected at 300 K on a spectrometer operating at a Larmor frequency of 800 MHz. All NMR data were processed using the SMILE algorithm within NMRPipe.Citation47 Although, the SMILE algorithm is used for non-uniformly sampled data matrices, this approach still improves the quality of processed spectra on a fully sampled data matrix. Prior to application of the SMILE algorithm, the indirect dimension was forward predicted by a factor of two. A shifted sine-bell was applied in both the direct and indirect dimensions and spectra were zero-filled to 4k points in both dimensions. This was done to improve the detection of peak amplitudes by the auto peak picker. All of these operations were performed in the NMRPipe software suite. Data was acquired for the variety of samples (Figure S1) that maintained concentrations between 1 and 25 mg/mL. All spectra were collected on the same NMR instrument, acquisition parameters and were processed identically. For data collected across different static magnetic field strengths (e.g., 1 GHz, 800 MHz, 600 MHz) a scaling factor could be applied to facilitate their comparison. However, we suggest that data be collected across the same static magnetic field strength. Small differences in base frequency will not translate to significant differences in LWapp and will not impede application of this CA method. Acquisition parameters like the total number of points in the direct dimension and processing parameters should be preserved. Intensities were normalized when each spectrum was initially peak picked, therefore small variations in the number of transients per point collected will not affect downstream analysis. Resonances were picked from within the 2D NMR datasets using an automated picking protocol that used signal-to-noise ratio constraints in order to distinguish resonances from spurious noise or buffer peaks. Peaks were required to be at least two times the baseline noise of the spectrum. A constant spectral window that spans the methyl region typical for proteins samples was used for all spectra analysis. For each spectrum, the peaks were picked within a spectral range of −0.5 to 1.9 ppm (8 ppm to 31 ppm) for the 1H (13C) dimensions. For each peak that was detected within a given spectrum, the LWapp in both 1H and 13C dimensions and the relative peak amplitude (Ipeak/Imax; where Imax denotes the peak within the spectral window with the largest peak amplitude) were kept for input into the resampled PCA protocol. Peaks arising from buffer components that overlapped within the constant spectral window were manually inspected and removed from the respective spectrum’s final peak list.
Computational Analysis: The calculation of PCs used a random subset of 60 peaks per calculation. The input arrays contained the 1H, 13C linewidths and relative intensities for the 60 peaks. Note that even for the lowest MW Ab(L/F)s used here (individual VHH domains), at least 50 methyl resonances alone are expected. This means that some methylene peaks may have been detected within this spectral window. The total number of peaks per spectrum that were chosen at random was determined from the Ab(L/F)s spectrum with the least number of resonances (individual VHH). The number of peaks selected per iteration was set to approximately 70% the total number of observable resonances. We also evaluated if reducing the number of peaks, selected at random, would affect the results derived from the calculation. We evaluated a range of peak subset selections from 30% to 70%. Even reducing the minimum subset to 30% of the observable resonances was well correlated with the selection set at 70% (PC1; r = 0.99, PC2; r = 0.8, PC3; r = 0.77, PC4; r = 0.86). A key component of the calculation is ensuring that a sufficient number of selections is made in order to minimize the effect of individual outlier LWapp values. For each collection of NMR spectra, PCs were calculated over 10,000 resampled input peak lists. Although, the relaxation behavior of methylene groups is different from methyl groups, we found that a small number of these methylene resonances have small significance during the calculation as the peak selection is repeated many times and is random. Therefore, the effect is averaged out within the distribution of eigenvectors that are solved during the resampling of PCs.
Individual methyl resonances can overlap in larger Fab and mAb molecules. Here, we choose to keep possibly overlapped peaks in the calculation in order maximize the number of possible input peak parameters. When the overlap is very severe (>2–3 methyl resonances), an overlapped peak can give an exaggerated LWapp and can generate an outlier LWapp. We found that resampling the data 10,000 times was sufficient to remove their impact on the distribution of extracted eigenvectors. The first four PCs captured approximately 90% of all the input data (Figure S2) and the magnitude of the eigenvalues were well preserved throughout all iterations of the calculation. The distribution of eigenvectors from each sample and for each PC is fitted to a gaussian function (Figure S6). This value is used for the variance of that sample within that PC. Here, we are concerned with the magnitude of the eigenvectors and not their eigenvalues. During the PCA calculation, the covariance matrix is maximized. The output eigenvectors from each individual PCA calculation can have altered signs depending on the iteration of the calculation. However, the sign only induces a change in the direction, which is arbitrary for our purposes here, as we are interested in the variance, which stays the same (i.e., the magnitude of the eigenvectors is preserved). Therefore, here only the absolute value of the eigenvectors was retained for further analysis. All calculations were performed with in-house written Python scripts that use the Numpy/Scipy libraries. A copy of the source code for “Random Sampling of NMR Peaks for Covariance Analysis” is available in the Supporting Information.
The test set of Ab(L/F)s molecules was probed by DOSY/Diffusion NMR following previously published protocols.Citation34 Diffusion NMR was used to determine the translational diffusion coefficient (Dt) for a given molecule. Diffusion NMR experiments were conducted using conventional pseudo 2D Pulse Field Gradient (PFG) filtered 1Ds where the gradient amplitude was varied from 5% to 95% of the maximum value tolerated by the probe and a total of 32 different gradient amplitudes were collected per sample. The delay between recovery gradients was set to 300 ms where each gradient was applied for 1.5 ms. The maximum gradient amplitude was set to 58.9 G⋅cm−1. Each 1D was adopized using a shifted sine-bell and zero-filled prior to Fourier transform.
The Diffusion NMR spectrum was subsequently Laplacian transformed, using the processing protocol in Bruker TopSpin®. The translational diffusion coefficient was determined by plotting all diffusion values across the 1D spectrum and fitting the values to a Gaussian distribution. The average was taken as the translational diffusion coefficient. An offset between the measured translational diffusion coefficients and the real translational diffusion coefficients can exist. This offset was corrected for by measuring a set of standard molecules, with known diffusion coefficients/Rh, plotting them against one another and fitting to a straight line (slope set to 1). An offset of −0.167 [log10(Dt)] was determined and applied to the measured diffusion coefficients. This corrected value was then used to back calculate Rh using the Stokes-Einstein equation. Viscosity was assumed to be constant for all samples studied here. This assumes that the molecule is spherical and was applied uniformly across all Ab(L/F)s studied here. This is a simplified view as different topologies may require shape-specific models. Future incorporation of computational models that describe hydrodynamic properties, from structure, could improve the correlations observed in . All diffusion experiments were conducted at the same temperature that the 2D datasets were collected.
Abbreviation
Supplemental Material
Download MS Word (2 MB)Acknowledgments
The authors would like to acknowledge colleagues across Computational and Structural Sciences, Discovery Biologics, Bioprocess, Protein Sciences and Daniel Wyss, Mikhail Reibarkh, David Roush and Juan Alvarez for critical reading of the manuscript.
Disclosure statement
The authors report no conflict of interest.
Supplementary material
Supplemental data for this article can be accessed on the publisher’s website
References
- Lu RM, Hwang YC, Liu IJ, et al. Development of therapeutic antibodies for the treatment of diseases. J Biomed Sci. 2020;27:1. doi:10.1186/s12929-019-0592-z.
- Ecker DM, Jones SD, Levine HL. The therapeutic monoclonal antibody market. MAbs. 2015;7:9–12. doi:10.4161/19420862.2015.989042.
- Mullard A. FDA approves 100th monoclonal antibody product. Nat Rev Drug Disc. 2021;20:491–95. doi:10.1038/d41573.021.0007907.
- Jay JW, Bray B, Qi Y, et al. IgG antibody 3D structures and dynamics. Antibodies. 2018;7. doi:10.3390/antib7020018.
- Yu XQ, Robbie GJ, Wu Y, et al. Safety, tolerability, and pharmacokinetics of MEDI4893, an investigational, extended-half-life, anti-staphylococcus aureus alpha-toxin human monoclonal antibody, in healthy adults. Antimicrob Agents Chemother. 2017;61. doi:10.1128/AAC.01020-16.
- de Jong RN, Beurskens FJ, Verploegen S, et al. A novel platform for the potentiation of therapeutic antibodies based on antigen-dependent formation of IgG hexamers at the cell surface. PLoS Biol. 2016;14:e1002344. doi:10.1371/journal.pbio.1002344.
- Arduin E, Arora S, Bamert PR, Kuiper T, Popp S, Geisse S, Grau R, Calzascia T, Zenke G, Kovarik J, et al. Highly reduced binding to high and low affinity mouse Fc gamma receptors by L234A/L235A and N297A Fc mutations engineered into mouse IgG2a. Mol Immunol. 2015;63(2):456–63. doi:10.1016/j.molimm.2014.09.017.
- Saunders KO. Conceptual approaches to modulating antibody effector functions and circulation half-life. Front Immunol. 2019;10:1296. doi:10.3389/fimmu.2019.01296.
- Chapman AP. PEGylated antibodies and antibody fragments for improved therapy: a review. Adv Drug Deliv Rev. 2002;54(4):531–45. doi:10.1016/S0169-409X(02)00026-1.
- Kariolis MS, Wells RC, Getz JA, Kwan W, Mahon CS, Tong R, Kim DJ, Srivastava A, Bedard C, Henne KR, et al. Brain delivery of therapeutic proteins using an Fc fragment blood-brain barrier transport vehicle in mice and monkeys. Science Trans Med. 2020;12:eaay1359. doi:10.1126/scitranslmed.aay1359.
- Wang X, Mathieu M, Brezski RJ. IgG Fc engineering to modulate antibody effector functions. Protein Cell. 2018;9:63–73. doi:10.1007/s13238-017-0473-8.
- Bannas P, Hambach J, Nanobodies K-NF. Nanobody-based human heavy chain antibodies as antitumor therapeutics. Front Immunol. 2017;8:1603. doi:10.3389/fimmu.2017.01603.
- Keyt BA, Baliga R, Sinclair AM, et al. Structure, function, and therapeutic use of IgM antibodies. Antibodies. 2020;9. doi:10.3390/antib9040053.
- Hultberg A, Temperton NJ, Rosseels V, Koenders M, Gonzalez-Pajuelo M, Schepens B, Ibañez LI, Vanlandschoot P, Schillemans J, Saunders M, et al. Llama-derived single domain antibodies to build multivalent, superpotent and broadened neutralizing anti-viral molecules. PLoS One. 2011;6(4):e17665. doi:10.1371/journal.pone.0017665.
- Khongorzul P, Ling CJ, Khan FU, Ihsan AU, Zhang J; Khongorzul P, Ling CJ, Khan FU, et al. Antibody-Drug Conjugates: a Comprehensive review. Mol Cancer Res. 2020;1:3–19. doi:10.1158/1541-7786.MCR-19-0582.
- Lambert JM, Morris CQ. Antibody-drug conjugates (ADCs) for personalized treatment of solid tumors: a review. Adv Ther. 2017;34:1015–35. doi:10.1007/s12325-017-0519-6.
- Jain M, Kamal N, Batra SK. Engineering antibodies for clinical applications. Trends Biotechnol. 2007;25:307–16. doi:10.1016/j.tibtech.2007.05.001.
- Vazquez-Lombardi R, Phan TG, Zimmermann C, Lowe D, Jermutus L, Christ D. Challenges and opportunities for non-antibody scaffold drugs. Drug Discov Today. 2015;20(10):1271–83. doi:10.1016/j.drudis.2015.09.004.
- Chennamsetty N, Voynov V, Kayser V, Helk B, Trout BL. Design of therapeutic proteins with enhanced stability. Proc Natl Acad Sci U S A. 2009;106(29):11937–42. doi:10.1073/pnas.0904191106.
- Jain T, Sun T, Durand S, Hall A, Houston NR, Nett JH, Sharkey B, Bobrowicz B, Caffry I, Yu Y, et al. Biophysical properties of the clinical-stage antibody landscape. Proc Natl Acad Sci U S A. 2017;114(5):944–49. doi:10.1073/pnas.1616408114.
- Geng SB, Wittekind M, Vigil A, Tessier PM. Measurements of monoclonal antibody self-association are correlated with complex biophysical properties. Mol Pharm. 2016;13(5):1636–45. doi:10.1021/acs.molpharmaceut.6b00071.
- Gentiluomo L, Svilenov HL, Augustijn D, et al. Advancing therapeutic protein discovery and development through comprehensive computational and biophysical characterization. Mol Pharm. 2020;17:426–40. doi:10.1021/acs.molpharmaceut.9b00852.
- Bailly M, Mieczkowski C, Juan V, Metwally E, Tomazela D, Baker J, Uchida M, Kofman E, Raoufi F, Motlagh S, et al. Predicting antibody developability profiles through early stage discovery screening. MAbs. 2020;12(1):1743053. doi:10.1080/19420862.2020.1743053.
- Carpenter JF, Randolph TW, Jiskoot W, Crommelin DJA, Russell Middaugh C, Winter G, Fan Y-X, Kirshner S, Verthelyi D, Kozlowski S, et al. Overlooking subvisible particles in therapeutic protein products: gaps that may compromise product quality. J Pharm Sci. 2009;98(4):1201–05. doi:10.1002/jps.21530.
- Pekar L, Busch M, Valldorf B, Hinz SC, Toleikis L, Krah S, Zielonka S. Biophysical and biochemical characterization of a VHH-based IgG-like bi- and trispecific antibody platform. MAbs. 2020;12(1):1812210. doi:10.1080/19420862.2020.1812210.
- Zhang H, Cui W, Gross ML. Mass spectrometry for the biophysical characterization of therapeutic monoclonal antibodies. FEBS Lett. 2014;588(2):308–17. doi:10.1016/j.febslet.2013.11.027.
- He Y, Lacher NA, Hou W, Wang Q, Isele C, Starkey J, Ruesch M. Analysis of identity, charge variants, and disulfide isomers of monoclonal antibodies with capillary zone electrophoresis in an uncoated capillary column. Anal Chem. 2010;82(8):3222–30. doi:10.1021/ac9028856.
- Nobbmann U, Connah M, Fish B, Varley P, Gee C, Mulot S, Chen J, Zhou L, Lu Y, Sheng F, et al. Dynamic light scattering as a relative tool for assessing the molecular integrity and stability of monoclonal antibodies. Biotechnol Genet Eng Rev. 2007;24(1):117–28. doi:10.1080/02648725.2007.10648095.
- Lang BE, Cole KD. Differential scanning calorimetry and fluorimetry measurements of monoclonal antibodies and reference proteins: effect of scanning rate and dye selection. Biotechnol Prog. 2017;33(3):677–86. doi:10.1002/btpr.2464.
- Arbogast LW, Brinson RG, Marino JP. Mapping monoclonal antibody structure by 2D 13C NMR at natural abundance. Anal Chem. 2015;87:3556–61. doi:10.1021/ac504804m.
- Poppe L, Jordan JB, Lawson K, Jerums M, Apostol I, Schnier PD. Profiling Formulated monoclonal antibodies by1 H NMR spectroscopy. Anal Chem. 2013;85:9623–29. doi:10.1021/ac401867f.
- Palmer AG. 3rd. NMR Characterization of the Dynamics of Biomacromolecules Chem Rev. 2004;104:3623–40. doi:10.1021/cr030413t.
- Poppe L, Jordan JB, Rogers G, Schnier PD. On the analytical superiority of 1d nmr for fingerprinting the higher order structure of protein therapeutics compared to multidimensional NMR methods. Anal Chem. 2015;87(11):5539–45. doi:10.1021/acs.analchem.5b00950.
- Falk BT, Liang Y, McCoy MA. Diffusion profiling of therapeutic proteins by using solution NMR spectroscopy. Chembiochem. 2019;20:896–99. doi:10.1002/cbic.201800631.
- Falk BT, Liang Y, Bailly M, Raoufi F, Kekec A, Pissarnitski D, Feng D, Yan L, Lin S, Fayadat‐Dilman L, et al. NMR assessment of therapeutic peptides and proteins: correlations that reveal interactions and motions. Chembiochem. 2020;21(3):315–19. doi:10.1002/cbic.201900296.
- Arbogast LW, Brinson RG, Formolo T, Hoopes JT, Marino JP. 2D 1HN, 15N correlated NMR methods at natural abundance for obtaining structural maps and statistical comparability of monoclonal antibodies. Pharm Res. 2016;33(2):462–75. doi:10.1007/s11095-015-1802-3.
- Hodgson DJ, Ghasriani H, Aubin Y. Assessment of the higher order structure of Humira®, Remicade®, Avastin®, Rituxan®, Herceptin®, and Enbrel® by 2D-NMR fingerprinting. J Pharm Biomed Anal. 2019;163:144–52. doi:10.1016/j.jpba.2018.09.056.
- Brinson RG, Arbogast LW, Marino JP, Delaglio F. Best practices in utilization of 2D-NMR spectral data as the input for chemometric analysis in biopharmaceutical applications. J Chem Inf Model. 2020;60(4):2339–55. doi:10.1021/acs.jcim.0c00081.
- Elliott KW, Ghasriani H, Wikstrom M, Giddens JP, Aubin Y, Delaglio F, Marino JP, Arbogast LW. Comparative analysis of one-dimensional protein fingerprint by line shape enhancement and two-dimensional1 H, 13C methyl NMR methods for characterization of the higher order structure of IgG1 monoclonal antibodies. Anal Chem. 2020;92:6366–73. doi:10.1021/acs.analchem.9b05385.
- Brinson RG, Marino JP, Delaglio F, Arbogast LW, Evans RM, Kearsley A, Gingras G, Ghasriani H, Aubin Y, Pierens GK, et al. Enabling adoption of 2D-NMR for the higher order structure assessment of monoclonal antibody therapeutics. MAbs. 2019;11(1):94–105. doi:10.1080/19420862.2018.1544454.
- Arbogast LW, Delaglio F, Schiel JE, Marino JP. Multivariate analysis of two-dimensional1 H,13 C methyl NMR spectra of monoclonal antibody therapeutics to facilitate assessment of higher order structure. Anal Chem. 2017;89:11839–45. doi:10.1021/acs.analchem.7b03571.
- Jee J, Ishima R, Gronenborn AM. Characterization of specific protein association by 15N CPMG relaxation dispersion NMR: the GB1(A34F) monomer-dimer equilibrium. J Phys Chem B. 2008;112:6008–12. doi:10.1021/jp076094h.
- Ban D, Funk M, Gulich R, Egger D, Sabo TM, Walter KFA, Fenwick RB, Giller K, Pichierri F, de Groot BL, et al. Kinetics of conformational sampling in ubiquitin. Angew Chem Int Ed Engl. 2011;50(48):11437–40. doi:10.1002/anie.201105086.
- Ban D, Smith CA, de Groot BL, Griesinger C, Lee D. Recent advances in measuring the kinetics of biomolecules by NMR relaxation dispersion spectroscopy. Arch Biochem Biophys. 2017;628:81–91. doi:10.1016/j.abb.2017.05.016.
- Casagrande F, Degardin K, Protein RA. NMR of biologicals: analytical support for development and marketed products. J Biomol NMR. 2020;74:657–71. doi:10.1007/s10858-020-00318-w.
- Greenwood AI, Rogals MJ, De S, et al. Complete determination of the Pin1 catalytic domain thermodynamic cycle by NMR lineshape analysis. J Biomol NMR. 2011;51:21–34. doi:10.1007/s10858-011-9538-9.
- Ying J, Delaglio F, Torchia DA, Bax A. Sparse multidimensional iterative lineshape-enhanced (SMILE) reconstruction of both non-uniformly sampled and conventional NMR data. J Biomol NMR. 2017;68:101–18. doi:10.1007/s10858-016-0072-7.
- Lever J, Krzywinski M, Altman N. Principal component analysis. Nat Methods. 2017;14:641–42. doi:10.1038/nmeth.4346.
- Stein SAM, Loccisano AE, Firestine SM, Evanseck JD. Chapter 13 principal components analysis: a review of its application on molecular dynamics data. Annu Rep Comput Chem. 2006;2:233–61.
- Tzeng D-Y, Berns RS. A review of principal component analysis and its applications to color technology. Color Res Appl. 2005;30:84–98. doi:10.1002/col.20086.
- Arai M, Ferreon JC, Wright PE. Quantitative analysis of multisite protein-ligand interactions by NMR: binding of intrinsically disordered p53 transactivation subdomains with the TAZ2 domain of CBP. J Am Chem Soc. 2012;134:3792–803. doi:10.1021/ja209936u.
- Schiel JE, Turner A, Mouchahoir T, Yandrofski K, Telikepalli S, King J, DeRose P, Ripple D, Phinney K. The NISTmAb reference material 8671 value assignment, homogeneity, and stability. Anal Bioanal Chem. 2018;410(8):2127–39. doi:10.1007/s00216-017-0800-1.
- Zhao H, Graf O, Milovic N, Luan X, Bluemel M, Smolny M, Forrer K. Formulation development of antibodies using robotic system and high-throughput laboratory (HTL). J Pharm Sci. 2010;99(5):2279–94. doi:10.1002/jps.22008.
- Turner A, Yandrofski K, Telikepalli S, King J, Heckert A, Filliben J, Ripple D, Schiel JE. Development of orthogonal NISTmAb size heterogeneity control methods. Anal Bioanal Chem. 2018;410(8):2095–110. doi:10.1007/s00216-017-0819-3.
- Beirnaert E, Desmyter A, Spinelli S, Lauwereys M, Aarden L, Dreier T, Loris R, Silence K, Pollet C, Cambillau C, et al. Bivalent llama single-domain antibody fragments against tumor necrosis factor have picomolar potencies due to intramolecular interactions. Front Immunol. 2017;8:867. doi:10.3389/fimmu.2017.00867.
- Gordley RM, Bugaj LJ, Lim WA. Modular engineering of cellular signaling proteins and networks. Curr Opin Struct Biol. 2016;39:106–14. doi:10.1016/j.sbi.2016.06.012.
- Errington WJ, Bruncsics B, Sarkar CA. Mechanisms of noncanonical binding dynamics in multivalent protein-protein interactions. Proc Natl Acad Sci U S A. 2019;116:25659–67. doi:10.1073/pnas.1902909116.
- Tang C, Iwahara J, Clore GM. Visualization of transient encounter complexes in protein-protein association. Nature. 2006;444:383–86. doi:10.1038/nature05201.
- Walsh JD, Meier K, Ishima R, Gronenborn AM. NMR studies on domain diffusion and alignment in modular GB1 repeats. Biophys J. 2010;99(8):2636–46. doi:10.1016/j.bpj.2010.08.036.
- Bruschweiler R, Liao X, Wright PE. Long-range motional restrictions in a multidomain zinc-finger protein from anisotropic tumbling. Science. 1995;268(5212):886–89. doi:10.1126/science.7754375.
- Desmet J, Verstraete K, Bloch Y, Lorent E, Wen Y, Devreese B, Vandenbroucke K, Loverix S, Hettmann T, Deroo S, et al. Structural basis of IL-23 antagonism by an Alphabody protein scaffold. Nat Commun. 2014;5(1):5237. doi:10.1038/ncomms6237.
- Stumpp MT, Binz HK, Amstutz P. DARPins: a new generation of protein therapeutics. Drug Discov Today. 2008;13:695–701. doi:10.1016/j.drudis.2008.04.013.
- Bentebibel SE, Hurwitz ME, Bernatchez C, et al. A first-in-human study and biomarker analysis of NKTR-214, a novel IL2Rbetagamma-biased cytokine, in patients with advanced or metastatic solid tumors. Cancer Discov. 2019;9:711–21. doi:10.1158/2159-8290.CD-18-1495.
- Lopes JE, Fisher JL, Flick HL, et al. ALKS 4230: a novel engineered IL-2 fusion protein with an improved cellular selectivity profile for cancer immunotherapy. J Immunother Cancer. 2020;8. doi:10.1136/jitc-2020-000673.