
 ?Mathematical formulae have been encoded as MathML and are displayed in this HTML version using MathJax in order to improve their display. Uncheck the box to turn MathJax off. This feature requires Javascript. Click on a formula to zoom.
ABSTRACT
Antibodies and Fc fusion proteins are a rapidly growing class of pharmaceuticals. Cell culture and purification process development and operation require frequent measurement of product concentrations, commonly by complex enzyme-linked immunosorbent assay and high-performance liquid chromatography methods. Here we report a fast (<30 s), and simple antibody Fc assay based on mix-and-read reporting by fluorescence emission. A soluble fluorescein-labeled Fc-affinity reporter produced by standard peptide synthesis is mixed with an Fc-containing sample to produce an immediate shift in both fluorescence polarization and intensity, compatible with on- and at-line measurements and microbioreactor monitoring. We observed significant shifts in fluorescence intensity in Chinese hamster ovary cell culture fluid spiked with IgG and detected an adalimumab biosimilar down to 100 ng/mL (10–4 g/L), despite the interferents in the complex sample matrix. Neither the fluorescence polarization nor the fluorescence intensity assay is significantly affected by the addition of clarified lysate of 2 million CHO-k1 cells/mL, suggesting applicability even to cultures of low viability. Biochemical and molecular docking approaches suggest that the fluorescence intensity enhancement is caused by changes in the fluorophore’s local microenvironment upon binding to IgG Fc, especially by interactions with Fc His433.
Abbreviations: CCF: Cell Culture Fluid; CHO: Chinese Hamster Ovary cells; ELISA: Enzyme Linked Immunosorbent Assay; Fc: Fragment Crystallizable of antibody; HPLC: High-Performance Liquid Chromatography; HPβCD: hydroxypropyl-β-cyclodextrin; IgG: ImmunoglobulinG; mAb: Monoclonal Antibody; PBS: Phosphate-Buffered Saline; PDB: Protein Data Bank; SpA: Staphylococcal protein A; SpG: Staphylococcal protein G.
Introduction
Currently, 67 US FDA-approved monoclonal antibody (mAb) therapeutics represent ca. 60% of the total biopharmaceutical market.Citation1,Citation2 These complex biomolecules are challenging to produce at large scale, requiring elaborate process development. Antibody concentrations in culture fluid and process intermediates are most commonly measured by methods based on surface capture, such as enzyme linked immunosorbent assay (ELISA), high-performance liquid chromatography (HPLC), surface plasmon resonance and biolayer interferometry.Citation3 These methods often require substantial method development and elaborate equipment, and have limitations of turnaround time, throughput, and/or ease of use. High-throughput approaches are increasingly used in mAb clone selection, cell culture optimization, and purification process development to reduce time to clinic, and rapid analytical methods are required to keep pace with the dynamic requirements of the bioprocessing environment. A simple, fast, mix-and-read assay based on simple instrumentation and reagents could therefore simplify and speed antibody process development.
Here we introduce a simple, rapid antibody assay based on homogenous, separation-free reporting of antibody crystallizable fragment (Fc) concentrations by fluorescence emission. Fluorescence-based homogenous detection methods report a target binding-induced change in the size of a protein-ligand complex (fluorescence polarization) or a change in fluorescence emission lifetime or intensity.Citation4–8 Fluorescence-based methods are extensively used to characterize protein-protein and protein-ligand interactions.Citation9–14 Recently, we showed the applicability of fluorescence-based methods in near real-time detection of antibodies in chromatographic separations.Citation15
Here, we use a novel antibody-specific fluorescent affinity ligand to rapidly (<30 seconds) and quantitatively detect antibodies without separation. All aspects of the approach are parallelizable and automatable, and compatible with typical bioprocess development workflows. We also demonstrate its resistance to interference by complex sample matrices such as cell culture fluid. Finally, we use biochemical and molecular modeling approaches to investigate the structural basis of the observed response to Fc.
Results
Affinity probes for IgG
The candidate fluorescent IgG reporters Fc-III (2 kDa), protein G (SpG, 21.6 kDa) and peptide-H (1.3 kDa) were evaluated by measuring the change in fluorescence polarization or intensity of the probe (50 nM) as human IgG concentration was varied from 0 to 2.5 g/L (). At low IgG concentrations, unbound probes rotate rapidly in solution and randomize orientation while in the excited state, emitting with low polarization. At higher IgG concentrations the probes bind to IgG, and the probe-IgG complex (>150 kDa) rotates slowly in solution, leading to polarized emission. As expected, the fluorescence polarization values of all probes increased with IgG concentration (). The Fc-III probe showed the highest polarization dynamic range, with a 260 mP difference between bound and free probe (Δ mP). The dynamic range for SpG was 75 mP; peptide-H did not reach saturation at the highest IgG concentration offered (2.5 g/L), though an increase of 11 mP was seen. The lowest IgG concentration required to produce half-maximal response for Fc-III, SpG and peptide-H was 0.001 g/L, 0.005 g/L and 1 g/L, respectively. Although Fc-III and SpG have been reported to have comparable binding affinity for IgG,16 Fc-III gave a 3.5-fold larger polarization dynamic range when compared to SpG, presumably because of its low molecular weight. Notably, substantial changes in polarization were observed down to 1–10 mg/L IgG, suggesting excellent limit of detection.
Figure 1. Change in fluorescence polarization (a) and intensity (b) of affinity probes FC-III (red square), protein G (green triangle) and peptide-H (magenta inverted triangle) as a function of increasing IgG concentration. Error bars indicate standard deviation around the mean and are often smaller than the symbol. The solid black lines for Fc-III and protein G are a 4-parameter logistic fit. The normalized intensity is the fold change calculated by dividing the intensity by intensity of the probe alone (without IgG)
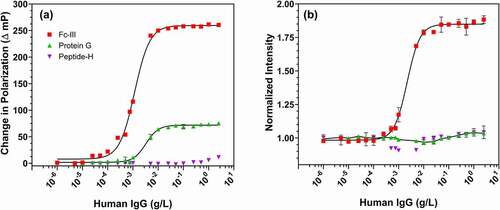
Unexpectedly, labeled Fc-III fluorescence intensity increased strongly with increasing IgG concentration. As shown in , Fc-III fluorescence intensity increased ca. 1.9-fold between 0 and 2.5 g/L IgG, with most of the increase occurring below 10 mg/L IgG. The fluorescence intensities of SpG and peptide-H, by contrast, increased by less than 5% even at 2.5 g/L IgG. IgG binding-induced fluorescence enhancement for fluorescein-labeled protein A (SpA) has previously been reported.Citation16,Citation17 Each SpA molecule contains 60 lysine residues, making site-specific labeling of SpA using amine-reactive fluorescent dyes challenging. Small, synthetic peptides like Fc-III offer chemical homogeneity, site-specific labeling, scalability and reliability of supply, and potentially cost advantages.
To confirm the specificity of the Fc-III-IgG interaction, we evaluated the effect of competing SpA (which binds to the same location on Fc as Fc-III) on the change in fluorescence intensity of Fc-III/IgG mixtures. shows that the emission intensity of a mixture of IgG (0.005 g/L; 30 nM) and Fc-III probe (0.0001 g/L; 50 nM) is markedly diminished by the presence of unlabeled SpA. With 500 nM SpA, the fluorescence intensity of the Fc-III/IgG mixture fell to that of free Fc-III probe (50 nM). These results indicate that the observed intensity enhancement results from specific interactions between IgG and Fc-III.
Figure 2. (a) Competitor SpA reduces fluorescence intensity of IgG-Fc reporter mixtures. Serial dilutions of unlabeled SpA were prepared in PBS buffer. A mixture of human-IgG (33 nM, 0.005 g/L) and Fc-III probe (50 nM, 0.00001 g/L) was mixed with competitor SpA at final concentrations from 0.02 nM to 1 µM followed by measurement of fluorescence intensity. The average fluorescence intensity in absence of competitors is indicated by dashed line. The solid line indicates intensity measurements with the unlabeled competitor, SpA. (b) Increased fluorescence intensity of Fc-III probe with increasing concentrations of HP-β-cyclodextrin
The sensitivity of fluorescein emission to perturbations in the local environment is well documented.Citation18–21 It is possible that the fluorescence intensity enhancement we observed could result from relocation of the fluorophore into a relatively hydrophobic environment upon binding. To investigate this, we evaluated the effect of an inclusion agent, hydroxypropyl-β-cyclodextrin (HPβCD),Citation22–26 which presents a hydrophobic cavity surrounded by hydrophilic surface.26 For the Fc-III probe (50 nM), the addition of HPβCD resulted in a 2.1-fold increase in fluorescence intensity (), a value comparable to the 1.8-fold increase observed during the Fc-III/IgG interaction. Such cyclodextrin-induced fluorescence enhancement of fluorescein has been reported previously 27 and suggests the involvement of the fluorescein label in the binding interactions.
Molecular docking analysis
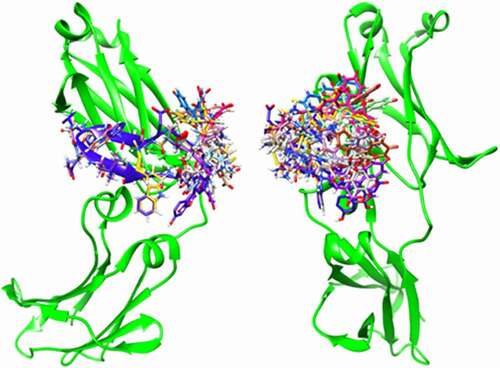
AutoDock Vina and Schrödinger Glide were used together for more reliable prediction of the mode of binding of the Fc-III probe to IgG-Fc. The docking score and the binding interactions of the docked poses were used to select biologically reasonable binding poses. The AutoDock Vina results predict that the Fc-III peptide moiety of the fluorescein-labeled Fc-III binds to the same portion of the IgG as seen in the peptide-Fc complex crystal structure, with an root-mean-square deviation of about 1 Å. Due to the flexibility of the linker, there are multiple predicted binding orientations of the fluorescein ().
Figure 3. Ensemble of AutoDock Vina-predicted positions of fluorescein-labeled Fc-III bound to IgG-Fc (Left: front view; Right: side view)
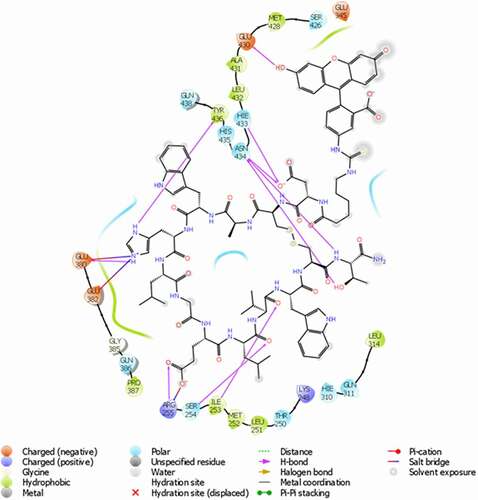
The specific interactions in the two top-ranked Schrödinger Glide docking predictions of the labeled Fc-III/IgG-Fc complex are shown in . The interactions between the Fc-III peptide and the IgG-Fc are similar to those seen in the crystal structure.Citation27 Several hydrogen bonds are formed between the Fc-III peptide and IgG-Fc residues Ile253, Ser254, Arg255, Glu380, His433, Asn434 and Tyr436, while Arg255, Glu380 and Glu382 form three salt bridges with the ligand. The interaction of the fluorescein with amino acid residues on IgG is primarily driven by the affinity between Fc-III and IgG-Fc. Residues Glu430 and Leu432 form two hydrogen bonds with the fluorescein structure. Pi-Pi stacking was also found for residue His433 with the xanthene moiety of fluorescein. The surrounding hydrophobic residues form hydrophobic interactions with the ligand. The specific interactions of the fluorescein with IgG-Fc residues may affect the fluorescence polarization, and especially intensity. In addition, in the free fluorescein-labeled Fc-III probe, the proximity of the adjacent tryptophan residue to the fluorescein could reportedly induce quenching.Citation28,Citation29 Given the flexible (aminohexanoic acid) linker between fluorescein and the N-terminus of Fc-III, Fc-III/IgG binding may involve reorientation of the fluorophore away from tryptophan. Interestingly, the IgG-binding domains of SpA are devoid of tryptophan,Citation30 yet the fluorescein labeled SpA shows similar changes in fluorescence intensity as reported here upon binding to IgG,Citation16,Citation17,Citation31 suggesting a limited role of tryptophan-induced quenching. The competition and molecular docking studies substantiate the involvement of the fluorophore in the binding interactions. In addition, the Fc-III and HPβCD, experiments provide evidence of the hydrophobicity-dependent change in fluorescence intensity.
Figure 4. Intermolecular interactions in the highest-ranked Schrödinger Glide prediction of binding of fluorescein-labeled Fc-III to IgG-Fc
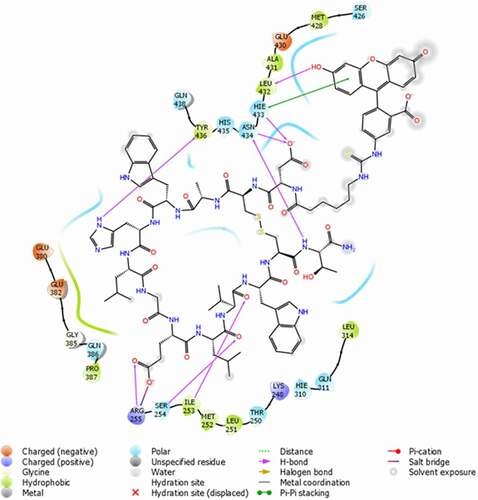
Figure 5. Intermolecular interactions in the second-highest-ranked Schrödinger Glide prediction of binding of fluorescein-labeled Fc-III to IgG-Fc
Assay performance
The effect of Fc-III probe concentration on IgG detection limit was evaluated (). As shown in , Fc-III probe concentrations of 25 nM – 500 nM gave similar fluorescence polarization changes from 0 to 2.5 g/L IgG, with the half-response IgG concentrations varying from 0.0005 to 0.01 g/L depending on probe concentration (Fig. S1). shows fluorescence intensity responses for peptide concentrations of 25 nM to 500 nM. At 25 nM Fc-III, the lowest concentration of IgG (0.00025 g/L) showed a 1.16-fold increase in fluorescence intensity, while 0.005 g/L IgG was required to show an equivalent fold increase for 500 nM Fc-III probe. Notably it can be observed that the dynamic range for the IgG-assay is 50 times wider, 0.0001 to 2.5 g/L, at 25 nM of probe.
Figure 6. Fluorescence polarization (a) and intensity responses (b) for different concentrations of Fc-III probe (25–500 nM) to IgG of varying concentrations (0–2.5 g/L). (c) Quantitation of low (10-4-10-3 g/L; top x-axis) and high (0.025–0.1 g/L; bottom x-axis) IgG concentrations with 50 nM (triangle; top axis), and 2000 nM (square; bottom axis) fluorescein labeled Fc-III
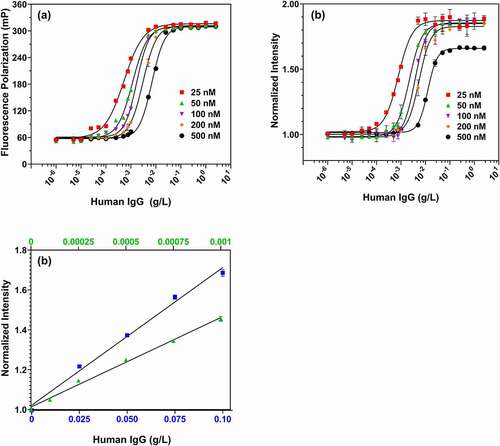
Such reporter concentration optimization is commonly used during immunoassay development and calibration.Citation32–34 The linear quantitation range of the assay can be adjusted by changing probe concentration, suggesting it could be adapted to a range of applications ranging from clone selection to process development and process analytical technology. As shown in , 50 nM Fc-III gave a linear response to IgG concentrations of 0.0001 g/L to 0.001 g/L, while at 2000 nM Fc-III the linear range of the assay shifted to 0.01 g/L – 0.1 g/L.
IgG detection in cell culture fluid
The Fc-III IgG assay was tested in realistic bioprocess samples to identify any sample matrix effects. Cell culture fluid (CCF) from the null Chinese hamster ovary (CHO)-S cell line served as a complex, realistic sample matrix.Citation35–37 CHO-CCF contains over 6,000 impurities, including host cell proteins, nucleic acids, and lipids, originating from the media and from cell secretion and lysis during normal cell death and shear stress during harvest.Citation38,Citation39 The background fluorescence of the CHO-CCF used in this study was comparable to 25 nM of Fc-III probe. The use of a higher Fc-III probe concentration (100 nM) was sufficient to overcome background fluorescence from the CHO-CCF. The resultant fluorescence intensity of the free Fc-III probe at 100 nM in CHO-CCF was about three times the background fluorescence signal. As shown in , 100 nM Fc-III probe showed nearly identical fluorescence polarization changes for polyclonal human IgG and adalimumab biosimilar in CCF. In this case, an IgG concentration of 0.00075 to 0.001 g/L was required for half-maximal polarization response, and the fluorescence intensity of Fc-III probe increased by ~1.8-fold with 2.5 g/L adalimumab (IgG1 mAb) and human IgG. The observed limits of detection (signal > blank intensity + 3StdDev of blank) by fluorescence intensity were 0.0001 g/L for adalimumab biosimilar and 0.00025 g/L for human IgG (a heterogeneous mixture of IgG subtypes 1–4 that binds Fc-III less well than pure IgG1).Citation40,Citation41 As a control for possible interference with the assay by soluble components liberated by cell lysis during culture or harvest, centrifuged CHO cell lysate prepared as described below was added to cell culture fluid containing 0.01–1 g/L human IgG in an amount equivalent to 2 million lysed cells per mL, and produced no significant change in either polarization or intensity assay results (Fig. S2). The Fc-III probe IgG limit of detection is comparable to those of HPLC or ELISA, albeit with a faster, simpler workflow.
Figure 7. Detection of different IgG analytes in CHO cell culture fluid. (a) Fluorescence polarization and (b) fluorescence intensity of 100 nM Fc-III probe with polyclonal human IgG (magenta), Adalimumab biosimilar IgG1 (green) and murine-IgG1 (black) in CHO-CCF. (c) Linear variation of fluorescence intensity of 100 nM Fc-III probe with human IgG in CHO-CCF
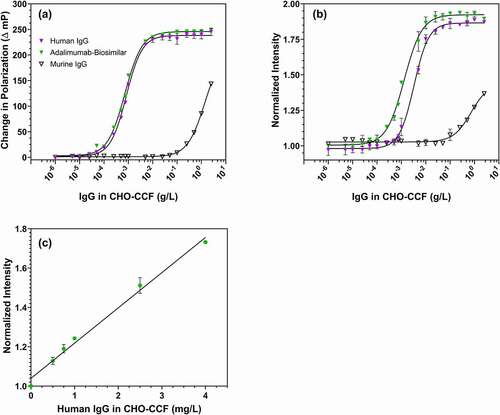
The detection limit for murine IgG1, to which Fc-III binds relatively poorly,Citation41 was 0.1 g/L, 1000 times that for human IgG. Even this higher detection limit could be useful in applications involving higher murine IgG concentrations (0.1 g/L to 2.5 g/L), including many murine hybridoma cultures.
The Fc-III peptide was selected to bind to a region of IgG-Fc that interacts with four structurally different proteins, including proteins A and G. While murine and human IgG antibodies differ in this region,Citation42 histidines H433 and H435 of IgG are conserved, and molecular docking suggested His433 Pi-Pi stacking interactions with the fluorescein. This possibility is further supported by the observation of fluorescence intensity enhancement with both human and mouse IgG.
Discussion
Antibody concentrations are routinely measured in culture fluid and process streams during clone and process development, and in manufacturing. Common UV absorbance methods suffer in this application from interference by medium components, and by proteins and nucleic acids liberated from cells lysed during culture or harvest. Antibody concentrations, therefore, are most commonly measured by ELISA, chromatography, or surface plasmon resonance, each of which requires substantial instrumentation and has a low throughput, incompatible with modern high-throughput approaches to clone selection, cell culture optimization, and purification process development and operation.
Here we introduce a simple, rapid, mix-and-read antibody assay based on homogenous, separation-free reporting of antibody Fc concentrations by fluorescence intensity, readable by simple instrumentation including standard microtiter plate readers. The ready production of the reporter by standard peptide synthesis, and its tolerance of complex culture fluid even when spiked with clarified cell lysate, suggests that the IgG assay could be very practically useful in bioprocess environments. The use of simple fluorescence intensity instrumentation facilitates ease of implementation and use in a typical bioprocess environment. Its great sensitivity (below 1 mg/L), and potentially the judicious use of unlabeled competitor or lower-affinity Fc-reporter would allow the assay to quantitate even the lowest and highest IgG titers practically encountered in bioprocessing.
The unexpected enhancement of fluorescence intensity upon IgG/Fc-III probe binding is intriguing and potentially very useful for quantitative IgG detection in homogenous assays. The biochemical and molecular docking approaches used here help elucidate the origins of this fluorescence intensity enhancement in changes in the local microenvironment of the fluorophore. This fast (< 30 s), quantitative and tunable IgG-assay can be used for IgG quantitation in cell line development, automated clone screening, purification and other bioprocess operations.
Materials and methods
Affinity binders and fluorescent labeling
The mAb reporter probes were prepared by modifying candidate affinity ligands with fluorescein. The Fc-binding peptide Fc-III (DCAWHLGELVWCT-NH2)Citation27 was modified with an N-terminal-fluorescein coupled to an aminohexanoic acid (Ahx) spacer (Fluorescein-Ahx-DCAWHLGELVWCT-NH2). Peptide-H (HWRGWV)Citation43 was modified with fluorescein in the same way. Fluorescein-labeled peptides were synthesized by GenScript and were used as supplied. Fluorescein-labeled protein G (product code PGF) was purchased from ProteinMods.
Static fluorescence polarization and intensity measurements
Static fluorescence experiments were performed in Corning 96-well flat-bottom black microtiter plates (CLS3650, Sigma). Purified human IgG (IHUIGGAP) was purchased from Innovative Research, Inc. Human IgG1 adalimumab biosimilar Exemptia was from Zydus Cadila, India. The antibodies were diluted to the desired working concentration in phosphate-buffered saline (PBS) or in null CHO-S CCF (a generous gift of Prof. Ruben Carbonell and Golden LEAF Biomanufacturing Training and Education Center, North Carolina State University). Briefly, CHO-S cells were grown in CD CHO medium (Cat# 10743002, Thermo Fisher Scientific) supplemented with 4 mM L-glutamine to a cell density of 3.31 × 10⁶ cells/mL, with 96.1% viability.Citation44 Upon harvest, the CCF was clarified by centrifugation at 8000×g for 30 min followed by filtration through a 0.2 µm polyethersulfone membrane filter (Cat# 10040, VWR). To test for possible interference with the assay by cell components liberated by cell lysis into culture fluid, CHO-k7 cells grown in Gibco/F12 (1:1) (1x) Dulbecco’s Modified Eagle Medium (the generous gift of Rohan Kulkarni and Navin Varadarajan, University of Houston) were harvested by centrifugation (500xg, 10min), lysed by sonication (20 kHz, 20s, 3 cycles), and centrifuged (10000 xg, 20 min). This clarified lysate was added to the clarified CHO culture fluid derived from a culture with 96.1% viability described above, and these samples spiked with human IgG1 and tested as described below. In a typical batch experiment, 125 µL of mAb-spiked PBS or CHO-CCF was transferred to a microtiter plate well, followed by the addition of 125 µL of the fluorescent affinity ligand diluted in PBS to the required concentration. The microplate was immediately placed in a filter-based fluorescence polarization/intensity microplate reader (Tecan Infinite F200 PRO; Ex 485 nm/Em 535 nm). For experiments involving the use of competitors, 5 µL (2% of the overall volume) of PBS (negative control) or competitor in PBS was added to a microwell containing 0.001 g/L human IgG and 50 nM fluorescein-labeled affinity ligand (250 µL) and incubated for 120 min (a time found sufficient for equilibration) before fluorescence polarization and fluorescence intensity measurements.
Fluorescence polarization is defined by the following equation:
Where III is the intensity with Ex/Em polarizers set parallel, and I⊥ is the intensity with polarizers set perpendicular. Fluorescence polarization values are usually expressed in units of millipolarization (mP).
Molecular docking of labeled FC-III
The X-ray crystallographic structure by Delano et al. of the 13-residue cyclic peptide Fc-III DCAWHLGELVWCT-NH2 in complex with IgG-Fc (PDB ID: 1DN2) was used for docking studies.Citation27 The X-ray crystal structure of IgG-Fc (PDB ID: 1DN2) was retrieved from the RCSB protein data bank.Citation27 The structure of the fluorescein-labeled Fc-III was generated based on the structures of Fc-III and fluorescein and energy-minimized for 1000 cycles using the OPLS_2005 force field in Schrödinger Maestro (Schrödinger, LLC).
Combining different docking methods often can achieve more reliable cross-validated predictions.Citation45 Therefore, two different molecular docking methods were used in this study to obtain binding modes of fluorescein-labeled Fc-III and IgG-Fc. AutoDock Vina is a widely used open-source docking program.Citation46 The IgG-Fc and fluorescein-labeled Fc-III structures were prepared with AutoDock Tools.Citation47 All hydrogens were added and Gasteiger charges were assigned.Citation48 The center of the docking grid box was placed at the center of geometry of the engineered peptide in complex with IgG-Fc in the crystal structure (PDB ID: 1DN2). The grid box extended beyond the binding site, with 35 points along each edge of the box, 1.0 Å apart. The IgG-Fc was enclosed in a grid box of 35 Å in each direction to include the potential ligand-binding site. In order to find the best conformations, the level of search exhaustiveness and the maximum number of binding modes were set at 16 and 20, respectively. The AutoDock Vina docking score was used to rank the different docking poses by binding affinity. Docking calculations were repeated 3 times with different random seeds.Citation49,Citation50Citation51
The Schrödinger Glide program was separately used to further investigate the interactions between IgG-Fc and fluorescein-labeled Fc-III.50 The protein IgG-Fc structure retrieved from PDB ID: 1DN2Citation27 was prepared by the Protein Preparation Wizard in the Schrödinger Maestro visualizer. Hydrogens were added and bond orders were assigned. Ionization states were assigned at pH 7.0. Using ProtAssign, the hydrogen positions in the structure of the protein IgG-Fc were optimized for hydrogen bonding and energy minimized to eliminate potential steric clashes before docking. The fluorescein-labeled Fc-III was prepared with the LigPrep platform in the Schrödinger Maestro visualizer. Possible ionization states were generated at pH 7 with the Epik module in Schrödinger. Hydrogen atoms were added, tautomers generated, specified chiralities were retained, and the geometries of the fluorescein-labeled Fc-III were optimized. Finally, after preparation, six output structures of the fluorescein-labeled Fc-III were generated for further docking calculations. The ligand was treated as fully flexible. The docking grid was generated with the Receptor Grid Generation tool in the Schrödinger Maestro visualizer. The default van der Waals radius scaling factors were used. The center and the size of the grid box (35 Å) were defined according to the position of the engineered peptide in complex with IgG-Fc in the crystal structure (PDB ID: 1DN2). The standard-precision docking score was used to rank the docking poses. For each fluorescein-labeled Fc-III structure after preparation, a maximum of 50 poses were saved after docking calculations. Fc-III is a disulfide-bonded cyclic peptide and no modification was made to the peptide Fc-III moiety. Therefore, the peptide portion of the ligand was internally constrained (rigid), while the fluorescein label was free to change conformation. All the other settings remained at their defaults in Schrödinger.Citation49–51
Competing interests
Authors UP, BV, KK, and RCW on this manuscript are listed as inventors on a pending patent application on this work, all other authors declare they have no competing interests.
Supplemental Material
Download MS Word (151.7 KB)Acknowledgments
We would like to thank Dr. Glen Bolton (Amgen), Dr. David Robbins (AstraZeneca), Dr. David Roush (Merck Research Labs), Dr. Kent Göklen (GlaxoSmithKline), and Dr. John Erickson (National Institute for Innovation in Manufacturing Biopharmaceuticals) for valuable discussions. Special thanks to Golden LEAF Biomanufacturing Training and Education Center, North Carolina State University for generously donating CHO cell culture fluid used in this study. This research did not receive any specific grant from funding agencies in the public, commercial, or not-for-profit sectors.
Disclosure statement
No potential conflict of interest was reported by the author(s).
Supplementary Material:
Supplemental data for this article can be accessed on the publisher’s website
Additional information
Funding
References
- Grilo AL, Mantalaris A. The increasingly human and profitable monoclonal antibody market. Trends Biotechnol. 2019;37(1):9–10. doi:10.1016/j.tibtech.2018.05.014.
- Urquhart L. Top drugs and companies by sales in 2018. Nat Rev Drug Discov. 2019;18:2019. doi:10.1038/d41573-019-00049-0.
- Jagschies G, Lindskog E, Lacki K, Galliher P. Biopharmaceutical processing. Elsevier. 2018. doi:10.1016/B978-0-08-100623-8.00002-5.
- Thompson B, Clifford J, Jenns M, Smith A, Field R, Nayyar K, James DC. High-throughput quantitation of Fc-containing recombinant proteins in cell culture supernatant by fluorescence polarization spectroscopy. Anal Biochem. 2017;534:49–55. doi:10.1016/j.ab.2017.07.013.
- Owicki JC. Fluorescence polarization and anisotropy in high throughput screening: perspectives and primer. J. Biomol. Screen 2000;5(5):297–306. doi:10.1177/108705710000500501.
- Jameson DM, Ross JA. Fluorescence polarization/anisotropy in diagnostics and imaging. Chem Rev. 2010;110(5):2685–708. doi:10.1021/cr900267p.
- Hall MD, Yasgar A, Peryea T, Braisted JC, Jadhav A, Simeonov A, Coussens NP. Fluorescence polarization assays in high-throughput screening and drug discovery: a review. Methods Appl Fluoresc. 2016;4(2):022001. doi:10.1088/2050-6120/4/2/022001.
- Wu P, Brasseur M, Schindler U. A high-throughput STAT binding assay using fluorescence polarization. Anal Biochem. 1997;249(1):29–36. doi:10.1006/abio.1997.2158.
- Xavier AK, Willson RC. Association and dissociation kinetics of anti-hen egg lysozyme monoclonal antibodies HyHEL-5 and HyHEL-10. Biophys J. 1998;74(4):2036–45. doi:10.1016/S0006-3495(98)77910-X.
- Potty ASR, Kourentzi K, Fang H, Jackson GW, Zhang X, Legge GB, Willson RC. Biophysical characterization of DNA aptamer interactions with vascular endothelial growth factor. Biopolymers. 2009;91(2):145–56. doi:10.1002/bip.21097.
- Peterson KJ, Sadowsky JD, Scheef EA, Pal S, Kourentzi KD, Willson RC, Bresnick EH, Sheibani N, Gellman SH. A fluorescence polarization assay for identifying ligands that bind to vascular endothelial growth factor. Anal Biochem. 2008;378(1):8–14. doi:10.1016/j.ab.2008.03.043.
- Kourentzi K, Srinivasan M, Smith-Gill SJ, Willson RC. Conformational flexibility and kinetic complexity in antibody–antigen interactions. J Mol Recognit. 2008;21(2):114–21. doi:10.1002/jmr.874.
- Kisley L, Chen J, Mansur AP, Shuang B, Kourentzi K, Poongavanam M-V, Chen W-H, Dhamane S, Willson RC, Landes CF. Unified superresolution experiments and stochastic theory provide mechanistic insight into protein ion-exchange adsorptive separations. Proc Natl Acad Sci USA. 2014;111:2075–80. doi:10.1073/pnas.1318405111.
- Kisley L, Patil U, Dhamane S, Kourentzi K, Tauzin LJ, Willson RC, Landes CF. Competitive multicomponent anion exchange adsorption of proteins at the single molecule level. Analyst. 2017;142(17):3127–31. doi:10.1039/C7AN00701A.
- Patil U, Crum M, Vu B, Wasden K, Kourentzi K, Willson RC. Continuous Fc detection for protein A capture process control. Biosens Bioelectron. 2020;165:112327. doi:10.1016/j.bios.2020.112327.
- Ogawa T, Aoyagi S, Miyasaka T, Sakai K. Fluorescence enhancement of fluorescein isothiocyanate-labeled protein a caused by affinity binding with immunoglobulin G in bovine plasma. Sensors. 2009;9(10):8271–77. doi:10.3390/s91008271.
- Aoyagi S, Kudo M. Development of fluorescence change-based, reagent-less optic immunosensor. Biosens Bioelectron. 2005;20(8):1680–84. doi:10.1016/j.bios.2004.06.041.
- Politzer IR, Crago KT, Hampton T, Joseph J, Boyer JH, Shah M. Effect of β-cyclodextrin on the fluorescence, absorption and lasing of rhodamine 6G, rhodamine B and fluorescein disodium salt in aqueous solutions. Chem Phys Lett. 1989;159(2–3):258–62. doi:10.1016/0009-2614(89)87420-2.
- Watt RM, Voss EW. Solvent perturbation of the fluorescence of fluorescein bound to specific antibody. Fluorescence quenching of the bound fluorophore by iodide. J Biol Chem. 1979;254(5):1684–90. doi:10.1016/S0021-9258(17)37827-4.
- Watt RM, Voss EW. Mechanism of quenching of fluorescein by anti-fluorescein IgG antibodies. Immunochemistry. 1977;14(7):533–41. doi:10.1016/0019-2791(77)90308-1.
- Lavis LD, Rutkoski TJ, Raines RT. Tuning the p K a of fluorescein to optimize binding assays. Anal Chem. 2007;79(17):6775–82. doi:10.1021/ac070907g.
- Lindner K, Saenger W. Cyclodextrin dodecahydrate: crowding of water molecules within a hydrophobic cavity. Angew Chemie Int Ed English. 1978;17(9):694–95. doi:10.1002/anie.197806941.
- Saenger W, Jacob J, Gessler K, Steiner T, Hoffmann D, Sanbe H, Koizumi K, Smith SM, Takaha T. Structures of the common cyclodextrins and their larger analogues-beyond the doughnut. Chem Rev. 1998;98(5):1787–802. doi:10.1021/cr9700181.
- Wenz G. Cyclodextrins as building blocks for supramolecular structures and functional units. Angew Chemie Int Ed English. 1994;33(8):803–22. doi:10.1002/anie.199408031.
- Li S, Purdy WC. Cyclodextrins and their applications in analytical chemistry. Chem Rev. 1992;92(6):1457–70. doi:10.1021/cr00014a009.
- Guryev O, Abrams B, Lomas C, Nasraty Q, Park E, Dubrovsky T. Control of the fluorescence of dye-antibody conjugates by (2-hydroxypropyl)-β-cyclodextrin in fluorescence microscopy and flow cytometry. Anal Chem. 2011;83(18):7109–14. doi:10.1021/ac2014146.
- Delano WL, Ultsch MH, De VAM, Wells JA, Palmer D. Convergent solutions to binding at a protein-protein interface. Science. 2000;287(5456):1279–83. doi:10.1126/science.287.5456.1279.
- Mansoor SE, DeWitt MA, Farrens DL. Distance mapping in proteins using fluorescence spectroscopy: the Tryptophan-Induced Quenching (TrIQ) method. Biochemistry. 2010;49(45):9722–31. doi:10.1021/bi100907m.
- Togashi DM, Szczupak B, Ryder AG, Calvet A, O’Loughlin M. Investigating tryptophan quenching of fluorescein fluorescence under protolytic equilibrium. J Phys Chem A. 2009;113:2757–67. doi:10.1021/jp808121y.
- Uhlén M, Guss B, Nilsson B, Gatenbeck S, Philipson L, Lindberg M. Complete sequence of the staphylococcal gene encoding protein A. A Gene Evolved through Multiple Duplications. J Biol Chem. 1984;259:1695–702. doi:10.1016/S0021-9258(17)43463-6.
- Aoyagi S, Imai R, Sakai K, Kudo M. Reagentless and regenerable immunosensor for monitoring of immunoglobulin G based on non-separation immunoassay. Biosens Bioelectron. 2003;18(5–6):791–95. doi:10.1016/S0956-5663(03)00046-0.
- Herman RA, Scherer PN, Shan G. Evaluation of logistic and polynomial models for fitting sandwich-ELISA calibration curves. J Immunol Methods. 2008;339(2):245–58. doi:10.1016/j.jim.2008.09.001.
- Azadeh M, Gorovits B, Kamerud J, MacMannis S, Safavi A, Sailstad J, Sondag P. Calibration curves in quantitative ligand binding assays: recommendations and best practices for preparation, design, and editing of calibration curves. AAPS J. 2018;20(1):1–16. doi:10.1208/s12248-017-0159-4.
- Findlay JWA, Smith WC, Lee JW, Nordblom GD, Das I, DeSilva BS, Khan MN, Bowsher RR. Validation of immunoassays for bioanalysis: a pharmaceutical industry perspective. J Pharm Biomed Anal. 2000;21(6):1249–73. doi:10.1016/S0731-7085(99)00244-7.
- Chiverton LM, Evans C, Pandhal J, Landels AR, Rees BJ, Levison PR, Wright PC, Smales CM. Quantitative definition and monitoring of the host cell protein proteome using iTRAQ - a study of an industrial mAb producing CHO-S cell line. Biotechnol J. 2016;11(8):1014–24. doi:10.1002/biot.201500550.
- Doneanu C, Xenopoulos A, Fadgen K, Murphy J, Skilton SJ, Prentice H, Stapels M, Chen W. Analysis of host-cell proteins in biotherapeutic proteins by comprehensive online two-dimensional liquid chromatography/mass spectrometry. MAbs. 2012;4(1):24–44. doi:10.4161/mabs.4.1.18748.
- Yuk IH, Nishihara J, Walker JD, Huang E, Gunawan F, Subramanian J, Pynn AFJ, Yu XC, Zhu-Shimoni J, Vanderlaan M, et al. More similar than different: host cell protein production using three null CHO cell lines. Biotechnol Bioeng. 2015;112(10):2068–83. doi:10.1002/bit.25615.
- Baycin-Hizal D, Tabb DL, Chaerkady R, Chen L, Lewis NE, Nagarajan H, Sarkaria V, Kumar A, Wolozny D, Colao J, et al. Proteomic analysis of Chinese hamster ovary cells. J Proteome Res. 2012;11(11):5265–76. doi:10.1021/pr300476w.
- Hogwood CEM, Bracewell DG, Smales CM. Measurement and control of host cell proteins (HCPs) in CHO cell bioprocesses. Curr. Opin. Biotechnol 2014;30:153–60. doi:10.1016/j.copbio.2014.06.017.
- Van Loghem E, Frangione B, Recht B. Staphylococcal protein FE. A and human IgG subclasses and allotypes. Scand J Immunol. 1982;15(3):275–78. doi:10.1111/j.1365-3083.1982.tb00649.x.
- Sakamoto K, Ito Y, Hatanaka T, Soni PB, Mori T, Discovery SK. Characterization of a peptide motif that specifically recognizes a non-native conformation of human IgG induced by acidic pH conditions. J Biol Chem. 2009;284(15):9986–93. doi:10.1074/jbc.M807618200.
- Nagaoka M, Akaike T. Single amino acid substitution in the mouse IgG1 Fc region induces drastic enhancement of the affinity to protein A. Protein Eng. 2003;16(4):243–45. doi:10.1093/proeng/gzg037.
- Yang H, Gurgel PV, Carbonell RG. Purification of human immunoglobulin G via Fc-specific small peptide ligand affinity chromatography. J Chromatogr A. 2009;1216(6):910–18. doi:10.1016/j.chroma.2008.12.004.
- Lavoie RA, Di Fazio A, Blackburn RK, Goshe MB, Carbonell RG, Menegatti S. Targeted capture of Chinese hamster ovary host cell proteins: peptide ligand discovery. Int J Mol Sci. 2019;20(7):1–21. doi:10.3390/ijms20071729.
- Wang Z, Sun H, Yao X, Li D, Xu L, Li Y, Tian S, Hou T. Comprehensive evaluation of ten docking programs on a diverse set of protein–ligand complexes: the prediction accuracy of sampling power and scoring power. Phys Chem Chem Phys. 2016;18(18):12964–75. doi:10.1039/C6CP01555G.
- Trott O, Olson AJ. Software news and update AutoDock Vina: improving the speed and accuracy of docking with a new scoring function, efficient optimization, and multithreading. J Comput Chem. 2010;31:455–61. doi:10.1002/jcc.21334.
- Morris GM, Ruth H, Lindstrom W, Sanner MF, Belew RK, Goodsell DS, Olson AJ. Software news and updates AutoDock4 and AutoDockTools4: automated docking with selective receptor flexibility. J Comput Chem. 2009;30(16):2785–91. doi:10.1002/jcc.21256.
- Gasteiger J, Marsili M. Iterative partial equalization of orbital electronegativity—a rapid access to atomic charges. Tetrahedron. 1980;36(22):3219–28. doi:10.1016/0040-4020(80)80168-2.
- Liu Y, Ebalunode JO, Briggs JM. Insights into the substrate binding specificity of quorum-quenching acylase PvdQ. J Mol Graph Model. 2019;88:104–20. doi:10.1016/j.jmgm.2019.01.006.
- Friesner RA, Banks JL, Murphy RB, Halgren TA, Klicic JJ, Mainz DT, Repasky MP, Knoll EH, Shelley M, Perry JK, et al. Glide: a new approach for rapid, accurate docking and scoring. 1. method and assessment of docking accuracy. J Med Chem. 2004;47(7):1739–49. doi:10.1021/jm0306430.
- Du J, Sun H, Xi L, Li J, Yang Y, Liu H, Yao X. Molecular modeling study of checkpoint kinase 1 inhibitors by multiple docking strategies and prime/MM-GBSA calculation. J Comput Chem. 2011;32(13):2800–09. doi:10.1002/jcc.21859.