
ABSTRACT
Advances in antibody discovery technologies, especially with the availability of humanized mice and phage/yeast library approaches, enable the generation of a large diversity of antibodies against nearly any target of interest. As a result, there is an increasing demand for the production of larger numbers of purified antibodies at quantities (10s-100s of milligrams) sufficient for functional screening assays, drug-ability/develop-ability studies and immunogenicity assessments. To accommodate this need, new methods are required that bridge miniature high throughput/plate-based purification and conventional, one at a time, two-step purification at much larger scales. Thus, we developed a semi-automated, mid-scale (i.e., 1–75 mg) purification process that uses a combination of parallel affinity capture and automated sequential polishing to provide substantially improved throughput while delivering high purity. We optimized the affinity capture step to perform 24 monoclonal antibody purifications in parallel using a Protein Maker for 20–200 mL culture media. The eluant is transferred directly to an AKTA pure system equipped with an autosampler for sequential preparative size exclusion chromatography to remove aggregates and undesirable impurities, as well as exchange the antibody into a buffer suitable for most uses, including cell-based assays. This two-step purification procedure, together with plate-based protein analytical methods, can purify 24–48 monoclonal antibodies in <20 hours and generate up to 80 mg per sample. A stringent clean-in-place protocol for both systems and column maintenance was designed and established to minimize endotoxin contamination. This process has proven to be very reliable and robust, enabling the production of thousands of antibodies of sufficient quality and quantity that are suitable for cell-based assays, biochemical/biophysical characterization, and in vivo animal models.
Introduction
Significant unmet medical needs, coupled with substantially improved methods for therapeutic antibody discovery, have driven the continual acceleration of their discovery and use in recent years. Antibody discovery platforms have progressed from simple immunizations of mice to the use of genetically engineered mice and antibody fragment libraries through surface display on a phage and yeast to identify large numbers of fully human antibodies. It is not unusual that hundreds to thousands of antibodies of interest can be identified from one discovery campaign for the target of interest via the use of high-throughput binding and functional assays. Therefore, miniaturized, high-throughput (HTP) 96-well plate based purification methods have been developed for material generation to meet the throughput requirement of these functional screening evaluations (e.g., antigen binding and biochemical assays).Citation1–3
However, plate-based purification methods are not able to provide sufficient quantities of antibodies with suitable purity to be useful beyond these simple assays. Typically, more detailed characterization, ranging from functional testing in cell-based assays (often sensitive to endotoxin contamination and aggregates), in vivo disease models, assessment of potential immunogenicity, and detailed biophysical characterization to assess manufacturability and developability, all require substantially larger quantities of highly purified antibodies in the range of 10–100 mg at a minimum. With recent advances in mammalian cell-based expression of antibodies, the quantities of antibody required for these types of studies can be obtained routinely from 20 mL to 200 mL transient expression culture.Citation4 We refer to this range of expression volumes as “mid-scale,” generating quantities of antibody in the 1–75 mg range.
Numerous high throughput purification methods at this mid-scale have been explored previously,Citation5–10 but none are ideal to support the assessment of a large variety of antibodies from discovery campaigns. For example, to achieve higher throughput, Helie et al. used a Protein Maker (Protein BioSolutions) for one-step affinity purification of up to 24 samples in parallel from 10 mL to 200 mL culture volume.Citation6 This approach was able to produce antibodies at a useful scale (≈17 mgs from 50 mL). However, these likely were not of high purity due to the lack of any further purification steps and would require an additional buffer exchange step to be useful for cell-based assays.
Two separate groups have reported the incorporation of an autosampler to increase purification throughput. Yoo et al. reported an automated high-throughput method of Protein A purification plus desalting sequentially using an AKTA purifier and CETAC autosampler to purify up to 240 monoclonal antibodies (mAbs) from a range of 0.5–15 mL culture volumes.Citation7 Only small quantities of mAbs were obtained, for example, 0.02–2 mg from 10–15 mL hybridomas, with limited purity based on sodium dodecyl sulfate-polyacrylamide gel electrophoresis (SDS-PAGE) characterization. Schmitz et al. developed a two-step, preparative, tandem chromatographic procedure (a Protein A/alternating column regeneration SEC system).Citation9 Using this method, 48 samples can be purified within 48 hours from a fixed volume (35 mL) of clarified cell supernatants using an autosampler, but the yields (≈1–5 mg) limit the extent of characterization likely only to functional assays.
To address these limitations, we wanted to develop a mid-scale (i.e., 1–75 mg from up to 200 mL culture volume), semi-automated purification process that fills this gap between small scale, plate-based HTP purifications with low purity and large scale, one sample at a time approach that deliver high purity and quality required for a range of subsequent characterization needs. In this study, we report the design and optimization of a process that includes two-step, mid-scale purification using a combination of parallel and sequential processes with Protein A affinity and pSEC steps. The process was designed to perform an affinity capture step for up to 24 samples in parallel on a Protein Maker instrument (Protein BioSolutions), followed by a size exclusion step on an AKTA pure (Cytiva Life Sciences) coupled with an ALIAS autosampler (iChrom Solutions) injecting samples sequentially. Plate-based analytical methods were established to characterize antibody purity throughout the process. We also developed a stringent cleaning procedure to assure endotoxin control to enable the use of purified antibodies in cell-based assays or in vivo studies. This newly developed process has been implemented for routine purification and has allowed us to purify thousands of antibodies of sufficient quality and quantity to enable their evaluation of a broad range of material-intensive applications.
Results
Integrated semi-automated process
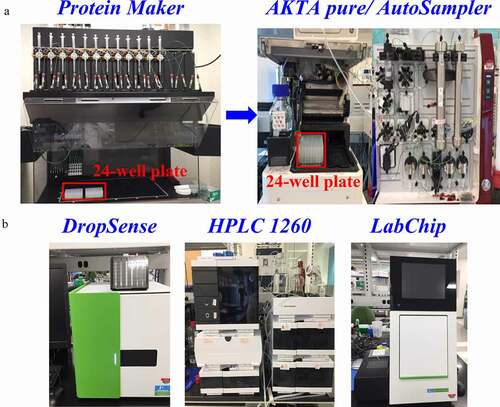
Multi-milligram quantities of antibodies are commonly purified one at a time using at least two sequential chromatographic steps, which results in limited throughput and capacity. We sought to significantly improve antibody purification throughput by using a combination of parallel processing, automated sample injection, and newer chromatography media to speed up the column purification steps. illustrates the integrated instrumentation for this new process. To increase purification throughput, a 24-channel parallel liquid chromatography system, Protein Maker (, left), is used for the Protein A capture step. Up to 24 samples with a culture volume of 20–200 mL can be loaded simultaneously to Protein A columns. The protein is eluted and collected into a single 24-well plate. The second, preparative size exclusion chromatography (pSEC) step is performed automatically on an SRT-10 C 300-SEC silica-based column (Sepax Technologies) attached to an AKTA pure instrument equipped with an ALIAS autosampler and a 10 mL sample loop (, right) that has been configured for direct sample injection from a 24-well plate. The eluted protein is collected as fractions in 96-well deep well plates, which can then be pooled for final characterization.
Figure 1. The instrumentation for semi-automated purification. (a) Chromatograph equipment: Protein Maker with 2 × 24 Protein A columns and a 24-well collection plate (left). AKTA pure equipped with an ALIAS autosampler for sample loading from 24-well plates (right). (b) Plate based analytical instruments. DropSense for A280 concentration (left), Agilent HPLC 1260 with multisampler for Protein G titer and aSEC purity (middle), and LabChip GX Touch II for ceSDS (right). Samples from each purification step were transferred into a 96-well plate for analytical characterization
The transition of eluted proteins from the Protein A capture step to the pSEC step without additional manual manipulation imposes three requirements: (1) the eluate needs to be at an appropriate volume (< 10 mL) for a 24-well collection plate while maintaining protein recovery at > 80%; (2) pSEC sample injection should be equal to or less than 5% column volume (CV) to assure the separation efficiency; and (3) pSEC fractions need to be collected within six 96-well plates for all 24 samples at a high enough concentration (e.g., >1 mg/mL needed for in vitro assays and developability assessment) to avoid sample handling (i.e., concentration) after fraction pooling. In order to limit the fraction number within six plates, the maximum capacity of the AKTA pure fraction collector, we have evaluated the peak A280 cutoff and fraction volume against protein recovery. We found that an A280 cutoff set at 1–2 mAU/mg loaded protein, with fractions volumes at 1.5 mL, is suitable for most samples.
Finally, to fully enable this purification methodology, the ability to perform analytical characterization of samples at every step is critical. Due to the substantially increased numbers of samples from this parallel/sequential combinational purification process, we rely on a variety of plate-based analytical equipment () to streamline sample characterization. Samples after Protein A and pSEC steps can be transferred into 96-well plates using a multi-channel pipette or liquid handler for characterization. The concentration is measured by ultraviolet (UV) absorbance at 280 nm (A280) using a DropSense plate-based spectrophotometer (Unchained Labs). Antibody purity is determined by analytical SEC (aSEC) on a high-performance liquid chromatography (HPLC) instrument (Agilent) using a 96-well sample plate and non-reduced capillary electrophoresis (NR ceSDS) by LabChip (Perkin Elmer). The overall run time of this newly established process to complete purification and characterization of 48 antibodies is ≤20 hours.
Parallel affinity capture process
It was critical to design a high-throughput process to accommodate as wide a range as possible of both transfection supernatant volumes and antibody quantities. We therefore selected a newer improved Protein A resin from Cytiva Life Sciences, MabSelect PrismA.Citation11,Citation12 To simplify operation, we developed the process around the use of 1 mL pre-packed columns, which provides the flexibility of adding an appropriate number of columns to sufficiently capture the expressed antibody. In our labs, the average expression titer for ~350 mAb samples from Chinese hamster ovary (CHO) transient transfection () was 201 mg/L with a range of 11–600 mg/L, equivalent to a maximum of 120 mg antibody from the 200 mL supernatant. Therefore, two 1 mL MabSelect PrismA columns in tandem were connected to each Protein Maker column line, which is expected to provide sufficient capacity (up to 136 mg/sample line, as the maximum capacity of a single column was 68 mg/mL resin for the particular lot of columns used in the study) for our typical needs. For elution, a buffer at pH 3.0 is required for the MabSelect PrismA resinCitation13 to completely recover antibodies within 3 to 4 CVs (6–8 mL) at high concentration, which is important for the subsequent pSEC step.
Figure 2. Expression titer for 350 antibodies: the expression titers of approximately 350 mAbs produced by CHO transient transfections were determined (see Methods); the average titer was at 201 mg/L with a range of 11–601 mg/L
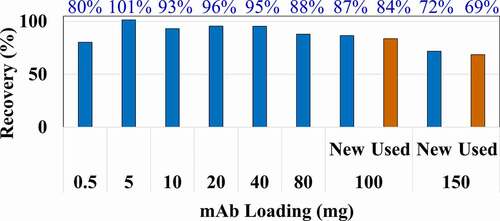
To explore the Protein A capture performance, we used a single purified antibody at varying loads (). The ability to capture a range of 0.5–150 mg antibodies per line was evaluated using this antibody spiked into a freshly prepared culture media. In these experiments, the recovery of antibody was >85% over a loading range of 0.5–100 mg (corresponding to 0.25–50 mg/mL resin), but only 80% at the extremely low loading of 0.5 mg (). In addition, we tested the longevity of the Protein A columns, and after more than 100 cycles of usage, the recovery from the used column was still comparable to the new column when loading 100 mg of antibody (). The 150 mg load was expected to exceed the capacity of the column, thus the lower recovery of only 72%. However, the very small difference in recovery between the used and new columns at 150 mg loading confirms the longevity of the columns, and therefore, there is an infrequent need to replace columns under normal use.
Figure 3. Antibody recovery from Protein A capture over a broad loading range. Protein A columns were loaded with 0.5–150 mg per line of a purified antibody spiked into a freshly prepared culture media on two 1 mL MabSelect PrismA column (equivalent to 0.25–75 mg antibody/mL resin). The protein recovery (number above each bar) was calculated by recovered antibody against initial loading. Used columns (in orange), previously subjected to 100 cycles of loading and elution, were also tested at mAb loading of 100 mg and 150 mg
Sequential pSEC process optimization
pSEC was selected as a second polishing step for multiple reasons. First, its ability to remove antibody aggregates (the primary contaminant following Protein A affinity capture) is effective for nearly all antibodies without the need to tailor operating conditions. Second, its ability to simultaneously buffer exchange each antibody with any subsequent sample handling effectively minimizes hands-on time during purification, as well as the potential to introduce contamination and endotoxin. We optimized the pSEC process for effective aggregate separation and removal to assure high final purity and, if possible, shorten the process time. A silica-based SRT-10 C SEC-300 210 mL column (30 x 300 mm) was compared to the more commonly used agarose based Superdex 200 (16 x 600 mm) column (). A mixture of control antibody (~150 kDa) and a commercially available protein, bovine thyroglobulin (~660 kDa), was used to mimic a mixture of monomeric antibody and oligomer aggregates. A sample consisting of ~87% monomer (antibody) and ~11% aggregates (thryoglobulin + antibody aggregates) was used to test the performance of both columns by evaluating the resolution between aggregate and monomer, total effluent volume increase, overall recovery, and sample purity (); the determination of resolution (which is unitless) was accomplished using the Unicorn software, as described in the Methods section. This direct comparison revealed slightly higher resolution (average of 1.07) and protein recovery (average of 79.3%) from the SRT column relative to the Superdex 200 column (average resolution of 1.05 and recovery of 76.2%), while the effluent volume increase and purity are comparable between the two columns.
Table 1. Performance comparison of SRT-10 C SEC-300 compared to superdex 200 column
To ensure robustness of this process over the range in expression titer we typically experience (see ), we wanted to optimize the process parameters of the pSEC step (with the SRT column), such that the separation was at least as good as the commonly used Superdex 200 column (measured by resolution at 1.05). We used the same control antibody and thyroglobulin mixture in a full factorial design-of-experiment (DoE) study to evaluate the effects of loading volume (2–8 mL), protein concentration (2–12 mg/mL) and flow rate (5–10 mL/min) on the purity and total antibody recovery. Example chromatograms from runs for both low and high resolutions are shown in Figure S1. As is apparent, the process conditions can have a significant impact on the ability of the pSEC step to resolve aggregates while maximizing the yield.
The observed resolution between the monomer and aggregates, protein recovery, and purity versus each of the explored process parameters are shown in Figure S2. The resulting data were modeled using a multi-variate Standard Least Squares fit (JMP, ver.14.1.0) to determine which process parameters were most important to purity, recovery, and resolution (Figure S3A,B). In this analysis, the loading volume had the largest and statistically significant effect on yield, purity, and resolution (p = .0186), and the loading concentration had a marginally significant effect (p = .0309). Using this information, the flow-rate for the pSEC step was subsequently fixed at 7.5 mL/min. Using the model and setting both the flow rate and the expected load volume resulting from the Protein A capture step (6 mL), the resolution, recovery, and purity values were computed across the range of antibody concentrations tested (Figure S3C). This analysis suggests that the minimum resolution (occurring at the highest antibody load concentration) is expected to be 1.18, well above the resolution of the Superdex column, and sufficient for effective separation of monomer from aggregates.
Semi-automated purification process robustness evaluation
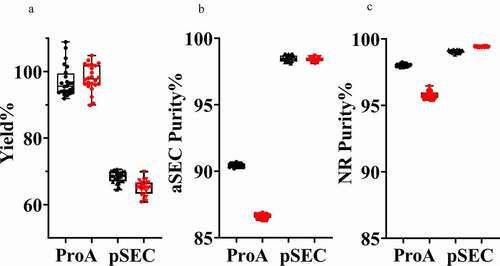
After optimizing both steps, we assessed the reproducibility of the full, two-step purification process. Two antibodies (mAb1 and mAb2) with similar post-Protein A aggregation content were chosen to assess the entire process. The supernatants of ~200 mL culture media from CHO-expressed mAb1 and mAb2 were evenly loaded at approximately 30 mg antibody per line in the Protein A step. Two Protein A affinity capture runs on the Protein Maker were performed and followed by the pSEC step running on two different AKTA pure instruments overnight (for a total of 48 purifications, and a total process time < 16 hours). The concentration was determined by A280 using a DropSense and purity was determined by both aSEC (HPLC) and NR ceSDS (LabChip), which could be completed in ≈3 hours. The reproducibility of both process steps with respect to both purity and recovery is evident for both antibodies (). For the cumulative two-step process, the mean recoveries (with standard deviation) were 68.4% (± 1.7%) for mAb1 and 65.0% (± 2.3%) for mAb2 and purities by aSEC were 98.5% (± 0.2%) for mAb1 and 98.4% (± 0.2%) for mAb2. Potential subtle variation from process parameters, such as flow rate, loading volume, and peak cutoff for pooling of samples, might contribute to some of step yield differences across each set of 24 samples.
Figure 4. Reproducibility of the semi-automated purification process. The step yield (a), aSEC purity (b) and NR ceSDS purity (c) from Protein A Capture and pSEC steps for two different antibodies, mAb1 (Black) and mAb2 (Red), were determined following two sets of 24 purifications using two different pSEC instrument setups (with a total of 48 purifications)
This newly developed, semi-automated purification process has been implemented in our lab and used to purify hundreds of antibodies. The overall protein recovery and purity results from ≈350 mAbs purified from this process are shown in and demonstrate both the desired throughput and consistent purity. Over this collection of antibodies in which expression titer ranged from 11 to 600 mg/L (), this purification process resulted in an average overall recovery of 63% () and up to 80 mg in quantity, with an average purity of 98% (by aSEC); less than 10% of the purifications had final purities of <90% ().
Figure 5. Performance of the new process for ≈350 real samples for purification. The overall purity (a) and recovery (b) trends from ~350 mAbs purified by newly developed semi-automated two-step purification are plotted (boxes show the two middle quartiles for each measurement)
Clean-in-place and endotoxin contamination control
To minimize the cost of chromatography resins used over time for both the Protein A and pSEC steps, we also devised a robust clean-in-place (CIP) method to ensure removal of tightly bound and/or precipitated substances. We were especially concerned with endotoxin contamination, since cell-based assays and in vivo studies typically require low endotoxin content in order to eliminate interference and other undesirable effects.Citation14,Citation15 The CIP process for the Protein A capture step takes advantage of the MabSelect PrismA resin’s alkali tolerance and uses a 0.1 N sodium hydroxide flush, in accordance with the manufacturer’s recommendation.Citation12 Using this method both before and after each Protein A capture run appears to have minimal effect on column performance, as evidenced by approximately 3% capacity loss when loading at 100 mg after 100 cycles of usage in comparison to a new column ().
For the silica-based pSEC column, preliminary experiments with various solvents suggested that isopropyl alcohol (IPA) can efficiently remove endotoxin contaminants compared to other organic solvents, e.g., acetonitrile (data not shown). To minimize the amount of organic solvent used, a range of aqueous IPA solutions was evaluated using the mixture of a control mAb and bovine thyroglobulin sample, spiked with endotoxin from E. coli culture. There were two injections with a wash between them, and the injection order was the mixture first (referred as Pre-IPA), followed by mAb only (referred as Post-IPA). The proteins from both injections were collected and pooled for A280 concentration and endotoxin measurement. The protein and endotoxin recoveries following washes with different IPA concentrations and the total endotoxin content from Post-IPA samples are summarized in . The results reveal the consistent recovery of protein and endotoxin from Pre-IPA samples, meaning that the endotoxin input to the Post-IPA injection was the same and any change in endotoxin content was from the effect of IPA wash. Endotoxin contamination was significantly reduced to less than 0.5 EU/mL in washes where the IPA concentration was greater than 25%; importantly, protein recovery was unaffected (). Therefore, the pSEC column can be washed and stored in 25% IPA during routine operation and completely cleaned with 70% IPA in instances of endotoxin contamination. Consistent with these experiments, the incorporation of these CIP methods successfully maintained low endotoxin contamination across hundreds of purifications (). The average endotoxin content was 0.8 EU/mg, and 97% of the samples had less than 3 EU/mg, demonstrating impressive control of endotoxin contamination.
Table 2. Endotoxin reduction following clean-in-place using various concentrations of isopropyl alcohol (IPA)
Figure 6. Endotoxin control following the use of an established CIP process. Endotoxin contamination for ≈350 mAbs purified by the new process with CIP procedures from both Protein A and pSEC steps is shown; the mean value is 0.8 EU/mg
Comparison of semi-automated purification to one-at-a-time purification
Importantly, we wanted to ensure that the purity and quality of antibodies purified via this semi-automated process were comparable or better than antibodies purified by the more typical one-at-a-time methodology. We compared purity (aSEC and endotoxin content) and antibody recovery for several purifications performed by either the described process (n = 531) or purifications performed using a more typical one-at-a-time approach (n = 527) (). An analysis of variance indicates that the distributions of both purity and recovery are extremely similar, demonstrating comparable performance of the higher throughput approach (). The average endotoxin contamination from the new process at 0.9 EU/mg is relatively low, with 93% of the samples containing less than 2 EU/mg (); these values are numerically better than the one-at-a-time process. In addition, the distribution of measured endotoxin values is also improved using the process described here, with 99% below 10 EU/mg, compared to 97% for the one-at-a-time process. Similarly, a comparison of the recovery () shows that the average recovery of the new process is slightly better as well.
Figure 7. Comparison of the performance of a new process to single sample purification. The aSEC purity (a), endotoxin (b), and yield (c) were determined for a large set of samples using either the semi-automated process (531 mAb samples) or a one-at-a-time individual process (527 mAb samples)
Discussion
Relatively recent developments in both instrumentation and chromatography media have allowed for many improvements to protein and especially antibody purification capabilities. To take full advantage of the capabilities offered by these advancements, we designed and optimized a purification process that can fill a large void between high-throughput/small quantity approaches and low-throughput/large quantity methods. The introduction of a Protein Maker instrument has made it possible to simultaneously affinity capture 24 samples at 20–200 mL culture volume within 1–4 hours. A silica-based SRT-10 C SEC-300 210 mL column (30 x 300 mm), which can withstand much higher flow rates, is used in the pSEC step in conjunction with an autosampler. pSEC fraction collection for 24 samples can be managed within six 96-deep-well plates by A280 peak cutoff and the relative narrow elution peak from small loading volume. This newly developed process enables us to perform purifications continuously for up to 48 samples within 20 hours.
Several aspects were considered to ensure robust performance to accommodate a diversity of antibodies. The Protein A affinity capture step was tailored for our typical expression titers and volumes; thus, sufficient column binding capacity and appropriate elution conditions were optimized for recovery. Importantly, the Protein A eluates are collected into a 24-well plate, and the total elution volume (plus additional neutralization buffer) is well within the 10 mL requirement for both the autosampler and pSEC sample loading volume limits. This change greatly simplifies the transfer into the autosampler for performing the subsequent pSEC step. The pSEC step was further optimized to obtain maximal recovery while maintaining purity. In particular, the loading volume and flow rate were refined through a full factorial DoE study to ensure desired purity over a broad range of loading concentrations. As a result, this two-step purification process can be carried out smoothly and with minimal hands-on intervention. Finally, we established a rigorous yet gentle CIP procedure to maintain very low endotoxin contamination levels critical for in vivo and in vitro studies while maximizing the column lifetime.
The robustness of this parallel/sequential purification process was demonstrated by the consistent purity and low endotoxin contamination of ~350 purified antibodies ( and ). Importantly, a side-by-side comparison with a one-at-a-time process demonstrated comparable to better performance with this new purification process (). The combination of purified antibody quantity, purity, and throughput achievable by this approach has proven to be a critical resource for our antibody discovery and characterization needs.
Materials and methods
Material and equipment
Antibodies used in the studies were produced in house from transiently or stably transfected CHO cells. All chemicals and reagents were purchased through Fisher Scientific, and commonly used buffers were prepared from pre-made concentrated stock solutions provided by CORNING. Bovine thyroglobulin was purchased from EMD Millipore. The chromatographic instruments for all the purifications are Protein Maker from Protein BioSolutions and AKTA pure 25 M from Cytiva Life Sciences (formerly GE Healthcare Life Science) with an ALIAS autosampler from iChrom Solutions. 1 mL MabSelect PrismA and 16 × 600 mm Superdex 200 columns were purchased from Cytiva Life Sciences. 30 × 300 mm or 21 × 300 mm SRT-10 C SEC-300 columns were produced by Sepax Technologies. Protein analysis was performed on a 1260 HPLC instrument with a multisampler from Agilent, DropSense (Lunatic) spectrophotometer from Unchained Labs, LabChip GX Touch II from Perkin Elmer, and Endosafe-PTS or Endosafe-MCS from Charles River Laboratories. Analytical columns, such as 2.1 × 30 mm POROSTM G 20 affinity column from Thermo Fisher Scientific, 4.6 × 150 mm BEH200 aSEC column from Waters, and 4.6 × 300 mm SuperSW3000 aSEC column from Tosoh, were purchased for HLPC Protein G titer and aSEC analysis. HT Protein Express LabChip and Protein Express Reagent Kit were purchased from Perkin Elmer for the ceSDS method. Charles River Endosafe LAL Cartridge (0.1–10 EU/mL) from Charles River Laboratories was used for endotoxin measurement.
Protein A loading range and elution volume determination
The loading range of the protein A columns attached to Protein Maker was verified by capturing 0.5–150 mg of a purified control antibody spiked in freshly prepared culture media, loaded to two 1 mL MabSelect PrismA columns, either new or used columns (> 100 cycles). The columns were equilibrated with phosphate-buffered saline (PBS) at pH 7.4. The sample was loaded at a flow rate of 2 ml/min, washed with 10 CVs of PBS, and then eluted with either 3 or 4 CVs of 25 mM acetic acid (pH 3.0) and 50 mM sodium chloride. The eluate was collected into a 24-well plate pre-filled with 1 M Tris(hydroxymethyl)aminomethane (Tris) (0.6 ml or 0.8 mL, pH 8, depending on elution volume) buffer for neutralization. A sample (50 uL) was removed, and the concentration was measured to calculate the protein recovery, while purity was determined by aSEC.
Preparative size exclusion column selection and process parameter evaluation
A comparison of preparative size exclusion columns, 30 × 300 mm SRT-10 C 300-SEC column and the 16 × 600 mm Superdex 200 column, was conducted using duplicate runs of a purified control antibody spiked with bovine thyroglobulin. A mixture of antibody and thyroglobulin at 4 mg/mL, containing 87% antibody monomer, 11% aggregates from antibody and thyroglobulin, and 2% fragments from antibody determined by aSEC, was injected to the column after equilibration with PBS (pH 7.4). Columns were loaded at approximately 5% volume, 6 mL for Superdex 200 and 9 mL for SRT, respectively. The flow rate was set per manufacturer’s recommendation with the SRT column at a much higher flow rate of 7.5 mL/min and Superdex 200 at a flow rate of 1.5 mL/min. The protein effluent was collected for A280 concentration and aSEC purity determination. The resolution between monomer and aggregates was calculated from the retention volume and peak width at half height of two peaks based on the following algorithm, [(Volume peak2 – Volume peak1)/((Width 1/2, peak2 + Width ½, peak1)/2)], within UNICORN software on an AKTA pure instrument, and used together with effluent volume change, protein recovery, and aSEC purity to assess the performance of SRT-10 C column against Superdex 200.
A full factorial DoE study was conducted using the same mixture of antibody and thyroglobulin to identify the critical process parameters affecting the protein quality and recovery. Parameters tested for the pSEC process on a 30 × 300 mm SRT-10 C 300-SEC column (Sepax) were loading volume (2, 6, 8 mL), concentration (2, 7, 12 mg/mL), and flow rate (5, 7.5, 10 mL/min). The protein effluent was fractionated (1.5 mL fractions) in 96-well plates and fractions containing monomeric antibody were pooled. Samples were placed into a 96-well plate for final analysis by A280 concentration and aSEC. The effects of these different parameters on resolution, recovery, and purity were monitored for statistical evaluation in JMP software (Ver.14.1.0) from SAS Institute Inc. The prediction model and p-values were generated from this analysis to determine the goodness of fit and the impact of process parameters on resolution, recovery, and yield. We determined that the correlation was strong if Rsq was greater than 0.75, while the effect was significant if the p-value was less than 0.05 with 95% confidence.
Semi-automated purification process with protein maker and AKTA pure/Autosampler
In the Protein A affinity step, buffer (A) (0.1 M Tris and 0.15 M sodium chloride (pH 7.5)) was used for equilibration/wash, while buffer (B) (25 mM acetic acid at pH 3.0 with 50 mM sodium chloride) was applied for elution. Supernatants from CHO expression were weighed and PBS buffer was added as needed, so that all 24 lines had equal volume for parallel loading. Adjusted supernatants were loaded to 2 × 1 mL MabSelect PrismA columns at 2 mL/min. In this step, multiple sample lines can be used if the total protein amount of one sample exceeded the maximum column capacity. After a wash step with 10 CVs of buffer (A), protein was eluted by 6 mL buffer (B). The column was cleaned as described in CIP procedure (see below) and stored in buffer (A). The sample was collected into a 24-well plate with pre-added 0.6 mL 1 M Tris pH 8. After mixing, an aliquot of 30 uL was removed into the 96-well plate for A280 and aSEC analysis.
The 24-well plate was transferred to an ALIAS autosampler with the sample chamber temperature maintained at approximately 4°C. The SRT-10 C 300-SEC column was pre-equilibrated by PBS buffer at an appropriate flow rate. The protein sample was loaded to the column through the autosampler 10 mL loop and sample pump and eluted with one CV of PBS buffer. 1.5 mL fractions were collected into 96-well deep plates based on pre-set A280 cutoff (1–2 mAU/mg protein at 2 mm path length in the AKTA pure instrument). The fractions were pooled in accordance with aSEC purity, followed by a filtration through a 0.22 um filter. A sample was removed for all final analytical characterizations. After each run, the column was cleaned with an established CIP procedure.
In order to evaluate the reproducibility of the entire process, two antibodies, mAb1 and mAb2, were produced from CHO stable culture with titer at 2720 mg/mL and 2531 mg/mL, respectively. 240 mL of mAb1 and 272 mL of mAb2 were harvested, and each mAb was purified through the entire process. The loading of each sample line on the Protein Maker was at 27.2 mg for mAb1 and 28.7 mg for mAb2. Samples were taken for A280/purity measurement, and the recovery was calculated against the loading amount.
Cleaning-in-place procedure
After sample elution from Protein A capture, the MabSelect PrismA column was cleaned with three CV of 0.1 N sodium hydroxide and 0.1 M sodium chloride buffer and then stored in 0.1 M Tris and 0.15 M sodium chloride pH 7.5. All sample lines were completely flushed with 0.5 N sodium hydroxide before and after the run.
To establish an effective cleaning procedure for the SRT-10 C column with IPA aqueous solution, a purified control antibody at 2 mg/mL alone and a mixture of antibody with bovine thyroglobulin at 3 mg/ml containing 3137 EU/mL endotoxin were used for testing. After the antibody/thyroglobulin mixture passes through the column, it was first washed with one CV of 70% IPA solution followed by one CV of PBS before injecting the pure antibody sample. The eluants from both injections were collected for concentration and endotoxin measurement; the protein and endotoxin recovery were calculated relative to the loading amount. This experiment was repeated for IPA wash at 50%, 25%, 10%, and PBS only. The results from the PBS only wash was served as the baseline for calculating the endotoxin clearance.
Analytical methods for protein characterization
HPLC protein G titer assay:
A 2.1 x 30mm POROSTM G 20 Protein G affinity column (0.1 mL) was attached to Agilent 1260 HPLC instrument and equilibrated with PBS buffer. 100 uL supernatant was injected to the column, followed by 4 mL PBS wash and 4 mL elution buffer of 0.02% formic acid at a flow rate of 2 mL/min. The total run time for each sample is 6 minutes. A nine-point standard curve ranging from 7.5 ug/mL to 2 mg/mL was established from the elution A280 peak area of a purified control antibody standard. The supernatant titer was calculated by comparing the sample elution peak to the standard curve.
A280 concentration determination:
2 uL of samples and buffer blank were transferred from 96-well plate to a lunatic plate for UV absorbance measurement at 280 nm by a DropSense instrument. The protein concentration was calculated from the corresponding molar extinction coefficient based on the amino acid sequence.
Analytical size exclusion chromatography:
A 4.6 x 150 mm BEH200 aSEC column was used to determine the purity on an Agilent 1260 HPLC instrument. The running buffer was 50 mM sodium phosphate at pH 6.8 and 0.3 M sodium chloride. The method was performed at a flow rate of 0.3 mL/min for 8 min. 4 uL sample at 1 mg/mL was injected to the column, and signals at 214 nm and 280 nm were collected for peak analysis and integration. SuperSW3000 (4.6 x 300 mm) was used as an alternative. All running conditions were the same for the SuperSW3000 column except for a longer running time of 20 min and an injection volume of 20 uL.
Capillary electrophoresis (ceSDS):
Analysis was performed following the Protein Express Assay Quick Guide from Perkin Elmer on the LabChip CXII Touch system. 2 uL sample at 1 mg/mL concentration was transferred into a PCR plate mixing with a 7 uL Protein Express Sample Buffer with/without 34 mM dithiothreitol and then heated at 70°C for 10 minutes. 35 uL MilliQ water was added to the solution, which was centrifuged at 3000 RPM for 5 minutes. The chip and reagents were prepared in accordance with the instruction. Samples were analyzed using the HT Antibody Analysis 200 method. The LabChip GX Review software was used to analyze the results for molecular weight and purity.
Endotoxin test:
Samples were diluted into cell culture water or endotoxin free water at an appropriate dilution factor, typically 5- to 10-fold for regular sample and up to 1000-fold for high endotoxin containing samples, and 25 uL was added into each of the four wells in a Charles River Endosafe cartridge (0.1–10 EU/mL) for measurement on Endosafe-PTS or Endosafe-MCS equipment.
Abbreviations
A280: absorbance at 280 nm
aSEC: analytic size exclusion chromatography
ceSDS: capillary electrophoresis
CHO: Chinese hamster ovary
CIP: clean-in-place
CV: column volume
DoE: design of experiment
HPLC: High performance liquid chromatography
HTP: high throughput
IPA: isopropyl alcohol
mAb: monoclonal antibody
NR ceSDS: non-reduced capillary electrophoresis
PBS: phosphate-buffered saline
pSEC: preparative size exclusion chromatography
Rsq: coefficient of determination
SDS-PAGE: sodium dodecyl sulfate polyacrylamide gel electrophoresis
Tris: Tris(hydroxymethyl)aminomethane
UV: ultraviolet
Supplemental Material
Download Zip (2.1 MB)Acknowledgments
The authors are very grateful for the support of antibody expression from Henry Koo, Marissa H Piper, and Dr. Marina Alvi; the initial clean-in-place method evaluation from Megan Modina; and valuable discussions with Dr. John M Beals and Dr. Suntara Cahya.
Funding
Funding for these studies was provided by Eli Lilly and Company.
Disclosure statement
No potential conflict of interest was reported by the author(s).
Supplementary material
Supplemental data for this article can be accessed on the publisher’s website
References
- Schmidt PM, Abdo M, Butcher RE, Yap M-Y, Scotney PD, Ramunno ML, Martin-Roussety G, Owczarek C, Hardy MP, Chen C-G, et al. A robust robotic high-throughput antibody purification platform. J Chromatog A. 2016;1455:9–10. doi:10.1016/j.chroma.2016.05.076.
- Evans ST, Stewart KD, Afdahl C, Patel R, Newell KJ. Optimization of a micro-scale, high throughput process development tool and the demonstration of comparable process performance and product quality with biopharmaceutical manufacturing processes. J Chromatog A. 2017;1506:73–81. doi:10.1016/j.chroma.2017.05.041. PMID: 28551021.
- Luan P, Lee S, Arena TA, Paluch M, Kansopon J, Viajar S, Begum Z, Chiang N, Nakamura G, Hass PE, et al. Automated high throughput microscale antibody purification workflows for accelerating antibody discovery. mAbs. 2018;10(4):624–35. doi:10.1080/19420862.2018.1445450.
- Barnard GC, Hougland MD, Rajendra Y. High throughput mAb expression and purification platform based on transient CHO. Biotechnol Prog. 2015;31(1):239–47. doi:10.1002/btpr.2012.
- Smith ER, Begley DW, Anderson V, Raymond AC, Haffner TE, Robinson JI, Edwards TE, Duncan N, Gerdts CJ, Mixon MB, et al. The protein maker: an automated system for high‐throughput parallel purification. Acta Cryst. 2011;67(9):1015–21. doi:10.1107/s1744309111028776.
- Helie G, Parat M, Masse F, Gerdts CJ, Loisel TP, Matte A. Application of the protein maker as a platform purification system for therapeutic antibody research and development. Comput Struct Biotechnol J. 2016;14:238–44. doi:10.1016/j.csbj.2016.06.001. PMID: 27418955.
- Yoo D, Provchy J, Park C, Schulz C, Walker K. Automated high-throughput protein purification using an AKTApurifier and a CETAC autosampler. J Chromatog A. 2014;1344:23–30. doi:10.1016/j.chroma.2014.04.014. PMID: 24768125.
- Zhang C, Long AM, Swalm B, Charest K, Wang Y, Hu J, Schulz C, Goetzinger W, Hall BE. Development of an automated mid-scale parallel protein purification system for antibody purification and affinity chromatography. Protein Expr Purif. 2016;128:29–35. doi:10.1016/j.pep.2016.08.005. PMID: 27498022.
- Schmitz S, Schonfeld DL, Freitag B, Gotzberger-Schad C, Fischer M, Linden L. Keeping pace with the increasing demand for high quality drug candidates in pharmaceutical research: development of a new two-step preparative tandem high performance chromatographic system for the purification of antibodies. J Chromatog B. 2019;1104:18–28. doi:10.1016/j.chromb.2018.11.005.
- Becker W, Scherer A, Faust C, Bauer DK, Scholtes S, Rao E, Hofmann J, Schauder R, Langer T. A fully automated three-step protein purification procedure for up to five samples using the NGC chromatography system. Protein Expr Purif. 2019;153:1–6. doi:10.1016/j.pep.2018.08.003.
- GE Healthcare Life Sciences. MabSelect PrismA affinity chromatography. Instruction 29262586 AD. 2019;1–32.
- GE Healthcare Life Sciences. Lifetime performance study of MabSelect PrismA during repeated clean-in-place cycles. Application Note KA1061080618AN. 2018;1–4
- Shukla AA, Hubbard B, Tressel T, Guhan S, Low D. Downstream processing of monoclonal antibodies - Application of platform approaches. J Chromatog B. 2007;848:28–39. doi:10.1016/j.jchromb.2006.09.026.
- Schwarz H, Schmittner M, Duschl A, Horejs-Hoeck J, Li L. Residual endotoxin contaminations in recombinant proteins are sufficient to activate human CD1c+ dendritic cells. PLOS One. 2014;9(12):e113840. doi:10.1371/journal.pone.0113840. PMID: 25478795.
- Malyala P, Singh M. Endotoxin limits in formulations for preclinical research. J Pharm Sci. 2008;97(6):2041–44. doi:10.1002/jps.21152. PMID: 17847072.