
 ?Mathematical formulae have been encoded as MathML and are displayed in this HTML version using MathJax in order to improve their display. Uncheck the box to turn MathJax off. This feature requires Javascript. Click on a formula to zoom.
ABSTRACT
The higher order structure (HOS) of monoclonal antibodies (mAbs) is an important quality attribute with strong contribution to clinically relevant biological functions and drug safety. Due to the multi-faceted nature of HOS, the synergy of multiple complementary analytical approaches can substantially improve the understanding, accuracy, and resolution of HOS characterization. In this study, we applied one- and two-dimensional (1D and 2D) nuclear magnetic resonance (NMR) spectroscopy coupled with chemometric analysis, as well as circular dichroism (CD), differential scanning calorimetry (DSC), and fluorescence spectroscopy as orthogonal methods, to characterize the impact of methionine (Met) oxidation on the HOS of an IgG1 mAb. We used a forced degradation method involving concentration-dependent oxidation by peracetic acid, in which Met oxidation is site-specifically quantified by liquid chromatography-mass spectrometry. Conventional biophysical techniques report nuanced results, in which CD detects no change to the secondary structure and little change in the tertiary structure. Yet, DSC measurements show the destabilization of Fab and Fc domains due to Met oxidation. More importantly, our study demonstrates that 1D and 2D NMR and chemometric analysis can provide semi-quantitative analysis of chemical modifications and resolve localized conformational changes with high sensitivity. Furthermore, we leveraged a novel 15N-Met labeling technique of the antibody to directly observe structural perturbations at the oxidation sites. The NMR methods described here to probe HOS changes are highly reliable and practical in biopharmaceutical characterization.
Introduction
In recent years, monoclonal antibodies (mAbs) have become a predominant class of biotherapeutics to treat cancers, metabolic disorders, autoimmune, and rare diseases.Citation1–3 Pharmaceutical companies and scientific institutes invest substantial resources into the development of mAb therapeutics due to their high specificity, low toxicity, and fewer adverse side effects.Citation1,Citation4 The number of mAbs approved by the US Food and Drug Administration (FDA) has grown significantly since 2018, with a potential to accelerate further with the advancement of new biological and analytical technologies.Citation4 The importance of accurate protein folding and consistent higher order structure (HOS) to the in vivo biological functions of mAbs cannot be overstated, especially as the sophistication of therapeutic protein structures increases. In new drug applications for mAbs, researchers must demonstrate a correctly folded HOS of these therapeutics to carry out the expected biological functions. HOS is a multi-factor attribute that includes secondary, tertiary, quaternary, quinternary, and oligomeric structures.Citation5 Since HOS is considered a quality attribute that could affect clinical safety and efficacy, robust and sensitive analytical characterization of HOS is critical to the therapeutic development of a mAb candidate.Citation6–8
Early-stage development of mAbs focuses on biochemical and biophysical properties evaluations, including structural integrity, posttranslational modifications (PTMs), and stability.Citation9 Due to their inherent structural complexity, mAbs are susceptible to many types of modifications, such as glycosylation, terminal heterogeneity, oxidation, deamidation, and isomerization during manufacture and storage.Citation10–12 Methionine (Met) oxidation is one of the most observed modifications that can potentially affect the bioactivity of an antibody.Citation13–16 Oxidation of IgG Met residues in the Fc region has been shown to impair neonatal Fc receptor (FcRn) binding and consequently alter the pharmacokinetics of these antibodies.Citation13 High levels of oxidized Met252 (~40%) and Met428 had minimum impact on the antibody serum half-life (similar to the control), but ~ 80% oxidation caused a 4-fold reduction in half-life.Citation16,Citation17 The impact of Met oxidation on protein HOS attracts increasingly more interest considering the essential roles of Met in the biological activities of therapeutic proteins.Citation18–23 However, common biophysical techniques that probe mAb HOS, such as circular dichroism (CD), infrared (IR), fluorescence, and Raman spectroscopy, report on the global structure with low to moderate resolution.Citation24 These techniques generally report on the sum of the whole mAb, and thus it is difficult to determine which part of the protein contributes to the signal change. Mass spectrometry (MS), especially hydrogen-deuterium exchange (HDX) MS provides high-resolution structural information that can pinpoint where the conformation changes occur. However, data collection can be time-consuming, low-throughput, and thus challenging as an application in biologics development.Citation25,Citation26 Like HDX-MS, fast photochemical oxidation of proteins MS provides the capability to obtain residue-level resolution data on protein structure.Citation27,Citation28
Nuclear magnetic resonance (NMR) spectroscopy is a well-established method for analyzing protein structure at an atomic resolution and is routinely used for structure determinations of small and medium-sized proteins.Citation27,Citation29 The development of new isotopic labeling techniques has expanded the capability of NMR structure determination to large proteins up to approximately 80 kDa.Citation30 However, the application of NMR spectroscopy to the structure determination of mAbs remains challenging due to their relatively high molecular weight of ~ 150 kDa and difficulties with isotopic enrichment in mammalian cell expressions. Novel isotopically labeling schemes of mAbs can improve the sensitivity of NMR characterization and enable the selective observation of certain residues or chains.Citation31,Citation32 The high molecular weight, and thus slow tumbling rate of mAbs in solution, often results in significant line broadening in NMR spectra and thus poor data resolution and sensitivity. To overcome these challenges, NMR characterization of mAbs has relied on one- and two-dimensional (1D and 2D) NMR fingerprinting methods and chemometric analysis for sensitive and robust HOS assessments because 1D and 2D NMR spectra contain rich information on chemical composition and the entirety of the protein structure hierarchy.Citation33–41 NMR and chemometric methods can provide a quantitative evaluation of protein HOS using 1D PROtein Fingerprint by Line shape Enhancement method (PROFILE), principal component analysis (PCA), combined chemical shift deviation (CCSD), and easy comparability of HOS (ECHOS).Citation34,Citation37,Citation42
The PROFILE method extracts the unique 1D fingerprint of mAbs by subtracting out excipient peaks and broad features from the spectrum, which allows for the detection of differences in sample composition and chemical identification with enhanced sensitivity.Citation37 PROFILE provides a semi-quantitative comparison of sample differences using a similarity score.Citation43,Citation44 The similarity score provides robust analysis for intergroup comparison between stressed samples and the control given that the spectral quality and processing are consistent.Citation45 FDA-based researchers successfully leveraged PCA and Mahalanobis distance (DM) measurements of 1D 1H spectra to assess HOS similarity of marketed insulin biosimilars.Citation36 Additionally, a study led by researchers at the National Institute of Standards and Technology (NIST) demonstrated the robustness of PCA in examining the HOS of NISTmAb via the 2D methyl 1H-Citation13C NMR spectra collected across different academic, industrial, and research laboratories from different countries.Citation34 The peak pattern of methyl groups is a direct reporter on the chemical and structural environment of mAb residues and thus can be used as a fingerprint to evaluate HOS changes. This approach is sensitive in detecting the changes of rotational correlation times of mAbs due to differences in the global structure.Citation44 PCA analysis of 2D 1H-Citation13C methyl NMR spectra also enabled the identification of local structural modifications of IgG1 upon oxidation conditions.Citation18,Citation22 CCSD analysis conducted on the 2D methyl NMR spectra showed high reproducibility across several labs and instrumentation further establishing the robustness of NMR chemometrics for HOS comparability studies.Citation34 The ECHOS method provides a straightforward approach to evaluate HOS similarity between two samples via the correlation coefficient derived from a linear regression of the binned intensities of 2D NMR spectra.Citation42 Though PROFILE, PCA, ECHOS and CCSD have been demonstrated as powerful in detecting HOS variations in a handful case studies, this case study was designed to explore their complementarity in structural characterization, using Met forced oxidation as an example. Furthermore, we wanted to demonstrate the synergy of NMR chemometric techniques and other traditional biophysical methods in providing comprehensive HOS characterization. We also evaluated the feasibility of using 15N-Met as handles to observe changes in the backbone amides upon Met oxidation by NMR.
Our study molecule, designated mAb1, belongs to the immunoglobulin isotype gamma-1 with kappa light chains (IgG1κ) subfamily of mAbs. To improve NMR experimental sensitivity and selectivity, we prepared 15N Met-isotopically-labeled mAb1 via cell culture processing and ProA affinity purification to enable the characterization of backbone amide resonances at potential Met oxidation sites. mAb1 samples were oxidized under peracetic acid (PAA) accelerated conditions with increasing concentrations of PAA. When mAbs were treated with PAA, only Met residues were oxidized, and Met sulfoxide is the only product.Citation23 We carried out a multitude of biophysical techniques, including far- and near-UV CD spectroscopy, fluorescence spectroscopy, and DSC as complementary methods, to measure the changes in secondary structure, tertiary structure, and conformational stability. Chemometric analysis by PROFILE, PCA, CCSD, and ECHOS on the 1D and 2D NMR spectra of a control sample and oxidatively stressed samples provide a metric assessment of the HOS profile. This investigation demonstrates the versatility and sensitivity of NMR in mAb HOS characterization relative to traditional biophysical techniques, as well as the sensitivity gain of using isotopically labeled mAb samples.
Material and methods
Materials
mAb1 is an investigational IgG1 kappa antibody produced by Pfizer. Common chemicals, including histidine, ethylenediaminetetraacetic acid (EDTA), and 10% (w/w) polysorbate 80 (PS80) solution, and PAA, were purchased from Sigma (St Louis, MO). 15N-Met (Cat number: 19J–0477) was purchased from Cambridge Isotope Laboratory (Tewksbury, MA).
15N-Met isotopic labeling and purification
Natural abundance and 15N-Met specifically labeled mAb1 were produced by Chinese hamster ovary cell lines. Cells were passaged in a passaging/scale up chemical defined in-house media first in shake flasks in an incubator at 36.5°C with 5% CO2. Then, the cell culture was spun-down and resuspended at 2 eCitation6/mL seeding density in 500 mL shake flask (50 mL working volume) in a production media, which has the same formulation as the in-house production media except with 15N labeled Met and without unlabeled Met. Production culture is a 5-day batch culture with glucose feed only as needed and pH was adjusted to 7.2 once daily after day 2 until harvest using a 0.94 M Na2CO3/0.06 M K2CO3 titrant solution. A final cell density of around 20 × 10Citation6/ml and titer of ~0.5 g/L were reached at the harvest day.
Harvested conditioned medium suspensions were centrifuged, and the supernatants were filtered through a 0.2 PES membrane before further purification. The filtered conditioned medium was purified by a protein A column (MabSelect SuRe LX from Cytiva) using an AKTA pure 25 from Cytiva. The material was loaded on a 20 cm x 1 cm protein A column (MabSelect SuRe LX from Cytiva) at approximately 50 g/L-resin load challenge and then washed and eluted with 150 mM glycine buffer pH 3.5.
The elution pool was then neutralized to pH 7 with 221 mM HEPES pH 7.5. The pH adjusted pool was loaded to a 10 cm x 1 cm AEX column (Fractogel EMD TMAE HiCap) with a load challenge of approximately 100 g/L-resin and washed with 50 mM HEPES, 65 mM NaCl pH 7.00 using a residence time of 5 min. The TMAE pool was concentrated to 30 g/L using Amicon Ultra-15 30 kD MWCO centrifugal filters from MilliporeSigma (Burlington, MA).
Oxidized sample preparation
PAA stock solution was added to mAb1 stock solution in histidine buffer (20 mM histidine, 0.15 mM EDTA, 0.02% (w/w) PS80 pH 5.8) to reach PAA levels of 5%, 10%, 25%, 50%, and 100% with respect to a total of Met residues. The amount of PAA added is calculated based on the molar amount of Met residues in the molecule. The stressed samples and control without PAA were covered with aluminum foil to prevent light exposure and incubated at room temperature for 2 hrs. Then all samples were applied to 2 mL Zeba spin desalting columns from ThermoFisher (Waltham, MA) and spun at 1000 g in a bench-top centrifuge for 2 min to remove excessive PAA, quench the reaction and collect the samples. The columns were pre-equilibrated with the histidine buffer. The final solutions containing mAb1 were collected and stored in a − 80°C freezer for MS, biophysical, and NMR analysis. The concentration of the mAb1 sample solutions was determined by ultraviolet measurement at 280 nm with Nanodrop Spectrophotometer from Thermo Scientific (Waltham, MA).
Samples for 15N-Met NMR analysis were prepared by incubating 15N-Met specifically labeled mAb1 and PAA at 5%, 25%, and 100% and following the procedure above. The final protein concentration was about 25 mg/mL in histidine buffer containing 10% D2O and 0.004 wt % sodium 4,4-dimethyl-4-silapentane-1-sulfonate.
MS analysis of intact mAb1
ESI MS analysis of the intact mAb was performed before and after 15N methionine-labeled using size exclusion chromatography (SEC) coupled to a Bruker Daltonics (Billerica, MA) maXis QTOF mass spectrometer (resolving power of 30,000). The mAb was diluted to 1 mg/mL, and a 5 µL aliquot was injected onto a BEH200 SEC column, 1.7 µm, 4.6 × 150 mm (Waters, Milford, MA). A mobile phase of 70% deionized water (diH2O)/30% ACN (v/v) with 0.05% trifluoroacetic acid (TFA) (w/v) was used to isocratically elute (and desalt) the mAb. A run time of 15 minutes, flow rate of 0.2 mL/min, column temperature of 30°C, and detection at 214 and 280 nm were used. Mass analysis of the protein was performed using a mass range of m/z 600 to m/z 5000 and the following instrument parameters: nebulizer 1.6 bar, dry gas 8 L/min, capillary voltage 4500 V, iscid 170 eV, CE 15 eV, and dry temperature 200°C. Instrument calibration was performed with Agilent ESI-L tune mix (Agilent, Santa Clara, CA) followed by lock mass correction using the ion at m/z 1221.9906. Observed masses were determined from the zero-charge mass spectra following deconvolution of the multiply charged mass spectra with the Maximum Entropy algorithm in DataAnalysis software. Deconvolution parameters consisted of the following: deconvolution mass range: 120,000–180,000 Da, deconvolution data point spacing: 0.1 m/z, sum peak, mass list signal to noise (S/N) threshold: 1, mass list absolute intensity threshold: 150.
Peptide mapping by LC-MS/MS
Prior to digestion, samples were diluted to a concentration of 1 mg/mL with denaturation buffer (7 M guanidine-HCl, 100 mM Tris, pH 8.3, 5 mM L-methionine). Disulfide bonds were reduced by adding 2.4 µL of 500 mM dithiothreitol for 30 min at 30°C and alkylated with 6 µL of 500 mM sodium iodoacetate for 30 min at room temperature in the dark. Following reduction and alkylation, samples were desalted using IMCS SizeX100 (Chicago, IL) desalting tips on a Hamilton liquid handler automation systemCitation46 and digested with arginine/lysine specific protease, trypsin (Promega) using an enzyme:substrate mass ratio of 1:10 (w/w) at 37°C for 1 h. Following digestion, the samples were acidified using 2 µL TFA and stored at − 80°C prior to analysis.
Digested samples were injected onto a Waters XSelect XP CSH C18 column, 2.5 µm, 2.1 × 150 mm (Milford, MA) heated to 40°C. Peptides were separated using a 3-hour gradient with 0.1% formic acid in water as mobile phase A and 0.1% formic acid in 95% acetonitrile (ACN) as mobile phase B. LC/MS and LC/MS/MS experiments were performed on a Waters Premier UHPLC system with UV detection at 214 and 280 nm, coupled to an ultrahigh resolution Thermo Scientific Orbitrap Fusion tribrid mass spectrometer (Waltham, MA). The mass spectrometer was operated in the positive ion mode with a scan range of m/z 300 to m/z 2000.
Relative quantification of oxidized peptides was performed using Thermo Xcalibur qual browser (Waltham, MA). Extracted ion chromatograms (EICs) were obtained for each Met and 15N-Met containing and oxidized proteolytic peptide using the most abundant m/z value (monoisotopic value). The relative percentage of each oxidized peptide was determined using the manually integrated EIC peak areas under the extracted ion chromatogram profiles. The relative percentage of oxidation was estimated by dividing the peak area of the oxidized peptide peak by the sum of the peak areas for the expected (unmodified) and oxidized peptide.
Differential scanning calorimetry
Samples were diluted to 0.6 mg/mL using histidine buffer. DSC scans were performed using MicroCal PEAQ-DSC system equipped with an autosampler from Malvern Panalytical (Malvern, UK). Samples and buffer were placed in a 96-well plate and sampled using the robotic attachment. Scans ran from 25°C to 95°C at 100°C/hr. The buffer and samples were acquired in an alternative order. Three scans were performed. Data analysis, including baseline subtraction and fitting, is performed using the Microcal PEAQ-DSC software Version 1.61 (Malvern, UK). The melting transition temperature (Tm) and enthalpy (∆H) were determined with the non-two-state unfolding model within the software.
Far- and near-UV circular dichroism spectroscopy
Oxidized mAb1 and the control in histidine buffer were diluted to about 1 mg/mL and used for CD measurements on an automated Chirascan Plus spectrometer (Applied Photophysics, UK). The samples were loaded in a 96-well plate and sampled using an autosampler. Far-UV CD spectra were acquired in triplicate using a 0.1 mm path length cuvette at 20°C. Spectra from 195 to 260 nm were acquired in a 0.1 nm monochromator bandwidth, 3 s signal averaging and a step size of 0.5 nm. The near-UV CD spectra were acquired from 250 nm to 360 nm in a 5 mm path length cuvette, 1.5 nm monochromator bandwidth, 3 s signal averaging and a step size of 0.5 nm. Three replicates were acquired for each sample. The triplicate spectra were averaged at each data point, and the average molar CD (∆ε) values were plotted. Similarity scores of sample spectra were calculated by comparison with reference spectra in Area of Overlap from qBiC software (Applied Photophysics, UK).
Fluorescence spectroscopy
Intrinsic tryptophan fluorescence spectra were recorded on SpectraMax M5 Multi-mode Microplate Reader (Molecular Devices, San Jose, CA). Oxidized mAb1 and the control were diluted to about 0.2 mg/mL and loaded on a 96-well plate. The emission spectrum was recorded from 300 nm to 400 nm width following excitation at 280 nm wavelength. The measurement was performed in triplicate. The buffer-corrected fluorescence emission spectra were plotted as a function of the wave number. The maximum emission was plotted for each condition.
Size exclusion chromatography
Samples at ~2.0 mg/mL were injected to a YMC-Pack Diol-200 column (Kyoto, Japan) on a Waters Alliance HPLC system (Milford, MA). The column temperature was 30 ± 2°C. The mobile phase was 20 mM sodium phosphate, 400 mM sodium chloride, pH 7.2. Flow rate was 0.75 mL/min and run time was 40 min.
NMR spectroscopy
All NMR spectra were acquired on a Bruker NEO 800 MHz spectrometer (Billerica, MA) equipped with a 5 mm HCN TCI cryoprobe and a sample temperature of 35°C. 1D 1H NMR spectra were collected with four replicates for each sample using the Pulsed Field Gradient Stimulated Echo (PGSTE) pulse sequence (stebpesgp1s1d). The spectral width was set to 15.6 ppm and the acquisition time was 1.31 s. Each spectrum was averaged over 1024 repeated scans with a recycle delay of 2.5 s. The 1H 90° pulse was optimized for each sample and typically ranged from 7.80 to 7.90 µs. The diffusion delay is 60 ms with a diffusion gradient field strength of 98% over 2 ms. The 2D 1H-Citation13C methyl heteronuclear multiple quantum correlation (HMQC) NMR spectra were acquired in triplicate using the “afhmqcetgpph” pulse sequence. The spectral widths for 1H and 13C were 15.6 and 30.0 ppm, respectively. Data points acquired for direct and indirect dimensions are 2048 and 256 resulting in an acquisition time of 0.08 s and 0.02 s, respectively. A recycle delay of 0.5 s was used, resulting in an experimental time of approximately 5.5 h. The 2D 1H-15N spectra were acquired with selective optimized flip angle short transition pulsing using the “sfhmqcf3gpph” pulse sequence. The spectral widths for direct (1H) and indirect (15N) dimensions were 15.6 and 35.0 ppm, respectively. Data points acquired for direct and indirect dimensions were 2048 and 128 resulting in an acquisition time of 0.08 s and 0.02 s, respectively. 2D 1H-Citation15N Heteronuclear Single Quantum Correlation (HSQC) spectra were recorded with a recycle delay of 0.1 s. The experimental time was approximately 3 h.
The processing of 1D and 2D spectra was performed in MestReNova Version 14.1 and included common steps including zero filling, phase correction, Fourier Transform, and baseline correction. To improve spectra quality, the 1DCitation1H spectra were processed with −1.0 Hz exponential apodization and 2.90 Hz Gaussian apodization. 2D 1H-13C and 1H-15N spectra were processed with 90° and 60° sine square apodization in the direct and indirect dimensions, respectively. Noise level of the 2D NMR spectra were reduced using variable of interest compression to improve the quality of the spectra and chemometric analysis.Citation47
Chemometric analysis
The chemometric analyses were performed using the MBioHOS plugin application for MNova (version 14.1) developed by Mestrelab Research, S.L. (Santiago de Compostela, Spain). Regions of unsuppressed excipient peaks or no protein signals were blinded and excluded from the analysis for 1D and 2D spectra and included the following regions: −3.1—0.5 ppm, 0.83–0.92 ppm, 1.2–1.44 ppm, 1.52–1.65 ppm, 1.9–2.1 ppm, 2.2–2.44 ppm, 3.4–5.9 ppm and 9.0–8.12.5 ppm. The PROFILE and PCA analysis of 1D 1H spectra were performed on both the aliphatic region and amide/aromatic regions of the spectra.
A broadening factor of 100 Hz was applied for the PROFILE analysis and the correlation coefficient (R value) for the comparison between two spectra were converted to the MNova-defined similarity factor (S) using the following equation:
The statistical limits, mean ± 2SD, of the intra-sample similarity score, was calculated to help evaluate the differences among stressed and control samples. The standard deviation (SD) was estimated as the within-group variance with the assumption of equal variability in the instrument across all samples.
The binning for the PCA used bin sizes of 0.01 ppm. The summed spectral intensities within each bin were then normalized to the sum of the bins, center-scaled, and bins with a mean value less than 5 were excluded. The shaded regions in the scores plot are the 95% confidence ellipses. The Mahalanobis distances (DM) were calculated between clusters for each sample within the MNova MBioHOS software.Citation36 The binning of 2D 1H-Citation13C methyl HMQC spectra for PCA used bin sizes of (0.03 ppm, 0.3 ppm) using the average sum method and normalized to the sum of the bins. A mean 5.0 filtering method is used. The normalization method is set to “Sum” and the scaling method is “Only Centering”. The final output was an array of spectra intensity vectors as a function of binned points. A maximum of four components were considered in the analysis.
The noise threshold for ECHOS analysis was set by adjusting the contour level of the spectra to minimize the appearance of noise and maximize the appearance of sample signals (see ). The linear regression of the cross-correlation between pairs of 2D 1H-Citation13C methyl HMQC spectra of the oxidized and control samples were calculated and plotted, from which correlation coefficients (R values) were calculated.
For CCSD analysis, 2D 1H-Citation15N spectrum of the control sample was used as a reference spectrum and peak-picked to generate a peak list. The peak (P8) at (8.86 ppm, 126.9 ppm) was used as a reference, which is used to both align and scale spectra. The matching peaks in the stressed sample spectra were automatically determined, and CCSD for each peak pair was calculated by “Matrix Evaluation”. An average CCSD for the sample, which may represent an overall measure of the sample quality, was also computed. The peak amplitude ratio was also calculated.
Results
Characterization of methionine oxidation by peptide mapping
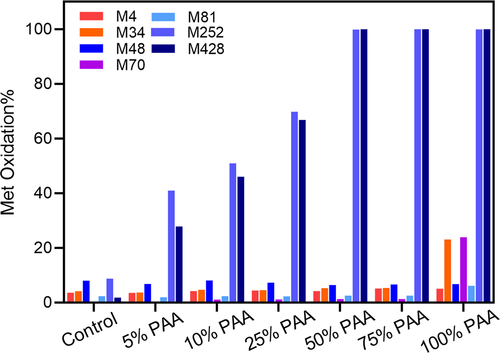
Our study molecule, mAb1, has two heavy chains (HC) and two light chains (LC) and is composed of an antigen-binding fragment (Fab) domain and a crystallization fragment (Fc) domain. mAb1 contains three Met residues in the Fc domain (Met252, Met358, and Met428 in HC), and five Met residues in the Fab domain (Met4 in LC, Met34, Met48, Met70, and Met81 in HC). PAA was used as a reactive oxidant that predominantly oxidizes Met residues in mAbs, yielding Met sulfoxide with a mass increase of 16 Da as the primary oxidation product.Citation23 LC-MS/MS peptide mapping was performed on the samples treated with PAA vs. the control to determine the relative levels of site-specific oxidation at each Met residue (see ). The PAA percentage is defined as the molar concentration ratio of PAA to the total number of Met residues in mAb1. Upon incubation with PAA, Met252 and Met428 in the Fc domain are preferentially oxidized and reach > 30% oxidation level at PAA concentrations as low as 5%, while Met358 shows oxidation level of less than 10% (data not shown). The oxidation levels of the Met252, Met358 and Met428 residues correlate with the concentration of PAA between 10% and 25% PAA, and are fully oxidized by 50% PAA. On the contrary, the oxidation levels of the Met residues in the Fab domain (Met4, Met34, Met48, Met70, and Met81) remain < 10% even at PAA concentrations as high as 50% and only Fab Met34 and Met70 oxidation increases significantly when the PAA level reaches 100%. These observations are consistent with previous studies that Met residues in the Fc domain are generally more prone to oxidation than those in the Fab domain.Citation23,Citation48
Figure 1. Met oxidation levels (%) in mAb1 by LC-MS/MS peptide mapping. The oxidation level for each Met residue is plotted with increasing percentage of peracetic acid (% PAA). The PAA percentage represents the molar concentration of PAA to the total molar concentration of Met residues in mAb1.
Thermal stability assessment of mAb1 upon methionine oxidation by DSC
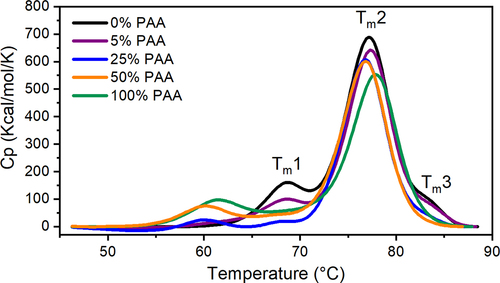
DSC evaluates the conformational stability of proteins or protein domains by identifying the melting temperatures (Tm) during unfolding through a temperature ramp. plots the thermal graph of mAb1 and Met-oxidized mAb1 samples. While Tm2 represents the melting temperature of the Fab, Tm1 designates the melting temperature of the CH2 domain, and Tm3 refers to the melting temperature of the CH3 domain,Citation49 and we note that both CH2 and CH3 domains comprise the Fc. Table S1 summarizes the melting temperatures of thermal transitions identified for the control mAb1 sample and oxidized mAb1 samples from the peak fitting of thermal graphs. The peak area represents the ∆H of domain unfolding. MAb1 shows three thermal transition temperatures with the CH2 domain identified at 68.6°C (Tm1), Fab domain at 77.1°C (Tm2) and CH3 domain at 83.5°C (Tm3). Met oxidation by the presence of PAA is shown to affect the conformational stability of mAb1. First, the peak area of Tm1 and Tm3 decreases with PAA oxidation and becomes zero when the PAA level is 50%. This suggests that both CH2 and CH3 domains of the Fc fragment become destabilized when Met252 and Met428 are oxidized. Consequently, two early thermal transitions appearing around 60°C (Tmα) and 71°C (Tmβ) are unique to the oxidatively stressed samples and the corresponding peak area increases with an increasing PAA concentration. This unique behavior in conformational stability observed in the stressed samples may suggest decreased stability of the oxidation products. The peak area of the melting transition for Fab (Tm2) also decreases when the PAA level increases indicating that the stability of Fab domain is perturbed. When MetCitation34 and Met70 of the Fab domain (refer to ) begin to oxidize at a PAA concentration of 100%, there is a noticeable decrease in the peak area of the thermal transition at Tm2. We observe a slight increase in the percentage of the higher molecular mass species from SEC shown in Table S6 and Figure S7. This suggests the changes in thermal stability is mainly due to Met oxidation instead of intermolecular interactions. Our results suggest Met oxidation can cause the destabilization of Fc and Fab domains of mAb1, among which, the Fc domain is more susceptible to destabilization caused by oxidation than the Fab domain.
Figure 2. Representative thermographs of mAb1 at different PAA levels.Tm1, Tm2, Tm3 represent the melting transition temperature for CH2, Fab, and CH3 domains, respectively.
Secondary structure assessment of methionine oxidized mAb1 by far-UV CD spectroscopy
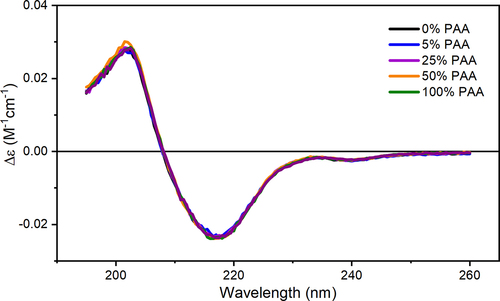
We applied Far-UV CD spectroscopy to assess changes in the secondary structure of mAb1 induced by Met oxidation. For proteins, the position and absorbance strength of CD spectra depend on the arrangement of peptide bonds, which determines the protein secondary structure. The far-UV CD spectrum for mAb1 has a positive peak at ~204 nm and a negative peak at ~218 nm that suggests a primarily beta-sheet structure and is consistent with mAb structure (). The corresponding spectra of mAb1 at different PAA percentages overlay very well with that of the control, indicating little to no changes in the secondary structure. The spectra of samples with Met residues oxidized show high similarity to the control with similarity scores of over 0.99 as shown in Table S2. Our observation is consistent with a previous report that Met oxidation shows minimal interference with the IgG secondary structure.Citation23
Figure 3. Representative far-UV CD spectra of oxidized mAb1 samples overlaid with the control.
Tertiary structure assessment by near-UV CD and Trp fluorescence spectroscopies
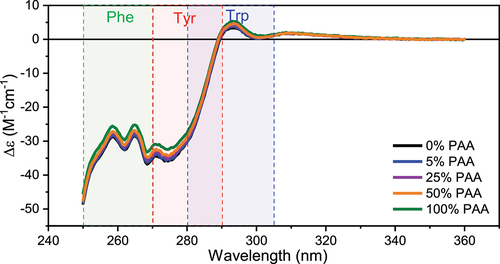
The effect of Met oxidation on the tertiary structure of mAb1 was probed using near-UV CD spectroscopy and intrinsic Trp fluorescence. Near-UV CD spectra in the range of 250 nm −360 nm are sensitive to the chirality of aromatic residues, including phenylalanine, tyrosine, and tryptophan, which is affected by protein tertiary structure. Therefore, near-UV CD spectra are a good representation of the tertiary structure around the aromatic residue sidechains. The approximate CD absorbance wavelength range corresponding to Phe, Tyr and Trp are highlighted in color in the spectra plotted in . Generally, the spectra show high similarity with that of the control when the PAA level is not greater than 50%. Upon oxidation at PAA level of 100%, mAb1 shows slight changes in the spectral area of Phe and Tyr residues whereas the Trp region remains very similar. This is likely because the total number of Phe and Tyr is about 4 times that of Trp and thus exhibit higher sensitivity to chiral environment changes. The similarity score is evaluated by the area of spectral overlap and summarized in Table S2. For PAA levels at 5% and 25%, the oxidized samples show similarity scores of over 0.99 with that of the control. At PAA levels of 50% and 100%, the similarity score decreases, but the similarity is still above 0.98. This indicates that near-UV CD does not detect statistically significant changes to the tertiary structure of mAb1 after Met oxidation.
Figure 4. Representative near-UV CD spectra of Met oxidized mAb1 samples and the control. Phe, Tyr, and Trp regions are highlighted in color.
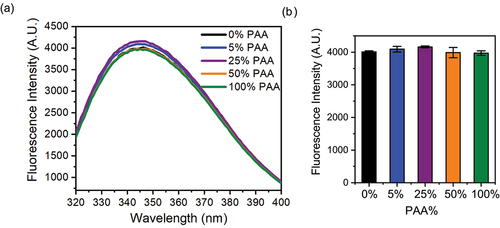
We also applied fluorescence spectroscopy to evaluate the tertiary structure around Trp residues, the results of which are shown in . Fluorescence spectra in the range of 320 to 400 nm measure the emission maximum of Trp sidechain and have some effect from Tyr. The peak position and intensity are characteristic of the hydrophobic environment of the Trp sidechain. After Met oxidation, fluorescence spectra of mAb1 are highly identical to that of the control as shown in . The maximum emission intensity at around 345 nm shows similar values for the control and the stressed samples within error of each other (). This observation suggests the Trp residues of the control and stressed mAb samples have similar hydrophobic environments regardless of Met oxidation level. Together, near-UV CD and fluorescence measurements do not detect statistically significant perturbations to the tertiary structure of mAb1 after Met oxidation.
Figure 5. (A) Tryptophan fluorescence spectra of Met oxidized mAb1 samples and the control: (B) Bar graph of the maximum fluorescence intensity and error bar.
1D PROFILE and PCA chemometric analysis
We applied PROFILE for analyzing the changes in HOS of mAb1 after Met oxidation. We first acquired 1D Pulsed Gradient STimulated Echo (PGSTE) spectra of oxidatively stressed mAb1 and control samples, where excipient signals in the buffer are suppressed by the pulse sequence. Additional residual excipient peaks from polysorbate that still appear in the spectra are selectively eliminated from the analysis along with regions of noise and large solvent peaks. PS80 is a surfactant, commonly used in commercial biotherapeutics formulation to protect mAbs from interfacial stresses and interface-induced aggregation. PS80 can form micelles in the formulation, making the diffusion-based signal filtering less efficient. The aliphatic and amide/aromatic regions of mAb1 used in the PROFILE analysis are shown in (Full spectra in Figure S5). Overall, the spectra overlay well in most regions and show similar linewidth between the oxidized samples with PAA levels at 5% and 25% and the control. The spectrum for the sample with 100% PAA shows increased peak intensities and peak shifting compared to the control. The zoomed-in view of an amide area and an aliphatic region highlights these differences, which suggests changes to the structure of mAb1 at 100% PAA ( insets). The new peaks between 2.6 and 2.8 ppm correspond to oxidized Met Hℇ peaks and are noticeably observed in the spectra of samples with 25% and 100% PAA and this tentative assignment is based on literature valuesCitation50 and 2D HSQC (data now shown). For quantitative analysis, we acquired four replicates for each sample, performed PROFILE analysis using the MBioHOS plugin within MNova from MestreLab, and calculated the similarity scores within each group (intragroup), and between Met-oxidized samples and the control (intergroup) (). The dotted lines mark the ± 2SD range from the mean similarity value of the control sample, which corresponds to the measurement precision allowed by the method. Inter-group pairs of spectra with similarity scores beyond this range are considered statistically different from each other. The similarity scores for the intra-group comparison show that repeated measurements for each sample are not statistically different and indicate consistent data quality and sample stability within the measurement time span. When considering the intergroup pairs, the similarity scores negatively correlate with the PAA concentration: similarity scores decrease to 25.9 for 5% PAA, 16.7 for 25% PAA, and 8.7 for 100% PAA when paired against the control. Additionally, the similarity scores for all the intergroup pairs are beyond the 2SD threshold and are therefore statistically different from the control. The advantage in this PROFILE analysis is in the sensitivity for detecting differences in mAb1 caused by the 5% PAA oxidation that are not easily observed in the spectra by visual inspection. The PROFILE analysis also provides a numerical value of the difference between spectra to easily conclude that the differences in the spectra accumulate as the concentration of PAA increases, which is consistent with the quantitative analysis of Met oxidations observed by LC-MS/MS.
Figure 6. Chemometric analysis of 1D 1H NMR spectral differences between Met oxidized mAb1 and the control. (A) Representative 1D 1H NMR spectra of Met oxidized mAb1 at 0%, 5%, 25%, and 100% PAA. Blinded spectral regions including polysorbate peaks and residual water signal shown in gray are excluded from the analysis. (B) Plot of the similarity score from PROFILE analysis of the amide/aromatic and methyl group regions. The dotted lines represent 2SD from the mean value of the intra-sample comparisons. (C) PCA score plot of PC1 and PC2 from the analysis of the spectra shown in (A). Replicate experiments are shown in the same color with the 95% confidence ellipses drawn (for control and 25% PAA data, the confidence ellipses are very small and within the area described by the corresponding clustered datapoints). The explained variances for the corresponding principal component are labeled on the axis.
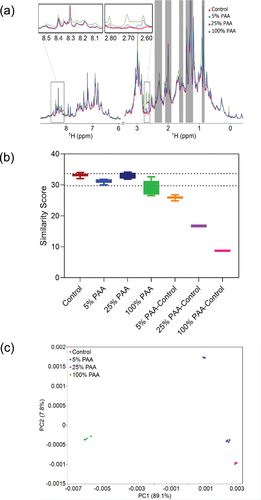
The other chemometric method we used to quantify the differences between Met oxidized samples and the control using 1D NMR spectra is PCA, which provides further confirmation and a deeper understanding of the sample differences. The PCA was carried out using the MBioHOS plugin within MNova from MestreLab as described in the Materials and Methods section. We considered only the first principal component (PC1) and the second principal component (PC2) in our analysis and in the scores plot () because these principal components together account for 96% of the explained variations (PC1 accounting for 89.1%). Both PC1 and PC2 show variations among the clusters of spectra and none of the clusters of spectra from samples treated with PAA overlaps with each other or the control. The cluster with the most difference in PC1 and PC2 scores in the cluster corresponds to the spectra from samples with 100% PAA. This suggests that samples with significant Met oxidation are statistically different from each other and the control sample. Based on the explained variance of each principal component and the trends, analysis of the scores plot suggests that PC1 describes chemical modifications while PC2 may be related to structural changes resulting from oxidation of the Fc and Fab domains. The Mahalanobis distances (DM), which represents statistical differences between clusters of the oxidized samples and the control, also increases with an increasing PAA concentration (Table S3). This indicates that the structural similarity between oxidized samples and the control decreases when the PAA level increases. Taken together, the similarity scores from PROFILE analysis and DM values of PCA can both be used as sensitive metrics in determining the extent of HOS changes from 1D NMR spectra.
Chemometric analysis of 2D methyl NMR spectra for HOS assessment
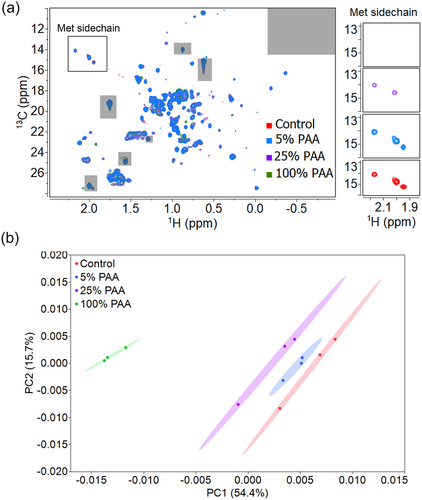
To evaluate the overall global structural changes associated with Met oxidation, we acquired 2D methyl HMQC spectra of the oxidized samples and the control shown (). Several Met methyl group (Hℇ-Cℇ) resonances are well resolved with good sensitivity, but relative intensities are difficult to determine visually. Visual inspection indicates that the 2D NMR spectra overlay very well with each other except for the Met Hℇ-Cℇ peaks highlighted in the square. Met-oxidized samples show a noticeable decrease in intensities of the Met Hℇ-Cℇ crosspeaks as the PAA concentration increases, with these crosspeaks falling below the noise level at 100% PAA (). However, visual inspection of this region does not allow for a quantitative understanding of the changes to the spectra, which can be accomplished by chemometric analysis.
Figure 7. 2D PCA analysis of mAb1 reference and oxidized samples. (A) Representative 2D 1H-13C methyl NMR spectra of Met oxidized mAb1 samples and the control. Excipient peaks and noise regions are excluded from the analysis and shown in gray. One replicate from each condition is shown. The zoomed view of Met Hε-Cε region are stacked on the right. The Met H-C peaks gradually disappear with an increasing PAA percentage. (B) PCA score plot of PC1-PC2 from analysis of the methyl group region. The ellipses represent 95% confidence region. The explained variance is labeled on the axis.
Peak intensities from 2D methyl HMQC spectra were evaluated by ECHOS for a more quantitative analysis of the HOS changes observed in the spectra. The intensities at the contour levels shown in of the samples treated with PAA were measured, plotted against the intensities of the control mAb1 spectrum, and subjected to a linear regression analysis (representative plots shown in Supplemental Figure S1). The average correlation coefficients (R values) determined from the linear regressions are determined for the intragroup control spectra (n = 3) and across pairings between the spectra of the control sample and for each of the stressed mAb1 samples (n = 9). A lower R value indicates a pair of spectra with greater differences, and ultimately greater differences in structure. In our study, the control group has an R value of 0.997 and the R values decrease when the Met oxidation level increases with R values of 0.988 for 5% PAA, 0.957 for 25% PAA, and 0.883 for 100% PAA. The spectral differences between 100% PAA treated mAb1 and the control from ECHOS are shown as a heat map overlaid onto the 2D NMR spectra to help identify regions in the spectra that are responsible for measured differences in the ECHOS plots (Figure S2A). Along with the Met Hℇ-Cℇ region, notably other methyl regions show significant differences between the spectra denoted by the heat map. This indicates that chemical modifications of Met residues perturb other selective regions of the spectra, which implies local structural changes may have occurred. Statistically, for a ~ 35kDa protein, R values of 0.93 or higher were indicated as acceptable measures of structural comparability.Citation42 If this can be taken as an appropriate benchmark, then our study demonstrates that statistically significant differences in the HOS of mAb1 are only observed in the sample treated with > 25% PAA and specifically, with 100% PAA treatment. However, it is important to note that a negative correlation between the R values and the concentration of PAA suggest that the differences in the spectra accumulate and lead to a structural change in mAb1 once exposed to 100% PAA.
Further evaluation of the 2D methyl NMR spectra changes due to PAA-induced oxidation of mAb1 was carried out using PCA, similar to the PCA comparison of 1D NMR spectra. For PCA of the 2D spectra, the scores plot of PC1 and PC2 describes 70.1% of the explained variance of the spectra and shows reasonable clustering of the spectra collected (). The oxidized samples are clearly distinguished from the control evidenced by a lack of any overlapping from the 95% confidence ellipses across all clusters. The corresponding DM values also show a positive correlation with the concentration of PAA (Table S4), which is consistent with the LC-MS/MS and 1D NMR results. The spectral loading plot of PCA (most influential bins) shows consistent behavior as the ECHOS analysis in identifying key areas of greater differences across the spectra: the Met Hℇ-Cℇ peaks contribute heavily to PC1 and PC2 along with other methyl regions aligned with the ECHOS analysis (Supplemental Figure S2B). This suggests the changes in HOS of mAb1 after oxidative stress propagate from the regions of Met oxidation to affect other regions of the protein. We repeated the PCA on the 2D spectra while excluding the Met Hℇ-Cℇ peaks in the analysis to determine the extent of differences in the spectra not contributed by the Met resonances (Figure S3A). The scores plot of the first two principal components from this analysis shown in Figure S3B demonstrates a similar trend to the analysis with the Met region included: the sample clusters still do not overlap with each other and the DM values decrease with increasing PAA concentration (Table S4). This suggests that Met oxidation induces changes beyond the Met residues, but structural assignments are required to definitively show that these changes correlate to other structural regions far from the Met residues. In situations where assignment data is available, PCA comparing oxidatively stressed 2D methyl group spectra provides the opportunity to potentially associate the variations with specific residues and regions of structure.
Chemical shift and peak intensity analysis of methionine backbone
2DCitation1H-Citation15N NMR spectra report on the protein backbone structure and remain the gold standard for structural fingerprinting of proteins. However, 15N nuclei has lower natural abundance relative to 13C nuclei and less favorable relaxation mechanisms, resulting in lower sensitivity of the amide compared to methyl moieties. Though 2D 1H-Citation15N spectra have general utility for mAb HOS assessment, the acquisition of 2D 1H-Citation15N spectra has proven time consuming for full-length mAbs and has a strong molecular weight dependence of experimental performance.Citation38 Residue-specific 15N isotopically labeling, such as alanine, in mAbs allows for obtaining the NH fingerprint of these sites and identifying localized structural changes in different formulations.Citation51
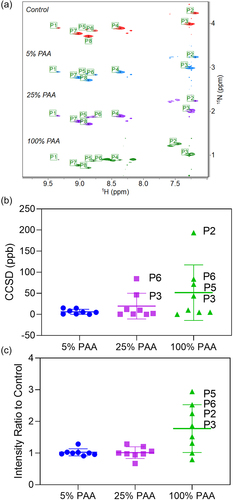
We prepared 15N-Met specifically labeled mAb1 and used two MS methods to determine the 15N-Met incorporation percentage. The labeled and unlabeled intact mAb1 mass spectral profiles indicate approximately 100% 15N-Met incorporation when comparing the systematic +16 Da mass shifts of the respective glycosylated forms and the lack of visible peak broadening (Figure S4 and Table S5). From the peptide mapping MS1 data, 15N labeling percentage is approximately 93% in the DTLMISR Fc tryptic peptide (Figure S6), and 92–93% in the seven other unique Met-containing tryptic peptides from mAb1. The 15N labeling percentage was calculated based on the relative abundance ratio of the 15N-labeled monoisotopic peak divided by the sum of the 15N-labeled and unlabeled monoisotopic peaks. Because the level of 15N-Met incorporation was > 90%, the actual peak intensity contributions of the natural 13C and 15N isotopes in the unlabeled peptide are negligible in the 15N labeled monoisotopic peak. The 2D 1H-15N spectra of Met oxidized mAb1 and the control shown in record eight unique Met sites of mAb1. Visually, the superimposed spectra of the control and the oxidized samples with 5% and 25% PAA overlap very well with each other, but the spectrum of the sample with 100% PAA shows significant differences in peak intensities and chemical shifts relative to the other spectra. We used CCSD within the MBioHOS plugin of MNova from MestreLab for quantitative analysis of the chemical shift and intensity changes of the Met sites. CCSD of each residue is plotted in together with the mean and SD. Peaks were automatically picked for the control spectrum. P6 and P3 are tentatively assigned to Met252 and Met428, respectively, based on their chemical shifts being closest to the literature value.Citation52 The matching peaks in the oxidized sample spectra are automatically determined in MNova, and the CCSD for each peak pair calculated. The average CCSD of the spectra of the oxidatively stressed samples compared to the control spectrum increases as the PAA percentage increases, which indicates the accumulation of oxidation products of mAb1. In the sample oxidized with 25% PAA, Met252 and Met428 show higher than average CCSD, while other Met residues show similar chemical shifts with those of the control. When considering the spectrum of the sample with 100% PAA, two more peaks show significant CCSD from the control average. These are likely Met34 and Met70 which show increased oxidation levels at PAA level of 100% from the MS analysis. Additionally, we calculated the crosspeak intensity ratio of PAA stressed relative to control samples for each Met residue, and plotted specific Met residue ratios along with the average intensity ratio in . The average peak intensity at 5% and 25% PAA conditions is almost consistent with those for the control (i.e., intensity ratio ~ 1.0), whereas the average peak intensity of 100% PAA level almost doubles. Significant peak intensity changes are observed for tentatively assigned Met252, Met428, and likely Met34and Met70 residues (i.e. P6, P3, P2, and P5). This observation suggests that significant Met oxidation at 100% PAA is associated with more significant structural and/or dynamics perturbation that is causing chemical shift changes at the backbone locus of specific Met residues. CCSD analysis of 2D 1H-Citation15N spectra provides insights into the site-specific changes of Met amide induced by oxidation, which is not easily accessible without 15N-Met isotopically labeling. We anticipate that advancements in the isotopic labeling technology of mAbs will significantly improve the sensitivity of NMR chemometrics as a routine HOS characterization method.
Figure 8. (A) Stacked 2D 1H-15N NMR spectra of Met oxidized mAb1 with the control. The Met amide peaks are automatically identified and labeled as P1 to P8. The plot of CCSD (B) and intensity ratio (C) comparison of Met residues in mAb1 under PAA oxidation conditions with the control. Individual value for each residue, mean value, and standard deviation are plotted.
Taken together, the metrics from multiple chemometric analysis methods used in the study show similar trends when assessing the HOS changes upon Met oxidation of mAb1, consistently pointing to an accumulation of chemical modifications and structural changes with increasing Met oxidation. Since chemical modifications and HOS changes would both result in spectral differences, it is difficult to unequivocally attribute the source of changes to each HOS level (secondary, tertiary, quaternary, and quinary) from a single chemometric analysis method. For example, in a comparative study of PROFILE and PCA, Elliott et al. suggested that 1D PROFILE analysis performs better as a means of detecting differences in sample composition and chemical identities. In comparison, the 2D methyl spectra appear more sensitive to differences in the rotational correlation times of the analyte samples.Citation44 Furthermore, Elliott et al. demonstrated the multidimensional nature of PCA can order the samples by chemical identity and rotational correlation time in separate dimensions of 2D PCA plot by both 1D and 2D methods albeit with opposite sensitivities and corresponding orders of ranking.Citation41 PCA enabled the differentiation of 1D 1H spectra of mAb samples and their fragments by ordering chemical identity in one dimension and molecular weight on the other.Citation41 In our study, PCA of 1D spectra detected changes in both principal components, which may be indicative of changes in both the chemical identity and structure with an increasing PAA percentage. PCA of 2D spectra showed that samples exhibit clear separation along PC1 score, which can clearly relate to the extent of oxidation while PC2 reflect noise contributions. When mapping on the spectra, PCA analysis of 2D spectra can identify the specific regions of the spectra that contribute to HOS variations. A few individual peaks are identified to associate significant changes, which point to structural changes localized in proximity to Met residues. Local structural changes are also evidenced by chemical shift perturbations of backbone HN, of which only chemically modified sites show noticeable changes. This is consistent with HDX analysis that the CH2 domain shows changes while the CH3 structure is less compromised under oxidative stress.Citation53 Consistently, reduced structural comparability of mAb1 in PAA-treated samples is also evidenced by a decrease of the overall spectral similarity by 2D ECHOS analysis evaluated by correlation coefficient. Considering the sensitivity of 1D 1H spectra to chemical modifications, which may minimally alter the structure, we expect that 2D methyl NMR in combination with PCA can be used as a robust method in the statistical comparison of HOS of mAb therapeutics and ECHOS as an orthogonal method to confirm the source spectral differences in the 2D methyl NMR spectra.
Discussion
In a drug’s lifecycle, the integrity of protein HOS is essential to expected and intended functions.Citation54 Therefore, quality assessment of HOS is considered crucial for biological therapeutics development. An increasing number of analytical and biophysical techniques are applied to the HOS evaluation of biologics with varying sensitivity and specificity as product development advances. Established biophysical methods, including DSC, far-, near-UV CD spectroscopy, and fluorescence spectroscopy can provide information on the global structure with relatively high sensitivity but low resolution.Citation24 CD and IR spectroscopy exhibit low sensitivity in detecting local or small structural changes in degraded mAbs.Citation55 More recently, NMR spectroscopy in combination with chemometric analysis demonstrate the capacity to identify both localized and global structural changes and is increasingly applied in analyzing mAb HOS with high resolution.Citation35–40,Citation43,Citation44,Citation56–59 An understanding of information from chemometric analysis of NMR spectra in the context of orthogonal analytical and biophysical techniques can contribute to the harmonization of NMR methods with established techniques in providing an in-depth characterization of all elements of HOS.
Protein modifications can have a significant impact on the HOS of mAbs and thereby influence the therapeutic properties of a bioproduct.Citation11,Citation12 Met oxidation is commonly reported in mAbs and can result in reduced affinity to the FcRn and faster plasma clearance if present at high levels.Citation13,Citation14,Citation60,Citation61 It has been shown that oxidation of Met257 and Met433 of IgG1 in the Fc region causes conformational change in the interface of CH2 and CH3 domain that weakens the complement-dependent cytotoxicity activity.Citation23,Citation53,Citation60 Our DSC measurements provide an overall assessment of the conformational stability showing that Met oxidation does have an impact on thermal stability of CH2 and CH3 domains. These results agree with HDX-MS findings that the main structural changes upon oxidation in IgG antibodies occur in the CH2 and CH3 domains, primarily at the CH2-CH3 interface.Citation23 Our biophysical characterization data suggest that, despite the level of Met oxidation in both Fc and Fab domains, mAb1 shows robustness in maintaining the secondary structure evidenced by far-UV CD spectroscopy. The oxidized samples primarily show a beta-sheet structure, consistent with the non-oxidized sample (). Moreover, near-UV CD spectroscopy and fluorescence spectroscopy show that the tertiary structure of mAb1 is mostly maintained after PAA-induced oxidation (). This agrees with the literature results reporting that chemical modifications, such as deamidation and Met oxidation, have minimum impact on the global structure of mAbs.Citation19,Citation62 As a high-resolution method that can probe site-specific changes, NMR spectroscopy together with chemometric analysis shows localized structure changes that propagate from oxidized Met residues to other regions in the protein ( and S2). This has potential implications on the effect of oxidation on structural changes outside the oxidized Met sites. Consistent with our results, Palinsky and coworkers found that Met oxidation does not affect the global folding of the mAb, although it affects local regions upon treatment with hydrogen peroxide.Citation22 Solomon et al. also demonstrated that Met oxidation does not compromise the integrity of the mAb fold while inducing localized structural changes.Citation14,Citation18 In general, it is particularly difficult to relate a change in protein HOS to a change in immunogenicity.Citation14 Since oxidized Met is present in endogenous IgG molecules in the human body, Met oxidation is considered to pose a lower risk of immunogenicity.Citation14,Citation63 Chemical oxidation of Met, such as hydrogen peroxidase, can cause formation of aggregates that are small, folded, and mostly reversible.Citation16 The tendency toward reversibility may make their presence less of a concern in a physiological environment. The impact of localized structural changes on the efficacy of antibody can be further elucidated by in vitro functional assays. Taken together, we showcase the application of routine analytical and biophysical characterization techniques in combination with isotopically labeling and NMR chemometric analysis to understand the impact of Met oxidation on the chemical and structural characteristics of a mAb product. The utility of combining NMR with other biophysical and analytical tools can rigorously assess HOS attributes of mAb drug products by monitoring the chemical modifications and resolving the localized structural changes in mAbs.
In the early- to late-stage development of a biopharmaceutical product, it is important to identify potential modification hotspots and develop an understanding of their possible impact on the protein structure. Our LC-MS/MS peptide mapping of mAb1 reveals that PAA accelerated conditions can generate Met specifically oxidized IgG1 molecules with an increasing amount of Met sulfoxide first in the Fc and subsequently in the Fab domain. Furthermore, we demonstrate the unification of NMR chemometric analysis and conventional biophysical characterization can provide comprehensive characterization of HOS ranging from the global structure to localized conformational modifications. The 15N labeling of Met residues significantly improves the sensitivity of NMR characterization and enables the direct observation of structural perturbations on the backbone of oxidation sites. We also observe that Met oxidation at the tested levels can cause perturbations on the methyl groups of other residues while IgG1 maintains its global structure. NMR chemometric analysis provides semi-quantitative evaluation of the sample differences in chemical identity and localized conformation, and the metrics correlate with the extent of Met oxidation. Our study demonstrates that a suite of NMR chemometric analyses are reliable to capture localized HOS changes with high sensitivity, while conventional biophysical techniques can inform on the global structure changes. The NMR methods outlined here can be used as orthogonal or complementary approaches in recombinant protein characterization, structure-function relationship studies and formulation development to generate additional product knowledge, especially in the case of time-sensitive investigations and responses to regulatory queries.
Abbreviations
| ∆H | = | Enthalpy |
| 1D | = | One Dimensional |
| 2D | = | Two Dimensional |
| CCSD | = | Combined Chemical Shift Deviation |
| CD | = | Circular Dichroism |
| DM | = | Mahalanobis Distance |
| DSC | = | Differential Scanning Calorimetry |
| ECHOS | = | Easy Comparability of Higher Order Structure |
| EDTA | = | Ethylenediaminetetraacetic Acid |
| Fab | = | Antigen-binding Fragment |
| Fc | = | Crystallization Fragment |
| FcRn | = | Neonatal Fc Receptor |
| FDA | = | Food and Drug Administration |
| HC | = | Heavy Chain |
| HDX | = | Hydrogen-Deuterium Exchange |
| HMQC | = | Heteronuclear Multiple Quantum Correlation |
| HOS | = | Higher Order Structure |
| HSQC | = | Heteronuclear Single Quantum Correlation |
| IgG1κ | = | Immunoglobulin Isotype Gamma-1 with Kappa Light Chains |
| IR | = | Infrared |
| LC | = | Light Chain |
| mAbs: | = | Monoclonal Antibodies |
| MS | = | Mass Spectrometry |
| NIST | = | National Institute of Standards and Technology |
| NMR | = | Nuclear Magnetic Resonance |
| PAA | = | Peracetic Acid |
| PC1 | = | the First Principal Component |
| PC2 | = | the Second Principal Component |
| PGSTE | = | Pulsed Field Gradient Stimulated Echo |
| PS80 | = | Polysorbate 80 |
| PTMs | = | Posttranslational Modifications |
| PROFILE | = | PROtein Fingerprint by Line shape Enhancement |
| PCA | = | Principal Component Analysis |
| R | = | Correlation Coefficient |
| S | = | Similarity Score |
| SD | = | Standard Deviation |
| SEC | = | Size Exclusion Chromatography |
| TFA | = | Trifluoroacetic Acid |
| Tm | = | Transition Temperature |
LiM_2023_0188R1_SI_4Dec2023.docx
Download MS Word (8.3 MB)Acknowledgments
The authors acknowledge the support from Beth McCoy, Mingzhang Wang, Leon Shi, Samuel Perakis, and Margaret Ruesch of Pfizer, Inc. We also thank the Summer Growth Experience Program at Pfizer for the support of Hannah Duncan.
Disclosure statement
No potential conflict of interest was reported by the author(s).
Data availability statement
The data that support the findings of this study are available on request from the corresponding author, M. Li.
Supplementary material
Supplemental data for this article can be accessed online at https://doi.org/10.1080/19420862.2023.2292688.
Additional information
Funding
References
- Lu RM, Hwang YC, Liu IJ, Lee CC, Tsai HZ, Li HJ, Wu HC Development of therapeutic antibodies for the treatment of diseases. J Biomed Sci. 2020;27(1):1–16. doi: 10.1186/s12929-019-0592-z. PMID: 31894001.
- Waldmann TA Immunotherapy: past, present and future. Nat Med. 2003;9(3):269–277. doi: 10.1038/nm0303-269. PMID: 12612576.
- Reichert JM, Rosensweig CJ, Faden LB, Dewitz MC Monoclonal antibody successes in the clinic. Nat Biotechnol. 2005;23(9):1073–1078. doi: 10.1038/nbt0905-1073. PMID: 16151394.
- Wang Z, Wang G, Lu H, Li H, Tang M, Tong A Development of therapeutic antibodies for the treatment of diseases. Mol Biomed. 2022;3(1):35. doi: 10.1186/s43556-022-00100-4. PMID: 36418786.
- Cohen RD, Pielak GJ. A cell is more than the sum of its (dilute) parts: a brief history of quinary structure. Protein Sci. 2017;26:403–413. doi:10.1002/pro.3092. PMID: WOS:000394992700003.
- Berkowitz SA, Engen JR, Mazzeo JR, Jones GB. Analytical tools for characterizing biopharmaceuticals and the implications for biosimilars. Nat Rev Drug Discov. 2012;11(7):527–540. doi: 10.1038/nrd3746. PMID: WOS:000305969300022.
- Woodcock J, Griffin J, Behrman R, Cherney B, Crescenzi T, Fraser B, Hixon D, Joneckis C, Kozlowski S, Rosenberg A, et al. Opinion - the FDA’s assessment of follow-on protein products: a historical perspective. Nat Rev Drug Discov. 2007;6(6):437–442. doi:10.1038/nrd2307. PMID: WOS:000246992000012.
- Eon-Duval A, Broly H, Gleixner R. Quality attributes of recombinant therapeutic proteins: an assessment of impact on safety and efficacy as part of a quality by design development approach. Biotechnol Progr. 2012;28(3):608–622. doi: 10.1002/btpr.1548. PMID: WOS:000304989800002.
- Bailly M, Mieczkowski C, Juan V, Metwally E, Tomazela D, Baker J, Uchida M, Kofman E, Raoufi F, Motlagh S, et al. Predicting antibody developability profiles through early stage discovery screening. MAbs. 2020;12(1):12. doi:10.1080/19420862.2020.1743053. PMID: WOS:000523273600001.
- Beck A, Liu H. Macro- and micro-heterogeneity of natural and recombinant IgG antibodies. Antibodies (Basel). 2019;8(1):18. doi: 10.3390/antib8010018. PMID: 31544824.
- Houde D, Peng Y, Berkowitz SA, Engen JR. Post-translational modifications differentially affect IgG1 conformation and receptor binding. Molecular & Cellular Proteomics: MCP. 2010;9:1716–1728. doi:10.1074/mcp.M900540-MCP200. PMID: 20103567.
- Walsh G. Post-translational modifications of protein biopharmaceuticals. Drug Discov Today. 2010;15(17–18):773–780. doi: 10.1016/j.drudis.2010.06.009. PMID: 20599624.
- Gao X, JYA J, Veeravalli K, Wang YJ, Zhang T, Mcgreevy W, Zheng K, Kelley RF, Laird MW, Liu J, et al. Effect of Individual Fc methionine oxidation on FcRn binding: Met252 oxidation impairs FcRn binding more profoundly than Met428 oxidation. J Pharm Sci-Us. 2015;104(2):368–377. doi:10.1002/jps.24136. PMID: WOS:000349089500009.
- Hermeling S, Crommelin DJ, Schellekens H, Jiskoot W. Structure-immunogenicity relationships of therapeutic proteins. Pharm Res. 2004;21(6):897–903. doi: 10.1023/b:pham.0000029275.41323.a6. PMID: 15212151.
- Luo Q, Joubert MK, Stevenson R, Ketchem RR, Narhi LO, Wypych J. Chemical modifications in therapeutic protein aggregates generated under different stress conditions. J Biol Chem. 2011;286:25134–25144. doi:10.1074/jbc.M110.160440. PMID: 21518762.
- Joubert MK, Luo Q, Nashed-Samuel Y, Wypych J, Narhi LO. Classification and characterization of therapeutic antibody aggregates. J Biol Chem. 2011;286:25118–25133. doi:10.1074/jbc.M110.160457. PMID: 21454532.
- Wang W, Vlasak J, Li Y, Pristatsky P, Fang Y, Pittman T, Roman J, Wang Y, Prueksaritanont T, Ionescu R. Impact of methionine oxidation in human IgG1 Fc on serum half-life of monoclonal antibodies. Mol Immunol. 2011;48:860–866. doi:10.1016/j.molimm.2010.12.009. PMID: 21256596.
- Solomon TL, Delaglio F, Giddens JP, Marino JP, Yu YB, Taraban MB, Brinson RG. Correlated analytical and functional evaluation of higher order structure perturbations from oxidation of NISTmAb. MAbs. 2023;15(1):2160227. doi: 10.1080/19420862.2022.2160227. PMID: 36683157.
- Bandi S, Singh SM, Shah DD, Upadhyay V, Mallela KMG. 2D NMR analysis of the effect of asparagine deamidation versus methionine oxidation on the structure, stability, aggregation, and function of a therapeutic protein. Mol Pharmaceut. 2019;16(11):4621–4635. doi: 10.1021/acs.molpharmaceut.9b00719. PMID: WOS:000494894300018.
- Shah DD, Singh SM, Mallela KMG. Effect of chemical oxidation on the higher order structure, stability, aggregation, and biological function of interferon alpha-2a: role of local structural changes detected by 2D NMR. Pharm Res. 2018;35(12):232. doi: 10.1007/s11095-018-2518-y. PMID: 30324266.
- Torosantucci R, Schoneich C, Jiskoot W. Oxidation of therapeutic proteins and peptides: structural and biological consequences. Pharm Res. 2014;31(3):541–553. doi: 10.1007/s11095-013-1199-9. PMID: 24065593.
- Cerofolini L, Ravera E, Fischer C, Trovato A, Sacco F, Palinsky W, Angiuoni G, Fragai M, Baroni F. Integration of NMR spectroscopy in an analytical workflow to evaluate the effects of oxidative stress on Abituzumab: beyond the fingerprint of mAbs. Anal Chem. 2023;95(24):9199–9206. doi: 10.1021/acs.analchem.3c00317. PMID: 37278511.
- Mo J, Yan Q, So CK, Soden T, Lewis MJ, Hu P. Understanding the impact of methionine oxidation on the biological functions of IgG1 antibodies using hydrogen/Deuterium exchange mass spectrometry. Anal Chem. 2016;88(19):9495–9502. doi: 10.1021/acs.analchem.6b01958. PMID: 27575380.
- WFt W, Gabrielson JP, Al-Azzam W, Chen G, Davis DL, Das TK, Hayes DB, Houde D, Singh SK. Technical decision making with higher order structure data: perspectives on higher order structure characterization from the biopharmaceutical industry. J Pharm Sci. 2016;105(12):3465–3470. doi: 10.1016/j.xphs.2016.09.003. PMID: 27743675.
- Wei H, Mo J, Tao L, Russell RJ, Tymiak AA, Chen G, Iacob RE, Engen JR. Hydrogen/Deuterium exchange mass spectrometry for probing higher order structure of protein therapeutics: methodology and applications. Drug Discov Today. 2014;19(1):95–102. doi: 10.1016/j.drudis.2013.07.019. PMID: 23928097.
- Masson GR, Burke JE, Ahn NG, Anand GS, Borchers C, Brier S, Bou-Assaf GM, Engen JR, Englander SW, Faber J, et al. Recommendations for performing, interpreting and reporting hydrogen deuterium exchange mass spectrometry (HDX-MS) experiments. Nat Methods. 2019;16(7):595–602. doi:10.1038/s41592-019-0459-y. PMID: 31249422.
- Johnson DT, Di Stefano LH, Jones LM. Fast photochemical oxidation of proteins (FPOP): a powerful mass spectrometry–based structural proteomics tool. J Biol Chem. 2019;294(32):11969–11979. doi: 10.1074/jbc.REV119.006218. PMID: 31262727.
- Lin Y, Moyle AB, Beaumont VA, Liu LL, Polleck S, Liu H, Shi H, Rouse JC, Kim HY, Zhang Y, et al. Characterization of higher order structural changes of a thermally stressed monoclonal antibody via mass spectrometry footprinting and other biophysical approaches. Anal Chem. 2023;95(46):16840–16849. doi:10.1021/acs.analchem.3c02422. PMID: 37933954.
- Rosato A, Tejero R, Montelione GT. Quality assessment of protein NMR structures. Curr Opin Struct Biol. 2013;23:715–724. doi:10.1016/j.sbi.2013.08.005. PMID: 24060334.
- Huang C, Kalodimos CG. Structures of large protein complexes determined by nuclear magnetic resonance spectroscopy. Annu Rev Biophys. 2017;46(1):317–336. doi: 10.1146/annurev-biophys-070816-033701. PMID: 28375736.
- Wecksler AT, Lundin V, Williams AJ, Veeravalli K, Reilly DE, Grieco SH. Bioprocess development and characterization of a C-Labeled hybrid bispecific antibody produced in. Antibodies. 2023;12(1):16. doi: 10.3390/antib12010016. PMID: WOS:000953958300001.
- Tokunaga Y, Takeuchi K, Okude J, Ori K, Torizawa T, Shimada I. Structural fingerprints of an intact monoclonal antibody acquired under formulated storage conditions via 15 N direct detection nuclear magnetic resonance. J Med Chem. 2020;63(10):5360–5366. doi: 10.1021/acs.jmedchem.0c00231. PMID: WOS:000585210700021.
- Hodgson DJ, Ghasriani H, Aubin Y. Assessment of the higher order structure of Humira(R), Remicade(R), Avastin(R), Rituxan(R), Herceptin(R), and Enbrel(R) by 2D-NMR fingerprinting. J Pharm Biomed Anal. 2019;163:144–152. doi:10.1016/j.jpba.2018.09.056. PMID: 30296716.
- Brinson RG, Marino JP, Delaglio F, Arbogast LW, Evans RM, Kearsley A, Gingras G, Ghasriani H, Aubin Y, Pierens GK, et al. Enabling adoption of 2D-NMR for the higher order structure assessment of monoclonal antibody therapeutics. MAbs. 2019;11(1):94–105. doi:10.1080/19420862.2018.1544454. PMID: 30570405.
- Chen K, Long DS, Lute SC, Levy MJ, Brorson KA, Keire DA. Simple NMR methods for evaluating higher order structures of monoclonal antibody therapeutics with quinary structure. J Pharm Biomed Anal. 2016;128:398–407. doi:10.1016/j.jpba.2016.06.007. PMID: 27344629.
- Wang DY, Park J, Patil SM, Smith CJ, Leazer JL, Keire DA, Chen K. An NMR-Based similarity metric for higher order structure quality assessment among US marketed insulin therapeutics. J Pharm Sci-Us. 2020;109(4):1519–1528. doi: 10.1016/j.xphs.2020.01.002. PMID: WOS:000522855200012.
- Poppe L, Jordan JB, Lawson K, Jerums M, Apostol I, Schnier PD. Profiling Formulated Monoclonal Antibodies by 1 H NMR Spectroscopy. Anal Chem. 2013;85(20):9623–9629. doi: 10.1021/ac401867f. PMID: 24006877.
- Arbogast LW, Brinson RG, Formolo T, Hoopes JT, Marino JP. 2D H-1(N), N-15 correlated NMR methods at natural abundance for obtaining structural maps and statistical comparability of monoclonal antibodies. Pharm Res-Dordr. 2016;33(2):462–475. doi: 10.1007/s11095-015-1802-3. PMID: WOS:000368073300017.
- Arbogast LW, Delaglio F, Schiel JE, Marino JP. Multivariate analysis of two-Dimensional 1 H, 13 C methyl NMR spectra of monoclonal antibody therapeutics to facilitate assessment of higher order structure. Anal Chem. 2017;89(21):11839–11845. doi: 10.1021/acs.analchem.7b03571. PMID: 28937210.
- Arbogast LW, Brinson RG, Marino JP. Mapping monoclonal antibody structure by 2D 13C NMR at natural abundance. Anal Chem. 2015;87(7):3556–3561. doi: 10.1021/ac504804m. PMID: 25728213.
- Elliott KW, Delaglio F, Wikstrom M, Marino JP, Arbogast LW. Principal component analysis of 1D 1H diffusion edited NMR spectra of protein therapeutics. J Pharm Sci. 2021;110:3385–3394. doi:10.1016/j.xphs.2021.06.027. PMID: 34166704.
- Amezcua CA, Szabo CM. Assessment of higher order structure comparability in therapeutic proteins using nuclear magnetic resonance spectroscopy. J Pharm Sci. 2013;102:1724–1733. doi:10.1002/jps.23531. PMID: 23568791.
- Poppe L, Jordan JB, Rogers G, Schnier PD. On the analytical superiority of 1D NMR for fingerprinting the higher order structure of protein therapeutics compared to multidimensional NMR methods. Anal Chem. 2015;87(11):5539–5545. doi: 10.1021/acs.analchem.5b00950. PMID: 25929316.
- Elliott KW, Ghasriani H, Wikstrom M, Giddens JP, Aubin Y, Delaglio F, Marino JP, Arbogast LW. Comparative analysis of one-dimensional protein fingerprint by line shape Enhancement and two-dimensional 1 H, 13 C methyl NMR methods for characterization of the higher order structure of IgG1 monoclonal antibodies. Anal Chem. 2020;92(9):6366–6373. doi: 10.1021/acs.analchem.9b05385. PMID: 32267681.
- Beaumont VA, Liu L, Shi H, Rouse JC, Kim HY. Application of NMR and chemometric analyses to better understand the quality attributes in pH and thermally degraded monoclonal antibodies. Pharm Res. 2023;40(10):2457–2467. doi: 10.1007/s11095-023-03600-2. PMID: 37798537.
- Sitasuwan P, Powers TW, Medwid T, Huang YT, Bare B, Lee LA. Enhancing the multi-attribute method through an automated and high-throughput sample preparation. MAbs. 2021;13(1). doi:10.1080/19420862.2021.1978131. PMID: WOS:000701311500001.
- Puig-Castellvi F, Perez Y, Pina B, Tauler R, Alfonso I. Compression of multidimensional NMR spectra allows a faster and more accurate analysis of complex samples. Chem Commun (Camb). 2018;54(25):3090–3093. doi: 10.1039/c7cc09891j. PMID: 29411785.
- Chumsae C, Gaza-Bulseco G, Sun J, Liu H. Comparison of methionine oxidation in thermal stability and chemically stressed samples of a fully human monoclonal antibody. J Chromatogr B Analyt Technol Biomed Life Sci. 2007;850:285–294. doi:10.1016/j.jchromb.2006.11.050. PMID: 17182291.
- Garber E, Demarest SJ. A broad range of Fab stabilities within a host of therapeutic IgGs. Biochem Bioph Res Co. 2007;355:751–757. doi:10.1016/j.bbrc.2007.02.042. PMID: WOS:000245001300025.
- Hinterholzer A, Stanojlovic V, Regl C, Huber CG, Cabrele C, Schubert M. Identification and quantification of oxidation products in full-length biotherapeutic antibodies by NMR spectroscopy. Anal Chem. 2020;92(14):9666–9673. doi: 10.1021/acs.analchem.0c00965. PMID: 32530275.
- Tokunaga Y, Takeuchi K. Role of NMR in high ordered structure characterization of monoclonal antibodies. Int J Mol Sci. 2020;22(1):46. doi: 10.3390/ijms22010046. PMID: 33375207.
- Yagi H, Zhang Y, Yagi-Utsumi M, Yamaguchi T, Iida S, Yamaguchi Y, Backbone KK. (1)H, (13)C, and (15)N resonance assignments of the Fc fragment of human immunoglobulin G glycoprotein. Biomol NMR Assign. 2015;9(2):257–260. doi: 10.1007/s12104-014-9586-7. PMID: 25291979.
- Burkitt W, Domann P, O’Connor G. Conformational changes in oxidatively stressed monoclonal antibodies studied by hydrogen exchange mass spectrometry. Protein Sci. 2010;19:826–835. doi:10.1002/pro.362. PMID: 20162626.
- Rosenberg AS. Effects of protein aggregates: an immunologic perspective. AAPS J. 2006;8(3):E501–507. doi: 10.1208/aapsj080359. PMID: 17025268.
- Lin JC, Glover ZK, Sreedhara A. Assessing the utility of circular dichroism and FTIR spectroscopy in monoclonal-antibody comparability studies. J Pharm Sci. 2015;104:4459–4466. doi:10.1002/jps.24683. PMID: 26505267.
- Brinson RG, Elliott KW, Arbogast LW, Sheen DA, Giddens JP, Marino JP, Delaglio F. Principal component analysis for automated classification of 2D spectra and interferograms of protein therapeutics: influence of noise, reconstruction details, and data preparation. J Biomol NMR. 2020;74(10–11):643–656. doi: 10.1007/s10858-020-00332-y. PMID: WOS:000551391700001.
- Bramham JE, Podmore A, Davies SA, Golovanov AP. Comprehensive assessment of protein and excipient stability in biopharmaceutical formulations using 1 H NMR spectroscopy. ACS Pharmacol Transl Sci. 2021;4(1):288–295. doi: 10.1021/acsptsci.0c00188. PMID: 33659867.
- Casagrande F, Degardin K, Ross A. Protein NMR of biologicals: analytical support for development and marketed products. J Biomol NMR. 2020;74(10–11):657–671. doi: 10.1007/s10858-020-00318-w. PMID: 32350692.
- Franks J, Glushka JN, Jones MT, Live DH, Zou Q, Prestegard JH. Spin Diffusion Editing for Structural Fingerprints of Therapeutic Antibodies. Anal Chem. 2016;88(2):1320–1327. doi: 10.1021/acs.analchem.5b03777. PMID: 26653763.
- Stracke J, Emrich T, Rueger P, Schlothauer T, Kling L, Knaupp A, Hertenberger H, Wolfert A, Spick C, Lau W, et al. A novel approach to investigate the effect of methionine oxidation on pharmacokinetic properties of therapeutic antibodies. MAbs. 2014;6(5):1229–1242. doi:10.4161/mabs.29601. PMID: 25517308.
- Bertolotti-Ciarlet A, Wang W, Lownes R, Pristatsky P, Fang Y, McKelvey T, Li Y, Li Y, Drummond J, Prueksaritanont T, et al. Impact of methionine oxidation on the binding of human IgG1 to FcRn and Fcγ receptors. Mol Immunol. 2009;46(8–9):1878–1882. doi:10.1016/j.molimm.2009.02.002. PMID: 19269032.
- Majumder S, Saati A, Philip S, Liu LL, Stephens E, Rouse JC, Ignatius AA. Utility of high resolution NMR methods to probe the impact of chemical modifications on higher order structure of monoclonal antibodies in relation to antigen binding. Pharm Res-Dordr. 2019;36(9). doi:10.1007/s11095-019-2652-1. PMID: WOS:000479149500001.
- Liu H, Ponniah G, Zhang HM, Nowak C, Neill A, Gonzalez-Lopez N, Patel R, Cheng G, Kita AZ, Andrien B. In vitro and in vivo modifications of recombinant and human IgG antibodies. MAbs. 2014;6(5):1145–1154. doi: 10.4161/mabs.29883. PMID: 25517300.