
 ?Mathematical formulae have been encoded as MathML and are displayed in this HTML version using MathJax in order to improve their display. Uncheck the box to turn MathJax off. This feature requires Javascript. Click on a formula to zoom.
ABSTRACT
Monoclonal antibodies (mAbs) as therapeutics necessitate favorable pharmacokinetic properties, including extended serum half-life, achieved through pH-dependent binding to the neonatal Fc receptor (FcRn). While prior research has mainly investigated IgG-FcRn binding kinetics with a focus on single affinity values, it has been shown that each IgG molecule can engage two FcRn molecules throughout an endosomal pH gradient. As such, we present here a more comprehensive analysis of these interactions with an emphasis on both affinity and avidity by taking advantage of switchSENSE technology, a surface-based biosensor where recombinant FcRn was immobilized via short DNA nanolevers, mimicking the membranous orientation of the receptor. The results revealed insight into the avidity-to-affinity relationship, where assessing binding through a pH gradient ranging from pH 5.8 to 7.4 showed that the half-life extended IgG1-YTE has an affinity inflection point at pH 7.2, reflecting its engineering for improved FcRn binding compared with the wild-type counterpart. Furthermore, IgG1-YTE displayed a pH switch for the avidity enhancement factor at pH 6.2, reflecting strong receptor binding to both sides of the YTE-containing Fc, while avidity was abolished at pH 7.4. When compared with classical surface plasmon resonance (SPR) technology and complementary methods, the use of switchSENSE demonstrated superior capabilities in differentiating affinity from avidity within a single measurement. Thus, the methodology provides reliable kinetic rate parameters for both binding modes and their direct relationship as a function of pH. Also, it deciphers the potential effect of the variable Fab arms on FcRn binding, in which SPR has limitations. Our study offers guidance for how FcRn binding properties can be studied for IgG engineering strategies.
Introduction
The use of monoclonal antibodies (mAbs) to treat diseases such as cancer and inflammatory diseases is rapidly expanding.Citation1,Citation2 These bivalent, homodimeric, and Y-shaped molecules are composed of two antigen-binding fragments (Fabs), responsible for specific binding to an antigen (target) and a constant crystallizable fragment (Fc) that mediates Fc receptor functionality. Regarding monospecific therapeutic mAbs, current research activities focus on their target specificity, binding strength, and developability.Citation3–5 For instance, a key challenge is to achieve optimal selectivity for the recognition of (heterogeneous) antigens on tumor or immune cells or for soluble antigens while avoiding detrimental off-target binding to healthy cells.
While the constant Fc can engage Fc receptors to mediate effector functions, it is also responsible for a long serum half-life, which for natural IgG antibodies is approximately 3 weeks at average.Citation6 As such, IgG is the dominant antibody class in blood, and acts as a key component of humoral immunity. In this regard, the long serum half-life of natural IgG and IgG-based therapies results from engagement of the neonatal Fc receptor (FcRn).Citation7
FcRn is a ubiquitously expressed cellular receptor across mammalian cells, encompassing both hematopoietic and non-hematopoietic cells.Citation8 In contrast to classical Fcγ receptors, which are primarily displayed on the surface of immune cells, FcRn is predominantly localized within acidified endosomes. The intricacies of FcRn’s expression density within the endosome remain incompletely understood. However, D’Hooghe et al.Citation9 have proposed a dynamic model of FcRn activity that suggests an interplay between the plasma membrane and endosomal FcRn levels. According to this model, a minimal expression of FcRn is present on the plasma membrane, with the majority residing in the endosomal system. This distribution is facilitated by the fluidity of the membrane, which allows for high local concentrations of FcRn within endosomes, enabling the receptor to engage with IgGs in a unique manner. Pzyik et al.Citation10 describe a scenario in which two FcRn molecules simultaneously bind to a single IgG, a process termed avidity. Avidity is known as the cumulative binding strength that results from multiple non-covalent interactions where simultaneous binding increases the overall stability of the interaction beyond the strength of individual affinities.Citation11,Citation12
In addition, the expression level of FcRn can vary depending on the cell type and tissue, as well as species.Citation13 For instance, data support that FcRn is highly expressed in immune cells and epithelial cells of tissues such as the placenta, liver, intestine, and endothelial cells of blood vessels.Citation14,Citation15 In disease such as cancer, different FcRn expression profiles have been observed, and the effect on tumor growth is debated.Citation16,Citation17
The long half-life of IgG is regulated by FcRn-mediated recycling of monomeric IgG molecules in a range of cell types, which happens in a strictly pH-dependent manner, with strong binding at acidic pH and no or weak binding at neutral pH. Mechanistically, cellular uptake occurs via fluid-phase pinocytosis of IgG followed by engagement of FcRn in acidified endosomes (pH < 6.0), which results in recycling and exocytosis of the FcRn-IgG complex that, upon exposure to the physiological condition (pH 7.4) of the extracellular space, triggers release of IgG from the receptor due to negligible binding affinity.Citation10,Citation18–20 As such, FcRn rescues IgG from intracellular lysosomal degradation, while other serum proteins are designated for degradation. The principle is the same for FcRn-mediated transcytosis of both monomeric IgG and IgG-immune complexes that occurs bidirectionally across polarized epithelial cells.Citation21–23 These transport pathways explain the high abundance of IgG in blood and its long serum half-life. In addition, FcRn has been shown to enhance processing of IgG-containing immune complexes in concert with the classical Fcɣ receptors expressed by antigen-presenting cells, such as dendritic cells, which leads to antigen presentation and activation of T cells.Citation24–26
Structurally, FcRn is related to class I major histocompatibility complex (MHC) molecules, consisting of a unique membrane-bound alpha chain (alpha-FcRn) that is non-covalently associated with the common soluble beta-2-microglobulin.Citation27–30 The extracellular part of FcRn binds to the Fc’s CH2-CH3 interface via residue Ile253 and inter- and intra-molecular interactions mediated by His310 and His 435.Citation28,Citation31 These histidine residues change charge as a function of pH by becoming protonated at pH 6.0, which is required for strong binding to FcRn at acidic pH and negligible binding at pH 7.4.Citation32 Replacement of these or neighboring amino acid residues could either reduce, abolish or enhance FcRn binding. For instance, mutating the three key residues to alanines (I253A, H310A, H435A; AAA) completely abolishes binding while combination of mutations has shown to improve pH-dependent binding beyond that of wild-type (WT) IgG. For the latter, examples are LS (M428L/N434S), KF (H433K/N434F) and YTE (M252Y/S254T/T256E) that all show extended serum half-life in animal models and humans.Citation33–38 Specifically, a YTE-containing human IgG1 that demonstrated 10-fold stronger in vitro binding to human FcRn at acidic pH while still showing weak binding at neutral pH exhibited an extended half-life of up to 100 days in humans compared to the WT counterpart.Citation33,Citation35,Citation39
While the principle for pH-dependent binding between FcRn and IgG is well established, there is still a matter of debate regarding how FcRn embedded in a cell membrane engages the homodimeric IgG molecule regarding stoichiometry, orientation, and binding kinetics throughout the pH gradient. Abdiche and co-workers Citation40 demonstrated that two FcRn molecules can bind independently to a homodimeric IgG1 Fc at two opposing sites with equal affinity, a finding supported by the symmetrical FcRn-Fc complex structure reported by Burmeister et al. Citation28 Furthermore, Abdiche et al. Citation40 found that heterodimeric IgG1 with only one available FcRn binding site had a significantly reduced plasma half-life compared to the WT counterpart, highlighting the need for bivalent engagement (avidity) of both IgG heavy chains for extended serum persistence. Conversely, Gurbaxani and Morrison Citation41 proposed a more intricate model with multiple binding modes, which could not account for all observed data. Avidity plays a crucial role not only in FcRn biology but is also essential across antibody biology including antibody–antigen interactionsCitation42 and effector functions such as complement activation.Citation43,Citation44
In addition, a growing body of evidence also supports that the biophysical features of Fab arms may modulate the interaction with FcRn, and as such the half-life.Citation45,Citation46 Thus, it is attractive to develop interaction assays that take this complex biology into consideration.
The interaction between FcRn and IgG, typically measured using surface plasmon resonance (SPR)Citation40,Citation47 and other technologies,Citation48 is often assessed at acidic pH around 5.8 and neutral pH at 7.4. However, these conditions may not accurately reflect the bivalent Fc binding that occurs across a pH gradient, where two FcRn molecules can simultaneously interact with one IgG in a 2:1 stoichiometry.
To gain insights into the complexity of the FcRn-IgG interactions with the aim to determine both affinity (1:1) and avidity (2:1) as a function of pH, we explored the use of the switchSENSE technology. In contrast to direct amine coupling of a ligand to a biosensor surface or via capture molecules done by SPR,Citation49 this technology relies on a planar gold electrode where the ligand is attached to the distal end of DNA nanolevers that are covalently attached to the surface, whereas the analyte is injected with a constant flow.Citation50 This setup has shown to allow measurement of complex interactions that can directly correlate affinity and avidity parameters.Citation51–54
By immobilizing a recombinant human single-chain FcRn (hsc-FcRn), which engages IgG monovalently, followed by injection of IgG, which engages bivalently, we demonstrate that the switchSENSE technology results in monovalent (affinity) and bivalent (avidity) receptor interactions simultaneously at a certain ligand density and pH. We performed a comprehensive analysis of the FcRn-IgG interactions revealing insights into the direct relationship between both binding modes, which could more adequately decipher affinity from avidity compared with that of comparable SPR experiments, and that complemented studies using analytical FcRn affinity chromatography and a human endothelial cell-based recycling assay (HERA).
Assay configurations differ significantly, and the resulting dissociation constants (KDs) for IgG-FcRn interactions can vary widely, ranging from 10 to 100 nM with immobilized FcRn, to 0.2 to 2.3 µM with immobilized IgG.Citation33,Citation46,Citation55–58 These variations in affinity measurements preclude a straightforward extrapolation of a standardized, meaningful method for comparing IgG affinities. The switchSENSE protocol presented herein promises to be a valuable tool for guiding research on the interaction dynamics between FcRn and various IgG formats, including Fc-engineered variants and other receptor-targeting modalities. This method offers a refined approach to dissecting the nuances of pH-dependent binding and provides a robust framework for differentiating between affinity and avidity, thereby enriching our understanding of FcRn-IgG interactions in a comprehensive manner.
Results
Assay design considerations
To investigate an interaction between an analyte and a ligand using a surface biosensor, two assay orientations are possible. Which one that is preferred will depend on the biology in question, resulting in immobilization of a bivalent or monovalent-binding partner, as shown in . If the bivalent-binding partner, such as IgG, is immobilized (), the monovalent partner in solution, FcRn, would be able to bind IgG in a monovalent fashion. This binding mode will occur independently from the ligand surface density, and bivalency of the immobilized partner is not relevant in orientation A as it merely affects the number of available binding sites on the surface. Hence, orientation A exclusively probes the affinity-binding mode. When measuring the interaction between FcRn and IgG in setup A, the pH-dependent self-interaction of the receptor should be taken into consideration, which may occur concurrently with the FcRn-IgG interaction under acidic pH conditions and pose a challenge in distinguishing between the two effects.Citation59 To circumvent problems with ligand density control and measurement artifacts on conventional sensors, it has been suggested as good practice to choose assay orientation A to avoid the occurrence of avidity altogether. This assay orientation may be beneficial for undisturbed affinity values and has also been demonstrated to resolve affinity values for FcRn,Citation40 however the IgG-FcRn interaction reflects a more complex mechanism.
Figure 1. Assay orientations to investigate the interaction between a monovalent and bivalent-binding partner. (a) The monovalent partner as solute analyte = FcRn. (b) The bivalent partner as solute analyte = IgG. Illustrations are created with BioRender.com.
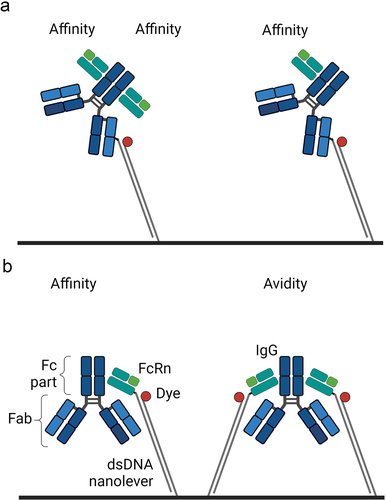
In the opposite orientation (), the monovalent-binding partner (FcRn) is immobilized and the bivalent partner is in solution (IgG). In this case, IgG may engage the immobilized receptor with either one or two Fc binding sites, which may result in measurement of both binding modes – affinity and avidity – simultaneously. At medium immobilized densities, one fraction of the receptor may become interlinked by IgG (2:1 binding) while another fraction not interlinked (1:1 binding), cf. and .
Table 1. The relationship between assay orientation, ligand density, and resulting binding modes. IgG = bivalent binder, FcRn = monovalent binder.
Irrespective of the technology used, our approach does not rely on immobilizing an absolute number of FcRn ligand molecules, acknowledging the dynamic expression of FcRn on the membrane. We focus on achieving a ligand density that allows for the clear detection and discrimination of both affinity and avidity interactions with FcRn. By employing switchSENSE technology, we aim to simultaneously measure these binding modes of similar magnitude, ensuring accurate analysis of the FcRn-IgG interactions without the influence of artifacts.
To test this, a commercially available switchSENSE biochip was used, with medium FcRn density. Specifically, the DNA nanolevers, 32 nm in length, are covalently attached to the surface with approximately 50 nm in distance. The complementary strand is functionalized with soluble recombinant FcRn via a short linker, both (DNA + linker) allow flexibility and rotation. As such, the receptor is disengaged from the surface within the flow channel, which reduces surface-related effects like steric hindrance.
Utilizing fitting models to evaluate SPR or switchSENSE-derived sensorgrams exhibiting biphasic-binding behavior typically leads to the expression of two overlapping dissociation phases. One dissociation phase results from the affine binding (fast dissociation) and the second one from the avid-binding mode.
To address avidity effects, we chose orientation B. Model mAbs (WT vs YTE), mAb1, and mAb2, both human IgG1 (hIgG1) antibodies were characterized. Mab1 and mab2 WT as well as mab1 and mAb2 YTE variant, share the same Fc part for each set, but show different target binding (Fab patches). For immobilization, we took advantage of a recombinant human single-chain FcRn (hsc-FcRn) in which the truncated alpha chain is fused to beta-2-microglobulin via a 4G4S linker to ensure a stable folded complex, as described.Citation60
Here, we established a universal assay using the switchSENSE platform, without the necessity for surface density adjustment and revealed all relevant kinetic parameters, including both, affinity and, critically the avidity-binding mode of FcRn. The association and dissociation kinetics of FcRn – IgG antibodies were measured by fluorescence proximity sensing (FPS) in real-time. Kinetic rates for affinity and avidity were modeled accordingly.
Comparative interaction analysis of antibody Fc variants with FcRn at pH 6.0 across different technology platforms
In a first set of experiments, we show that our chosen assay setup works robustly having hsc-FcRn immobilized and the model hIgG1 in solution (). Here, we compare a mAb1 and mAb 2 (Fc WT vs. Fc YTE) at pH 6.0 with SPR and FcRn affinity chromatography. Immobilizing FcRn emulates the physiological context of cell surface interactions, representing an optimal experimental design for assay implementations across technologies. Consequently, we opted to utilize an FcRn density exhibiting complex-binding kinetics. Our system is anticipated to measure both the affine (1:1) and avid (2:1) binding mode simultaneously. In accordance with these expectations, we analyzed the acquired sensorgrams by implementing a bivalent binding model that accurately represents the kinetic data (materials and methods). As shown in bivalent binding is mainly prominent during the dissociation phase, having two species on the biosensor surface that can be resolved, while the association phase is monophasic.
Figure 2. Kinetic analysis of immobilized human FcRn and a human IgG1 (mAb1) in solution at pH 6.0 utilizing a medium FcRn density on a switchSENSE biosensor chip. (a) shows the schematic assay configuration allowing affinity and avidity to occur simultaneously. mAb1 was injected in five different concentrations as two-fold dilution series with a highest concentration of 300 nM for hIgg1 Fc WT (b) and 60 nM for hIgg1 Fc YTE (c). Each plot (b,c) shows the measured raw data (gray) and the global fit analysis as solid lines (blue fading). The sensorgram display a monophasic association phase and biphasic dissociation phase reflecting affinity and avidity binding mode. The determined kinetic parameters are described in . Illustration a is created with BioRender.com.
Table 2. Summary of the affinity and avidity measurements of immobilized human FcRn and an mAb1 Fc variants in solution using a switchSENSE biosensor chip having a medium ligand density. The kinetic rate parameters are determined from analyzing the sensorgrams shown in . The kON, kOFF and KD values are results from a global fit analysis ± fitting error.
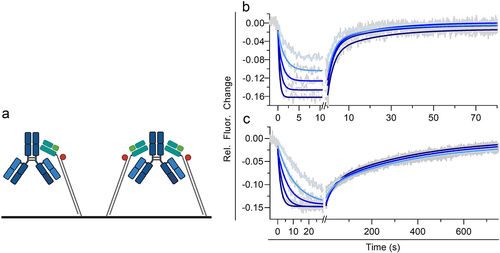
The bivalent-binding model we chose, revealed similar observations for both mAb1 Fc WT and YTE variant. The monophasic association phase (kON) is followed by a biphasic dissociation phase showing a fast dissociation rate (kOFF,AFFINITY) and slow dissociation rate (kOFF,AVIDITY) reflecting affinity and avidity-binding mode (). The avidity effect is mainly visible via the dissociation rate kOFF. To account for subtle alterations in kON we focused on assessing the dissociation constant (KD) in the comparative evaluation of the two antibody variants and all further experiments. At pH 6.0 we find an KD,AFFINITY,WT of 45.4 nM for mAb1 Fc WT compared to Fc YTE showing a KD,AFFINITY,YTE of 3.09 nM. The second kinetic species displays a much slower dissociation rate constant (KD,AVIDITY), reflecting the FcRn avidity-binding mode. For Fc WT and Fc YTE, KD,AVIDITY,mAb1-WT was 6.24 nM and KD,AVIDITY,mAb1-YTE was 0.29 nM. To confirm the switchSENSE affinity from the applied bivalent model, we generated a low FcRn density. The binding kinetic of mAb1 Fc WT and FcRn at pH 6.0 could be exclusively described by a monovalent fit model (Figure S1a,b). This reflects the affinity-binding mode where one IgG interacts with one FcRn. The weak interaction resulted in similar kinetic parameters in accordance with the medium ligand density showing affinity and avidity (KD,AFFINITY,medium 45.4 nM vs KD,AFFINITY,low 57.0 nM, Table S1).
The second antibody set, mAb2 WT/YTE, share the same Fc regions corresponding with mAb1 variants, but bind a different target, thereby displaying different variable regions (VH/VL). As mAb2 shows a different Fab patch, it differs from mAb1 in affinity and avidity (different kinetic profile, Figure S2, Table S2). At pH 6.0 mAb2 WT is 21× more affine, while YTE is fivefold stronger in affinity, compared to the mAb1 variants. For a direct comparison with Biacore SPR technology, we captured low (12 RU) and medium FcRn (140 RU) levels on a C1 chip, allowing affinity (low) and affinity and avidity (medium) to occur simultaneously. To ensure the validity of our kinetic analyses, we meticulously assessed the goodness-of-fit for each sensorgram. This assessment was based on the examination of residuals and the analysis of the kinetic rate parameters obtained. SPR was not capable of resolving reliable-binding kinetics for mAb1 WT and mAb2 WT on both densities (Figure S3 A-C and Table S3). Furthermore, SPR could not distinguish between affinities and avidities and the resulting Fab influence of both YTE variants (Figure S3d-e and Table S3) as switchSENSE did. In contrast to SPR, FcRn affinity column clearly resolved the varying FcRn interactions in the same ranking as switchSENSE (from weak to strong binding): mAb1 WT < mAb2 WT < mAb1 YTE < mAb1 YTE (Figure S4). A human endothelial cell-based recycling assay (HERA assay, Figure S5) is also in agreement with our findings (method described previously.Citation61 Here, the mAb1 YTE variant demonstrated improved uptake and recycling, leading to enhanced trafficking properties, in contrast to the WT, which lacked efficient trafficking.
We demonstrated the feasibility of resolving the FcRn-IgG interaction applying switchSENSE, and its superiority in differentiating between affinity and avidity within one measurement resolving all relevant kinetic rates. We confirmed that the two events correspond to interlinked (slow dissociation, avidity-binding mode) and non-interlinked (fast dissociation, affinity-binding mode) species. Our results indicate that there is no discernible benefit in performing additional measurements at lower or higher ligand densities that could potentially modify the affinity–avidity relationship or give rise to measurement artifacts. SwitchSENSE could also differentiate between mAb1 and mAb2, displaying a potential Fab contribution.
Considering the weak interaction of mAb1 WT – FcRn at pH 6.0 (kOFF,AFFINITY = 0.35 s- 1, pH 6.0), and its insignificance for antibodies with improved pharmacokinetics, an in-depth analysis performing a pH screening is not conducive to the goal. Therefore, we decided to conduct subsequent measurements using mAb1 Fc YTE, which exhibits enhanced binding strength for FcRn, and directly compare switchSENSE with SPR in more detail.
Transition from affinity to avidity: a systematic analysis of the pH-dependent FcRn-mAb1 (YTE) interaction
The cell surface dynamics of FcRn are highly complex, with membrane-bound FcRn and FcRn associated with intracellular endosomal compartments (>90%) showing significant variation.Citation9 It has been proposed that 50% is rapidly endocytosed and mixes with 96% of cellular FcRn in an internal pool.Citation9 This leads to drastically increased FcRn concentration at the acidified endosomal membrane, where avidity presumably occurs. FcRn-associated vesicular trafficking is a dynamic process with speeds up to 3 µm/s, indicating rapid IgG uptake and intracellular movement where affinity and avidity are assumed to be important.Citation62 Understanding FcRn-IgG interactions requires analyses of pH modulation from acidic to neutral throughout the endosomal acidification process, rather than just at extreme pH values, to assess affinity and avidity effectively.
Binding kinetics of FcRn – mAb1 YTE applying switchSENSE and SPR
To characterize how the affinity and avidity of mAb1 YTE and hFcRn change over a pH range from 5.8 to 7.4, we inject mAb1 YTE over immobilized hFcRn while incrementally increasing the pH by 0.2. The obtained sensorgrams are shown in with the derived kinetic rate parameters in . mAb1 YTE was injected at 5 different concentrations in a two-fold dilution series for each pH value in an overall concentration range from 3.75 nM to 800 nM. MAb1 YTE mutant shows binding over a broad range. This enables us to understand how the change in pH influences the kinetic rate parameters (kON and kOFF) up to a pH of 7.4. All kinetic-binding experiments were conducted with careful consideration of ligand density and the potential for measurement artifacts. Even in the case of monovalent interaction, which solely permits affinity, measurement artifacts may arise due to excessively high ligand densities and insufficiently low flow rates.
Figure 3. Kinetic analysis of human FcRn immobilized and a human IgG1 (mAb1) Fc YTE mutant in solution at nine different pH values on switchSENSE biosensor chip. mAb1 Fc YTE was injected in five different concentration as two-fold dilution series with a highest concentration of (a) 60 nM at pH 5.8, (b) 60 nM at pH 6.0, (c) 100 nM at pH 6.2, (d) 150 nM at pH 6.4, (e) 200 nM at pH 6.6, (f) 300 nM at pH 6.8, (g) 400 nM at pH 7.0, (h) 800 nM at pH 7.2 and (i) 800 nM at pH 7.4. Note that the x axis for each sensorgram (a – i) has a different time scale. Each plot (a – i) shows the measured raw data (grey) and the global fit analysis as solid lines (blue fading). For (a – h) the dissociation phase is biphasic characterized by two different dissociation rate constants reflecting the affinity (1:1) and the avidity (2:1) binding mode. The interaction displays a biphasic dissociation curve reflecting affinity and avidity binding where one or two hFcrn are engaged with one mAb1 Fc YTE. The dissociation of mAb1 Fc YTE and hFcrn at pH 7.4 (I) is described by a monophasic fit model reflecting the affinity binding mode (1:1) where one hFcrn is engaged with one mAb1 Fc YTE. Panel (J) shows the applied, exemplary biphasic fit model for FcRn with mAb1 Fc YTE mutant injecting 300 nM at pH 6.0. The adequacy of the fit model is confirmed by the minimal residuals, indicating no significant deviation. The association phase occurred to be monophasic while the dissociation phase is biphasic. The overall dissociation curve is superposition of two exponential time-courses, namely the affinity binding mode (fast dissociation) and the avidity binding mode (slow dissociation). The measured data is shown in blue and the fit in black solid lines, whereas the two deconvoluted exponential time-courses are shown in grey as dashed lines. The contribution of fast and slow dissociation to the overall signal change is shown as Amplitude Afast or Aslow. The determined kinetic parameters are described in .
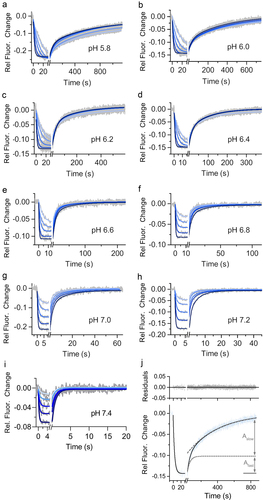
Table 3. Summary of the affinity and avidity measurements of immobilized human FcRn and mAb1 Fc YTE mutant as solute using a switchSENSE biosensor chip having a medium ligand density. The kinetic rate parameters are determined from analyzing the sensorgrams shown in . The kON, kOFF and KD values are results from a global fit analysis ± fitting error.
For this reason, the implementation of an assay setup that allows simultaneous analysis of affinity and avidity is explained in detail. In all kinetic measurements, especially in the assay setup presented here, control over the ligand density is critical. Ligand molecules on a biosensor surface exhibit a random distribution, rendering the interlinking of ligands by a bivalent analyte a statistically driven process. Regulation of the spatial arrangement of ligands is a crucial parameter, as it influences the extent of interlinking. There are two (hypothetical) extreme assay setups having very low density or very high densities. Analyzing 100% avidity or 100% affinity is challenging to achieve and both extremes do not reflect the real experimental situation.
For low densities, a non-negligible probability exists that two ligands are close enough to become interlinked. Due to a lower limit of detection for technologies, it might not be resolvable. For high densities, the successive adsorption of analytes to the surface results in the creation of monovalent ligand sites. Some ligands that potentially cannot engage in a bivalent interaction will always be left.
The association phase of IgG to FcRn is characterized by a monoexponential fit, while the dissociation phase displays a biphasic pattern, with relative amplitudes of (50 ± 20)%, representing equal contributions from affinity (1:1) and avidity (2:1) binding interactions. This indicates that the applied ligand density successfully captures both binding events (Figure S6). Notably, the amplitudes Afast and Aslow of each exponential term in the dissociation show a dependency of the analyte (IgG) concentration used (Figure S7). With increasing concentrations of hIgG1 Fc YTE, the contribution to the fast, affinity-based species to the overall dissociation curve increases while the slow avidity driven species decreases. This phenomenon was also previously described elsewhere.Citation54
The analysis of the biphasic dissociation phase using a double exponential fit model is readily achieved through non-linear least square fitting algorithms, which is a computational method employed to minimize the sum of the squares of the differences between observed and predicted values in a data set (Materials and Methods). However, the following preconditions have to be met. First, for a robust fit analysis, the amplitude of each component needs to be significant, i.e., larger than 10%. The amplitude reflects the respective contributions of the different dissociating species to the overall dissociation curve. Second, the measurement time selected has to long enough that the slow time constant can be analyzed (one-time the observable time constant tauOFF = 1/kOFF as reference value). Resolving a dissociation rate of 0.01 s−1 requires measurement of the dissociation for 100 sec or an kOFF of 0.001 s−1 for 1000 sec. A 5% rule is cited in literature,Citation63 but here we exceeded this for all kinetic data sets. Next, the selected sampling rate must be high enough to generate data points (here 10 Hz) sufficient for the analysis of fast time constants. For the mathematical deconvolution of the two species, it is imperative that the two time constants exhibit a significant disparity, with a minimum factor of two distinguishing them, to ensure accurate differentiation. Ultimately, a flow rate of 1000 µL/min was implemented to effectively surmount any potential mass transport limitations that may arise during the experiment.
To strengthen the primary objective of our study to simultaneously differentiate between affinity and avidity in the context of the FcRn – IgG interaction and to elucidate the pH dependency of this interaction in detail, showing that switchSENSE is a viable and effective platform for its characterization, we performed a comparison with Biacore SPR.
We captured hsc-FcRn (via Neutravidin) at 3 different densities, low (12 RU), medium (140 RU), and high (1100 RU) on a C1 chip and injected mab1 YTE at different concentrations for 5 different pH values (5.8, 6.0, 6.4, 6.8, 7.4). Low FcRn densities could be modeled applying a 1:1 fit (BiaEvaluation Software), displayed by the small and randomly distributed residuals, demonstrating the affinity-binding mode (Figure S8, Table S4). At pH 7.4 SPR reached its limitation in reliability measuring kinetic rates (kON). SwitchSENSE and SPR dissociation rates (kOFF,AFFINITY) are within the same range (max. two-fold difference), but on rates (kON) determined with switchSENSE are >10-fold faster ( vs. Table S4). For medium and high density, more complex models (bivalent analyte and heterogeneous ligand model) were applied (Figure S9), to account for simultaneous occurrence of both affinity and avidity interactions, which was the intentional aspect of our experimental design. Both models could not resolve high-FcRn density data (Figure S9 B+D), shown by the systematic pattern of residuals, indicating a poor fit.
To further investigate the potential of SPR to decipher affinity and avidity within one experiment, medium FcRn density was evaluated, applying the heterogeneous ligand model (Figure S9 C). Notably, the model clearly showed systematic deviations (compared to switchSENSE, ), suggest it is lacking critical factors and the underlying assumptions are not applicable to the data set in question. However, we applied it to all FcRn medium density sensorgrams (Figure S10 and Table S5), as it is the model with the highest degree of freedom available within Biacore’s SPR Evaluation Software. Results were compared with switchSENSE data. The “fast” component of the model, which is intended to represent the affinity interaction, aligns approximately with the 1:1 binding model results for low FcRn density. However, the “slow” component, which is hypothesized to reflect the avidity interaction, did not yield reliable kinetic rates. The rates were similar across different pH levels, contradicting the expected trend of decreased binding with increasing pH. Additionally, the maximum response levels (Rmax) were too low to confidently determine valid kinetic rates. Further increasing the density results in even poorer fitting as for medium density (residuals) thus was not applicable.
Here, we demonstrated the feasibility of switchSENSE in measuring, differentiating and analyzing affinity and avidity of the FcRn – mAb1 YTE interaction by using an assay setup designed to facilitate the simultaneous occurrence of both binding events. While SPR is a reliable technology in determining affinities, it was not capable of capturing the complexity of the FcRn-antibody interactions, particularly in the context of avidity.
Developing an affinity-to-avidity binding model
The elucidation of FcRn – mAb1 YTE’s complex interactions provides substantial insights for the establishment of a representative model system, facilitating the characterization of the fundamental mechanisms governing this molecular interplay. Typically, the interaction dynamics of biomolecules are governed by transient, non-covalent binding occurrences. The simplest form of binding, the monovalent interaction of two molecules with exactly one binding site for each other, can be characterized by three biophysical parameters: the kinetic rate constants of association and dissociation (kON and kOFF), and the dissociation constant (KD = kOFF/kON). When two or more binding sites are involved in a molecular interaction simultaneously, the interpretation of binding needs to be expanded by the concept of avidity, which denotes the enhancement of the overall binding strength of a molecular complex due to the formation of multiple bonds. The avidity enhancement may result from an increased formation propensity of the molecular complex (a faster kON), or a higher complex stability (a slower kOFF), but frequently arises from a combination of both effects. To comprehend the mechanism of action and regulation of such systems, it is necessary to understand avidity effects in detail. However, even if the affinities of the individual-binding sites are known, currently it is impossible to predict the avidity enhancement quantitatively.
depicts an illustration of the free state and the two types of bound states for a bivalent analyte interacting with ligands on a surface. In the simplified picture, the avidity adjusts according to the absolute and relative contributions of the individual on- and off-rates of the transitions 0 ↔ 1 and 1 ↔ 2.
Figure 4. Schematic depiction of a bivalent analyte (IgG) interacting with a monovalent ligand (FcRn). State 0 shows the free state of monovalent FcRn (immobilized) and bivalent IgG (in solution). The transition from State 0 to State 1 illustrates that the bivalent analyte associates with one binding site on FcRn (kON1 and kOFF1). in its subsequent transition to State 2 the IgG concurrently binds via its second binding site to another FcRn, which is in close proximity to the first one, thereby forming a bivalent complex. The avidity occurs accordingly to the absolute and relative contributions of the individual on- and off-rates of the transitions 0 ↔ 1 and 1 ↔ 2. The dynamic dissociation and re-association of one to two binding sites, the transition 2 ↔ 1 ↔ 2 (kONapp. and kOFFapp.), is crucially important for the effective off-rate and hence for the avidity. Typically, it is impossible to differentiate between singly bound and doubly bound states within the measurement signal. As a result, only the ‘observable’ kinetic rates (kONobs. and kOFFobs.) between the free and any type of bound state are measured. The illustration is created with BioRender.com.
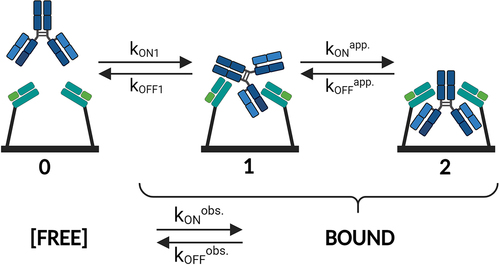
In particular, the dynamic dissociation and re-association of one to two binding sites, namely transitions of the kind 2 to 1 to 2 (kONapp..and kOFFapp.), is crucially important for the effective off-rate (kOFF,AVIDITY) and hence for the avidity enhancement. It is noteworthy in this context that, in the majority of experiments, distinguishing between singly bound and doubly bound states within the measurement signal is not feasible. Consequently, only ‘observable’ on- and off-rates (kONobs. and kOFFobs.) between the free and any kind of bound state are being measured, as indicated in the lower part of . The transition of 2 ↔ 1 ↔ 2 is not visible in the measurement signal. Utilizing the switchSENSE technology, we discern the transition from 1 to 0 (kON1 and kOFF1) in the fluorescence signal predominantly through a rapid dissociation rate, which mirrors the affinity-binding mode. It is equivalent to the measured kinetic rate parameters kON and kOFF,AFFINITY. The affinity can be distinguished from the transition of 2 to 0, reflecting the avid-binding mode (kOFF,AVIDITY). Avidity is only observed when both binding sites (Fc heavy chains) are concurrently disengaged from FcRn at a given point in time. In this scenario, a second association rate (0 to 2) is not discernible as a change in the fluorescence signal transpires through its initial contact.
Affinity-avidity analysis of FcRn with mAb1 Fc YTE
To comprehend how the affinity and avidity of mAb1 Fc YTE and FcRn alter over a pH range from acidic to neutral, we graphed the kinetic rates from in a rate scale plot (). The mAb1 YTE variant demonstrates binding to FcRn across a wide range, making it an ideal candidate for such a comprehensive analysis and for examination of the kinetic rate parameters in relation to pH. All kinetic rate parameters, indicative of affinity and avidity, were computed and ascertained by applying a biphasic fit model for the dissociation phase, while the association phase was observed to be monophasic (Materials and Methods). The rate scale plot facilitates a systematic analysis of kinetic rate parameters from multiple conducted experiments, enabling an understanding of their correlation at a single glance. As depicted in , the upper y-axis represents the association rate constant (kON), while the lower y-axis signifies the dissociation rate constant (kOFF) for affinity (kOFF,AFFINITY) and avidity (kOFF,AVIDITY) respectively. Both axes are on a logarithmic scale. An inference about the binding strength can be directly derived from the rate scale plot. Both binding rates (kON and kOFF), each represented by a data point, with increasing pH from left to right, are linked by a vertical line. The distance between the data points, or alternatively, the length of the connecting line, mirrors the binding strength, i.e., weaker interactions result in closer points.
Figure 5. Rate scale plot of FcRn (ligand) and mAb1 YTE variant (solute) at a pH from 5.8 to 7.4. The plot allows the comprehensive comparison of multiple kinetic rate parameters obtained from several kinetic experiments/sensorgrams at one glance. The upper plot shows the association rate (kON) while the lower plot shows the dissociation rate (kOFF) as logarithmic scale. Each kinetic rate parameter pair is connected via a vertical line where its length or else the distance of the two data points gives insights about the binding strength of the measured interaction. The proximity of the data points corresponds to a weaker interaction, or in other words, an increase in the dissociation constant KD. The data points are shown as mean ± SD* (*smaller than the data points, thus not visible). To obtain an inflection point the affinity dissociation rates (kOFF,AFFINITY) are fitted by a Four Parameter Logistic (4PL) fit shown in gray (EquationEquation (6)(6)
(6) ) resulting in a transition at pH 7.2 (Figure S11).
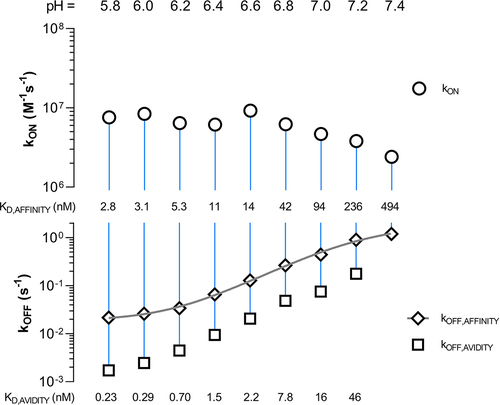
For the mAb1 YTE and FcRn, the association rate (kON) exhibits only a minor alteration in response to pH variation. Up to and inclusive of pH 6.6, it remains within the range of 6.14 × 10⁶ M−1s−1 to 9.23 × 10⁶ M−1s−1 (kON,pH5.8 = 7.58 × 10⁶ M−1s−1). Commencing at a pH value of 6.8, it slightly decreases by a factor of three up to pH 7.4 (kON,pH7.4 = 2.41 × 10⁶ M−1s−1). The corresponding affinity off-rates are kOFF,AFFINITY,pH5.8 = 2.15 × 10⁻² s−1 and kOFF,AFFINITY,pH7.4 = 119 × 10−2 s−1. The affinity dissociation rate (kOFF,AFFINITY) increases by a factor of 54 whereas the overall change in KD,AFFINITY is approx. 170-fold (KD,AFFINITY,pH5.8 = 2.84 nM vs. KD,AFFINITY,pH7.4 = 494 nM). By using a four-parameter regression model (EquationEquation (6))(6)
(6) on the sigmoidal, increasing affinity dissociation rates across the entire pH spectrum, an inflection point is identified at pH 7.2 (, Figure S11).
The avidity-binding mode exhibits a low dissociation constant (KD,AVIDITY) of KD,AVIDITY,pH5.8 = 0.23 nM, which increases to KD,AVIDITY,pH7.2 = 46.2 nM at pH 7.2 and becomes unobservable at pH 7.4. This results in a 200-fold change in KD,AVIDITY. To thoroughly characterize the relationship between avidity and affinity, it is crucial to examine the pH dependency across the entire range.
Avidity switch of FcRn – hIgg1 Fc YTE variant
To address the question how avidity and affinity for the FcRn – hIgG1 Fc YTE interaction correlate, we focused on comparing the dissociation constants KD,AFFINITY and KD,AVIDITY and performed a KD analysis (data from )
In the affinity or, correspondingly, avidity case, the antibody binds through one or both Fc heavy chains to one or two FcRn molecules. The overall-binding strength is a combination of both components, affinity and avidity, which are influenced by pH. As depicted in , dividing KD,AFFINITY by KD,AVIDITY yields an avidity enhancement factor for each pH. Plotting the avidity enhancement factors against the corresponding KD,AFFINITY values generates a graph illustrating the relationship between avidity and affinity. It directly assesses the correlation between affinity and avidity as a function of pH change.
Figure 6. Avidity-to-affinity relationship of FcRn and mAb1 YTE variant from pH 5.8 to 7.2. The ratio of the KD values (KD,AFFINITY/KD,AVIDITY), referred to as avidity enhancement factor increases from neutral to acidic pH. The higher the binding strength (affinity) the more its contribution to the overall avidity enhancement. Weak affinities occurring at pH 6.4 to 7.4 only show a minor contribution to the avidity effect while strong affinities from pH 5.8 to 6.2 show higher contribution. A transition point is pH 6.2, indicated by the dashed lines. The data points are shown as mean ± SD* (*smaller than the data points, thus not visible).
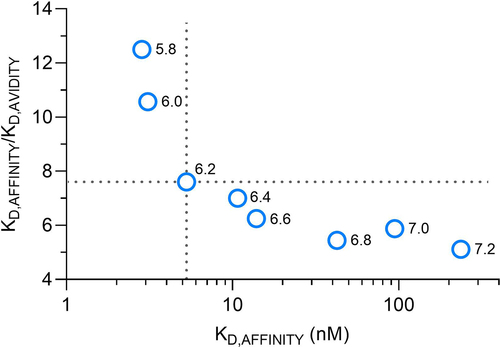
As affinity decreases (lower binding strength) from acidic to neutral pH, the avidity enhancement diminishes due to the reduced stability of the affinity-binding mode. The avidity effect is primarily driven by the dissociation rate. The faster the affinity dissociation rates of FcRn to IgG Fc YTE, the less significant its contribution to the overall avidity. Conversely, the strong affinity of FcRn and IgG at acidic pH leads to an increased contribution to the overall avidity. The IgG YTE heavy chains are stabilized in the acidic environment via FcRn and its avid-binding mode.
Specific to the characterized FcRn – IgG Fc YTE interaction is the avidity enhancement factor around pH 6.2, which displays a pH-switch from strong to weak avidity enhancement, as indicated by the dashed lines. This primarily results from the interplay of the absolute and relative contributions of the individual on- and off-rates of the transitions from 2 to 1 to 2 (). At a pH value of 7.4, the affinity dissociation rate is so rapid that there is no observable contribution to an avidity effect at all. Only the affinity-binding mode was resolved and the avidity to affinity switch is off.
Discussion
The importance of avidity in both in vitro and in vivo studies is emphasized by the significant contrast in FcRn density between the cell membrane and the endosomal compartment, with the latter exhibiting much higher densities. This is particularly relevant given the ongoing endocytotic trafficking of FcRn at the cell surface, where avidity is favored in the acidic environment of recycling endosomes.Citation9,Citation10 Abdiche et al. Citation40 highlighted the critical role of avidity in FcRn-IgG interactions for enhancing antibody serum half-life. Conversely, Tesar et al. Citation64 suggested that while bivalent engagement is not imperative for transcytosis or recycling at elevated antibody levels, avidity may still influence FcRn-mediated IgG transport. Prior studies that focused on single equilibrium dissociation constants for IgG Fc variants fail to fully capture the intricate nature of their in vivo behavior.Citation47 These findings collectively imply a complex interplay of affinity, avidity, antibody concentration, and FcRn expression in modulating antibody serum half-life.
Our study presents an assay using switchSENSE technology to simultaneously measure FcRn affinity and avidity in a single experiment, capturing all relevant kinetic parameters. This was achieved by examining the interaction between hsc-FcRn and human IgG1 (WT/YTE) variants across a pH range of 5.8 to 7.4. The study thoroughly explored the relationship between FcRn and IgG binding modes and compared the results with SPR, the established standard technique. The research yielded five key insights that enhance the understanding of pH-dependent FcRn-IgG binding, contribute to the broader knowledge of FcRn-IgG biology, and demonstrate how Fc engineering affects not only FcRn affinity but also significantly increases avidity due to bivalent binding. A critical discovery was that conventional SPR assays are insufficient to capture the complexity of this interaction.
First, we highlighted the importance of assay design, ligand density regulation, and meticulous artifact evaluation in studying complex-binding interactions to discern affinity and avidity accurately. By immobilizing FcRn and allowing bivalent IgG to interact with it, our assay uniquely differentiates between affinity and avidity. Considering the dynamic expression of FcRn in vivo, we focus on the robust differentiation between these two binding modes (Figure S6) rather than a fixed FcRn ligand count on the biosensor.
Second, the process of forming bivalent or monovalent FcRn-IgG complexes is concentration-dependent during the association phase (Figure S7). High concentrations of analyte favor the formation of monovalent complexes with a 1:1 stoichiometry, leading to higher contribution to affinity interactions. In contrast, at lower concentrations, bivalent complexes with a 2:1 stoichiometry are more likely, indicative of avid binding. The prevalence of monovalent binding at high analyte concentrations can be explained by the saturation of surface FcRn, thereby preventing bivalent complex formation. This concept aligns with observations from the kinetic analysis of emicizumab using switchSENSE technologyCitation54 and suggests that high antibody concentrations could play a role in outcompeting avid binding, as shown by Tesar et al.’s results,Citation64 notably measured on an FcRn-overexpressing cell line at pH 6.0.
Third, Biacore SPR successfully measured FcRn affinities at low ligand densities, but had limitations with medium densities, struggling to differentiate between affinity and avidity. The data’s reliability was questionable due to potential biases in technique and modeling. The heterogeneous ligand model used by Biacore SPR, while flexible with two sets of rate constants, did not precisely describe the binding data. Although it is the best option available within the Biacore software, it still lacks the capability to distinguish between affinity and avidity compared to the switchSENSE model. Our switchSENSE data indicate a monophasic association phase, suggesting that a second binding event to FcRn, which would contribute to avidity, occurs almost instantaneously due to the proximity-induced high local concentration of FcRn. These findings demonstrate the need for further analytical models and technologies, such as switchSENSE, that can more accurately reflect the biophysical nature of these interactions. SwitchSENSE demonstrated superiority as reliable technology for studying the nuances of FcRn-antibody affinity to avidity relationship.
Fourth, we compare the affinities of IgG Fc YTE with IgG Fc WT. In our study, the association phase appeared to be monophasic as a signal change occurs through its initial contact. Comparing our observations with published literature revealed that changes in FcRn – IgG affinity were primarily driven by a decreasing dissociation rate (kOFF), corroborating our (SPR and switchSENSE) and earlier findings.Citation36,Citation65 Notably, Biacore SPR revealed >10-fold decreased KDAFFINITY than switchSENSE. This distinction is primarily driven by a significantly faster association rate as measured by switchSENSE, exceeding the values obtained via SPR. Dissociation rates are consistent for both technologies. SwitchSENSE utilizes a different methodological approach in presenting the ligand onto the planar sensor surface, compared to other biophysical techniques. Under physiological conditions, the attachment of FcRn to a DNA nanolever via a short linker allows target flexibility and rotation. This configuration positions FcRn at the distal end of the nanolevers, thought to effectively eliminate potential matrix-related surface effects, ensuring optimal target accessibility within the flow channel. A previous switchSENSE studyCitation53 revealed similar findings (both assay orientations), while the determined dissociation constant KD for affinity matched Kinexa data.Citation53,Citation66,Citation67
The affinity dissociation rates for the mAb1 YTE variant, spanning from pH 5.8 to 7.4, exhibit an inflection point at pH 7.2, which could not be uniquely determined by SPR. The structural basis of the pH-dependent antibody binding to FcRn involves residue Ile253 and several histidine residues within FcRn at positions 310, 433, and 435,Citation28,Citation31,Citation32 which are implicated in the pH dependency by becoming protonated at pH 6.0 (pKaHistidine = 6.0).Citation68 At lower pH, FcRn is more thermodynamically stable and the dissociation is significantly slower than at neutral/basic pH.Citation57,Citation68 In a model compound, the pKa for a histidine residue is 6.6, but in an actual protein the pKa depends on the chemical surrounding of the involved histidines and the solvent, with an observed pKa of histidine residues in proteins ranging from 5 to 8.Citation69,Citation70 The discovery of a pKa value of 7.2 for an Fc YTE variant indicates that the histidine molecules are deprotonated relatively late in a nearly neutral environment. This results in a strong affinity of Fc-engineered YTE antibody for FcRn (KD,YTE,6.0 = 3.09 nM) compared to an mAb1 WT antibody (KD,WT,6.0 = 45.4 nM), which is approximately 15 times more affine. The investigated mab2 (WT/YTE), display higher affinities then mAb1, whereas both antibodies only differ in their Fab fragment (Fab patches). They vary in hydrophobic and electrostatic patches, which are known to influence FcRn binding by Fab contributions, as previously described.Citation45,Citation46,Citation48,Citation71,Citation72 Here, SPR data appears to be inconsistent, as it could not resolve the difference in binding of mAb1 YTE mab2 YTE nor measure the affinity for mAb1 WT, and differs with FcRn affinity chromatography data, which was in agreement with the altered interaction found via switchSENSE, as well as HERA assay showing superior recycling of YTE vs. WT.
The robust affinity of the YTE variant at pH 6.0, coupled with its late transition at pH 7.2, correlates with a weak, yet quantifiable affinity at pH 7.4. In direct comparison, we measure a KD for FcRn – mAb1 Fc YTE at pH 5.8 of 2.84 nM and for pH 7.4 the KD is 494 nM, suggesting a 170-fold difference in affinity (KD,7.4/KD,5.8). This extensive range of binding, due to its late deprotonation, further substantiates the superior pharmacokinetic properties of YTE compared to WT. These characteristics contribute to a prolonged half-life and decelerated clearance in transgenic mice, in comparison to the Fc wild type.
Finally, we characterized the relationship between avidity and affinity of FcRn and mAb1 Fc YTE, demonstrating that one IgG engages two FcRn via both heavy chains, resulting in a proposition for a simplified model describing the correlation. A review of the literature reveals diverse assay setups,Citation40,Citation73 binding modesCitation45,Citation46 and complex fit modelsCitation41 primarily comparing single affinity values for both extremesCitation74 (pH 6.0 vs 7.4). In our work, we systematically analyzed the FcRn – Fc YTE interaction within a pH range from 5.8 to 7.4. This detailed examination of the FcRn avidity to affinity relationship for hIgG1 Fc YTE allowed us to observe a pH-switch with a transition point around pH 6.2, which SPR did not resolve. Strong affinities from pH 5.8 to 6.2 show increased avidity contribution (13× for pH 5.8), while weak affinities from pH 6.4 to 7.2 only show minor contribution to the avidity effect (5× for pH 6.8). Notably, there is no measurable avidity contribution at pH 7.4, and exclusively affinity was analyzed. Particularly, the transitions of 2 to 1 to 2 () occur more frequently at a pH value less than 6.2, leading to a strong, observable avidity enhancement, while it is less pronounced above pH 6.2. Comparing the avidity enhancement factor of mAb1 YTE (KD,AFFINITY,YTE/KD,AVIDITY,YTE = 11) and WT (KD,AFFINITY,WT/KD,AVIDITY,WT = 7) at pH 6.0 shows that Fc YTE not only exhibits a higher affinity than Fc WT but also a stronger contribution to the avidity effect. Furthermore, the YTE variant shows a 22-fold stronger avidity compared to Fc WT at pH 6.0 (KD,AVIDITY,WT/KD,AVIDITY,YTE).
Interpreting this finding in a physiological context implies that during endosomal acidification, the YTE mutant binds to FcRn much earlier than Fc WT due to its higher affinity and avidity-driven FcRn complex stability. In the extracellular space (pH 7.4), avidity is switched off, and a rapid antibody release occurs. These properties are desirable for an antibody Fc engineering with a superior recycling mechanism and an extended serum half-life.
The outcome of our study confirms previous researchCitation48,Citation61,Citation75 where YTE displays a more pronounced pH-dependent binding and exhibits a decelerated elution profile within a pH gradient during FcRn affinity chromatography. This method allows functional characterization of antibodies, where the packaging density of the FcRn column defines the degree of predominantly avidly bound antibodies, and their retention time indicating pharmacokinetic properties, but does not reveal kinetic rates.
In conclusion, our research demonstrates the importance of understanding the pH-dependent FcRn-IgG recycling mechanism and its implications for antibody engineering. We highlighted the advanced capabilities of switchSENSE technology for a detailed analysis of FcRn-IgG interactions, offering quantitative insights into both affinity and avidity. The technology has proven to be particularly adept at differentiating these interactions across a spectrum of FcRn densities and pH levels, where SPR encounters limitations. Our approach aligns with complementary methods, including the HERA assay, reinforcing the robustness of our findings. SwitchSENSE is a technology that bridges SPR, which provides affinities, and FcRn chromatography to cellular assays like HERA, deciphering complex kinetic interactions.
In future work, we intend to use our assay configuration and binding model to elucidate the molecular interactions of various antibody mutants and formats. Our objective is to employ switchSENSE technology to dissect the kinetic interactions, particularly in terms of avidity, for novel antibody entities with intricate designs, such as heterodimeric Fc modifications. This will inform strategies for optimizing FcRn-mediated recycling of these antibodies. The translational potential of our work lays the groundwork for future in vivo investigations. Such studies are crucial for bridging the gap between our in vitro findings and potential clinical applications.
Materials and methods
FcRn protein
The recombinant human FcRn protein was generated and purified in-house (Roche) by transient transfection of HEK Expi293F cells (Thermo Fisher Scientific). One plasmid was used for the transfection reaction, which encoded for the extracellular domain of human FcRn and human beta-2-microglobluin (hβ2 M) as single-chain protein. The sequence of hβ2 M is encoded N terminally fused to the hFcRn extracellular domain by a 4G4S linker. The accession number and aminoacid sequence are NP_001129491 (24–297) for hFcRn and NP_004039 (20–119) for human hβ2 M.
Antibodies
The recombinant human IgG1 antibodies were generated and purified in-house (Roche) by transient transfection of HEK Expi293F cells (Thermo Fisher Scientific). The formats were produced by the expression of plasmids encoding for the light and the heavy chain. Human IgG1 Fc WT and Fc YTE (M252Y, S254T, T256E) are tool antibodies that bind a target that is non-relevant in vivo.
switchSENSE biosensor experiments
Real-time binding kinetic experiments were performed with a switchSENSE DRX2 instrument (Dynamic Biosensors, Germany) on a switchSENSE chip (MPC-96-2-G1R1-S, Dynamic Biosensors, Germany) using the fluorescence proximity sensing (FPS) mode.Citation53 The measurements were performed at 25°C, applying a flowrate of 1000 µL/min and using a running buffer of 10 mM Na2HPO4/NaH2PO4, 140 mM NaCl supplemented with 50 µM EDTA, 50 µM EGTA and 0.05% (v/v) Tween 20 (PE140 Buffer pH 5.8 to 7.4, Dynamic Biosensors, Germany).
Binding kinetics – switchSENSE technology/switchSENSE biochip
On a switchSENSE chip, ligand molecules are tethered to gold microelectrodes via short DNA duplexes (96 bp, 32 nm), termed nanolevers. In this work, a low, constant negative voltage of −100 mV was applied to repel the nanolevers from the microelectrodes. This way, the nanolevers extend away from the surface, presenting the ligands to the flow of solution in the microfluidic channel, and facilitate optimal accessibility by solute analyte (the electric potential decays to sub-mV after several nm from the surface due to ionic screening and thus hardly affects the molecules at the nanolever top). The measurement mode is called fluorescence proximity sensing (FPS) or Static Mode at constant voltage where Vattrative = Vrepulsive = −0.1 V.
One strand of the DNA nanolever duplex is covalently connected to the surface via a gold-sulfur bond, while the other strand is exchangeable and binds to the fixed strand through DNA base pairing. For the detection of analyte and ligand molecules, a dye molecule on a flexible linker protrudes from the top end of the fixed strand. Acting as a probe on a leash, the dye rapidly diffuses atop the nanolevers and changes is fluorescence emission intensity when collisional or static quenching occurs with ligand or analyte molecules that are present in its proximity (FPS).
The single-photon counting unit of the DRXCitation2 analyzer measures the fluorescence emission from a 0.01 mm2 spot, containing app. 107 nanolevers (depending on the adjusted density) at a sampling rate of 1 Hz (frequency setting adjusted to 10 Hz for FcRn – IgG measurements). For the preparation of low ligand densities, the switchControl software (Dynamic Biosensors) was used by applying a negative voltage (Vrepulsive = −0.6 V) until an absolute fluorescence value of 30 kcps was reached. The method is previously described.Citation76
In a single-molecule picture, the association and dissociation of analyte and ligand molecules occur quasi-instantaneously: at any given point in time, an individual nanolever either has bound an analyte molecule, or not; accordingly, the fluorescence emission of an individual nanolever either is (quenched) or is
(unquenched). Considering the ensemble of all nanolevers on a detection spot, the measured fluorescence intensity is
, with
being the numbers of bound or unbound ligands at time
. Hence, the sensor response
is directly proportional to the number of bound molecules, i.e., the Fraction Bound. Typical fluorescence count rates are of the order of 1 million counts per second, but for straightforward comparison of different measurement series, fluorescence count rates are normalized with respect to baselines that were recorded before the injection of analyte molecules,
. Further, reference data from blank runs without analyte molecules are subtracted to compensate for potential signal drifts, e.g., caused by fluorescence bleaching. Hence, signals are depicted as relative fluorescence changes (
) and start at zero; for example, a signal change of −0.15 denotes a quenching by 15% in the presence of analyte molecules.
When multivalent analytes are measured, there is a subtle, yet noteworthy difference in the signal response of the FPS mode used here versus conventional refractive index biosensors like SPR or biolayer interferometry: the fluorescence signal changes for every bond that is formed on the surface, while an SPR signal change is caused by the mere presence of analyte at the sensor surface, no matter if the analyte is engaged via one or more binding sites. In FPS mode, a bivalent binder counts twice, i.e., its FPS signal is 2 times the signal generated when a single bond is formed. This needs to be taken into account when analyzing relative signal amplitudes (EquationEquation (3)(3)
(3) and (Equation4
(4)
(4) )). For instance, if the signal amplitudes of a biphasic dissociation fit describing affinity and avidity-binding modes are equal in magnitude, it means that two-thirds of the analytes are linked monovalently and 1/3 are linked bivalently.
switchSENSE surface functionalization
Human FcRn molecules were immobilized on the surface of a switchSENSE multi-purpose chip (MPC-96-2-G1R1-S, Dynamic Biosensors). FcRn was covalently conjugated in-vitro to the 5’ ends of the exchangeable strand of the DNA nanolever before the biosensing experiments, using an amine-reactive protein-DNA conjugation kit (CK-NH2-1-B96, Dynamic Biosensors). Conjugates were purified and a 1:1 conjugation stoichiometry was verified using a protein-DNA conjugate purifier (proFIRE®, Dynamic Biosensors). 200 µg of FcRn were used for the reaction, which produced enough FcRn-DNA conjugate to functionalize the sensor 100 times. FcRn-DNA conjugate was aliquoted in amounts required for 10 sensor regenerations each and stored at −80°C until use. This way, experiments on different days were all performed with the same batch of samples from one coupling reaction, and differing numbers of freeze-thaw cycles between experiments were avoided.
During the automated functionalization procedure, 200 nM conjugate solution was pumped across the chip surface for 6 min. Hybridization kinetics were monitored in real time until saturation was achieved to ensure complete functionalization of the sensor surface.Citation77 Modifying the chip surface by “zipping” protein-DNA conjugates onto it is convenient because the sensor can be regenerated quickly and repeatedly using the same standardized hybridization/denaturation protocols. To wash off used protein, the surface is exposed to basic NaOH solution (pH 13) for five seconds during the automated wash procedure performed by the DRX2 instrument. Double-stranded DNA denatures immediately into two separate single strands: the conjugate between FcRn and the exchangeable DNA strand is removed by the flow, while the fixed strand remains on the sensor unharmed and can be hybridized again with fresh conjugate for subsequent use.
switchSENSE kinetic data analysis
We observed biphasic dissociation kinetics and thus used a biexponential dissociation model to account for the two binding modes, assuming a 2:1 stoichiometry, unless otherwise stated. Processing the data (normalization, referencing, fitting) was done with switchAnalysis (Dynamic Biosensors, Germany) and Origin Pro 2015 (OriginLab Corp., Northhampton, USA)
Biphasic Dissociation
Monophasic Dissociation
and
are the dissociation rate constants of the fast affinity and slow avidity-binding modes, respectively, and
and
are their amplitudes following. The relative amplitudes (%) for a bivalent binder discriminating monovalent and bivalent binding are given by EquationEquation 3
(3)
(3) and Equation4
(4)
(4) for single (
) and double (
) bound state, respectively.
Association phases were observed to be monophasic and fitted with mono-exponential model
Association
Here, is the association rate constant and
is the injected analyte concentration. The fitting procedure was as follows: First, a bi-exponential least-squares fit was performed for all measured dissociation curves, optimizing for common
and
values that best fit all datasets simultaneously (global fit). The dissociation kinetics neither depend on the analyte concentration used during the association phase nor do they depend on the achieved saturation level (fraction bound). Second, mono-exponential fits were performed for all association curves measured at different analyte concentrations, using the known
and
value, and
values were determined that best fit the global dataset.
Sigmoidal 4PL Fit Model
The calculation of the transition point within the affinity dissociation rates (kOFF,AFFINITY) measured from pH 5.8 to 7.4 was performed applying a Four Parameter Logistic (4PL) Regression. Here, is the minimum value that can be obtained
, the maximum value that can be obtained,
the point of inflection, in our case the pH value and
is the Hill’s slope of the curve.
SPR experiments
SPR measurements were performed on a Biacore T200 instrument (GE Healthcare) at 25°C. The sensor chip used was a C1 chip. The running buffer was phosphate-buffered saline with polysorbate 20 (PBS-P) at different pH levels (5.8, 6.0, 6.4, 6.8, 7.4).
Neutravidin (20 µg/mL) was amine-coupled to flow cells 1–4 of the C1 chip using standard amine coupling protocol at pH 4.5 for 200 s at a flow rate of 10 µL/min. Subsequently, biotinylated single-chain human FcRn was captured on the NeutrAvidin-coated surface in HBS-N buffer at pH 7.4. The captured levels of FcRn were 10–12 RU on flow cell 2, 140 RU on flow cell 3, and 110 RU on flow cell 4.
Five different concentrations of antibodies were prepared in the running buffer. Each concentration was injected over the FcRn-coated surface at a flow rate of 50 µL/min. The association phase was monitored for 180 s, and the dissociation phase was monitored for a time period independent of pH.
After each cycle, the surface was regenerated by injecting PBS at pH 8.0 for 45 s at a flow rate of 20 µL/min, twice. This ensured the complete removal of bound antibodies from the previous cycle and the restoration of the original-binding capacity of the FcRn-coated surface.
The binding kinetics were analyzed using the Biacore T200 evaluation software. The data were fitted to a 1:1 binding model to determine the association and dissociation rate constants (kON and kOFF) and the equilibrium dissociation constant (KD). More complex models were also applied (Bivalent Analyte and Heterogeneous Ligand Model)
Analytical hFcRn affinity chromatography
Affinity chromatography was conducted to assess the interaction between human FcRn and antibody variants. The chromatographic analysis was performed on an ÄKTA Avant 25 chromatography system (GE Healthcare). The procedure was based on established protocols as detailed in previous studies.Citation48,Citation72
Antibody variants were prepared at a concentration of 1 mg/mL. A volume of 50 μL of each antibody variant was loaded onto the chromatography column. The elution of bound antibodies was achieved by establishing a linear pH gradient. This gradient ranged from pH 6.0 to pH 8.8 over a period of 110 min. The low pH buffer consisted of 20 mM MES sodium salt and 140 mM NaCl, adjusted to pH 5.5. Conversely, the high pH buffer was composed of 20 mM Tris/HCl and 140 mM NaCl, with the pH adjusted to 8.8. The buffers facilitated the dissociation of antibody variants from the hFcRn ligand, allowing for the analysis of their relative affinities based on their elution profiles.
Data acquisition and analysis were performed using the system’s software and GraphPad Prism (Version 8.4.2), and the resulting chromatograms were used to evaluate the binding characteristics of the antibody variants to hFcRn.
Abbreviations
| 4PL Fit | = | Four Parameter Logistic Fit |
| Fc | = | Fragment crystallizable |
| HERA | = | human endothelial cell-based recycling assay |
| hIgG1 | = | human Immunoglobulin G isotype 1 |
| hsc-FcRn | = | human single-chain neonatal Fc receptor |
| hβ2 M | = | human beta 2 microglobulin |
| KD | = | equilibrium dissociation constant |
| kOFF | = | dissociation rate constant |
| kOFFapp. | = | apparent dissociation rate constant |
| kON | = | association rate constant |
| kONapp. | = | apparent association rate constant |
| kONobs | = | observable association rate constant |
| mAb | = | monoclonal antibody |
| MTL | = | mass transport limitation |
| PK | = | Pharmacokinetics |
| pKa value | = | negative log base ten of the acid dissociation constant (Ka) |
| scFv | = | single-chain variable fragment |
| sec | = | seconds |
| SPR | = | surface plasmon resonance |
| tauOFF | = | time constant of dissociation |
| WT | = | wildtype |
240508_FcRn_MAbs_Format_SI.docx
Download MS Word (1.8 MB)Acknowledgments
We would like to express our sincere gratitude to Christian Klein and Laurent Larivière for scientific support and proofreading activities. We are grateful to Algirdas Grevys for providing HERA data. We acknowledge Vincent Wieser for his support in the characterization of antibodies using the analytical FcRn affinity column.
Disclosure statement
Authors JR and TS are employed by company Roche. UR is employed by Dynamic Biosensors GmbH.
Supplementary material
Supplemental data for this article can be accessed online at https://doi.org/10.1080/19420862.2024.2361585
Additional information
Funding
References
- Nelson AL, Dhimolea E, Reichert JM. Development trends for human monoclonal antibody therapeutics. Nat Rev Drug Discov. 2010;9(10):767–17. doi:10.1038/nrd3229. PMID: 20811384.
- Kaplon H, Chenoweth A, Crescioli S, Reichert JM. Antibodies to watch in 2022. Mabs-austin. 2022;14(1):2014296. doi:10.1080/19420862.2021.2014296. PMID: 35030985.
- Dostalek M, Prueksaritanont T, Kelley RF. Pharmacokinetic de-risking tools for selection of monoclonal antibody lead candidates. Mabs-austin. 2017;9(5):756–66. doi:10.1080/19420862.2017.1323160. PMID: 28463063.
- Muller T, Tasser C, Tesar M, Fucek I, Schniegler-Mattox U, Koch J, Ellwanger K. Selection of bispecific antibodies with optimal developability using FcRn‑Ph‑HPLC as an optimized FcRn affinity chromatography method. Mabs-austin. 2023;15(1):2245519. doi:10.1080/19420862.2023.2245519. PMID: 37599441.
- Fernandez-Quintero ML, Ljungars A, Waibl F, Greiff V, Andersen JT, Gjolberg TT, Jenkins TP, Voldborg BG, Grav LM, Kumar S. et al. Assessing developability early in the discovery process for novel biologics. Mabs-austin. 2023;15(1):2171248. doi:10.1080/19420862.2023.2171248. PMID: 36823021.
- Baldwin WM 3rd, Valujskikh A, Fairchild RL. The neonatal Fc receptor: key to homeostasic control of IgG and IgG-related biopharmaceuticals. Am J Transplant. 2019;19(7):1881–87. doi:10.1111/ajt.15366. PMID: 30903736.
- Ward ES, Ober RJ. Targeting FcRn to generate antibody-based therapeutics. Trends Pharmacol Sci. 2018;39(10):892–904. doi:10.1016/j.tips.2018.07.007. PMID: 30143244.
- Pyzik M, Sand KMK, Hubbard JJ, Andersen JT, Sandlie I, Blumberg RS. The neonatal Fc Receptor (FcRn): a misnomer? Front Immunol. 2019;10:1540. doi:10.3389/fimmu.2019.01540. PMID: 31354709.
- D’Hooghe L, Chalmers AD, Heywood S, Whitley P, Johannes L. Cell surface dynamics and cellular distribution of endogenous FcRn. PLOS ONE. 2017;12(8):e0182695. doi:10.1371/journal.pone.0182695. PMID: 28817705.
- Pyzik M, Kozicky LK, Gandhi AK, Blumberg RS. The therapeutic age of the neonatal Fc receptor. Nat Rev Immunol. 2023;23(7):415–32. doi:10.1038/s41577-022-00821-1. PMID: 36726033.
- Oostindie SC, Lazar GA, Schuurman J, Parren P. Avidity in antibody effector functions and biotherapeutic drug design. Nat Rev Drug Discov. 2022;21(10):715–35. doi:10.1038/s41573-022-00501-8. PMID: 35790857.
- Karush F. Multivalent binding and functional affinity. Contemp Top Mol Immunol. 1976;5:217–28. doi:10.1007/978-1-4684-8142-6_8. PMID: 63353.
- Fan YY, Farrokhi V, Caiazzo T, Wang M, O’Hara DM, Neubert H. Human FcRn tissue expression profile and half-life in PBMCs. Biomolecules. 2019;9(8):373. doi:10.3390/biom9080373. PMID: 31443181.
- Roopenian DC, Akilesh S. FcRn: the neonatal Fc receptor comes of age. Nat Rev Immunol. 2007;7(9):715–25. doi:10.1038/nri2155. PMID: 17703228.
- Latvala S, Jacobsen B, Otteneder MB, Herrmann A, Kronenberg S. Distribution of FcRn across species and tissues. J Histochem Cytochem. 2017;65(6):321–33. doi:10.1369/0022155417705095. PMID: 28402755.
- Rudnik-Jansen I, Howard KA. FcRn expression in cancer: mechanistic basis and therapeutic opportunities. J Controlled Release. 2021;337:248–57. doi:10.1016/j.jconrel.2021.07.007.
- Swiercz R, Mo M, Khare P, Schneider Z, Ober RJ, Ward ES. Loss of expression of the recycling receptor, FcRn, promotes tumor cell growth by increasing albumin consumption. Oncotarget. 2017;8(2):3528–41. doi:10.18632/oncotarget.13869. PMID: 27974681.
- Pyzik M, Rath T, Lencer WI, Baker K, Blumberg RS. FcRn: the architect behind the immune and nonimmune functions of IgG and albumin. J Immunol. 2015;194(10):4595–603. doi:10.4049/jimmunol.1403014. PMID: 25934922.
- Ward ES, Devanaboyina SC, Ober RJ. Targeting FcRn for the modulation of antibody dynamics. Mol Immunol. 2015;67(2):131–41. doi:10.1016/j.molimm.2015.02.007. PMID: 25766596.
- Ward ES, Velmurugan R, Ober RJ. Targeting FcRn for therapy: from live cell imaging to in vivo studies in mice. Immunol Lett. 2014;160(2):158–62. doi:10.1016/j.imlet.2014.02.008. PMID: 24572175.
- Dickinson BL, Badizadegan K, Wu Z, Ahouse JC, Zhu X, Simister NE, Blumberg RS, Lencer WI. Bidirectional FcRn-dependent IgG transport in a polarized human intestinal epithelial cell line. J Clin Invest. 1999;104(7):903–11. doi:10.1172/JCI6968. PMID: 10510331.
- Spiekermann GM, Finn PW, Ward ES, Dumont J, Dickinson BL, Blumberg RS, Lencer WI. Receptor-mediated immunoglobulin G transport across mucosal barriers in adult life: functional expression of FcRn in the mammalian lung. J Exp Med. 2002;196(3):303–10. doi:10.1084/jem.20020400. PMID: 12163559.
- Foss S, Grevys A, Sand KMK, Bern M, Blundell P, Michaelsen TE, Pleass RJ, Sandlie I, Andersen JT. Enhanced FcRn-dependent transepithelial delivery of IgG by Fc-engineering and polymerization. J Control Release. 2016;223:42–52. doi:10.1016/j.jconrel.2015.12.033. PMID: 26718855.
- Hubbard JJ, Pyzik M, Rath T, Kozicky LK, Sand KMK, Gandhi AK, Grevys A, Foss S, Menzies SC, Glickman JN. et al. FcRn is a CD32a coreceptor that determines susceptibility to IgG immune complex–driven autoimmunity. J Exp Med. 2020;217(10). doi:10.1084/jem.20200359. PMID: 32658257.
- Baker K, Qiao SW, Kuo TT, Aveson VG, Platzer B, Andersen JT, Sandlie I, Chen Z, de Haar C, Lencer WI. et al. Neonatal Fc receptor for IgG (FcRn) regulates cross-presentation of IgG immune complexes by CD8−CD11b+dendritic cells. Proc Natl Acad Sci USA. 2011;108(24):9927–32. doi:10.1073/pnas.1019037108. PMID: 21628593.
- Qiao SW, Kobayashi K, Johansen FE, Sollid LM, Andersen JT, Milford E, Roopenian DC, Lencer WI, Blumberg RS. Dependence of antibody-mediated presentation of antigen on FcRn. Proc Natl Acad Sci USA. 2008;105(27):9337–42. doi:10.1073/pnas.0801717105. PMID: 18599440.
- Brambell FWR. The PASSIVE IMMUNITY of the YOUNG MAMMAL. Biol Rev. 1958;33(4):488–531. doi:10.1111/j.1469-185X.1958.tb01412.x.
- Burmeister Ahh WP, Bjorkman PJ. Crystal structure of the complex of rat neonatal Fc receptor with Fc. Nature. 1994; 372. doi:10.1038/372379a0.
- Burmeister Lng WP, Simister NE, Blum ML, Bjorkman PJ. Crystal structure at 2.2 Å resolution of the MHC-related neonatal Fc receptor. Nature. 1994; doi:10.1038/372336a0.
- Simister NE, Mostov KE. An Fc receptor structurally related to MHC class I antigens. Nature. 1989;337(6203):184–87. doi:10.1038/337184a0.
- Malini Raghavan VRB, Morrison SL, Bjorkman PJ. Analysis of the pH dependence of the neonatal Fc receptor/immunoglobulin G interaction using antibody and receptor variants. Biochemistry. 1995;34(45):14649–57. doi:10.1021/bi00045a005.
- Oganesyan V, Damschroder MM, Cook KE, Li Q, Gao C, Wu H, Dall’acqua WF. Structural insights into neonatal Fc receptor-based recycling mechanisms. J Biol Chem. 2014;289(11):7812–24. doi:10.1074/jbc.M113.537563. PMID: 24469444.
- Dall’acqua WF, Kiener PA, Wu H. Properties of human IgG1s engineered for enhanced binding to the neonatal Fc receptor (FcRn). J Biol Chem. 2006;281(33):23514–24. doi:10.1074/jbc.M604292200. PMID: 16793771.
- Zalevsky J, Chamberlain AK, Horton HM, Karki S, Leung IW, Sproule TJ, Lazar GA, Roopenian DC, Desjarlais JR. Enhanced antibody half-life improves in vivo activity. Nat Biotechnol. 2010;28(2):157–59. doi:10.1038/nbt.1601. PMID: 20081867.
- Robbie GJ, Criste R, Dall’acqua WF, Jensen K, Patel NK, Losonsky GA, Griffin MP. A novel investigational Fc-modified humanized monoclonal antibody, motavizumab-YTE, has an extended half-life in healthy adults. Antimicrob Agents Chemother. 2013;57(12):6147–53. doi:10.1128/AAC.01285-13. PMID: 24080653.
- Booth BJ, Ramakrishnan B, Narayan K, Wollacott AM, Babcock GJ, Shriver Z, Viswanathan K. Extending human IgG half-life using structure-guided design. Mabs-austin. 2018;10:1098–110. doi:10.1080/19420862.2018.1490119. PMID: 29947573.
- Liu R, Oldham RJ, Teal E, Beers SA, Cragg MS. Fc-engineering for modulated effector functions—improving antibodies for cancer treatment. Antibodies. 2020;9(4):64. doi:10.3390/antib9040064. PMID: 33212886.
- Dall’acqua WF, Woods RM, Ward ES, Palaszynski SR, Patel NK, Brewah YA, Wu H, Kiener PA, Langermann S. Increasing the affinity of a human IgG1 for the neonatal Fc receptor: biological consequences. J Immunol. 2002;169(9):5171–80. doi:10.4049/jimmunol.169.9.5171. PMID: 12391234.
- Mackness BC, Jaworski JA, Boudanova E, Park A, Valente D, Mauriac C, Pasquier O, Schmidt T, Kabiri M, Kandira A. et al. Antibody Fc engineering for enhanced neonatal Fc receptor binding and prolonged circulation half-life. Mabs-austin. 2019;11(7):1276–88. doi:10.1080/19420862.2019.1633883. PMID: 31216930.
- Abdiche YN, Yeung YA, Chaparro-Riggers J, Barman I, Strop P, Chin SM, Pham A, Bolton G, McDonough D, Lindquist K. et al. The neonatal Fc receptor (FcRn) binds independently to both sites of the IgG homodimer with identical affinity. Mabs-austin. 2015;7(2):331–43. doi:10.1080/19420862.2015.1008353. PMID: 25658443.
- Gurbaxani BM, Morrison SL. Development of new models for the analysis of Fc–FcRn interactions. Mol Immunol. 2006;43(9):1379–89. doi:10.1016/j.molimm.2005.08.002. PMID: 16183124.
- Rudnick SI, Adams GP. Affinity and avidity in antibody-based tumor targeting. Cancer Biother Radio. 2009;24(2):155–61. doi:10.1089/cbr.2009.0627. PMID: 19409036.
- Diebolder CA, Beurskens FJ, de Jong RN, Koning RI, Strumane K, Lindorfer MA, Voorhorst M, Ugurlar D, Rosati S, Heck AJ. et al. Complement is activated by IgG hexamers assembled at the cell surface. Science. 2014;343(6176):1260–63. doi:10.1126/science.1248943. PMID: 24626930.
- Rouge L, Chiang N, Steffek M, Kugel C, Croll TI, Tam C, Estevez A, Arthur CP, Koth CM, Ciferri C. et al. Structure of CD20 in complex with the therapeutic monoclonal antibody rituximab. Science. 2020;367(6483):1224–30. doi:10.1126/science.aaz9356. PMID: 32079680.
- Jensen PF, Larraillet V, Schlothauer T, Kettenberger H, Hilger M, Rand KD. Investigating the interaction between the neonatal Fc receptor and monoclonal antibody variants by hydrogen/deuterium exchange mass spectrometry. Mol Cell Proteomics: MCP. 2015;14(1):148–61. doi:10.1074/mcp.M114.042044. PMID: 25378534.
- Wang W, Lu P, Fang Y, Hamuro L, Pittman T, Carr B, Hochman J, Prueksaritanont T. Monoclonal antibodies with identical Fc sequences can bind to FcRn differentially with pharmacokinetic consequences. Drug Metab Dispos. 2011;39(9):1469–77. doi:10.1124/dmd.111.039453. PMID: 21610128.
- Yeung YA, Leabman MK, Marvin JS, Qiu J, Adams CW, Lien S, Starovasnik MA, Lowman HB. Engineering human IgG1 affinity to human neonatal Fc receptor: impact of affinity improvement on pharmacokinetics in primates. J Immunol. 2009;182(12):7663–71. doi:10.4049/jimmunol.0804182. PMID: 19494290.
- Schlothauer T, Rueger P, Stracke JO, Hertenberger H, Fingas F, Kling L, Emrich T, Drabner G, Seeber S, Auer J. et al. Analytical FcRn affinity chromatography for functional characterization of monoclonal antibodies. Mabs-austin. 2013;5(4):576–86. doi:10.4161/mabs.24981. PMID: 23765230.
- Muller-Landau H, Varela PF. Standard operation procedure for switchSENSE DRX systems. Eur Biophys J. 2021;50(3–4):389–400. doi:10.1007/s00249-021-01519-3. PMID: 33772617.
- Langer A, Hampel PA, Kaiser W, Knezevic J, Welte T, Villa V, Maruyama M, Svejda M, Jahner S, Fischer F. et al. Protein analysis by time-resolved measurements with an electro-switchable DNA chip. Nat Commun. 2013;4(1):2099. doi:10.1038/ncomms3099. PMID: 23839273.
- Knezevic J, Langer A, Hampel PA, Kaiser W, Strasser R, Rant U. Quantitation of affinity, avidity, and binding kinetics of protein analytes with a dynamically switchable biosurface. J Am Chem Soc. 2012;134(37):15225–28. doi:10.1021/ja3061276. PMID: 22946661.
- Hampel PA, Strasser R, Fischer F, Rant U. Assembly and characterization of a slingshot DNA nanostructure for the analysis of bivalent and bispecific analytes with biosensors. Langmuir. 2018;34(49):14796–801. doi:10.1021/acs.langmuir.8b02124. PMID: 30269507.
- Daub H, Traxler L, Ismajli F, Groitl B, Itzen A, Rant U. The trimer to monomer transition of tumor necrosis factor-alpha is a dynamic process that is significantly altered by therapeutic antibodies. Sci Rep. 2020;10(1):9265. doi:10.1038/s41598-020-66123-5. PMID: 32518229.
- Mak S, Marszal A, Matscheko N, Rant U. Kinetic analysis of ternary and binary binding modes of the bispecific antibody emicizumab. Mabs-austin. 2023;15(1):2149053. doi:10.1080/19420862.2022.2149053. PMID: 36453702.
- Qi T, Cao Y. In translation: FcRn across the therapeutic spectrum. Int J Mol Sci. 2021;22(6):3048. doi:10.3390/ijms22063048. PMID: 33802650.
- Datta-Mannan A, Witcher DR, Tang Y, Watkins J, Jiang W, Wroblewski VJ. Humanized IgG1 variants with differential binding properties to the neonatal Fc receptor: relationship to pharmacokinetics in mice and primates. Drug Metab Dispos. 2007;35(1):86–94. doi:10.1124/dmd.106.011734. PMID: 17050651.
- Vaughn DE, Bjorkman PJ. High-affinity binding of the neonatal Fc receptor to its IgG ligand requires receptor immobilization †. Biochemistry. 1997;36(31):9374–80. doi:10.1021/bi970841r.
- Neuber T, Frese K, Jaehrling J, Jager S, Daubert D, Felderer K, Linnemann M, Hohne A, Kaden S, Kolln J. et al. Characterization and screening of IgG binding to the neonatal Fc receptor. Mabs-austin. 2014;6(4):928–42. doi:10.4161/mabs.28744. PMID: 24802048.
- Soltermann F, Foley EDB, Pagnoni V, Galpin M, Benesch JLP, Kukura P, Struwe WB. Quantifying protein–protein interactions by molecular counting with mass photometry. Angew Chem Int Ed Engl. 2020;59(27):10774–79. doi:10.1002/anie.202001578. PMID: 32167227.
- Feng Y, Gong R, Dimitrov DS. Design, expression and characterization of a soluble single-chain functional human neonatal Fc receptor. Protein Expr Purif. 2011;79(1):66–71. doi:10.1016/j.pep.2011.03.012. PMID: 21453773.
- Grevys A, Nilsen J, Sand KMK, Daba MB, Oynebraten I, Bern M, McAdam MB, Foss S, Schlothauer T, Michaelsen TE. et al. A human endothelial cell-based recycling assay for screening of FcRn targeted molecules. Nat Commun. 2018;9(1):621. doi:10.1038/s41467-018-03061-x. PMID: 29434196.
- Ober RJ, Martinez C, Vaccaro C, Zhou J, Ward ES. Visualizing the site and dynamics of IgG salvage by the MHC class I-related receptor, FcRn. J Immunol. 2004;172(4):2021–29. doi:10.4049/jimmunol.172.4.2021. PMID: 14764666.
- Katsamba PS, Navratilova I, Calderon-Cacia M, Fan L, Thornton K, Zhu M, Bos TV, Forte C, Friend D, Laird-Offringa I. et al. Kinetic analysis of a high-affinity antibody/antigen interaction performed by multiple Biacore users. Anal Biochem. 2006;352(2):208–21. doi:10.1016/j.ab.2006.01.034. PMID: 16564019.
- Tesar DB, Tiangco NE, Bjorkman PJ. Ligand valency affects transcytosis, recycling and intracellular trafficking mediated by the neonatal Fc receptor. Traffic. 2006;7(9):1127–42. doi:10.1111/j.1600-0854.2006.00457.x. PMID: 17004319.
- Walters BT, Jensen PF, Larraillet V, Lin K, Patapoff T, Schlothauer T, Rand KD, Zhang J. Conformational destabilization of immunoglobulin G increases the low pH binding affinity with the neonatal Fc receptor. J Biol Chem. 2016;291(4):1817–25. doi:10.1074/jbc.m115.691568.
- Santora LC, Kaymakcalan Z, Sakorafas P, Krull IS, Grant K. Characterization of noncovalent complexes of recombinant human monoclonal antibody and antigen using cation exchange, size exclusion chromatography, and BIAcore. Anal Biochem. 2001;299(2):119–29. doi:10.1006/abio.2001.5380. PMID: 11730333.
- Kaymakcalan Z, Sakorafas P, Bose S, Scesney S, Xiong L, Hanzatian DK, Salfeld J, Sasso EH. Comparisons of affinities, avidities, and complement activation of adalimumab, infliximab, and etanercept in binding to soluble and membrane tumor necrosis factor. Clin Immunol. 2009;131(2):308–16. doi:10.1016/j.clim.2009.01.002. PMID: 19188093.
- Vaughn DE, Bjorkman PJ. Structural basis of pH-dependent antibody binding by the neonatal Fc receptor. Struct Cell Press. 1998; doi:10.1016/s0969-2126(98)00008-2.
- Fersht A. Enzyme structure and mechanism. 2nd ed. (NY): W H Freeman; 1985. p. 475.
- Matthew JB, Gurd FR, Garcia-Moreno B, Flanagan MA, March KL, Shire SJ. pH-dependent processes in proteins. Crit Revi Biochem. 1985;18(2):91–197. doi:10.3109/10409238509085133. PMID: 3899508.
- Piche-Nicholas NM, Avery LB, King AC, Kavosi M, Wang M, O’Hara DM, Tchistiakova L, Katragadda M. Changes in complementarity-determining regions significantly alter IgG binding to the neonatal Fc receptor (FcRn) and pharmacokinetics. Mabs-austin. 2018;10(1):81–94. doi:10.1080/19420862.2017.1389355. PMID: 28991504.
- Schoch A, Kettenberger H, Mundigl O, Winter G, Engert J, Heinrich J, Emrich T. Charge-mediated influence of the antibody variable domain on FcRn-dependent pharmacokinetics. Proc Natl Acad Sci USA. 2015;112(19):5997–6002. doi:10.1073/pnas.1408766112. PMID: 25918417.
- Wang X, McKay P, Yee LT, Dutina G, Hass PE, Nijem I, Allison D, Cowan KJ, Lin K, Quarmby V. et al. Impact of SPR biosensor assay configuration on antibody: Neonatal Fc receptor binding data. Mabs-austin. 2017;9(2):319–32. doi:10.1080/19420862.2016.1261774. PMID: 28001487.
- Souders CA, Nelson SC, Wang Y, Crowley AR, Klempner MS, Thomas W Jr. A novel in vitro assay to predict neonatal Fc receptor-mediated human IgG half-life. Mabs-austin. 2015;7(5):912–21. doi:10.1080/19420862.2015.1054585. PMID: 26018774.
- Grevys A, Frick R, Mester S, Flem-Karlsen K, Nilsen J, Foss S, Sand KMK, Emrich T, Fischer JAA, Greiff V. et al. Antibody variable sequences have a pronounced effect on cellular transport and plasma half-life. iScience. 2022;25(2):103746. doi:10.1016/j.isci.2022.103746. PMID: 35118359.
- Arinaga K, Rant U, Knezevic J, Pringsheim E, Tornow M, Fujita S, Abstreiter G, Yokoyama N. Controlling the surface density of DNA on gold by electrically induced desorption. Biosens Bioelectron. 2007;23(3):326–31. doi:10.1016/j.bios.2007.04.012. PMID: 17560778.
- Rant U, Arinaga K, Scherer S, Pringsheim E, Fujita S, Yokoyama N, Tornow M, Abstreiter G. Switchable DNA interfaces for the highly sensitive detection of label-free DNA targets. Proc Natl Acad Sci USA. 2007;104(44):17364–69. doi:10.1073/pnas.0703974104.