
 ?Mathematical formulae have been encoded as MathML and are displayed in this HTML version using MathJax in order to improve their display. Uncheck the box to turn MathJax off. This feature requires Javascript. Click on a formula to zoom.
ABSTRACT
In silico assessment of antibody developability during early lead candidate selection and optimization is of paramount importance, offering a rapid and material-free screening approach. However, the predictive power and reproducibility of such methods depend heavily on the selection of molecular descriptors, model parameters, accuracy of predicted structure models, and conformational sampling techniques. Here, we present a set of molecular surface descriptors specifically designed for predicting antibody developability. We assess the performance of these descriptors by benchmarking their correlations with an extensive array of experimentally determined biophysical properties, including viscosity, aggregation, hydrophobic interaction chromatography, human pharmacokinetic clearance, heparin retention time, and polyspecificity. Further, we investigate the sensitivity of these surface descriptors to methodological nuances, such as the choice of interior dielectric constant, hydrophobicity scales, structure prediction methods, and the impact of conformational sampling. Notably, we observe systematic shifts in the distribution of surface descriptors depending on the structure prediction method used, driving weak correlations of surface descriptors across structure models. Averaging the descriptor values over conformational distributions from molecular dynamics mitigates the systematic shifts and improves the consistency across different structure prediction methods, albeit with inconsistent improvements in correlations with biophysical data. Based on our benchmarking analysis, we propose six in silico developability risk flags and assess their effectiveness in predicting potential developability issues for a set of case study molecules.
Introduction
The development of therapeutic antibodies has transformed the field of medicine, offering new and promising treatments for a diverse array of diseases, including cancer, autoimmune disorders, and infectious diseases.Citation1–4 To ensure the effectiveness and success of these therapeutic antibodies, several factors come into play, such as their functional properties, binding affinity, and overall developability.Citation5,Citation6 A crucial factor that influences these attributes is the surface properties of antibodies. The molecular surface acts as the interface for recognition and binding events, dictating the specificityCitation7–9 and affinity.Citation10–12 The surface of antibody variable (Fv) domains shows a wealth of structural and chemical features that affect conformational stability,Citation13,Citation14 colloidal stability,Citation6,Citation14–21 chemical stability,Citation14,Citation22,Citation23 and behavior in surface–protein interactions.Citation24,Citation25 All of these properties ultimately influence the cost, time of development, and the success of therapeutic antibodies in clinical trials. To mitigate the risk of advancing a candidate with poor developability to the chemistry, manufacturing, and controls (CMC) stage, it is crucial to screen, assess, and optimize developability-related properties from early stages of discovery and development.
The structure–property relationships influencing developability have been extensively studied through experimental and computational methods.Citation26–29 While some aspects of poor developability remain less understood, others are well established. For instance, it is widely known that an extremely negative charge within the variable domain can lead to high viscosity in concentrated solutions,Citation17–19,Citation30 An extreme positive charge on antibody surfaces is associated with fast clearance and polyspecificity risks.Citation8,Citation29,Citation31 Large hydrophobic patches increase the likelihood of protein aggregationCitation39, poor solubilityCitation76, purification yieldCitation104, and filtration efficiency. While not all of the developability issues are exclusively caused by these structural properties, it is widely recognized that the presence of extreme structural attributes significantly raises the risk of poor developability.
A better understanding of these structure–property relationships has led to the development of various in silico models offering insights based on sequence and structural properties. For example, Sharma et al.Citation29 proposed a sequence-based calculation of Fv net charge and charge symmetry parameter (FvCSP) to predict antibody viscosity and pharmacokinetic (PK) clearance. Agrawal et al.Citation32 introduced the spatial charge map (SCM), based on the clustering of atomic partial charges for the exposed residues, which revealed a correlation between larger negatively charged patches on the Fv and high viscosity of antibody solutions. Similarly, Raybould et al.Citation28 introduced Patches of Positive and Negative Charge (PPC and PNC) scores, used in the Therapeutic Antibody Profiler (TAP) tool, based on absolute residue-level charge values using pre-assigned protonation states and considering the proximity of charged residues. Molecular Operating Environment (MOE) software offers descriptors such as ensemble charge of the Fv (ens_charge_Fv) which is based on the distribution of atomic partial charges on the surface.Citation33 These models primarily differ in the level of approximations used to represent electrostatic interactions. While some rely on sequence-level information (e.g., FvCSP), others are structure-based but still determine protonation states based on sequence pKa values (e.g., PPC and PNC). Some models are entirely structure-based, assigning protonation states based on PROPKACitation34 or protonate3D,Citation35 and also incorporate an ensemble of conformations (e.g., SCM or ens_charge_Fv). However, these descriptors may overlook the influence of the interior and exterior dielectric environment that are shown to be important for an accurate representation of electrostatics.Citation36–38 Investigating the extent to which variability in these approximations affects the outcomes of developability risk assessment is of substantial interest.
Hydrophobicity-related structural properties have also been extensively studied in an attempt to further improve the predictivity of hydrophobic-driven developability risks of antibodies.Citation28,Citation29,Citation33,Citation39 LogP-based methods such as AggScoreCitation40 and MOE’s hydrophobicity patchesCitation33 have been widely used and have proven valuable in predicting hydrophobic interaction chromatography (HIC) and aggregation.Citation41,Citation42 LogP-based scores are particularly critical in profiling small-molecule drugs and are fundamental to Lipinski’s rule of five.Citation43 In addition, several residue-based hydrophobicity scores tailored specifically for antibodies have been proposed, including the Fv Hydrophobicity Index (HI),Citation29 Spatial Aggregation Propensity (SAP),Citation39 and TAP’s Protein Surface Hydrophobicity (PSH).Citation28 These methods not only differ in their underlying calculation methods but also in the selection of residue-level hydrophobicity scales. For instance, the HI, SAP, and PSH methods use the Eisenberg (EI),Citation44 Black & Mould (BM),Citation45 and Kyte-Doolittle (KD)Citation46 scales, respectively. Additional customized hydrophobicity scales have also been developed to predict developability-related assays such as HIC or reversed-phase high-performance liquid chromatography (RP-HPLC).Citation47 The variety of hydrophobicity prediction methods and scales reported highlights the lack of consensus on the definition of hydrophobicity and the optimal choice of residue-level scales for practical antibody developability prediction. For example, while Raybould et al.Citation28 suggested that their hydrophobicity score (PSH) is relatively unaffected by the choice of residue-level scale, Waibl et al.Citation48 demonstrated a significant impact of the hydrophobicity scale on the prediction of HIC retention times. Overall, the choice of hydrophobicity calculation method and the underlying scale can significantly affect the assessment of antibody developability characteristics.Citation48
Beyond the details of the descriptor definition and calculation methods, the accuracy of surface descriptors could strongly depend on the quality of the predicted antibody structure models used.Citation49 Recent advancements in structure prediction methods, such as AB2,Citation50 DeepAb,Citation51 Equifold,Citation52 and MOE,Citation33 have significantly improved the quality of antibody structure models. However, the extent to which the varying accuracy of these models in predicting ground truth X-ray crystal structures translates to actual improvements in the accuracy of structural and surface descriptors for antibody developability remains unclear. Moreover, the impact of generating conformational distributions, as opposed to relying on single-static structures, on the accuracy of descriptors is not well explored. The complementarity-determining region (CDR) loops of antibodies undergo continuous transitions between different conformational states, influencing their structural and developability properties.Citation53–55 However, while some studies suggest inconsistent improvement in hydrophobicity predictionCitation48 upon conformational sampling, others demonstrate its significant effect.Citation39,Citation56 It is of great interest to understand whether and to what extent conformational sampling enhances the robustness of developability assessment.
In this study, we examine correlations of key surface molecular descriptors with biophysical assays related to antibody developability, paying particular attention to methodological details. First, we introduce MolDesk, a tailored set of molecular surface descriptors for antibodies and describe the protocol used for their calculations. Next, we analyze the correlation of these descriptors with several key biophysical assays, comparing them to other descriptors from the literature. Subsequently, we investigate the sensitivity of these descriptors to model parameters, predicted structure models, and conformational sampling. Finally, we propose a set of developability risk flags based on the presented descriptors and assess their performance using a dataset of antibody case studies with variable developability behavior.
Results
Mapping biophysical features to the molecular surface
Electrostatic surface properties
The conceptual framework used to map some key structural properties of antibodies to their molecular surface is illustrated in . A detailed description of this framework can be found in the Methods section. In brief, we used the AB2 structure prediction methodCitation50 to build the structure model of the variable domain. Unless otherwise stated, we also generated a conformational distribution of the Fv through 5 ns Gaussian-accelerated Molecular Dynamics (GaMD) simulations.Citation57 For each single fragment antigen-binding domain (Fab) or Fv conformation, we generated a triangulated molecular surface mesh (). For electrostatic surface properties, we calculated the continuous electrostatic potential (EP) using APBSCitation58 and assigned the potential values from a discretized cubic grid to the mesh vertices. By summing the positive and negative EP values over the mesh surface associated with each residue, we obtained the surface EP per residue. The integration of surface positive, negative, and sum of EP values over all the residues within each antibody domain (Fab, Fv, or CDR) gives per domain electrostatic surface descriptors ().
Figure 1. (a) Triangulated solvent-excluded molecular surface of a Fab MOE structure model, generated using Nanoshaper.Citation49 (b) Grid-based electrostatic potential from APBS mapped onto the triangulated surface. The potential values are assigned to atoms, and the sum is assigned to corresponding residues. (c) Hydrophobicity values assigned to each vertex on the triangulated surface based on residue-level hydrophobicity scales. The values on each vertex are re-assigned by averaging hydrophobicity values from neighboring vertices within a cutoff distance of 10. The largest hydrophobic patch could be on the variable domain (WW and BM) or the elbow (KD and EI), depending on the hydrophobicity scale.
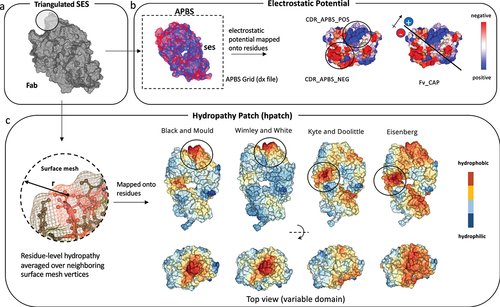
This electrostatic surface mapping enables a quantitative assessment of residue-level and domain-level electrostatic potentials over a conformational distribution generated through MD simulations. For each conformation extracted from MD, the protonation states of titratable groups are re-assigned at the input pH, and electrostatic potential is calculated and mapped to the surface. By incorporating dynamical information, we obtained a rigorous and comprehensive representation of the antibody’s electrostatic properties, accounting for the conformation-dependent shifts in protonation states.
Hydrophobicity surface properties
To calculate hydrophobicity surface properties, first we assigned distinct hydrophobicity scales (BM, KD, EI, and Wimley-White (WW)),Citation59 normalized between −5 and 5 (low to high hydrophobicity), to each residue and their associated vertices in the mesh. Then, we updated the surface grid values with the average of the values of nearby surface mesh vertices within a distance cutoff of 10 A. The local averaging is directly performed on the surface mesh grids, yielding a higher score for large and continuous surface patches compared to the scattered distribution of smaller patches. This approach resembles previous methods like average surface property (ASP),Citation60 PSH,Citation28 and the widely used SAP method,Citation39 which also utilize local averaging of surface hydrophobicities within a cutoff distance. Unlike the SAP method, the hydrophobicity of residues in the proposed method is not normalized by the respective side-chain size or solvent-accessible surface area (SASA).Citation39,Citation60
The hydrophobicity surface scores (referred to as HPATCH) were summed for all the positive values for each antibody domain (Fab, Fv, or CDR) and averaged over 5 ns GaMD simulations (). Given that the major differences across antibodies fall within the CDRs,Citation28 our main focus was evaluation of the surface representations specifically within the CDR region,
As described below, we then evaluated the correlation of these surface descriptors with experimental biophysical assays to better understand their direct relevance to developability assessment and explored the change in the accuracy of the descriptors upon changing the choice of model parameters, and protocol details.
Correlations with experimental biophysical data
Viscosity
Subcutaneous delivery of antibodies necessitates high-concentration solutions to achieve the desired dosage.Citation30 At these elevated concentrations, the self-association of antibodies can lead to unacceptably high viscosity levels, resulting in substantial challenges during manufacturing and administration processes. Previous studies have proposed that high viscosity arises from intermolecular interactions driven by long- and short-range electrostatic interactions,Citation61–64 as well as hydrophobic surface properties.Citation65–67 With this knowledge, we assessed the correlation of electrostatic and hydrophobic surface descriptors with two viscosity datasets: 1) a dataset of 38 antibodiesCitation68 (PDGF38) that are mutants of the same parent molecule, primarily focused on charged residues to mitigate viscosity;Citation68 and 2) a dataset of 37 antibodies,Citation67 which focused on mutation of aromatic CDR residues to study the effects on viscosity.
Apgar viscosity set
Previous in silico studies by Sharma et al.,Citation29 PfAbNet-viscosity,Citation69 and SCMCitation32 have indicated that negative charge and charge asymmetry on the Fv of antibodies correlates with viscosity. Therefore, we evaluated the performance of the negative electrostatic descriptor on the CDR, CDR_APBS_neg, and an in-house and structure-based implementation of charge asymmetry in the Fv, Fv_CAP, compared to two baseline methods evaluated on the PDGF38 dataset: SCMCitation32 and PfAbNet-viscosity.Citation69 SCM is a commonly used structure-based method quantifying negative charge patches on the surface of antibodies, while PfAbNet-viscosity is a 3D convolutional neural network trained to predict antibody viscosity using the electrostatic surface potential of the antibody Fv as the input to the network.Citation69 In line with the analysis in the PfAbNet-viscosity paper, we use the same Apgar viscosity dataset (PDGF38) using a cutoff threshold of 20 centipoise (cP) to classify the molecules as viscous or non-viscous.
illustrates that CDR_APBS_neg at pH 6.0 slightly outperformed the baseline methods SCM and PfAbNet-viscosity in terms of Pearson , while Fv_CAP showed slight superiority in PR-AUC and Spearman
. These data further validate the relevance of the charge asymmetry as a driver of viscosityCitation29. The SCM approach, which does not consider the dielectric environment, yields a slightly lower correlation in this case yet remains comparable to the other three methods.
Figure 2. (a) Performance of CDR_APBS_neg calculated at pH 6 in predicting the viscosity data from Apgar et al. (PDGF38)Citation62 (b-c) Classification (precision–recall curve), Spearman rho (ρ), and Pearson R2 correlations with viscosity data for the absolute value of CDR_APBS_neg, the additive inverse of Fv_CAP, and previous methods: SCMCitation32 (absolute value) and PfAbNet-viscosity.Citation62 (d-f) Performance of HPATCH, TAP’s CDR.PSH,Citation28 and SAPCitation39 in predicting the viscosity data from Dai et al.Citation63 using the same accuracy metrics as A-C.
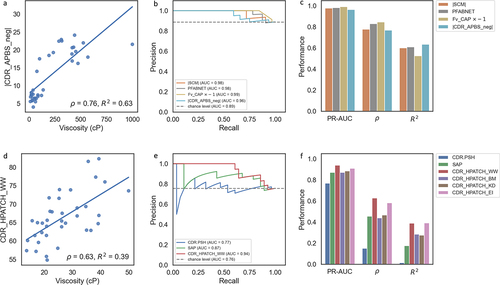
The comparable performance of CDR_APBS_neg, Fv_CAP, and SCM to the PfAbNet-viscosity neural network model highlights the accuracy and generalizability of these expert-crafted electrostatic descriptors. In particular, the intriguing similarity in performance between the CDR_APBS_neg and PfAbNet-viscosity, both relying on APBS electrostatic potential as inputs to each model, suggests that the learning process in PfAbNet-viscosity may not substantially augment what CDR_APBS_neg captures without training.
Dai viscosity set
The viscosity dataset published by Dai et al.Citation67 focuses on hydrophobic and solvent-exposed aromatic residues to mitigate the high viscosity of an anti-glucagon receptor IgG1 antibody. Therefore, we assessed the correlation of HPATCH descriptors with this dataset, alongside two other hydrophobicity scores, SAPCitation39 and CDR.PSH.Citation28 Note that CDR.PSH is based on the ABodyBuilder homology model, without conformational sampling, which is the default for Therapeutic Antibody Profiler (TAP).Citation28 On the other hand, SAP is derived from the BM scale and averaged over the same MD trajectories used for HPATCH descriptor calculations.
indicates that CDR_HPATCH_WW outperformed all other hydrophobicity scores in predicting viscosity, followed by CDR_HPATCH_EI. The superior correlation of the WW scale aligns with the significant role of aromatic groups (Trp, Phe, and Tyr) in influencing viscosity.Citation65 TAP’s CDR.PSH performed the worst, possibly due to either the generally lower correlations of the KD hydrophobicity scale with viscosity or the absence of conformational sampling. Interestingly, we also observed a higher correlation of CDR_HPATCH_BM compared to SAP, which also uses the BM scale. This improved performance of HPATCH may stem from its lack of normalization for bulky aromatic residues (Tyr, Phe, and Trp) based on their fully extended SASA, unlike the SAP model. Therefore, the contributions from large aromatic residues are more pronounced in HPATCH compared to SAP. These results align with Dai et al.’s findingCitation67 that combining residue-level SAP with solvent accessibility (i.e., de-emphasizing the SASA normalization) is more effective than relying only on SAP scores to identify residues contributing to high viscosity.
PK clearance
PK properties of antibody drugs affect efficacy, dose, and dose intervals.Citation31,Citation70 In particular, fast PK clearance, or short drug half-life, can lead to issues with patient compliance and clinical benefit. Several studies have indicated that non-Fc related differences in PK clearance can be the result of off-target binding,Citation31,Citation70,Citation71 or polyspecificity, which has been linked to high hydrophobicity and extreme charge distributions on the variable domain.Citation8,Citation29,Citation31 Sharma et al.Citation29 used two sequence-based descriptors (the net charge of the Fv at pH 5.5 and the sum of the hydrophobic index along several CDRs), to determine nonspecific binding and predict fast clearance. More recently, Grinshpun et al.Citation72 curated a comprehensive clinical PK dataset with calculated estimates of linear clearance for 64 antibodies and demonstrated that using structure-based descriptors, such as structure-based pI (pI_3D) and patch_cdr_hyd from MOE, can improve the discrimination of fast clearing antibodies.
In our study, we assessed the performance of two descriptors, namely the sum of positive electrostatic potential on the surface of the CDR region (CDR_APBS_pos at pH 7.4) and CDR_HPATCH_WW, in discerning fast-clearing antibodies within the same set of 64 clinical-stage antibodies mentioned above (). These descriptors replace charge-based pI_3DCitation72 and fvcharge5.5,Citation29 as well as hydrophobicity-based patch_cdr_hydCitation72 and HI_sumCitation29 descriptors used by Grinshpun et al.Citation72 and Sharma et al.,Citation29 respectively.
Figure 3. (a) Table comparing performance of CDR_APBS_pos at pH 7.4 (current work), Fv Charge at pH 5.5,Citation29 and pI_3DCitation71 in predicting PK clearance rate. Fast/slow clearance cutoff threshold and descriptor boundaries for Fv Charge at pH 5.5 and pI_3D are defined by Grinshpun et al.Citation71 (b) Scatter plot showing the performance of CDR_APBS_pos at pH 7.4 and CDR_HPATCH_WW in discerning fast-clearing antibodies. Point size represents relative clearance rate (mL/d/kg); color represents clearance classification (red: ≥ 5.4 mL/d/kg; green: < 5.4 mL/d/kg). (c) Histogram of CDR_APBS_pos for clearance set with bars proportionally colored according to clearance classification. Boundary defined in a shown as dotted lines. (d) Boxplot showing clearance rate distributions for molecules in- and out-of-range of CDR_APBS_pos thresholds. Performance of CDR_APBS_pos at pH 7.4 in predicting Heparin RTCitation72 (e-g), and PSR dataCitation26 (h-j) relative to TAP’sCitation28 CDR.PPC and MOE’sCitation33 ens_charge_FV using the same metrics and plots as . PSR and Heparin RT binary classes are defined using respective cutoffs of 0.27 and 0.84 minutes as used in the original papers.Citation26,Citation72
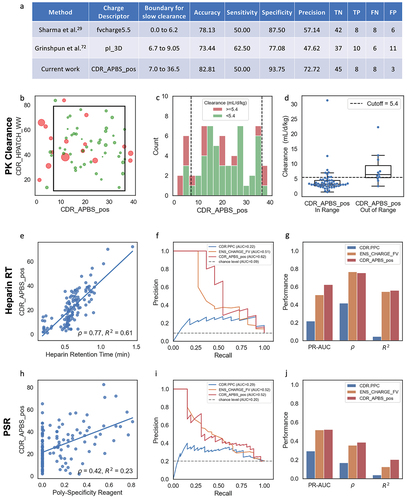
Following a similar approach to Grinshpun et al.,Citation72 we superimposed a scatter plot of the PK dataset onto a 2D space of these two descriptors, with data points colored red if determined to exhibit fast clearance (5.4 mL/d/kg) and green otherwise (). We then visually identified the best-fit box to classify molecules as in-range or out-of-range, selecting a range of 7 to 36.5 for CDR_APBS_pos and 0 to 80 for CDR_HPATCH_WW. Note that the boundaries for slow clearance were determined in the same way and on the very same dataset studied by Grinshpun et al.,Citation72 intended to maximize accuracy.
In line with the findings of Grinshpun et al.Citation72 and unlike what was reported by Sharma et al.,Citation29 we observed that hydrophobicity does not make a significant contribution to differentiating antibodies with fast and slow clearance, at least in this dataset (). The fast clearing molecules were found to be clustered primarily in the lower and higher end ranges of CDR_APBS_pos (). Therefore, we focused our benchmarking solely on comparing the predictive power of charge-based descriptors: CDR_APBS_pos at pH 7.4, fvcharge5.5, and pI_3D (). For fvcharge5.5 and pI_3D, we used the thresholds identified by Grinshpun et al.Citation72 on the same reference dataset.
shows that CDR_APBS_pos improved the discrimination of antibodies with fast clearance using the listed thresholds. It correctly excluded 8 of 16 antibodies with fast clearance and accurately predicted 45 of 48 antibodies with slow clearance. CDR_APBS_pos predicted binary clearance with 82.81% accuracy, an increase relative to the other two baseline descriptors.
The second-best descriptor in ranking, fvcharge5.5, is calculated at pH 5.5 not necessarily to match in vivo pH conditions, but through parameter fitting.Citation29 Given that CDR_APBS_pos is averaged over a distribution of conformations with reassigned protonation states per conformation, its superior accuracy at a matching physiological pH 7.4 in this case points to the reasonable sensitivity of the method in capturing the pH-dependent properties.
Polyspecificity and heparin binding
Next, we evaluated the performance of CDR_APBS_pos in predicting two early-stage developability assays that have been associated with poor PK properties of antibodies: Heparin Retention Time (RT) and Poly-Specificity Reagent (PSR). Both of these assays have been shown to correlate with the positively charged patches on the Fv.Citation26,Citation73 Here, we used CDR_APBS_pos at pH 7.4 and benchmarked it against two other charge-based descriptors curated by Jain et al.Citation26,Citation73: MOE’s ens_charge_FvCitation74 and the CDR Positive Patch Charge (CDR.PPC) from TAP.Citation28
In predicting Heparin RT (), CDR_APBS_pos yielded higher PR-AUC and Pearson scores than ens_charge_Fv, while ens_charge_Fv outperformed CDR_APBS_pos Spearman
by a small margin. Both of these descriptors significantly outperformed TAP’s CDR.PPC. CDR_APBS_pos performed better in predicting PSR over ens_charge_Fv and CDR.PPC (), despite the generally poorer correlation of all of these descriptors with the PSR assay. The comparable performance of CDR_APBS_pos and ens_charge_Fv is interesting given their distinct approaches to assigning protonation states (PropKaCitation34 vs. Protonate3D).Citation35 Additionally, while CDR_APBS_pos relies on electrostatic potential, ens_charge_Fv uses the distribution of atomic partial charges without considering the dielectric environment. Both methods calculate descriptors over a conformational distribution. In contrast, CDR.PPC is computed for a single-snapshot structure model (default of TAP), using a sequence-based protonation assignment, which is computationally faster but notably less accurate, as observed here.
Aggregation
Aggregation is a substantial obstacle to the advancement and development of therapeutic monoclonal antibodies (mAbs) due to the immunogenicity risk to patientsCitation75 and potential slowdown in purification, analytics, and formulation of the drug product. The aggregation propensity of mAbs is often associated with the hydrophobicity of their CDRs (SAP,Citation39 PSH,Citation28 CamSol,Citation76 Aggscore).Citation40 In order to assess the predictive power of the hydrophobic surface properties presented here, we conducted a correlation analysis of HPATCH descriptors with size exclusion chromatography (SEC) data for a set of 15 Genentech antibodies. We use the percentage of monomer loss as a surrogate measure for aggregation (detailed in the Methods section and ). Among these antibodies, seven exhibited notably high percentages of monomer loss, while the remaining eight demonstrated stable behavior. Due to the lack of a well-established cutoff threshold for % monomer loss, we defined our threshold as the median of this dataset (1.94%).
Figure 4. (a-c) Correlation of CDR_HPATCH_BM with SEC data for a panel of 15 Genentech IgG1 antibodies. (d-f) Correlation of CDR_HPATCH_BM with HIC retention time (RT) data from Jain et al.,Citation27 for a panel of 137 antibodies. (b and e) Precision–Recall curves demonstrating the performance of CDR_HPATCH_BM (current work), TAP’s CDR.PSH,Citation28 MOE’s CDR_HYD,Citation33 and SAPCitation39 in predicting binary classes, using thresholds of 1.94% Monomer Loss for SEC and 11.7 minutes for HIC RT. (c and f) Barplots showing the precision-recall area under the curve (PR-AUC), Spearman’s rho (ρ), and Pearson’s R2 correlations with SEC and HIC data for the listed descriptors.
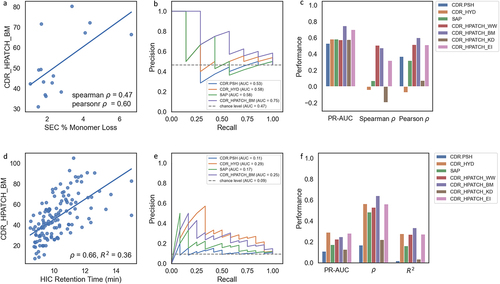
The performance of HPATCH descriptors on the CDR for all four hydrophobicity scales (WW, BM, EI, KD) relative to TAP’s CDR.PSH,Citation28 MOE’s CDR_HYD,Citation33 and SAPCitation39 is shown in . Notably, CDR_HPATCH_BM descriptors outperformed the other descriptors in PR-AUC, Spearman , and Pearson
(), followed by the WW and EI scales. The stronger correlation observed with the BM scale for the aggregation dataset validates the choice of the same scale used by the SAP method by default.Citation39 We observed an improvement in CDR_HPATCH_BM over SAP, despite using the exact same structure models, system preparations, and MD trajectories for the hydrophobicity calculations in both methods. This improvement could likely be attributed to how the larger residues are normalized based on their size in the SAP, unlike in HPATCH.
Both the LogP-based hydrophobicity score (CDR_HYD) and CDR_PSH (based on the KD scale) exhibited poor correlation with this dataset. It should be noted that the SEC dataset studied here is relatively small, consisting of only 15 data points. Stronger conclusions about correlations with this dataset would require more extensive data. However, despite the limited dataset and without any parameter fitting, the better performance of CDR_HPATCH_BM descriptors, followed by SAP, suggests the relevance of the BM hydrophobic scale in predicting aggregation propensity. Additionally, it is evident that relying on a single descriptor alone may not be sufficient to achieve a strong correlation with the SEC dataset.
HIC retention time
HIC is an analytical method used to separate molecular variants of proteins according to surface hydrophobicity, which can be used to bolster the developability profile of therapeutic candidates.Citation77,Citation78 Using the HIC data generated for 137 mAbs by Jain et al.,Citation47 we compared the predictive performance of HPATCH descriptors against the same reference descriptors studied in the aggregation study (TAP’s CDR.PSH, MOE’s CDR_HYD, and SAP). As shown in , the CDR_HPATCH_BM descriptor correlated better in terms of Spearman and Pearson
with HIC RT. CDR_HYD marginally outperformed other descriptors in predicting binary HIC RT classes, based on PR-AUC using a cutoff threshold of 11.7 min, as presented by Jain et al.Citation47 (). CDR_PSH remains the lowest performing descriptor in this dataset as well.
Sensitivity to model parameters, structure models, and conformational sampling
Hydrophobicity scale
Correlations between HPATCH scores across different hydrophobicity scales for 674 clinical-stage therapeutics (CST) and 2000 human antibodies randomly selected from the Observed Antibody Space (OAS)Citation79 are shown in . Notably, these scales exhibit imperfect correlations within both datasets, with the EI and BM scales showing the highest correlations, followed by BM and WW. The widely used KD scale shows weak correlations with all other scales. This inconsistency contradicts previous findings of strong correlations between these scales based on the PSH descriptor.Citation28
Figure 5. Matrix of scatter plots and distributions of the HPATCH hydrophobicity scores using four different scales (BM: Black & Mould, WW: Wimley-White, KD: Kyte-Doolittle, and EI: Eisenberg), for 674 clinical stage therapeutics (CST) from TheraSAbDabCitation80 and ∼2000 human antibodies randomly selected from the observed antibody space (OAS).Citation81 the descriptor values are calculated using single-static AB2 structure model. KDE distributions are normalized by dataset size.
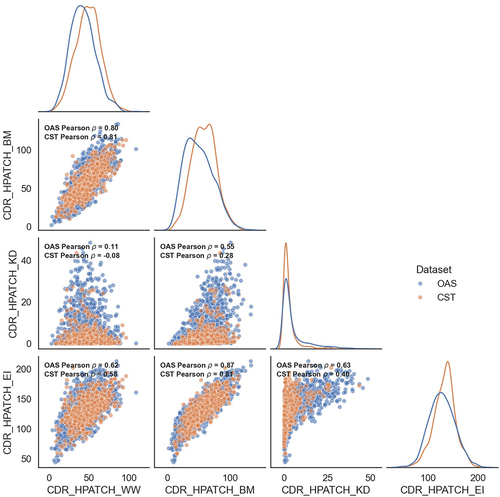
The choice of the hydrophobicity scale also influences the localization of the largest hydrophobic patch on a Fab structure. For example, shows that, based on BM and WW scales, the largest hydrophobic patch in an example Fab structure is in the variable domain, whereas using KD and EI scales, it is located at the elbow. The variable domain is often enriched by aromatic groups to enhance affinity,Citation11,Citation12,Citation80 therefore BM and WW scales that assign higher scores to aromatic groups tend to localize the largest patch on the Fv, unlike the KD and EI scales.
also shows that CST are systematically shifted toward higher or lower hydrophobicity regions compared to human antibodies (a subset of OAS), depending on the choice of the hydrophobicity scale used. BM and WW scales shift the CST set toward relatively higher hydrophobicities compared to OAS, whereas the KD and EI do the opposite. Using the KD scale, Raybould et al.Citation28 also concluded that clinical antibodies are systematically less hydrophobic than human antibodies, implying their improved-by-design developability, which is not aligned with the scale-dependent shifts observed here. As mentioned, given that a broader engineering strategy often enriches binding sites with aromatic residues to enhance affinity,Citation11,Citation12,Citation80 an overall increase in hydrophobicity of therapeutic antibodies relative to human antibodies is not unexpected.
Interior dielectric
The dielectric constant for bulk water in equilibrated systems is typically agreed to be 78.4.Citation81 However, the optimal dielectric constant for the interior regions of proteins is a debated topic, with suggested values ranging from as low as = 1 or 2 to as high as
= 40.Citation81,Citation82 To determine the optimal interior dielectric for representing electrostatics of antibody variable domains, we examined the correlation of the CDR_APBS_pos descriptor to Heparin and PSR data (). We screened a range of interior dielectric constants from 1 to 20, with a fixed exterior dielectric of 78.4. The results showed that the choice of interior dielectric constant significantly affected the correlation between the electrostatic positive patch on the CDR and Heparin/PSR data. Higher dielectric constants improved the Pearson correlations by as much as 20%, with an improvement plateauing at an interior dielectric constant of 16. show that the visualization of the electrostatic potential on the surface of example molecule omalizumab becomes more refined and detailed with higher dielectric values.
Figure 6. Impact of interior dielectric constant on Pearson ρ correlation between CDR_APBS_pos and two empirical assays: Heparin retention time (Hep RT)Citation72 (a) and PSRCitation26 (b). (c-d) Visualization of electrostatic potential on the surface of Omalizumab at extreme interior dielectric values (1 and 20). The descriptor values are calculated based on the conformation of the initial structure model (AB2) at pH 7.4.
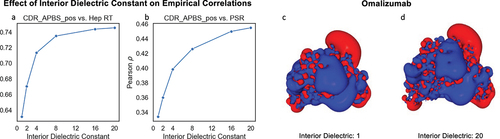
On the other hand, extremely high interior dielectric values in solvation models could generally result in unnecessary burial of ionizable groups, which could destabilize the folded state of proteins.Citation83 Therefore, despite marginal improvements in correlations with Hep RT and PSR upon increasing the interior dielectric, the choice of 16 for interior dielectric seems to be a reasonable trade-off.
Sensitivity to structure prediction models
To better understand the sensitivity of surface descriptors to the choice of input structure model, we compared CDR_APBS_pos and CDR_HPATCH_BM calculated for 592 clinical antibodies using four different structure models: AB2Citation50, DeepAb,Citation51 Equifold,Citation52 and MOECitation33 (). Our analysis suggests that descriptor values from different structure models are not highly correlated. The best correlation between static structure models was observed between AB2 and MOE for CDR_APBS_pos ( = 0.85) and between DeepAb and Equifold for CDR_HPATCH_BM (
= 0.78), while the weakest correlation was found between AB2 and DeepAb for CDR_APBS_pos (
= 0.34) and between MOE and Equifold for CDR_HPATCH_BM (
= 0.6).
Figure 7. (a) Heatmap displaying the coefficient of determination (R2) for CDR_APBS_pos (above the diagonal) and CDR_HPATCH_BM (below the diagonal) values for 592 clinical antibodies. calculated using AB2, MOE, DeepAb, and equifold static structure models (snapshot), and the same R2 after averaging the values over GaMD simulations (b-c) Distributions of hydrophobic (CDR_HPATCH_BM) and positive patch (CDR_APBS_pos) values across 592 clinical antibodies, as a function of different structure models, for single-static snapshots and GaMD-averaged values. (d-e) Correlations between surface descriptors (CDR_HPATCH_BM and CDR_APBS_pos) derived from DeepAb and MOE structure models for 592 clinical antibodies for snapshot and GaMD-averaged values.
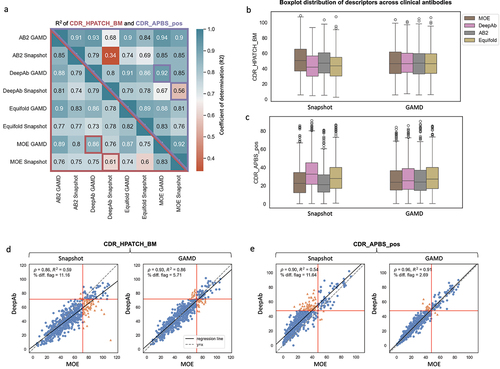
These weak correlations are mainly driven by systematic shifts in the surface descriptors across different structure models (). MOE and AB2 models cause a systematic bias toward higher values for CDR_HPATCH_BM scores (, Snapshot), whereas DeepAb and Equifold show a systematic bias toward more positive regions (higher CDR_APBS_pos values) relative to the other two structure models (, Snapshot). Note that MOE is based on fragment-based homology modeling, while both DeepAb and AB2 rely on deep learning trained on structures from the Structural Antibody Database (SAbDab).Citation50,Citation51 A lesser agreement between DeepAb and AB2 relative to AB2 and MOE is therefore intriguing.
The systematic biases in the value distribution of surface descriptors result in significant inconsistency in categorically flagging antibodies based on predefined cutoff threshold (see Ref.Citation28 and the following section on risk flags), despite using the exact same surface descriptor calculation method. MOE models result in a notably greater number of molecules with hydrophobicity values above a given threshold relative to DeepAb models (, Snapshot). In contrast, DeepAb models consistently yield a larger number of molecules with positive electrostatic surface scores (CDR_APBS_pos) above a threshold, compared to MOE (, Snapshot). These findings underscore the significant sensitivity of in silico risk flag assignment for developability assessments to the choice of the structure model used.
Impact of conformational sampling on correlations between structure models
Next, we examined whether the significant variability in the descriptor values obtained using different static structure models could be reduced through conformational sampling. We conducted 5 ns GaMD simulations on the same set of 592 clinical antibodies, using four different structure models for each molecule (four simulations per molecule). illustrates that averaging the values of the CDR_APBS_pos and CDR_HPATCH_BM descriptors over a conformational distribution leads to improved correlations between descriptors obtained from different structure models. Specifically, the correlation of MOE- and DeepAb-derived CDR_HPATCH_BM and CDR_APBS_pos values increases from 0.59 to 0.86 and from 0.54 to 0.91, respectively (, GaMD).
These improved correlations appear to be due to the convergence of surface descriptor distributions across structure models after averaging values from conformational distributions (). GaMD-based CDR_HPATCH_BM values shift toward lower hydrophobicity regions for MOE and AB2 while slightly increasing the values for DeepAb and Equifold. The CDR_APBS_pos distributions shift in the exact opposite directions for these structure models. Applying GaMD drives all distributions to the same range. These data show that MD-based conformational sampling is effective in reducing any bias in the predicted static structure models, leading to better agreement in the descriptor values from different structure models.
Impact of conformational sampling on correlations with biophysical assays
Next, we explored whether the improved consistency in the descriptor calculations across different structure models translates to improved correlations with biophysical assays. We selected three biophysical assays correlated with electrostatic descriptors (Viscosity-Apgar, PSR, and Heparin) and two assays correlating with hydrophobicity descriptors (Viscosity-Dai and HIC). The performance (Pearson and PR-AUC) of different structure models in predicting each one of the biophysical assays using the corresponding descriptor, using values based on single-static snapshots and GaMD simulations is shown in .
Figure 8. Performance (Pearson ρ and PR-AUC) of MolDesk descriptors in predicting empirical data across different predicted structure models (AB2, MOE, DeepAb, and Equifold), for both single-static snapshots and the average value of 5ns of GaMD simulations. Dotted lines represent the mean performance (Pearson ρ or PR-AUC) across the four structure models, colored by simulation mode (snapshot or 5ns GaMD). Standard deviation shown is of Pearson ρ or PR-AUC across structure models.
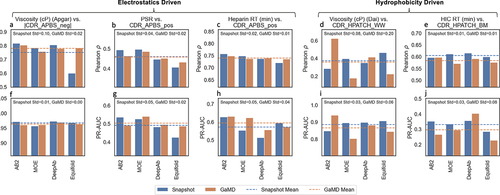
First, we observed significant variability in the performance of different static (snapshot) structure models. Notably, there is not a single structure model that outperforms the others across the entire dataset. For example, AB2 leads in the prediction of Viscosity-Apgar (), but it performs worse in the Viscosity-Dai set (). Equifold shows the exact opposite trend for these two sets. DeepAb seems to exhibit slightly superior performance in predicting HIC (PR-AUC) (), but it has the lowest PR-AUC for Heparin prediction ().
Second, the impact of conformational sampling on correlations with biophysical assays varies between electrostatic-driven and hydrophobicity-driven assays. GaMD significantly improves the correlation of the worst-performing models (e.g., Equifold for Viscosity-Apgar and DeepAb for Heparin) within each electrostatic-driven dataset () while slightly reducing the correlation of better-performing static models (e.g., AB2). The average improvement is still positive (dashed orange relative to dashed blue lines, ). The accuracy adjustments upon sampling suggest that any superiority in correlations of any static structure model with biophysical assays may be due to inadvertent error cancellation rather than being mechanistically meaningful. Given that conformational sampling accounts for multiple conformation-dependent protonation states, an overall improvement of correlations with electrostatics-based assays is expected.
In contrast, the effect of conformational sampling on improvements with hydrophobic-driven assays is inconsistent across structure models. While AB2’s correlation with Viscosity-Dai improves significantly, the opposite trend is observed for Equifold and MOE (). Most notably, conformational sampling consistently reduces the performance of all structure models in predicting the HIC assay (). This suggests that the quality of initial structures is not the only contributing factor. This counter effect of simulation on improving correlations with HIC has been previously reported.Citation48
One possible explanation for the inconsistent effect of conformational sampling on correlations with HIC could be due to unmatched simulation and experimental conditions. HIC measurements are conducted under gradients of high and low salt concentrations, gradually lowering the salt concentration to elute sample components based on their hydrophobicity. This drastic change in salt conditions may profoundly affect the folding of antibody structure. In contrast, the MD simulation conducted here is in pure bulk water with no added salt (just enough ions to neutralize the system), which could overstabilize the structure relative to the HIC measurement condition.
Despite some of these inconsistencies, we found that the combination of AB2 and GaMD stands out as the best performing option, as it shows superior performance relative to all other structure models and sampling combinations. An assessment of structure quality using TopModelCitation53 further confirmed this, demonstrating that AB2 consistently produces fewer faulty structures. AB2 also offers the advantage of being faster and freely available.
Sensitivity to the simulation time scale
We investigated the impact of simulation length on the effectiveness of conformational sampling in reducing bias in static predicted structures. We used microsecond-long conventional MD (cMD) simulation trajectories (3 × 350 ns) from a previous study for a subset of 126 clinical antibodiesCitation23 as our baseline. Then, we generated 100ns-long GaMD simulations from the same structure (Fab MOE homology model) and initial conditions.Citation23 Subsequently, we downsampled both cMD and GaMD simulation lengths from their maximum timescale to 1 ns. The calculated correlations of the mean and standard deviation of two descriptors (CDR_HPATCH_BM and CDR_APBS_pos) for each time point relative to the reference simulations are shown in .
Figure 9. (A) Effect of simulation length on R2 correlation of the mean descriptor values for GaMD and conventional MD (cMD) trajectories at different time scales. The reference is the mean value descriptors calculated for a subset of 126 clinical antibodiesCitation27 over an aggregate of 1 μs (3×350ns) cMD Fab simulations. (B) Pearson ρ correlation of standard deviation of descriptor values calculated over MD trajectories (GaMD and cMD) relative to the same values from the reference simulations.
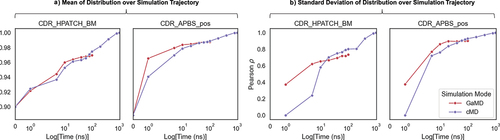
shows that the mean of descriptor values over the simulation converges quickly, achieving correlations
0.92 within 5 ns for both GaMD and cMD runs, with GaMD showing faster convergence initially. Any further improvement in
values after 5 ns is incremental; a 100 ns simulation for both GaMD and cMD reaches
for CDR_APBS_pos. However, the width of the distribution, represented by standard deviation, requires much longer simulation times to converge. Standard deviation here signifies the extent of conformational variability, indicating the probability of visiting more extreme but less populated surface properties in the simulation of a given structure. A 10 ns simulation reaches a Pearson
correlation of 0.6 and 0.8 for CDR_HPATCH_BM and CDR_APBS_pos (), and it keeps improving upon additional time scales for cMD, even though it seems to plateau for the GaMD runs.
Figure S1 illustrates the number of mismatched risk flags comparing descriptors based on static structures and simulation-averaged values. Our data suggest that even very short simulations, as short as 5 ns, significantly reduce bias in surface properties and exhibit good correlation with microsecond simulations in terms of mean value of the distributions.
Developability risk flags
Besides exploring correlations with biophysical assays, molecular surface descriptors are used to raise developability risk flags based on pre-defined cutoff thresholds for each descriptor.Citation28,Citation74,Citation84 Notably, Raybould et al. introduced five computational guidelines known as the Therapeutic Antibody Profiler (TAP) to evaluate the developability of mAbs.Citation28 Following a similar approach,Citation28 we identify six developability risk flags based on the surface descriptors presented here. These descriptors have been selected based on their correlations with various experimental liabilities (). The list includes CDR_APBS_neg and Fv_CAP, two determinants of viscosity and colloidal stability (); CDR_APBS_pos, a main driver of PK clearance and polyspecificity (); CDR_HPATCH_WW, which plays a role in driving hydrophobicity-driven viscosity (); CDR_HPATCH_BM which correlated the best with HIC and SEC (). Additionally, we also include the total CDR length (CDR_len), which indicates the flexibility of CDR loops, aligning with the TAP metrics.Citation28
Table 1. MolDesk cutoff thresholds specifying categorical risk flags, computed using 629 clinical-stage molecules in 2023.Citation85
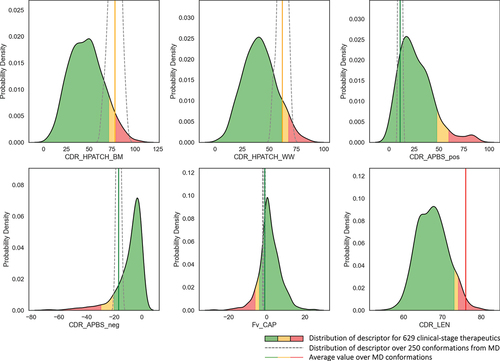
To identify cutoff thresholds to define risk regions, we calculate 1D kernel density estimation (KDE) distributions of each one of the descriptors for a dataset of 629 CST sourced from TheraSAbDab.Citation28,Citation85 For descriptors in which extremely large values are less desirable (e.g. CDR_HPATCH_BM, CDR_HPATCH_WW, CDR_APBS_pos, CDR_len), the 90th and 95th percentiles of the distributions serve as the thresholds to define medium risk (amber) and high risk (red) flags, respectively. In the case of descriptors where extremely large negative values pose an issue (CDR_APBS_neg, Fv_CAP), the 10th and 5th percentiles of the distributions establish the thresholds for amber and red flags, respectively. To identify the risk flags for a molecule, conformational distributions of each descriptor from 5 ns GaMD are calculated (dashed line in ). The risk level for each descriptor is determined based on the mean value of the distributions relative to the cutoff thresholds for red and amber flag regions.
Figure 10. Developability risk flags for mAbH. Solid line distributions represent MolDesk descriptor mean values for 629 clinical-stage antibodies (TheraSAbDab),Citation80 with background colors matching the flagging regions according to cutoffs defined in . The dashed lines represent the distributions of the corresponding descriptor values for mAbH over a conformational distribution from 5ns GaMD, with the average of simulation values shown as a vertical line colored according to risk assignment.
Case studies
We validate the effectiveness of the proposed flagging system by testing it on nine different Genentech internal antibodies each with various development-related issues, see . Namely, mAb15 and mAb1621 exhibited high viscosity under high concentration conditions; mAbG exhibited solubility issues;Citation86 mAbH forms visible particles; mAbI and mAbJ aggregate under accelerated stress conditions. On the other hand, mAbK, mAbL, and mAbRCitation86 were stable without any significant developability issues.
Table 2. Developability assessment for nine case study antibodies using MolDesk and TAP risk flags. “NF” stands for not flagged.
The MolDesk and TAP risk flags are shown in . In the cases of high viscosity (mAb15 and mAb16), MolDesk flagged issues related to charge asymmetry (Fv_CAP) and negative electrostatic potential (CDR_APBS_neg) as red or amber, whereas TAP also identified surface-based charge asymmetry (SFvCSP) as amber, but did not indicate atypical negative charges on the Fv. For molecules with aggregation, visible particle, or solubility issues (mAbG, mAbH, mAbI, and mAbJ), MolDesk flagged large hydrophobic patches (CDR_HPATCH_BM or CDR_HPATCH_WW) as red or amber, while TAP did not raise any hydrophobic flags. For well-behaved molecules (mAbJ, mAbK, and mAbR), neither MolDesk nor TAP raised any risk flags. Overall, in these case study molecules, MolDesk consistently raised relevant risk flags that aligned with the observed developability issues, whereas the TAP model appeared to underestimate associated risks, in particular, for hydrophobicity flags that are related to solubility, aggregation, and particle formation.Citation28,Citation39,Citation48 It should be noted that TAP descriptors are generated using an older flavor of AB2 structure prediction model (ABodyBuilder),Citation87 and no conformational sampling is performed by default. In addition, the use of more relevant hydrophobicity scales (e.g., BM and WW) and incorporation of electrostatic potential and a structure-based protonation state assignment contributes to the superior performance of MolDesk compared to TAP.
Discussion
Early assessment of antibody developability is crucial to the mitigation of risks associated with unfavorable behavior during the development and CMC stages. Computational models offer rapid, high throughput and material-free assessments of developability risk, but their predictive power and reproducibility rely on careful selection of molecular surface descriptors, model parameters, and protocols. Subtle nuances in the calculations of molecular properties lead to inaccuracies, potentially resulting in false confidence in poorly behaved molecules or unwarranted deprioritization of well-behaved ones.
In this study, we performed a comprehensive analysis of key molecular descriptors and their sensitivities to methodological nuances in the context of antibody developability prediction. We introduced a set of carefully crafted molecular surface descriptors tailored to capture relevant structural and surface features (MolDesk). Evaluating their performance across a range experimentally measured biophysical data, we found that electrostatic surface descriptors exhibited stronger correlations with charge-driven data (e.g., Viscosity-Apgar, Heparin, and PSR) compared to hydrophobicity descriptors with their respective biophysical assays (e.g., Viscosity-Dai, SEC, and HIC). The performance varied based on the level of approximations used to represent electrostatics. More theoretically rigorous treatments of electrostatics, via accounting for the conformation-dependent distribution of the electrostatic potential in solution using APBS and ensemble-averaged protonation states (e.g., CDR_APBS_pos/neg and ens_charge_Fv), resulted in better correlations with biophysical assays. Notably, the expert-crafted descriptor, CDR_APBS_neg, resulted in a comparable performance to a neural network trained on APBS electrostatic potential as input to the model to predict viscosity (PfAbNet-viscosity). On the other hand, substantial approximations in the calculation of charge-based descriptors, such as using sequence-based charge calculations or protonation state assignment (CDR_PPC), led to weaker correlations with charge-driven biophysical assays.
Further, we found that the correlation of hydrophobicity descriptors between different methods and their correlations with empirical biophysical data are generally less consistent. Specifically, the direction of the shift in the distribution of hydrophobicity values for clinical-stage antibodies compared to human antibodies was found to be strongly dependent on the choice of the hydrophobicity scale used. Conclusions about overall hydrophobicity, patch localization, and correlations with biophysical assays were also heavily influenced by the hydrophobicity scales. Nonetheless, we found that the WW and BM scales (CDR_HPATCH_WW and CDR_HPATCH_BM) showed overall better correlations with most biophysical assays, with the logP-based approach (CDR_HYD) performing well in correlations with HIC. In contrast, the commonly used KD scale demonstrated weaker correlations with hydrophobicity-related biophysical assays.
Another source of discrepancy among calculated descriptors stemmed from inconsistencies across predicted structure models. The use of different predicted structure models led to inconsistent shifts in the distributions of surface properties, with some structure models yielding systematic bias toward higher and lower values for hydrophobic and positive potential surface properties, respectively, with some other models doing the exact opposite. This bias resulted in weak correlations of surface descriptors across different structure models, which translates to varying correlations of values from different structure models with biophysical assays. Notably, none of the structure models outperformed the others across all biophysical datasets simultaneously.
Applying even short MD simulations to structure models proved effective in mitigating the observed systematic biases in surface properties using different static-structure models, aligning their predictions more closely. This underscores the inadequacy of single-static structures in accurately capturing antibody properties and their associated developability risk flags. Regardless of the quality of the input structure model, reliance solely on single-static structures may yield inconsistent and noisy predictions. The use of conformational distributions derived from MD simulations results in a more consistent assignment of developability risk flags, eliminating biases inherent in structure models. Additionally, we found that while the mean of descriptor distributions converged at shorter simulation timescales, longer simulations were necessary to converge the width of descriptor distributions over an MD trajectory.
The enhanced consistency among descriptors derived from different structure models upon conformational sampling did not translate to an immediate and uniform improvement in the correlations of the descriptors with all biophysical assays. While correlations of electrostatic-based descriptors generally improved, particularly benefiting less accurate static models, this improvement was not observed for hydrophobicity assays. Counterintuitively, correlations with the HIC assay even decreased across all structure models after conformational sampling was performed. The overall improvement of electrostatic descriptors may be attributed to the representation of an ensemble of protonation states that improves the pKa calculations at a given pH. However, the loss in HIC accuracy after conformational sampling using MD could be due to differences in simulation conditions (protein solvated in bulk water) versus experimental settings (proteins exposed to extreme salt conditions).
Based on our benchmark analysis, we proposed six developability risk flags for profiling antibodies and guiding candidate selection through developability assessment. We observed a superior predictability of developability liabilities for case study molecules when compared to the established TAP rules.
Future studies can aim at matching the simulation and experimental conditions to better understand the impact of conformational sampling on HIC prediction. Also, the results presented here suggest that there is much room to further improve the quality of antibody structure prediction models, in particular, to eliminate the systematic bias in calculation of surface properties. One potential strategy to remove such a bias is to train structure prediction models on structures equilibrated using MD simulations, instead of training directly on static crystal structures. Another area for improvement is the definition of hydrophobicity scores to further enhance the accuracy of hydrophobicity-driven biophysical assays. While beyond the scope of this study, it would be interesting to see if incorporating these descriptors into multi-parameter models could further improve the accuracy of scoring functions for predicting specific experimental data. Lastly, while our study primarily focused on the application of these descriptors in the context of antibody developability, their utility could extend to improving the accuracy of surface-based models for studying molecular recognition and protein–protein interactions.
Methods
Structure prediction models
By default, we utilized the ImmunebuilderCitation50 Antibody Builder 2 (AB2) structure prediction tool to generate Fv domain antibody structures. To evaluate the sensitivity to the choice of model structures, we also modeled Fv domain structures using MOECitation33’s homology modeling tool, Equifold,Citation52 and DeepAb.Citation51
Assignment of protonation states
PDB2PQRCitation88 (v. 1.8) was used with the AMBER force fieldCitation89 to assign partial atomic charges whereby ionization states were determined using PROPKACitation34,Citation90 at pH 6.0 or 7.4 depending on the empirical assay studied. The resulting prepared structures were saved in PQR format.
Molecular dynamics protocol
The Fv structures were parameterized with FF14SB force field,Citation91 and were solvated in a cubic box of TIP3P explicit water modelCitation92 with a minimum 10Å distance from the edge of the box. The system charge was neutralized with Na+ and Cl− counter ions. Hydrogen Mass RepartitioningCitation93 was performed on the solute atoms to enable a simulation time step of 4fs.
The GPU implementation of Amber 2020 MD software packageCitation94 with the SPFP precision modelCitation95 was used for all the MD simulations. First, the structure was relaxed with 2000 steps of conjugate-gradient energy minimization, using a harmonic restraining potential with the force constant of 10 kcal/mol/Å to restrain the solute to the initial structure. The pressure was then maintained at 1 atm, and the thermostat temperature increased to 300K over the course of 200 ps keeping the harmonic positional restraints of strength 10 kcal/mol/Å
on the solute structure. The system was then equilibrated for 1 ns with a restraint force constant of 1 kcal/mol/Å
. All restraints were removed for the production stage. The simulation time step was 4 fs. A 9Å cutoff radius was used for range-limited interactions, with Particle Mesh EwaldCitation96 electrostatics for long-range interactions. The production simulation was carried out using NPT conditions. Langevin dynamicsCitation97 was used to maintain the temperature at 300 K with a collision frequency of
= 1 ps
.
After the 1 ns NPT equilibration, a 5 ns GaMDCitation57 simulation module in AMBER 2020 was performed. All GaMD simulations were run at the dual-boost level, with the reference energy set to the lower bound. System potential energies were averaged and their standard deviation calculated every 50,000 steps (100 ps). The upper limit of the boost potential’s standard deviation, 0, was set to 6.0 kcal/mol for both the dihedral and total potential energetic terms. Simulation frames were saved every 20 ps for analysis. A total of 250 evenly spaced frames were extracted from each GaMD simulation for surface descriptor calculations.
It is recommended to reweight GAMD trajectories to recover a canonical ensemble and the original free energy profile of functional biomolecules. In this work, we applied reweighting according to boost potentials using cumulative expansion to the second orderCitation57 for one of the empirical biophysical datasets (Dai et al. viscosity dataset, ) and did not see any significant impact on the mean of descriptor distributions from MD simulations or the correlation with empirical viscosity data. Such reweighting was not applied to the other datasets. Therefore, GaMD simulations used here primarily generate a conformational distribution rather than a true thermodynamics ensemble.
For the simulation convergence analysis, we used microsecond-length trajectories previously generated via conventional MD at pH 5.5 for 131 clinical antibodies, using Fab homology models from MOE, as described by Irudayanathan et al.Citation23 To maintain consistency in the system setup, we generated 100 ns GaMD simulations using the exact parameter and coordinate files from the aforementioned study. A total of 379 and 1125 evenly spaced frames were extracted from each GaMD and cMD simulations for surface descriptor calculations and then sampled down proportionally to the time length.
Electrostatic surface properties
To analyze the electrostatic surface properties, first the APBS toolCitation58 was utilized to compute Poisson-Boltzmann electrostatics using the corresponding PQR file. NanoshaperCitation98 was used to generate a triangulated mesh representing the molecular surface. The SES construction used a probe size of 1.5 Å and a density of 5 points per Å2. The charge at each vertex of the meshed surface was assigned using Multivalue, a tool within the APBS suite. Next, an in-house Python script was developed to map the electrostatic potential from the vertices to the corresponding atoms. To obtain per residue values, we calculated the sum of all electrostatic potentials, as well as the sum of all the positive or negative values. This process yielded three values: APBS_neg, APBS_pos, and APBS_sum for each residue.
We calculated electrostatic descriptors at the Fab, Fv, and CDR levels by integrating the residue-level electrostatic potentials (APBS_neg, APBS_pos, and APBS_sum) across the respective regions. For numbering antibody amino-acid variable domain sequences and the CDR regions, we employed ANARCICitation99 using the Kabat scheme. This integration allowed us to derive the following electrostatic descriptors: Fab_APBS_pos, Fab_APBS_neg, Fab_APBS_sum, Fv_APBS_pos, Fv_APBS_neg, Fv_APBS_sum, CDR_APBS_pos, CDR_APBS_neg, and CDR_APBS_sum.
HPATCH: hydrophobic patch calculations
To calculate the hydrophobicity surface descriptors, we developed HPATCH, which utilizes the PDB structure of an antibody to generate a triangulated Nanoshaper molecular surfaceCitation98 as described above. Each vertex on the surface is assigned a hydrophobicity scalar value based on four different scales: Kyte-Doolittle (KD), Wimley-White (WW), Eisenberg (EI), and Black & Mould (BM). These hydrophobicity values are scaled to a range between −5 (hydrophilic) and +5 (most hydrophobic). To account for clustering effects, the hydrophobicity value for each vertex is determined by calculating the average of all neighboring vertices within a Euclidean cutoff distance of 10 Å. For computational efficiency, we assume that two surface vertices are neighbors if their associated atoms are within the same cutoff distance, thus only requiring a search for distances between associated atoms to identify neighbors. To further enhance computational speed, the code partitions the space into cubic boxes of size (2 × cutoff) and stores the atoms within each box. The algorithm then iterates over each atom and searches within the neighboring cubic boxes. Finally, the hydrophobicity values of the vertices are summed and assigned to their corresponding atoms. These values are further summed for all the atoms within each residue to obtain a residue-level hydrophobicity value. The hydrophobicity of each domain (CDR, Fv, Fab) is calculated by summing up the hydrophobicity values of all the corresponding residues that have a positive (hydrophobic) value.
TAP descriptors
Therapeutic Antibody Profiler (TAP)Citation28 descriptors for clinical antibodies were collected from Jain et al.Citation26 For the other datasets where TAP descriptors were not published (SEC set from Genentech), we calculated the descriptors using the standard parameters (Fv built using AB2 and run at pH 7.4), using a containerized version of the software licensed from OxPig. TAP descriptors are calculated using single-snapshot ABodyBuilder structure models,Citation87 which is the default mode in the tool.
MOE protein properties
The MOECitation33 descriptors for clinical antibodies were collected from work by Jain et al.Citation26 For the remaining sets (SEC and HMW data), we used the following protocol to generate the descriptors. The Antibody Modeling module of MOE was used to build the homology models of Fv domains. The force field was set to the default Amber10 EHT using an internal and external dielectric values of 4 and 80, the non-bonded cutoff distances of 10 and 12 Å, and the Born solvation model. The prepared structures were energy minimized to the root mean square gradient (RMSG) below 0.00001 kcal/mol/Å2. Protein properties for each Fv region were calculated using the Ensemble pH sampling module available in MOE, spanning two pH ranges, 4.5 to 6.5 and 6.4 to 8.4 (targeting pH = 7.4). The number of conformations per unit of pH range was set to 25. The protein properties were calculated as Boltzmann weighted averages of the individual values from an ensemble of 50 total conformations.
SAP: spatial aggregation propensity
The SAP scores were calculated using our in-house implementation of the algorithm developed by Chennamsetty et al.:Citation39
where is the distance between atoms i and j,
and
are solvent-accessible surface area of the neighboring residue
side-chains in folded structure and fully exposed formats, respectively, calculated using the Shrake-Rupley algorithm.Citation100 HI(j) is the hydrophobicity scale of the residue j based on Black and Mould. To calculate domain-level SAP scores, all the SAP value where
were summed up for all the atoms within that domain.
To maintain consistency with the HPATCH analysis, we utilized the same system preparations (structure models, protonation states) and simulation trajectories to generate the MD snapshots used for calculating the SAP values averaged over the conformational distributions.
Additional in silico descriptors
SCM and PfAbNet-viscosity predictions were pulled from predictions provided by Apgar et al.Citation69
Experimental biophysical datasets
summarizes the list of the experimental data used in our study. The experimental measurement method details can be found in the corresponding publications, also listed in the table. The Size Exclusion Chromatography measurement values for a panel of 15 IgG1 antibodies were sourced from Genentech internal data. The measurements followed a protocol described previously.Citation101
Table 3. Summary of antibody sequences and experimental biophysical datasets and their corresponding cutoff thresholds used in this study.
Sequence data
A set of 674 CST sequences were downloaded from Thera-SAbDabCitation85 in August 2020. Due to structure prediction or simulation failures, we studied a subset of 592 sequences in the sections on sensitivity to structure model and the impact of conformational sampling. A subset of human antibody sequences from Observed Antibody Space setCitation79 was collected to study the impact of hydrophobicity scales on shifts in the distribution of clinical and human antibodies (see ).
Accuracy metrics
Precision–Recall curves, crucial for handling unbalanced datasets, were computed using scikit-learn’s precision_recall_curve method.Citation102 The baseline estimator in these plots is determined by the ratio of positive samples to the total. The Precision-Recall Area Under Curve (PR-AUC) was calculated using scikit-learn’s auc methodCitation102 based on precision and recall values.
Pearson and Spearman
, measuring linear and monotonic relationships, respectively, are determined using SciPy.Citation103 Pearson
, the squared correlation coefficient, is utilized when the magnitude of correlation is more pertinent than the direction. The coefficient of determination,
, is calculated using scikit-learn’s r2_score method.Citation102 As Pearson
and the coefficient of determination,
, are distinct methods, we denote the former as “Pearson
.”
Abbreviations
| AB2 | = | ABodyBuilder2 structure prediction tool |
| APBS | = | Adaptive Poisson-Boltzmann Solver |
| ASP | = | average surface property |
| BM | = | Black & Mould hydrophobicity scale |
| CST | = | clinical stage therapeutics |
| CDR | = | Antibody complementarity-determining region |
| CMC | = | chemistry, manufacturing, and controls stage |
| cMD | = | conventional Molecular Dynamics |
| EI | = | Eisenberg hydrophobicity scale |
| EP | = | electrostatic potential |
| ens_charge_Fv | = | ensemble charge of the Fv (MOE) |
| Fab | = | Fragment antigen-binding domain |
| Fv | = | Antibody variable domain |
| FvCSP | = | charge symmetry parameter (Sharma et al.) |
| GaMD | = | Gaussian-accelerated Molecular Dynamics |
| HIC | = | hydrophobic interaction chromatography |
| HI | = | Fv Hydrophobicity Index (Sharma et al.) |
| HPATCH | = | Hydropathy Patch |
| KD | = | Kyte-Doolittle hydrophobicity scale |
| KDE | = | kernel density estimate |
| mAbs | = | monoclonal antibodies |
| MD | = | Molecular Dynamics |
| MOE | = | Molecular Operating Environment software |
| MolDesk | = | Molecular Descriptors |
| OAS | = | Observed Antibody Space |
| PNC | = | Patches of Negative Charge (TAP) |
| PPC | = | Patches of Positive Charge (TAP) |
| PR-AUC | = | Precision-Recall Area Under Curve metric for binary classification |
| PSH | = | Protein Surface Hydrophobicity (TAP) |
| PSR | = | Poly-Specificity Reagent |
| pI_3D | = | structure-based PI (MOE) |
| PK | = | pharmacokinetic |
| RP-HPLC | = | reverse-phased high-performance liquid chromatography |
| RT | = | Retention time |
| SAP | = | Spatial Aggregation Propensity (Chennamsetty et al.) |
| SFvCSP | = | Surface-based charge symmetry parameter (TAP) |
| SCM | = | spatial charge map (Agrawal et al.) |
| SEC | = | size exclusion chromatography |
| SASA | = | solvent-accessible surface area |
| TAP | = | Therapeutic Antibody Profiler tool |
| WW | = | Wimley White hydrophobicity scale |
Supplemental Material
Download MS Word (3.4 MB)MOLDESK_MASTER_FILE.xlsx
Download MS Excel (431.2 KB)Acknowledgments
The authors gratefully thank Bob Kelley, Jessie Zhao, Jonathan Zarzar, Trevor Swartz, Nandhini Rajagopal, Shrenik Mehta, Jasper Lin, and Darcy Davidson for their valuable comments and suggestions. The authors also thank Thomas Hoeffel, Joseph Lipscomb, and Kapil Bajaj for their assistance in running our simulations smoothly on our high-performance computing cluster.
Disclosure statement
All authors are current employees of Genentech, Inc, which develops and commercializes therapeutics, including antibodies.
Supplementary material
Supplemental data for this article can be accessed online at https://doi.org/10.1080/19420862.2024.2362788
Additional information
Funding
References
- Carter PJ. Potent antibody therapeutics by design. Nat Rev Immunol. 2006;6(5):343–20. doi:10.1038/nri1837.
- Lobo ED, Hansen RJ, Balthasar JP. Antibody pharmacokinetics and pharmacodynamics. J Pharmaceut Sci [Internet]. 2004;93(11):2645–68. doi:10.1002/jps.20178.
- Reichert JM. Which are the antibodies to watch in 2013? MAbs. 2013;5(1):1–4. doi:10.4161/mabs.22976.
- Reichert JM. Antibodies to watch in 2016. MAbs. 2016;8(2):197–204. doi:10.1080/19420862.2015.1125583.
- Bailly M, Mieczkowski C, Juan V, Metwally E, Tomazela D, Baker J, Uchida M, Kofman E, Raoufi F, Motlagh S, et al. Predicting antibody developability profiles through early stage discovery screening. MAbs. 2020;12(1):1743053. doi:10.1080/19420862.2020.1743053.
- Zarzar J, Khan T, Bhagawati M, Weiche B, Sydow-Andersen J, Sreedhara A. High concentration formulation developability approaches and considerations. MAbs. 2023;15(1):2211185. doi:10.1080/19420862.2023.2211185.
- Starr CG, Tessier PM. Selecting and engineering monoclonal antibodies with drug-like specificity. Curr Opinion Biotechnol [Internet]. 2019;60:119–27. doi:10.1016/j.copbio.2019.01.008.
- Ollier R, Fuchs A, Gauye F, Piorkowska K, Menant S, Ratnam M, Montanari P, Guilhot F, Phillipe D, Audrain M, et al. Improved antibody pharmacokinetics by disruption of contiguous positive surface potential and charge reduction using alternate human framework. MAbs. 2023;15(1). doi:10.1080/19420862.2023.2232087.
- Stüber JC, Rechberger KF, Miladinović SM, Pöschinger T, Zimmermann T, Villenave R, Eigenmann MJ, Kraft TE, Shah DK, Kettenberger H, et al. Impact of charge patches on tumor disposition and biodistribution of therapeutic antibodies. AAPS Open [Internet]. 2022;8(1):3. doi:10.1186/s41120-021-00048-9.
- Peng H-P, Lee KH, Jian J-W, Yang A-S. Origins of specificity and affinity in antibody–protein interactions. Proc Natl Acad Sci USA. 2014;111(26):E2656–65. doi:10.1073/pnas.1401131111.
- Kringelum JV, Nielsen M, Padkjær SB, Lund O. Structural analysis of b-cell epitopes in antibody: protein complexes. Molecul Immunol [Internet]. 2013;53(1–2):24–34. doi:10.1016/j.molimm.2012.06.001.
- Ramaraj T, Angel T, Dratz EA, Jesaitis AJ, Mumey B. Antigen–antibody interface properties: composition, residue interactions, and features of 53 non-redundant structures. Biochimica et Biophysica Acta (BBA) - Proteins Proteom [Internet]. 2012;1824(3):520–32. doi:10.1016/j.bbapap.2011.12.007.
- Kayser V, Chennamsetty N, Voynov V, Helk B, Trout BL. Conformational stability and aggregation of therapeutic monoclonal antibodies studied with ANS and thioflavin t binding. MAbs. 2011;3(4):408–11. doi:10.4161/mabs.3.4.15677.
- Manning MC, Chou DK, Murphy BM, Payne RW, Katayama DS. Stability of protein pharmaceuticals: an update. Pharm Res. 2010;27(4):544–75. doi:10.1007/s11095-009-0045-6.
- Roberts CJ. Protein aggregation and its impact on product quality. Cur Opin Biotechnol [Internet]. 2014;30:211–17. doi:10.1016/j.copbio.2014.08.001.
- Yadav S, Shire SJ, Kalonia DS. Factors affecting the viscosity in high concentration solutions of different monoclonal antibodies. J Pharm Sci. 2010;99(12):4812–29. doi:10.1002/jps.22190.
- Yadav S, Laue TM, Kalonia DS, Singh SN, Shire SJ. The influence of charge distribution on self-association and viscosity behavior of monoclonal antibody solutions. Mol Pharmaceut. 2012;9(4):791–802. doi:10.1021/mp200566k.
- Yadav S, Sreedhara A, Kanai S, Liu J, Lien S, Lowman H, Kalonia DS, Shire SJ. Establishing a link between amino acid sequences and self-associating and viscoelastic behavior of two closely related monoclonal antibodies. Pharm Res. 2011;28(7):1750–64. doi:10.1007/s11095-011-0410-0.
- Yadav S, Shire SJ, Kalonia DS. Viscosity behavior of high-concentration monoclonal antibody solutions: correlation with interaction parameter and electroviscous effects. J Pharm Sci. 2012;101(3):998–1011. doi:10.1002/jps.22831.
- Lilyestrom WG, Yadav S, Shire SJ, Scherer TM. Monoclonal antibody self-association, cluster formation, and rheology at high concentrations. J Phys Chem B. 2013;117(21):6373–84. doi:10.1021/jp4008152.
- Connolly Brian B, Petry C, Yadav S, Demeule B, Ciaccio N, Moore Jamie JR, Shire Steven S, Gokarn Yatin Y. Weak interactions govern the viscosity of concentrated antibody solutions: high-throughput analysis using the diffusion interaction parameter. Biophys J [Internet]. 2012;103(1):69–78. doi:10.1016/j.bpj.2012.04.047.
- Shire SJ. 3 - stability of monoclonal antibodies (mAbs) [Internet]. In: Shire S, editor. Monoclonal antibodies. Woodhead Publishing; 2015. p. 45–92. https://www.sciencedirect.com/science/article/pii/B9780081002964000038.
- Irudayanathan FJ, Zarzar J, Lin J, Izadi S. Deciphering deamidation and isomerization in therapeutic proteins: effect of neighboring residue. MAbs. 2022;14(1):2143006. doi:10.1080/19420862.2022.2143006.
- Freed AS, Cramer SM. Protein−surface interaction maps for Ion-exchange chromatography. Langmuir [Internet]. 2011;27(7):3561–68. doi:10.1021/la104641z.
- Yao Y, Lenhoff AM. Electrostatic contributions to protein retention in ion-exchange chromatography. 1. Cytochrome c variants. Anal Chem. 2004;76(22):6743–52. doi:10.1021/ac049327z.
- Jain T, Boland T, Vásquez M. Identifying developability risks for clinical progression of antibodies using high-throughput in vitro and in silico approaches. MAbs. 2023;15(1):2200540. doi:10.1080/19420862.2023.2200540.
- Jain T, Sun T, Durand S, Hall A, Houston NR, Nett JH, Sharkey B, Bobrowicz B, Caffry I, Yu Y, et al. Biophysical properties of the clinical-stage antibody landscape. Proc Natl Acad Sci USA. 2017;114(5):944–49. doi:10.1073/pnas.1616408114.
- Raybould MIJ, Marks C, Krawczyk K, Taddese B, Nowak J, Lewis AP, Bujotzek A, Shi J, Deane CM. Five computational developability guidelines for therapeutic antibody profiling. Proc Natl Acad Sci USA. 2019;116(10):4025–30. doi:10.1073/pnas.1810576116.
- Sharma VK, Patapoff TW, Kabakoff B, Pai S, Hilario E, Zhang B, Li C, Borisov O, Kelley RF, Chorny I, et al. In silico selection of therapeutic antibodies for development: viscosity, clearance, and chemical stability. Proc Natl Acad Sci USA. 2014;111(52):18601–06. doi:10.1073/pnas.1421779112.
- Shire SJ, Shahrokh Z, Liu J. Challenges in the development of high protein concentration formulations. J Pharm Sci. 2004;93(6):1390–402. doi:10.1002/jps.20079.
- Cunningham O, Scott M, Zhou ZS, Finlay WJJ. Polyreactivity and polyspecificity in therapeutic antibody development: risk factors for failure in preclinical and clinical development campaigns. MAbs. 2021;13(1):1999195. doi:10.1080/19420862.2021.1999195.
- Agrawal NJ, Helk B, Kumar S, Mody N, Sathish HA, Samra HS, Buck PM, Li L, Trout BL. Computational tool for the early screening of monoclonal antibodies for their viscosities. MAbs. 2016;8(1):43–48. doi:10.1080/19420862.2015.1099773.
- Molecular Operating Environment (MOE). 8, Chemical computing group ULC, 1010 Sherbrooke St, West, suite 910. Montreal, QC, Canada, H3A 2R7; 2013.
- Søndergaard CR, Olsson MHM, Rostkowski M, Jensen JH. Improved treatment of ligands and coupling effects in empirical calculation and rationalization of pKa values. J Chem Theory Comput. 2011;7(7):2284–95. doi:10.1021/ct200133y.
- Labute P. Protonate3D: assignment of ionization states and hydrogen coordinates to macromolecular structures. Proteins. 2009;75(1):187–205. doi:10.1002/prot.22234.
- Davis ME, McCammon JA. Electrostatics in biomolecular structure and dynamics. Chem Rev. 1990;90(3):509–21. doi:10.1021/cr00101a005.
- Hoerschinger VJ, Waibl F, Pomarici ND, Loeffler JR, Deane CM, Georges G, Kettenberger H, Fernández-Quintero ML, Liedl KR. PEP-patch: electrostatics in protein–protein recognition, specificity, and antibody developability. J Chem Inf Model. 2023;63(22):6964–71. doi:10.1021/acs.jcim.3c01490.
- Onufriev AV, Izadi S. Water models for biomolecular simulations. WIREs Comput Mol Sci. 2018;8(2):e1347. doi:10.1002/wcms.1347.
- Chennamsetty N, Voynov V, Kayser V, Helk B, Trout BL. Design of therapeutic proteins with enhanced stability. Proc Natl Acad Sci USA. 2009;106(29):11937–42. doi:10.1073/pnas.0904191106.
- Sankar K, Krystek SR, Carl SM, Day T, Maier JK. AggScore: prediction of aggregation-prone regions in proteins based on the distribution of surface patches. Proteins Struct Funct Bioinf. 2018;86(11):1147–56. doi:10.1002/prot.25594.
- Coffman J, Marques B, Orozco R, Aswath M, Mohammad H, Zimmermann E, Khouri J, Griesbach J, Izadi S, Williams A, et al. Highland games: a benchmarking exercise in predicting biophysical and drug properties of monoclonal antibodies from amino acid sequences. Biotech & Bioengg. 2020;117(7):2100–15. doi:10.1002/bit.27349.
- Etha A, Thorsteinson N, Jmeian Y, Jeganathan A, Giblin P, Fransson J. Homology modeling and structure-based design improve hydrophobic interaction chromatography behavior of integrin binding antibodies. MAbs. 2018;10(6):890–900. doi:10.1080/19420862.2018.1475871.
- Lipinski CA, Lombardo F, Dominy BW, Feeney PJ. Experimental and computational approaches to estimate solubility and permeability in drug discovery and development settings1PII of original article: S0169-409X(96)00423-1. The article was originally published in advanced drug delivery reviews 23 (1997) 3–25.1. Advanced Drug Delivery Rev [Internet]. 2001;46:3–26. https://www.sciencedirect.com/science/article/pii/S0169409X00001290.
- Eisenberg D, McLachlan A. Solvation energy in protein folding and binding. Nature [Internet]. 1986;319(6050):199–203. doi:10.1038/319199a0.
- Black SD, Mould DR. Development of hydrophobicity parameters to analyze proteins which bear post- or cotranslational modifications. Analytical Biochem [Internet]. 1991;193(1):72–82. doi:10.1016/0003-2697(91)90045-U.
- Kyte J, Doolittle RF. A simple method for displaying the hydropathic character of a protein. J Molecul Biol [Internet]. 1982;157(1):105–32. doi:10.1016/0022-2836(82)90515-0.
- Jain T, Boland T, Lilov A, Burnina I, Brown M, Xu Y, Vásquez M, Valencia A. Prediction of delayed retention of antibodies in hydrophobic interaction chromatography from sequence using machine learning. Bioinformat [Internet]. 2017;33(23):3758–66. doi:10.1093/bioinformatics/btx519.
- Waibl F, Fernández-Quintero ML, Wedl FS, Kettenberger H, Georges G, Liedl KR. Comparison of hydrophobicity scales for predicting biophysical properties of antibodies. Front Mol Biosci. 2022;9. doi:10.3389/fmolb.2022.960194.
- Jaszczyszyn I, Bielska W, Gawlowski T, Dudzic P, Satława T, Kończak J, Wilman W, Janusz B, Wróbel S, Chomicz D, et al. Structural modeling of antibody variable regions using deep learning—progress and perspectives on drug discovery. Front Molecul Biosci [Internet]. 2023;10. https://www.frontiersin.org/articles/10.3389/fmolb.2023.1214424.
- Abanades B, Wong WK, Boyles F, Georges G, Bujotzek A, Deane CM. ImmuneBuilder: deep-learning models for predicting the structures of immune proteins. Commun Biol. 2023;6(1):575. doi:10.1038/s42003-023-04927-7.
- Ruffolo JA, Sulam J, Gray JJ. Antibody structure prediction using interpretable deep learning. Patterns [Internet]. 2022;3(2):100406. doi:10.1016/j.patter.2021.100406.
- Lee JH, Yadollahpour P, Watkins A, Frey NC, Leaver-Fay A, Ra S, Cho K, Gligorijevic V, Regev A, Bonneau R. EquiFold: protein structure prediction with a novel coarse-grained structure representation. bioRxiv. 2022. https://www.biorxiv.org/content/early/2022/10/08/2022.10.07.511322.
- Fernández-Quintero ML, Kokot J, Waibl F, Fischer ALM, Quoika PK, Deane CM, Liedl KR. Challenges in antibody structure prediction. MAbs. 2023;15(1):2175319. doi:10.1080/19420862.2023.2175319.
- Fernández-Quintero ML, Math BA, Loeffler JR, Liedl KR. Transitions of CDR-L3 loop canonical cluster conformations on the micro-to-millisecond timescale. Front Immunol. 2019;10. doi:10.3389/fimmu.2019.02652.
- Waibl F, Fernández-Quintero ML, Kamenik AS, Kraml J, Hofer F, Kettenberger H, Georges G, Liedl KR. Conformational ensembles of antibodies determine their hydrophobicity. Biophys J [Internet]. 2021;120(1):143–57. doi:10.1016/j.bpj.2020.11.010.
- Tucs A, Tsuda K, Sljoka A. Probing conformational dynamics of antibodies with geometric simulations. Methods Mol Biol. 2023;2552:125–39.
- Miao Y, Feher VA, McCammon JA. Gaussian accelerated molecular dynamics: unconstrained enhanced sampling and free energy calculation. J Chem Theory Comput. 2015;11(8):3584–95. doi:10.1021/acs.jctc.5b00436.
- Baker NA, Sept D, Joseph S, Holst MJ, McCammon JA. Electrostatics of nanosystems: application to microtubules and the ribosome. Proc Natl Acad Sci USA. 2001;98(18):10037–41. doi:10.1073/pnas.181342398.
- Wimley W, White S. Experimentally determined hydrophobicity scale for proteins at membrane interfaces. Nature Struct Molecul Biol. 1996;3(10):842–48. doi:10.1038/nsb1096-842.
- Salgado JC, Rapaport I, Asenjo JA. Predicting the behaviour of proteins in hydrophobic interaction chromatography: 2. Using a statistical description of their surface amino acid distribution. J Chromat [Internet]. 2006;1107(1–2):120–29. doi:10.1016/j.chroma.2005.12.033.
- Chari R, Jerath K, Badkar AV, Kalonia DS. Long- and short-range electrostatic interactions affect the rheology of highly concentrated antibody solutions. Pharm Res. 2009;26(12):2607–18. doi:10.1007/s11095-009-9975-2.
- Chaudhri A, Zarraga IE, Yadav S, Patapoff TW, Shire SJ, Voth GA. The role of amino acid sequence in the self-association of therapeutic monoclonal antibodies: insights from coarse-grained modeling. J Phys Chem B. 2013;117(5):1269–79. doi:10.1021/jp3108396.
- Yadav S, Laue TM, Kalonia DS, Singh SN, Shire SJ. The influence of charge distribution on self-association and viscosity behavior of monoclonal antibody solutions. Mol Pharm. 2012;9(4):791–802. doi:10.1021/mp200566k.
- Liu J, Nguyen MDH, Andya JD, Shire SJ. Reversible self-association increases the viscosity of a concentrated monoclonal antibody in aqueous solution. J Pharm Sci. 2005;94(9):1928–40. doi:10.1002/jps.20347.
- Cholpon Tilegenova C, Izadi S, Yin PJ, Huang CS, Wu J, Ellerman D, Hymowitz SG, Walters B, Salisbury C, Carter PJ. Dissecting the molecular basis of high viscosity of monospecific and bispecific IgG antibodies. MAbs. 2020;12(1):1692764. doi:10.1080/19420862.2019.1692764.
- Pin-Kuang Lai P-K, Gallegos A, Mody N, Sathish HA, Trout BL. Machine learning prediction of antibody aggregation and viscosity for high concentration formulation development of protein therapeutics. MAbs. 2022;14(1):2026208. doi:10.1080/19420862.2022.2026208.
- Jing Dai JZ, Izadi S, Zarzar PJ, Wu P, Oh A, Carter PJ. Variable domain mutational analysis to probe the molecular mechanisms of high viscosity of an IgG1 antibody. MAbs. 2024;16(1):2304282. doi:10.1080/19420862.2024.2304282.
- Apgar JR, Tam AS, Sorm R, Moesta S, King AC, Yang H, Kelleher K, Murphy D, D’Antona AM, Yan G, et al. Modeling and mitigation of high-concentration antibody viscosity through structure-based computer-aided protein design. PLOS ONE. 2020;15(5):15. doi:10.1371/journal.pone.0232713.
- Rai BK, Apgar JR, Bennett EM. Low-data interpretable deep learning prediction of antibody viscosity using a biophysically meaningful representation. Sci Rep. 2023;13(1). doi:10.1038/s41598-023-28841-4.
- Hötzel I, Theil F-P, Bernstein LJ, Prabhu S, Deng R, Quintana L, Lutman J, Sibia R, Chan P, Bumbaca D, et al. A strategy for risk mitigation of antibodies with fast clearance. MAbs. 2012;4(6):753–60. doi:10.4161/mabs.22189.
- Wu H, Pfarr DS, Johnson S, Brewah YA, Woods RM, Patel NK, White WI, Young JF, Kiener PA. Development of motavizumab, an ultra-potent antibody for the prevention of respiratory syncytial virus infection in the upper and lower respiratory tract. J Molecul Biol [Internet]. 2007;368(3):652–65. doi:10.1016/j.jmb.2007.02.024.
- Grinshpun B, Thorsteinson N, Pereira JN, Rippmann F, Nannemann D, Sood VD, Fomekong Nanfack Y. Identifying biophysical assays and in silico properties that enrich for slow clearance in clinical-stage therapeutic antibodies. MAbs. 2021;13(1). doi:10.1080/19420862.2021.1932230.
- Kraft TE, Richter WF, Emrich T, Knaupp A, Schuster M, Wolfert A, Kettenberger H. Heparin chromatography as an in vitro predictor for antibody clearance rate through pinocytosis. MAbs. 2020;12(1):1683432. doi:10.1080/19420862.2019.1683432.
- Thorsteinson N, Gunn JR, Kelly K, Long W, Labute P. Structure-based charge calculations for predicting isoelectric point, viscosity, clearance, and profiling antibody therapeutics. Mabs-austin. 2021;13(1):1981805. doi:10.1080/19420862.2021.1981805.
- Geng SB, Cheung JK, Narasimhan C, Shameem M, Tessier PM. Improving monoclonal antibody selection and engineering using measurements of colloidal protein interactions. J Pharmaceut Sci [Internet]. 2014;103(11):3356–63. doi:10.1002/jps.24130.
- Sormanni P, Aprile FA, Vendruscolo M. The CamSol method of rational design of protein mutants with enhanced solubility. J Molecul Biol [Internet]. 2015;427(2):478–90. doi:10.1016/j.jmb.2014.09.026.
- Estep P, Caffry I, Yu Y, Sun T, Cao Y, Lynaugh H, Jain T, Vásquez M, Tessier PM, Xu Y. An alternative assay to hydrophobic interaction chromatography for high-throughput characterization of monoclonal antibodies. MAbs. 2015;7(3):553–61. doi:10.1080/19420862.2015.1016694.
- Haverick M, Mengisen S, Shameem M, Ambrogelly A. Separation of mAbs molecular variants by analytical hydrophobic interaction chromatography HPLC: overview and applications. MAbs. 2014;6(4):852–58.
- Olsen TH, Boyles F, Deane CM. Observed antibody space: a diverse database of cleaned, annotated, and translated unpaired and paired antibody sequences. Protein Sci. 2022;31(1):141–46. doi:10.1002/pro.4205.
- Sievers SA, Scharf L, West AP, Bjorkman PJ. Antibody engineering for increased potency, breadth and half-life. Curr Opin HIV AIDS. 2015;10(3):151–59. doi:10.1097/COH.0000000000000148.
- Li L, Li C, Zhang Z, Alexov E. On the dielectric “constant” of proteins: smooth dielectric function for macromolecular modeling and its implementation in DelPhi. J Chem Theory Comput. 2013;9(4):2126–36. doi:10.1021/ct400065j.
- Vicatos S, Roca M, Warshel A. Effective approach for calculations of absolute stability of proteins using focused dielectric constants. Proteins: Struct, Funct, and Bioinfor [Internet]. 2009;77(3):670–84. doi:10.1002/prot.22481.
- Isom DG, Castañeda CA, Cannon BR, Velu PD, García-Moreno B. Charges in the hydrophobic interior of proteins. Proc Natl Acad Sci USA. 2010;107(37):16096–100. doi:10.1073/pnas.1004213107.
- Ahmed L, Gupta P, Martin KP, Scheer JM, Nixon AE, Kumar S. Intrinsic physicochemical profile of marketed antibody-based biotherapeutics. Proc Natl Acad Sci USA. 2021;118(37):e2020577118. doi:10.1073/pnas.2020577118.
- Raybould MIJ, Marks C, Lewis AP, Shi J, Bujotzek A, Taddese B, Deane CM. Thera-SAbDab: the therapeutic structural antibody database. Nucleic Acids Res [Internet]. 2020;48(D1):D383–8. doi:10.1093/nar/gkz827.
- Pindrus M, Shire SJ, Kelley RF, Demeule B, Wong R, Xu Y, Yadav S. Solubility challenges in high concentration monoclonal antibody formulations: relationship with amino acid sequence and intermolecular interactions. Mol Pharmaceut. 2015;12(11):3896–907. doi:10.1021/acs.molpharmaceut.5b00336.
- Leem J, Dunbar J, Georges G, Shi J, Deane CM. ABodyBuilder: automated antibody structure prediction with data–driven accuracy estimation. MAbs. 2016;8(7):1259–68. doi:10.1080/19420862.2016.1205773.
- Dolinsky TJ, Nielsen JE, McCammon JA, Baker NA. PDB2PQR: an automated pipeline for the setup of Poisson-Boltzmann electrostatics calculations. Nucleic Acids Res [Internet]. 2004;32(Web Server):W665–7. doi:10.1093/nar/gkh381.
- Wang J, Cieplak P, Kollman PA. How well does a restrained electrostatic potential (RESP) model perform in calculating conformational energies of organic and biological molecules? J Comput Chem. 2000;21(12):1049–74. https://onlinelibrary.wiley.com.
- Li H, Robertson AD, Jensen JH. Very fast empirical prediction and rationalization of protein pKa values. Proteins: Struct, Funct, and Bioinfor [Internet]. 2005;61(4):704–21. doi:10.1002/prot.20660.
- Maier JA, Martinez C, Kasavajhala K, Wickstrom L, Hauser KE, Simmerling C. ff14SB: Improving the accuracy of protein side chain and backbone parameters from ff99SB. J Chem Theory Comput. 2015;11(8):3696–713. doi:10.1021/acs.jctc.5b00255.
- Jorgensen WL, Chandrasekhar J, Madura JD, Impey RW, Klein ML. Comparison of simple potential functions for simulating liquid water. J Chem Phys [Internet]. 1983;79(2):926–35. doi:10.1063/1.445869.
- Hopkins CW, Le Grand S, Walker RC, Roitberg AE. Long-time-step molecular dynamics through hydrogen mass repartitioning. J Chem Theory Comput. 2015;11(4):1864–74. doi:10.1021/ct5010406.
- Case DA, Belfon K, Ben-Shalom IY, Brozell SR, Cerutti DS III, Cruzeiro TEC, Darden VWD, Duke TA, Giambasu RE, et al. Amber 2020. San Francisco: University of California; 2020.
- Grand S, Goetz AW, Walker RC. SPFP: speed without compromise - a mixed precision model for GPU accelerated molecular dynamics simulations. cpc. 2013;184:374–80.
- Darden T, York D, Pedersen L. Particle mesh Ewald: An N ⋅log(N) method for Ewald sums in large systems. J Chem Phys. 1993;98(12):10089–92. doi:10.1063/1.464397.
- Pastor RW, Brooks BR, Szabo A. An analysis of the accuracy of Langevin and molecular dynamics algorithms. Mol Phys. 1988;65(6):1409–19. doi:10.1080/00268978800101881.
- Decherchi S, Colmenares J, Catalano CE, Spagnuolo M, Alexov E, Rocchia W. Between algorithm and model: different molecular surface definitions for the Poisson-Boltzmann based electrostatic characterization of biomolecules in solution. Commun Comput Phys. 2013;13(1):61. doi:10.4208/cicp.050711.111111s.
- Dunbar J, Deane CM. ANARCI: antigen receptor numbering and receptor classification. Bioinformat [Internet]. 2016;32(2):298–300. doi:10.1093/bioinformatics/btv552.
- Shrake A, Rupley JA. Environment and exposure to solvent of protein atoms. Lysozyme and insulin. J Molecul Biol [Internet]. 1973;79(2):351–71. doi:10.1016/0022-2836(73)90011-9.
- Yang R, Tang Y, Zhang B, Lu X, Liu A, Zhang YT. High resolution separation of recombinant monoclonal antibodies by size-exclusion ultra-high performance liquid chromatography (SE-UHPLC). J Pharm Biomed Anal [Internet]. 2015;109:52–61. doi:10.1016/j.jpba.2015.02.032.
- Pedregosa F, Varoquaux G, Gramfort A, Michel V, Thirion B, Grisel O, Blondel M, Prettenhofer P, Weiss R, Dubourg V, et al. Scikit-learn: machine learning in python. J Mach Learn Res. 2011;12:2825–30.
- Virtanen P, Gommers R, Oliphant TE, Haberland M, Reddy T, Cournapeau D, Burovski E, Peterson P, Weckesser W, Bright J, et al. SciPy 1.0: fundamental algorithms for scientific computing in python. Nat Methods. 2020;17(3):261–72. doi:10.1038/s41592-019-0686-2.
- Ghose S, Tao Y, Conley L and Cecchini D. (2013). Purification of monoclonal antibodies by hydrophobic interaction chromatography under no-salt conditions. mAbs, 5(5), 795–800. 10.4161/mabs.25552