
 ?Mathematical formulae have been encoded as MathML and are displayed in this HTML version using MathJax in order to improve their display. Uncheck the box to turn MathJax off. This feature requires Javascript. Click on a formula to zoom.
ABSTRACT
Integrins are cell surface receptors that mediate the interactions of cells with their surroundings and play essential roles in cell adhesion, migration, and homeostasis. Eight of the 24 integrins bind to the tripeptide Arg-Gly-Asp (RGD) motif in their extracellular ligands, comprising the RGD-binding integrin subfamily. Despite similarity in recognizing the RGD motif and some redundancy, these integrins can selectively recognize RGD-containing ligands to fulfill specific functions in cellular processes. Antibodies against individual RGD-binding integrins are desirable for investigating their specific functions, and were selected here from a synthetic yeast-displayed Fab library. We discovered 11 antibodies that exhibit high specificity and affinity toward their target integrins, i.e. αVβ3, αVβ5, αVβ6, αVβ8, and α5β1. Of these, six are function-blocking antibodies and contain a ligand-mimetic R(G/L/T)D motif in their CDR3 sequences. We report antibody-binding specificity, kinetics, and binding affinity for purified integrin ectodomains, as well as intact integrins on the cell surface. We further used these antibodies to reveal binding preferences of the αV subunit for its 5 β-subunit partners: β6 = β8 > β3 > β1 = β5.
Introduction
Integrins are critical non-covalent heterodimeric cell surface receptors required for cell adhesion, migration, and signaling. They function as bidirectional signaling molecules by binding to extracellular ligands and intracellular adaptors to the actin cytoskeleton, which regulate integrin activation and downstream signalingCitation1–3. There are 24 known integrin heterodimer pairs formed by 18 α subunits and 8 β subunits. Eight are RGD-binding integrins that interact with the Arg-Gly-Asp (RGD) motif in extracellular ligands, thereby regulating diverse pathological processes.Citation4–10 αVβ1, αVβ3, αVβ5, and α5β1, expressed on endothelial cells and fibroblasts, bind to fibronectin among other ligands, and exhibit overlapping functions in cell spreading and migration.Citation11,Citation12 αVβ6 and αVβ8 promote transforming growth factor (TGF)-β activation subsequent to binding to RGD-like motifs in the TGF-β prodomain.Citation13 αIIbβ3 on platelets binds to fibrinogen, playing a critical role in hemostasis.Citation14 α8β1 binds to nephronectin in the extracellular matrix and regulates kidney development.Citation15
Integrins are important therapeutic targets, and so far four integrin antibodies are approved as therapeutics, including Tysabri (natalizumab), a function-blocking antibody for both integrins α4β1 and α4β7, for multiple sclerosis and Crohn’s disease; Entyvio (vedolizumab), targeting α4β7 for ulcerative colitis and Crohn’s disease, and Reopro (abciximab), an antigen-binding fragment (Fab) derived from an antibody targeting αIIbβ3 (also known as glycoprotein IIb/IIIa), for acute coronary syndrome and thrombotic cardiovascular events.Citation16 Additionally, efalizumab, an inhibitory antibody to LFA-1, was approved for the autoimmune skin condition psoriasis, but was subsequently withdrawn. αIIbβ3 is the only RGD-binding integrin targeted by an approved antibody therapeutic, despite the implication of multiple RGD-binding integrins in diverse pathological conditions, including cardiovascular disease, fibrosis, and cancer.Citation16
Monoclonal antibodies, peptidomimetics, and small molecule antagonists have been developed to explore the role of each integrin heterodimer in cellular processes and their potential usage as therapeutics.Citation17–19 However, the similar ligand-binding sites among RGD-binding integrin pairs, such as αVβ3 and αVβ55 and αVβ6 and αVβ8Citation8–10, pose a substantial challenge to the development of antibodies that selectively block the binding of small, RGD-like ligands. Moreover, due to evolutionary conservation of the ligand binding site in integrins across species, antibodies targeting integrins generated through immunization generally do not bind directly to the ligand-binding pocket. Structures of efalizumab, natalizumab, and vedolizumab show that they bind adjacent to, rather than in, the ligand-binding site, and clash by overlap of antibody constant domains or domains in the ligand adjacent to the integrin-binding domain; indeed, natalizumab inhibits noncompetitively.Citation20–22 In agreement, despite the large number of antibodies to RGD-binding integrins, the only antibodies known to block binding of small, RGD-like ligands are PAC-1, targeting αIIBβ3Citation23; mAb16, targeting α5β1Citation12,Citation19; and Biogen Ab5, targeting αVβ1Citation24. This highlights the urgent need to develop molecules for RGD-binding integrins to define the specific integrins that are important in key biological and pathological processes, unravel the distinctive biological functions of RGD-binding integrins, and expedite drug development.
Synthetic antibody librariesCitation23–25 have distinctive features that we hypothesized could be beneficial in obtaining function-blocking antibodies to integrins. In contrast to traditional species-specific monoclonal antibodies, synthetic libraries can be more effective for selecting antibodies targeting both human and mouse antigens, especially when aiming at highly conserved antigens across different species or conserved sites such as those for ligand binding. Yeast or phage Fab libraries are effective in generating antibodies toward highly conserved proteins, as they do not rely on the self-tolerance mechanisms of the immune system. These libraries typically encode a larger number of unique sequences than the number of B lymphocytes in laboratory animals. In addition, synthetic libraries offer other advantages, such as shorter turnaround times and greater scalability.
Yeast synthetic Fab libraries have the merits of enhanced protein quality control of eukaryotic cells and suitability for fluorescence-activated cell sorting (FACS) and magnetic-activated cell sorting (MACS) compared to phage libraries.Citation26 However, the key determinant for successful antibody selection from the yeast display platform is the availability of high-quality antigens. The ectodomains of membrane proteins such as integrins are glycosylated and disulfide-linked, requiring expression in mammalian cells. The Institute for Protein Innovation (IPI), a nonprofit organization, has established an antibody platform constructed around yeast display technology, enabling the discovery of antibodies with defined properties. To develop integrin-subtype specific and function-blocking antibodies, we collaborated to identify antibodies that specifically target RGD-binding integrins, including six antibodies containing R(G/T/L) D motifs in their complementarity-determining region (CDR)3 with inhibitory functions. Most function-blocking antibodies against integrins do not bind to the ligand-binding pocket and block only macromolecular ligand binding due to steric hindranceCitation4–20–Citation22–27,Citation28; in contrast, the antibodies described here are capable of blocking the binding of small molecule, peptidomimetic integrin inhibitors, as well as biological ligands. Several of these antibodies have previously been used to achieve integrin specificity in single molecule studies of integrin force exertion on RGD peptides.Citation12 To enable their use in integrin biology, and to study how particular assays, integrin ensemble composition, and avidity affect the behavior of these antibodies, we compared them in multiple assays. Eight of the antibodies are now being distributed by IPI in partnership with Addgene. As an example of one biological application, we used them to investigate the preference of the integrin αV subunit for pairing with the five different β subunits with which it associates and found a consistent preference hierarchy for αV-β pairing on the cell surface.
Results
Discovering integrin heterodimer-specific antibodies
To obtain antibodies to RGD-binding integrins, we used a synthetic yeast-displayed Fab library containing ~1010 unique Fab sequences. We selected for antibodies toward αVβ3, αVβ5, αVβ6, αVβ8, or α5β1 by enriching yeast clones displaying integrin-specific Fabs through MACS and FACS (Table S2). Selection steps included positive selection with target integrin ectodomains, negative selection with poly-specificity reagent (PSR) and untargeted integrins. After next-generation sequencing, the most frequent 13 sequences for each integrin target were expressed as human IgG1 for characterization (Methods and Ref. 12).
Initial screening assessed specificity toward intact human or mouse integrins expressed natively on K562 cells (human α5β1) or on stable K562 transfectants or on Expi293F αV−/α5− cell transient transfectants. Each antibody is named according to the integrin to which it was selected followed by a number. Immunofluorescent staining at 50 nM antibody concentration identified 11 antibodies selective for the target integrin (). Six antibodies contained an R(G/T/L) D motif in their heavy chain CDR3 (). We also evaluated the cross-reactivity of these antibodies on mouse integrins and found that 10 of 11 antibodies could bind to the target mouse integrin (); however, specificity toward mouse integrins was sometimes lower than for human integrins. This may be related to the lack of use of mouse antigens in selection or counter-selection. IPI-αVβ6.4, which contains an RTD motif, cross-reacts between αVβ6 and αVβ8 in both human and mouse (). This is interesting, as integrins αVβ6 and αVβ8 share specificity for TGF-β1 and β3 prodomain-growth factor complexes (proTGF-β). In summary, we obtained 11 antibodies that can specifically target one or two integrins, including αVβ3, αVβ5, αVβ6, αVβ8, and α5β1.
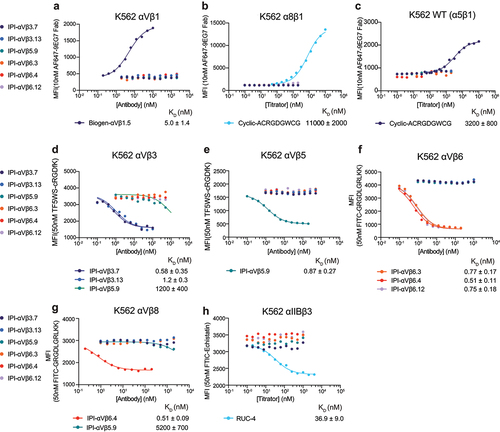
Figure 1. Integrin specificity of antibodies on all RGD-binding human and mouse integrin transfectants by indirect flow cytometry. (a) K562 stable human integrin transfectants in Ca2+/Mg2+. (b) Expi293 α5−/αV− cell transient human integrin transfectants in Ca2+/Mg2+. (c-g) Expi293 α5−/αV− cell transient mouse integrin transfectants in Ca2+/Mn2+. Immunostaining was performed with 50 nM IPI integrin antibody followed by washing and detection with APC-conjugated goat anti-human secondary antibodies and flow cytometry. MFI: mean fluorescence intensity.
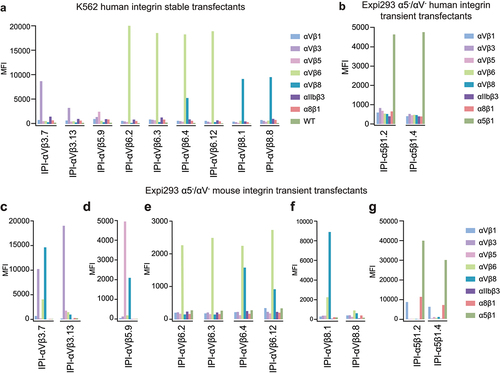
Table 1. IPI integrin antibody sequence.
To determine the EC50 in immunofluorescent staining, we titrated the antibodies on the K562 stable transfectants or WT K562, which expresses α5β1, using a secondary fluorescent anti-IgG (, ). For an antibody specific for αVβ1, we used sequence 5 from a Biogen patent,Citation29 which we designate Biogen-αVβ1.5. The EC50 values ranged from 0.2 to 6 nM.
Figure 2. Titration of antibodies on human RGD-binding integrin K562 stable transfectants by indirect flow cytometry. All antibodies were titrated against each transfectant in Ca2+/Mg2+ and immunostaining was as in . The mean fluorescent intensity (MFI) at each antibody concentration after subtraction of isotype control at the same concentration was fitted to a three-parameter dose–response curve for EC50, background MFI, and maximum MFI; curves are only shown for antibodies with meaningful staining. The errors for the EC50 values are the standard errors from the non-linear least square fits.
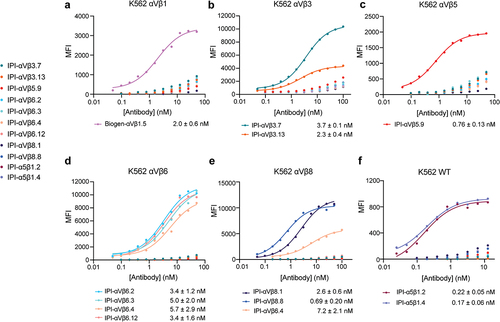
Table 2. Binding characteristics of IPI anti-integrin antibodies.
Binding kinetics and affinity measurement with surface plasmon resonance
To characterize the binding kinetics of the antibodies, we measured the binding of immobilized antibodies to the purified soluble ectodomains of all eight RGD-binding integrins by surface plasmon resonance (SPR) ( and Figure S1-S4). We found that all 11 antibodies exhibited high affinity for their respective target integrin subtypes, with affinities ranging from sub-nanomolar to two-digit nanomolar (Table S1). The dissociation rate constant (koff) values were in the range of 1•10−4 to 1•10−3s−1 with an average of 5.2•10−4 s−1.
Figure 3. Surface plasmon resonance (SPR) binding kinetics with soluble integrin ectodomains. (a-m). Antibodies were captured on the surface with anti-Fc. Integrins in 10 mM HEPES pH 7.5, 150 mM NaCl, 1 mM MgCl2, 1 mM CaCl2, 0.05% Tween 20, and 0.5 mg/mL BSA were used at 0.78, 1.56, 3.12, 6.25, and 12.50 nM. SPR sensorgrams (thick gray lines) at each ectodomain concentration were globally fitted with 1 vs 1 Langmuir binding model for the on- and off-rates, kon and koff. KD values were calculated as koff/kon. Values are reported as means with standard deviations from three independent regions of interest (ROIs).
Most antibodies, including the ones with RGD-like motifs, displayed remarkable selectivity toward the target integrin. Antibody IPI-αVβ6.4, which cross-reacts with mouse and human αVβ8, bound to αVβ8 with ~2-fold lower affinity than αVβ6 (). Other antibodies with RGD-like motifs cross-reacted with non-cognate integrins with >100-fold lower affinity (, , Figure S1C, S2A, S2C, S3A, and Table S1). Among the five non-RGD-containing antibodies, significant crossreactivity was found only for IPI-αVβ6.2, which bound to αVβ8 with 15-fold lower affinity than αVβ6 ( and Table S1).
Competitive binding assays with RGD-mimetic antibodies using soluble integrin ectodomains
Solid phase assays, such as SPR, offer advantages but may yield artifacts not present in solution phase assays. To address this, we used antibody competition with fluorescein isothiocyanate (FITC)-labeled peptidomimetic ligands in fluorescence polarization (FP), a solution phase assay. We used competition by ligand to test the hypothesis that antibodies with RGD-mimetic sequences in their heavy chain CDR3 bind to integrin ligand-binding sites. We measured the concentration-dependence of antibody competition with the binding of fixed concentrations of FITC-labeled, disulfide-cyclized ACRGDGWCG peptide (FITC-cyclic-ACRGDGWCG) or FITC-labeled GRGDLGRLKK peptide (FITC-proTGFβ3 peptide) to a fixed concentration of integrin ectodomain.
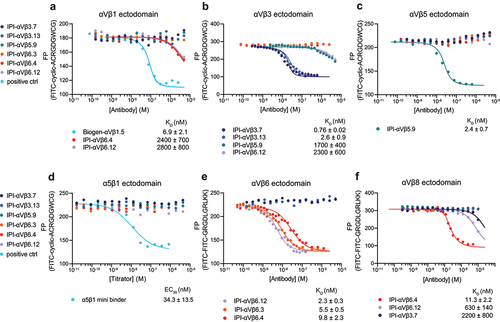
All six RGD-mimetic antibodies successfully competed with the FITC-cyclic-ACRGDGWCG or FITC-proTGFβ3 peptide ligands, demonstrating competition at the ligand-binding site (, , and Figure S5). Affinities for the target integrin ectodomains ranged from 0.7 to 11.3 nM. Competition by all antibodies with both peptide ligands revealed cross-reactivity among RGD-binding integrins for some RGD-mimetic antibodies, but with affinities hundreds to thousands of times lower than to the target integrins. For example, IPI-αVβ5.9 had 700-fold lower affinity for αVβ3 than αVβ5 (). IPI-αVβ6.12 bound to αVβ3 and αVβ8, with affinities 1000-fold and 300-fold lower, respectively, than to its target αVβ6 (). IPI-αVβ3.7 bound to αVβ8 with an affinity 3000-fold lower than to its target, αVβ3 (). Our findings demonstrate that RGD-mimetic antibodies effectively compete with peptide ligands at integrin ligand-binding sites, and that inhibition of ligand binding is a sensitive measure of cross-reactivity, confirming the potential of antibodies developed here for selective integrin targeting.
Figure 4. Binding affinities calculated from competition by RGD-mimetic antibodies of ectodomain binding to fluorescent RGD peptides using fluorescence polarization. (a-d) Competition of 10 nM FITC-cyclic-ACRGDGWCG binding to 200 nM αVβ1, 50 nM αVβ3, 50 nM αVβ5 or 100 nM α5β1. (e-f) Competition of 10 nM FITC-proTGFβ3 peptide binding to 10 nM αVβ6 or 200 nM αVβ8. Competitive antibody-binding curves were globally fittedCitation30 with the maximum FP value in the absence of antibody and the minimum FP value as global fitting parameters, and KD value for each antibody as individual fitting parameter (Methods). A reliable fit could not be obtained for the α5β1 minibinder and its EC50 value was calculated by fitting the curve with a three-parameter dose–response curve. Means and standard errors are from nonlinear least square fits.
The effect of avidity on apparent affinity of bivalent RGD-mimetic antibodies for cell surface integrins
Typical immunofluorescence flow cytometry, whether with a primary or secondary fluorescent antibody, is done with washing and is thus not an equilibrium measurement of affinity (e.g., ). True equilibrium measurements of binding of fluorescent ligands can be done by flow cytometry without washing but are challenging at concentrations above 100 nM because of the large excess of free ligand.Citation30 We worked around this limitation by measuring cell-bound fluorescence of a fixed concentration of a conformational reporter or RGD mimetic, while titrating in unlabeled IgG or Fab of RGD-mimetic antibodies.
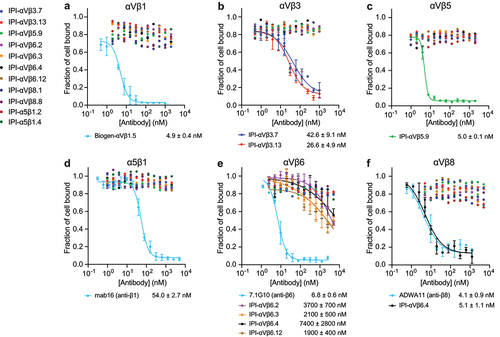
To characterize the equilibrium affinities and binding specificity, we first measured the binding affinity of each RGD-mimetic IgG for all the RGD-binding integrins on cell surfaces ( and Figure S6). Binding to β1 integrins was measured by the enhancement of binding of Alexa647 labeled 9EG7 Fab, which is specific for the extended states of β1 integrins. None of the six RGD-mimetic antibodies showed detectable binding to intact αVβ1, α8β1, or α5β1 up to 2 μM, while Biogen-αVβ1.5 and cRGD peptide served as positive controls (). Affinities for the other RGD-binding integrins were determined by competing with fluorescently labeled cRGDfK peptide for integrin αVβ3 and αVβ5, proTGF-β3 peptide for integrins αVβ6 and αVβ8, and echistatin for integrin αIIbβ3 (). All six RGD-mimetic antibodies exhibited high affinities ranging from 0.5 to 1.2 nM to the target cell surface integrin (). Selectivity was also very high, with no antibodies showing cross-reactivity except for IPI-αVβ5.9, which bound to αVβ3 and αVβ8 with 1.2 μM and 5.2 μM affinity, respectively ().
Figure 5. Binding affinities of RGD-mimetic antibodies for cell surface RGD-binding integrins by flow cytometry without washing. (a-c) Affinities on K562 stable transfectants or WT K562 cells were measured by enhancement of binding of 10nM AF647-9EG7 Fab. Cyclic-ACRGDGWCG and Biogen-αVβ1.5 were included as positive controls. Affinities and standard errors are from nonlinear least square fits of MFI values to a three-parameter dose–response curve. (d-h) Affinities on K562 stable transfectants were measured by competing fluorescently labeled RGD-mimetics. Affinities and standard errors are from nonlinear least square fits of MFI values to a three-parameter dose–response curve fitted individually (αVβ5 and αIIbβ3) or fitted globally (αVβ3, αVβ6 and αVβ8) with the minimum MFI and the maximum MFI as shared fitting parameters and EC50 for each titrator as individual fitting parameters. The KD value of each titrator was calculated from the EC50 value as KD = EC50/(1 + CL/KD,L), where CL is the concentration of the fluorescent peptidomimetic and KD,L is the binding affinity of the fluorescent peptidomimetic to the respective integrin ectodomain as referenced in methods. The errors for the affinities are the difference from the mean from duplicate experiments.
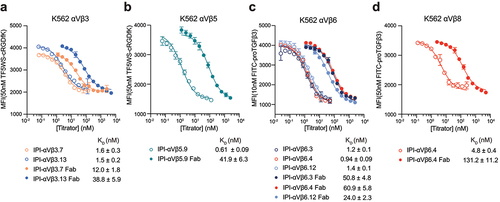
We next directly compared the affinities of IgG and Fab to demonstrate the potential avidity effect of IgG on cell surface integrins ( and ). For all six RGD-mimetic antibodies, IgG bound with higher affinity than Fab. IgG affinity was enhanced from a range of 7.5-fold for IPI-αVβ3.7 () to 60 to 70-fold for IPI-αVβ5.9 () and IPI-αVβ6.4 (). Notably, IPI-αVβ6.4 cross-reacts with αVβ8, with which it showed a lesser, 27-fold enhancement (). These results underscore the significant role of avidity effects in binding interactions between these antibodies and cell surface integrins.
Figure 6. Affinities of RGD-mimetic antibodies and their fab fragments for cell surface integrins on K562 stable transfectants. Experimental setup and data fitting were as described in .
Inhibition of integrin-mediated cell adhesion
We investigated the inhibitory function of all of our synthetic antibodies, including those lacking ligand-mimetic motifs, on cell adhesion to a fibronectin fragment (Fn3 domains 7–12) () or proTGF-β1 GARP complexes (). All six RGD-mimetic antibodies specifically inhibited integrin-mediated cell adhesion. Additionally, despite lacking a R(G/T/L)D motif, IPI-αVβ6.2 inhibited adhesion to proTGF-β1 GARP complexes ().
Figure 7. Inhibition of cell adhesion to ligands on substrates. Expi293 αV−/α5− KO cells transiently transfected with the indicated integrins were mixed with IPI anti-integrin antibodies and assayed for adhesion to ELISA plates coated with 30 nM fibronectin fragment (Fn3 7–12) (a-d) or with 10 nM GARP ectodomain/proTGFβ1 (e-f). After 1 hr at 37°C, the fluorescent intensity of mCherry, which was co-expressed with the transfected β-subunit using a self-cleaving P2A peptide, was recorded before and after washing away nonadherent cells. The fraction of cells bound at each antibody concentration was fitted individually or globally (if more than one antibody was fitted) to a four-parameter dose–response curve, with global fit to shared bottom and top and individual fit to IC50 and hill slope. Values are means and s.d. From triplicate measurements.
Most IPI antibodies inhibited adhesion of Expi293 αV−/α5− KO transfectants with IC50 values within ~10-fold of their affinities for cell surface integrins (). However, all four IPI antibodies to αVβ6 inhibited adhesion with far less potency, with IC50 values reduced ~1,000-fold relative to affinity, while the 7.1G10 antibodyCitation31 was far more potent (). In contrast, IPI-αVβ6.4, which cross-reacts with αVβ6 and αVβ8, inhibited αVβ8-dependent adhesion with 1,000-fold more potency than αVβ6-dependent adhesion, and was equipotent to ADWA11 antibody (). The reason for these differences is unclear. Nonetheless, our results show the distinct patterns of potency and specificity of the 11 synthetic antibodies on integrin-mediated cell adhesion.
Pairing preference of αV for the 5 β subunits
The integrin subtype-specific antibodies we characterized were then used to investigate whether the αV subunit preferentially associates during biosynthesis with certain of its 5 different β subunit pairing partners over others. To quantify expression, we used flow cytometry with fluorescently-labeled integrin heterodimer-specific antibodies. To correct for variation in binding and dissociation kinetics among the antibodies, we normalized the mean fluorescence intensity (MFI) of each antibody by the ratio of its MFI to the MFI of the αV subunit-specific antibody, 17E6 (Figure S7).
In preliminary experiments, we determined the optimal αV-β subunit plasmid transfection ratio for each αV heterodimer using Expi293 α5−/αV− KO cells to minimize endogenous integrin expression (Methods). The highest expression of αVβ3, αVβ6, and αVβ8 was achieved with 1:1 ratios of αV and β-subunit plasmids and of αVβ1 and αVβ5 with 1:3 ratios αV: β-subunit plasmids (Figure S7B, D, and E).
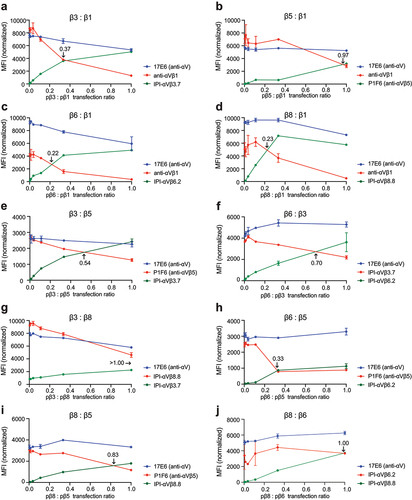
To determine the pairing preferences, we then used a fixed amount of αV plasmid and varying ratios of β-subunit plasmids ( and Methods). β1 and β5 were outcompeted by all other β-subunits and equally competed with one another (ratio of 0.97); therefore, αVβ1 and αVβ5 are the least favored heterodimers (). β3 outcompeted β1 and β5 () but in turn was outcompeted by β6 and β8 (). Finally, β6 and β8 competed equally with one another (). The “pecking order” was therefore αVβ6= αVβ8> αVβ3> αVβ1= αVβ5.
Figure 8. Competition between integrin β-subunits for the αV-subunit. (a-j.) MFI of directly fluorophore-labeled integrin antibodies measured by flow cytometry. In each competitive titration, the concentration of the αV-subunit plasmid (pαV) and one β-subunit plasmid remained constant at 0.6 µg (red line) while the other β-subunit plasmid (green line) was titrated until reaching 0.6 µg. The αV-subunit plasmid was 0.2 µg in a-e and h-i and 0.6 µg in f-g and j. in all reactions, empty vector plasmid was added to make the total plasmid concentration 1.8 µg. The ratio of the two β subunit plasmids at the cross point is indicated in each panel. The MFI of each β-subunit antibody was normalized relative to the MFI of the 17E6 αV antibody (Supplementary Figure S7).
Integrin αVβ1 heterodimer formation on other cell lines
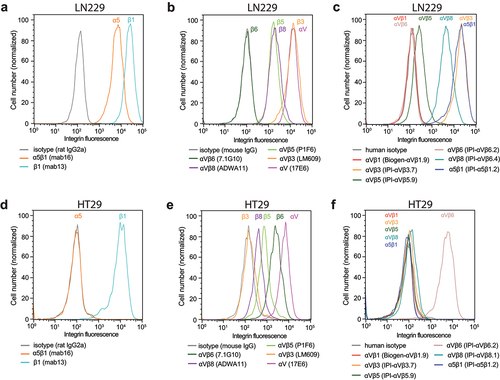
We extended comparisons among αV integrins to cell lines that express αVβ6 and αVβ8. Glioblastoma cell line LN229 expresses high levels of αV, β1, α5β1, and αVβ3, moderate levels of αVβ5 and αVβ8, no αVβ6, and no αVβ1 (). Colorectal adenocarcinoma cell line HT29 expresses high levels of αV and β1, high levels of αVβ6, moderate levels of αVβ5 and αVβ8, and no αVβ1, αVβ3, or α5β1 ().
Figure 9. Immunostaining of cell surface integrins on LN229 cells (a-c) and HT29 cells (d-f). Cells were stained with 50 nM of the indicated anti-integrin antibodies or isotype control antibodies in HBSS buffer containing 1 mM Ca2+ and 1 mM Mg2+ except for IPI-αVβ5.9 which used 1 mM Mn2+ and 0.2 mM Ca2+. After washing, integrin antibodies were detected using APC-conjugated goat anti-human secondary antibodies, Alexa Fluor 647 goat anti-rat IgG, or Alexa Fluor 647 goat anti-mouse F(ab’)2, and flow cytometry.
Discussion
We identified and characterized a suite of antibodies to human integrins, some of which also cross-react with mouse integrins, validated their use in competition with RGD mimetic ligands and in cell adhesion assays (), and demonstrated their utility in defining the β-subunit preference of the αV integrin subunit. Our data provide guidance for the future application of these antibodies, which are now being distributed in a partnership between IPI and Addgene (https://www.addgene.org/antibodies/protein-innovation/).
The majority of the antibodies (6 of the 11) block binding of small RGD mimetic ligands to their targeted integrin. Of the hundreds of previously described anti-integrin antibodies obtained by species-specific immunization, we know only a few with this characteristic: PAC-1, which has an RYD motifCitation32 and mAb16Citation12,Citation19, which has an RGD motif (unpublished). Although 8 integrins recognize RGD motifs, we have selected for antibodies that are remarkably integrin-specific.
IPI-αVβ3.13, with an RLD motif in CDR3, was completely specific for integrin αVβ3, both in human and mouse. A previously described antibody, LM609, is specific for human αVβ3, but does not cross-react with mouse αVβ3Citation29 and does not block binding of small RGD mimetics (unpublished). An artificial αVβ3-binding antibody, WOW-1, was created by replacing the CDR3 loop of PAC-1 antibody to αIIβ3 with a 50-residue adenovirus penton base sequence containing RGD.Citation33
IPI-αVβ6.4, with an RTDIPVY motif in CDR3, crossreacts between αVβ6 and αVβ8 with similar affinity. Interestingly, αVβ6 and αVβ8 recognize a RGDLXXL/I motif in their ligands proTGF-β1 and β3 and a peptide binding to αVβ6 was previously isolated by phage display with the sequence RTDLDSL.Citation34 The LXXL/I motif forms an amphipathic helix that binds with its hydrophobic face to the β6 and β8 subunit in αV integrin complexes.Citation8,Citation10,Citation35 The RTDIPVY motif in IPI-αVβ6.4 conserves the positions of hydrophobic residues found in proTGF-β1 and β3 and conserves both the RTD motif and the positions of hydrophobic residues in the peptide identified by phage display. Furthermore, IPI-αVβ6.4 mimics the biology of proTGF-β1 and β3 by cross-reacting between αVβ6 and αVβ8.
The other four antibodies, all with RGD sequences, bound with low nanomolar affinities to their target integrins and showed greater than 100-fold higher affinity for the target than for any other integrin (). Specificity of the six antibodies with RGD-like motifs is likely to be imparted by binding to regions outside of the RGD-binding pocket, as well as by the presence of an RTD or RLD sequence in place of RGD in two of them. These antibodies will have many applications in the integrin field as ligand-binding blocking reagents, including the antibodies that show cross-reactivity, because we have defined their KD and EC50 values (). Using these values, the percentage of bound integrin equals .
As an example of the gaps our antibodies can fill, we know of no previously defined inhibitory αVβ5 antibody. Using IPI-αVβ5.9 IgG at 8.7 nM (10× its KD for competing binding of a ligand to cell surface αVβ5) would inhibit 90% of ligand binding to αVβ5 while inhibiting <1% of binding to cell surface αVβ3 or αVβ8. Furthermore, using it at 50 nM (10× its IC50 for inhibiting cell adhesion) essentially completely blocks all αVβ5-dependent adhesion.
The EC50, IC50, and KD values in show several trends. By competing RGD mimetic binding, affinities of IgG for the ectodomain are higher than affinities of Fab for the intact integrin on cell surface. Both measure monomeric interactions. Measurements using biological ligands for integrin α5β1 and α4β1 show the same trend; ensemble affinities are lower for cell surface integrins because their content of the high affinity extended-open conformation is lower than for ectodomain preparations.Citation30,Citation36 On the other hand, the IgG affinities for ectodomain determined with SPR and competitive binding with RGD-mimetics agree well with one another. This agreement demonstrates the reliability of our reported affinities. Yet another comparison, of IgG and Fab binding to the integrin ligand-binding site on the cell surface, shows the difference between bivalent and monomeric binding. Direct comparisons in show a 20- to 60-fold increase in effective affinity for IgG. A caveat is that these measurements are based on overexpressing transfectants, and IgG affinity is lower at lower integrin expression levels. Limited data from staining tumor cell lines show that immunostaining EC50 values are cell line-dependent (Figure S8). Mn2+ can substantially increase integrin affinity for ligand and can enhance immunostaining of the RGD mimetic antibodies (Figure S8E). Among the assays for cross-reactivity, competition assays were the most sensitive because a single concentration of FITC-labeled RGD mimetic is used and the competitor can cover a broader range of concentrations. In contrast, in immunostaining and SPR, the background signal increases with the concentration of the antibody or antigen, respectively.
The αV subunit is unique among integrin α subunits in associating with five different β subunits, three of which, β5, β6, and β8, associate only with αV. Pair-wise competition between β-subunits revealed the order of preference to be αVβ6= αVβ8> αVβ3> αVβ1= αVβ5. A limitation is that, although we used cDNAs with native β-subunit nucleotide sequences, all expressed in the same vector, we assumed β-subunit precursor expression was identical. However, we verified the same trend in several native tumor cell lines. Previously, we found that the BJ-5a fibroblast cell line expresses integrins α5β1, αVβ1, αVβ3, and αVβ5Citation12. Additional cell lines studied here show that, even when αV and β1 subunits are abundant, αVβ1 is not expressed when the more dominant αVβ3 and αVβ8 (LN229) or αVβ6 integrins (HT29) are expressed. However, both cell types expressed αVβ5, which appears to compete similarly to αVβ1 for the αV subunit in transfectants. Expression of αVβ5 but not αVβ1 by these cells suggests that the αV subunit of αVβ1 also competes poorly for the β1 subunit with the other 11 α-subunits that associate with β1. In zebrafish integrins, a trend similar to that seen here was found in which αV associated less well with the β1-subunit than with the β3, β5, and β6-subunits.Citation37 During divergence among integrin orthologues in vertebrate evolution, both the αV and β1 subunits were challenged with retaining association with a larger number of β and α-subunits than any other integrin subunit. Nonetheless, our data suggest that the β1 subunit competes as effectively as β5 for αV in transfectants, despite the ability of the β1 and β5-subunits to associate with a total of 12 and 1 α-subunits, respectively.
Materials and methods
Expression of full-length integrin on the cell surface
cDNA encoding native integrin α and β-subunits from GenScript (gene and accession No. are: hITGAV, NM_002210.5; hITGB1, NM_002211.3; hITGB3, NM_000212.3; hITGB5, NM_002213.5; hITGB6, NM_000888.5; hITGB8, NM_002214.3; hITGA2B, NM_000419.5; mITGA2B, NM_010575; mITGB8, NM_177290.3) and Sino Biological (gene and accession No. are: hITGA8, NM_003638.1; hITGA5, NM_002205.2; mITGAV, NM_008402.2; mITGA5, NM_010577.2; mITGB1, NM_010578.1; mITGB3, NM_016780.2; mITGB5, NM_010580.2;
mITGB6, NM_021359.2; mITGA8, NM_001001309.2) were amplified by PCR and inserted into the pD2529 CAG vector (ATUM). The native signal sequence was replaced with an N-terminal CD33 secretion peptide (MPLLLLLPLLWAGALA), followed by full-length sequence. For mouse α-subunits only, the full-length sequence was followed by a P2A sequence (ATNFSLLKQAGDVEENPGP) and GFP. All β-subunit full-length constructs were followed by a P2A sequence and mCherry. The α and β cDNAs were transiently transfected into Expi293 α5−/αV− cellsCitation38 using FectoPro (Polyplus) according to the manufacturer’s instructions. After 24 hr of transfection, 3 mM valproic acid and 4 g/L of glucose were added. Cells were used 48 hr after transfection.
Expression and purification of integrin ectodomains
Ectodomains utilized the same full length sequences, truncated before the transmembrane domain. The α-subunit ectodomain sequence was followed by a HRV3C cleavage site (LEVLFQG), acid coil (AQCEKELQALEKENAQLEWELQALEKELAQ), Protein C tag (EDQVDPRLIDGK), and Strep twin tag (SAWSHPQFEKGGGSGGGGGSAWSHPQFEK). The β-subunit ectodomain was followed by HRV3C cleavage site, basic coil (AQCKKKLQALKKKNAQLKWKLQALKKKLAQ), hemagglutinin (HA) tag (YPYDVPDYA), deca-histidine tag, P2A sequence, and mCherry. 7 days after transfection and supplementation as described above, supernatants were harvested and purified using His-Tag purification resin (Roche, cOmpelteTM, Cat No.5893682001), followed by size-exclusion chromatography either directly following affinity purification (clasped ectodomain) or after HRV3C digestion (unclasped ectodomain) in 20 mM HEPES or Tris pH 8, 150 mM NaCl, 1 mM CaCl2, and 1 mM MgCl2 (GE Healthcare, AKTA purifier, Superdex 200). The purified integrin ectodomains were concentrated to ~1 mg/mL, flash frozen in liquid nitrogen and stored at −80°C.
Synthetic yeast fab library from IPI
The synthetic Fab library, containing approximately 1010 unique Fab sequences, was displayed on the surface of Saccharomyces cerevisiae yeast cells. The Fabs are displayed using the α-agglutinin system, where the Aga1 protein is attached to the cell wall by a glycosylphosphatidylinositol (GPI) anchor and is disulfide-linked to the Aga2 protein during biosynthesis. The heavy chain (VH-CH) of the Fab is fused to the Aga2 subunit on the yeast cell membrane, while the light chain (VL-CL) noncovalently associates with the heavy chain during biosynthesis in the yeast endoplasmic reticulum to form the Fab.Citation39 The Aga2 was tagged with a V5 tag, and the VL chain had a C-terminal Myc tag, both of which were used for the detection of Fab expression in the screening process.
For library construction, six variable heavy chain (VH) and three variable light chain (VL) genes were used, resulting in a total of 18 VH/VL pairs. These V genes were selected based on their high-frequency occurrence in human memory compartments and favorable reported properties.Citation40,Citation41 Germline sequences were used for CDR1 and CDR2 in VH and VL, while CDR3-H was designed with a length ranging from 10 to 20 residues to mimic the natural distribution found in the human memory repertoire. To generate diversity in the amino acid sequence of CDR-H3, trinucleotide mixtures matched the frequency of amino acids encoded in the non-templated CDR3-H3 region from the human repertoire excluding cysteines and methionines, with loop lengths of 13, 14, and 15 residues. The synthesized CDR-H3 nucleotides were co-electroporated with plasmids encoding VH-CH1-Aga2 enzyme-digested to remove CDR3 into the yeast, for ligation by homologous recombination in vivo. Yeast with recombined VH-CH1-Aga2 plasmids were subsequently separately electroporated with three plasmids encoding VL chains, VK1–39, VK3–15, and VL1–51, each containing a CDR3-L sequence representing the most common VJ rearrangement in native B cells.
Selecting integrin selective antibodies
We screened for integrin heterodimer-specific antibodies from the yeast-displayed Fab library with two rounds of MACS and five rounds of FACS. The sorting buffer used in MACS and FACS is 20 mM HEPES, pH7.5, 150 mM NaCl, 2 mM Ca2+, 2 mM Mg2+, 0.1% bovine serum albumin (BSA) and 0.2% maltose.
In the first MACS selection (MACS1), 25 pmol of each biotinylated unclasped integrin ectodomain, including αVβ3, αVβ5, αVβ6, αVβ8 and α5β1, were separately incubated with 100 µL streptavidin magnetic beads (SuperMag Streptavidin Beads, 50 nm, Ocean Nanotech), in 1 mL sorting buffer, at 4°C for 1 hr. Beads coupled to each integrin were added one-by-one to the induced yeast cells (2.5× 10¹¹ induced cells, ~25-fold of the IPI Fab library diversity), incubated overnight at 4°C on rotor, and the library was subjected to automated MACS. Yeast recovered from MACS1 were expanded and induced for the second MACS selection (MACS2). After negative selection against the streptavidin magnetic beads, cells were split into five aliquots of 1 × 10⁹ cells each and again selected with a single biotinylated integrin prebound magnetic bead in MACS2. Two rounds of MACS yielded five integrin heterodimer enriched Fab libraries, each with <105 diversity and enabled further enrichment by FACS.
Each integrin heterodimer enriched Fab library was next subjected to five alternating rounds of positive selection with target integrin ectodomains (FACS1 and FACS3), with PSR, i.e., biotinylated detergent lysate of baculovirus-infected Sf9 membrane proteins (FACS2), and negative selection against ectodomains of the other 7 untargeted RGD-binding integrins (FACS4 and FACS5) (Table S2). For example, with αVβ3 integrin, in FACS1 and FACS3, cells were labeled with 100 nM biotinylated unclasped integrin αVβ3 ectodomain. In FACS2, cells were labeled with 100 nM biotinylated PSR reagents. In FACS4 and FACS5, cells were labeled with 100 nM biotinylated unclasped integrin αVβ3 ectodomain and 100 nM each of αVβ1, αVβ5, αVβ6, αVβ8, α5β1, α8β1 and αIIbβ3 ectodomain in unbiotinylated clasped form using PE-labeled streptavidin and Alexa Fluor 647 labeled 12CA5 antibody to the C terminal HA tag, and selected positively for biotin and negatively for the HA tag.
The top-ranked sequences from next-generation sequencing after FACS5 were down-selected to 13 for DNA synthesis and recombinant expression as IgG1 in Expi293F cells.
K562 stable transfectants expressing full-length RGD-binding integrins
For αVβ1, αVβ3, αVβ5, αVβ6, and αVβ8, αIIbβ3, and α8β1 transfectants, the appropriate full-length plasmids described above were electroporated into K562 cells, which express α5β1 as the sole RGD-binding integrin. Transfectants were selected with 3 µg/mL puromycin. αV transfectants were further FACS sorted using Alexa488-17E6 (anti-αV) and mCherry. α8β1 and αIIbβ3 transfectants were further FACS sorted using mCherry.
Kinetic measurements using SPR
High-throughput SPR binding kinetics experiments used a Carterra LSA instrument with an HC-30 M chip (Carterra-bio, catalog#4279) with a 384-ligand array format. The experiment was set up according to Carterra’s standard protocol. Briefly, antibodies were captured using immobilized goat anti-human IgG Fc secondary antibody (Jackson ImmunoResearch Laboratories, catalog#109-005-098). A two-fold dilution series ranging from 0.07825 nM to 12.5 nM of purified integrin ectodomains as analyte in 10 mM HEPES (pH 7.5), 150 mM NaCl, 1 mM MgCl2, 1 mM CaCl2, 0.05% Tween 20, and 0.5 mg/mL BSA was sequentially injected (capture kinetics). After each 5 min association phase and 5 min dissociation phase, the association phase for the next highest concentration began.
Instrument software was used to subtract the reference cell background and for Y-alignment. Data were then globally fitted with two equations in Prism with shared kon , koff , and Rmax:
For the association phase, when t (time) is smaller than td (dissociation start time):
For the dissociation phase, when t (time) is larger than td (dissociation start time):
where Rt is the observed response at time t, [A] is the analyte concentration, koff is the off-rate and kon is the on-rate, Rmax is the maximal SPR response. Rmax is a fitting parameter defined using the targeted integrin analyte for each integrin antibody and is used globally with all other integrin analytes binding to that antibody. t0 is the fitted start time of each cycle and is used to calculate the initial response units at the beginning of each new association phase. R0 is Rt at t=td.
Prism input is as follows:
ligand = HotNM *1e − 9
Kob = [ligand]*Kon + Koff
KD = Koff/Kon
Eq = Bmax*ligand/(ligand + KD)
Association = Eq*(1 − exp(−1*Kob*(X − t0)))
YatTime0 = Eq*(1 − exp(−1*Kob*Time0))
Dissociation = YatTime0*exp(−1*Koff*(X − t0 − Time0))
Y = IF(X < Time0, Association, Dissociation) + NS
X: Time
Y: Total binding
Koff: Dissociation constant in inverse time units.
Kon: Association constant in inverse time multiplied by inverse concentration.
KD: Computed from Koff/Kon, in Molar units.
t0 is used to correct for the experiment start time and to compensate for the initial response units due to the previous binding cycle.
Bmax: Maximum binding at equilibrium with maximum concentration of analyte, in units of Y axis.
HotNM (the concentration of analyte in nM)
Time0 (the time at which dissociation was initiated).
NS = 0.
Antibodies and fluorescent labeling
Antibodies were 17E6 (anti-αV),Citation17 mab16 (anti-α5),Citation19 mab13 (anti-β1),Citation19 LM609 (anti-αVβ3),Citation27 7.1G10 (anti-αVβ6),Citation42 ADWA11 (anti-αVβ8),Citation43 and Biogen-αVβ1.Ab5 (anti-αVβ1) SEQ ID NO:35Citation24.
Alexa Fluor 647 NHS Ester (Thermo Fisher Scientific, A20006) was used to directly label integrin antibodies following the manufacturer’s protocol. Briefly, 1 mg of antibody (5 mg/mL) was incubated with 10 μg of Alexa Fluor 647 NHS Ester (10 μg/μL in DMSO) in phosphate-buffered saline (PBS) pH 7.4 at room temperature for 1 hr in the dark. Unconjugated dye was removed by size-exclusion chromatography (GE Healthcare, AKTA purifier, Superdex 200). IgG concentration was calculated as:
The dye ratio was calculated as
Indirect immunofluorescent flow cytometry
K562 stable transfectants expressing human RGD-binding integrins or K562 WT cells endogenously expressing α5β1 or Expi293F α5−/αV− mouse integrin transfectants (106 cells/mL) were incubated with the indicated concentration of antibodies in Hanks’ balanced salt solution (HBSS) with 20 mM HEPES pH 7.4, 1% BSA, 1 mM Ca2+, and 1 mM Mg2+ (or 1 mM Mn2+ when indicated) for 1 hr on ice followed by three washes. Cells were then stained with APC-conjugated goat anti-human IgG (Jackson ImmunoResearch, Catalog 109-135-098) at a 1:150 dilution, followed by three washes, and subjected to FACS (BD FACSCanto II). The background mean fluorescence intensity (MFI) was determined using a human IgG1 isotype control (Bioxcell #BE0297) at the same concentration as the primary antibodies. Data analysis used FlowJo (Version 10.7.1).
LN229 (ATCC CRL-2611) and HT29 (ATCC HTB-38) cells were stained identically with first antibodies at 50 nM, except for rat and mouse antibodies, Alexa Fluor 647 goat anti-rat IgG (Invitrogen, catalog A-21247) at 2 μg/mL and Alexa Fluor 647 goat anti-mouse F(ab’)2 (Invitrogen, catalog A-21237) at 2 μg/mL were used, respectively. Background MFI was determined using rat IgG2a, BD Catalog 553933 and mouse IgG, clone X63; human IgG Bioxcell #BE0297.
Fluorescence polarization
FITC-labeled aminocaproic acid-disulfide-cyclized ACRGDGWCG peptide (FITC-cyclic-ACRGDGWCG) and FITC-labeled aminocaproic acid-GRGDLGRLKK peptide (FITC-proTGFβ3 peptide) were synthesized by GenScript. Preliminary experiments (Supplementary Figure S5) were with 10 nM of FITC-labeled peptide probe and indicated integrin ectodomain concentrations in 10 mM HEPES pH 7.5, 150 mM NaCl, 1 mM MgCl2, 1 mM CaCl2, and 0.5 mg/mL BSA (10 µL). The mixture was allowed to equilibrate for 2 hr in the dark and the FP signal was measured by the Synergy NEO HTS multi-mode microplate reader (Biotek). The background FP signal was measured by supplementing the reaction with 10 mM EDTA. Affinities were obtained by fitting the curve to previously published equationsCitation30 (Supplementary Equation S17 in the reference).
For the competition assays, samples (10 µL) contained 10 nM FITC-cyclic-ACRGDGWCG or FITC-proTGFβ3 peptide, integrin ectodomain, and antibodies at indicated concentrations in the same buffer and condition as described above. Data were fitted globally using previously developed equationsCitation30 (Supplementary Equation S28 in the reference), with the maximum FP value in the absence of antibody and the minimum FP value as shared parameters, and affinities for each titrator as individual parameters. The α5β1 minibinder was as described.Citation44
IgG and fab binding to integrin ligand-binding sites on the cell surface
The affinity of antibodies to integrins αVβ1 and α8β1 expressed on K562 stable transfectants, as well as α5β1 expressed on K562 wild-type cells, was measured by enhancement of binding of 10 nM AF647-9EG7 Fab. Cells (105 in 100 µL) were mixed with 10 nM AF647-9EG7 Fab and indicated concentrations of antibodies or cyclic-ACRGDGWCG in L15 medium containing 1% BSA for 2 hr at room temperature. Flow cytometry was without washing to ensure that values were obtained under equilibrium conditions. The MFI values of AF647-9EG7 Fab in the presence of various concentrations of titrators on each cell line were fitted by a three-parameter dose-response curve. The errors for the affinities are the difference from the mean value from duplicate experiments.
To determine the affinity of FITC-proTGFβ3 peptide to αVβ6 and αVβ8 on the K562 cell surface (Figure S6), 100 µL of cells (106/mL) were mixed with indicated concentrations of FITC-proTGFβ3 peptide in L15 medium containing 1% BSA for 2 hr at room temperature and subjected to flow cytometry without washing. Background fluorescence was measured with 10 mM EDTA in the binding buffer. The background-subtracted MFI at each concentration of FITC-proTGFβ3 peptide was fitted to a three-parameter dose–response curve for KD, background MFI, and maximum MFI.
The affinities of cRGDfk peptide with lysine side chain conjugated to TideFluor5WS (TF5WS-cRGDfk) to αVβ3 (KD = 57 ± 6 nM) and αVβ5 (KD = 51 ± 8 nM) on cell surface were previously determined.Citation12 The binding affinity of FITC labeled Echistatin (FITC-Echistatin) to αIIbβ3 (KD = 248 ± 14 nM) was previously quantified.Citation38
IgG and Fab affinities for intact αVβ3, αVβ5, αVβ6, αVβ8, and αIIbβ3 on K562 stable transfectants were measured by competing fluorescently labeled RGD-containing peptidomimetics. Cells (106/mL in 100 µL) were mixed with the indicated probe and antibody concentration in L15 medium with 1% BSA. After 2 hr in the dark at room temperature to ensure equilibrium, cells were subjected to FACS.
Cell adhesion assays
50 µL of ligands in PBS (pH 7.4) were coated to ELISA high-binding 96-well plates (Corning, REF 3590) at 4°C for 16 hr. Plates were washed and blocked for 1 hr at 37°C with PBS containing 3% BSA. Integrin transfectants in L15 medium (106 cells/mL in 50 µL) were mixed with antibodies in 50 µL in L15 medium and added to the wells. After 1 hr at 37°C, the fluorescent intensity of mCherry, which was co-expressed with the transfected β-subunit through self-cleaving P2A peptide (Methods, section 2), was detected at 625 nm using Biotek Synergy NEO HTS multi-mode microplate reader. After three washes by gently removing the L15 medium and replenishment with 100 µL of L15 medium, the plate was read again to obtain the fraction of cells bound. For αVβ6 and αVβ8 transfectants, cells, and antibodies were pre-incubated for 1 hr and 37°C, before adding to wells.
Competition between integrin β-subunits for the αV-subunit
Integrin α and β-subunits were transfected as described above, for cell surface expression using 1.8 μg plasmid per 1.8 mL of cells (3×10⁶/mL). The experiments are described in detail in Supplementary Figure S7 and Figure S8.
Expi293F α5−/αV− transfectants (5 × 10⁴ in 50 µL) were stained with directly Alexa 647-labeled integrin antibodies at 100 nM or Alex647-labeled 17E6 anti-αV at 40 nM in Hanks’ balanced salt solution, 20 mM HEPES, 1 mM Ca2+, 1 mM Mg2+ and 1% BSA on ice for 1 hr and subjected to FACS after three washes.
Background was measured using Alexa 647-labeled human natalizumab (anti-α4) for human antibodies or Alexa 647-labeled mouse IgG1 (clone X63 isotype control) for 17E6 anti-αV and P1F6 (anti-β5). The specific MFI reported in Figure S7 was background corrected as:
Due to variations in kinetics among different antibodies, the specific MFI cannot be directly compared between each integrin β-subunit antibody. To enable a direct comparison, a coefficient was calculated to adjust each β-subunit antibody MFI value relative to the MFI value of the 17E6 αV antibody using the equation:
The calculated coefficient for each β-subunit antibody is indicated on each panel in Figure S7. The MFI for each integrin shown in is calculated as:
S4 SPR-4.eps
Download EPS Image (8.8 MB)S2 SPR-2.eps
Download EPS Image (11.9 MB)S7 av vs b subunit tiration.eps
Download EPS Image (2.3 MB)Supplement T1 SPR table.docx
Download MS Word (29.4 KB)S1 SPR-1.eps
Download EPS Image (12.4 MB)Supplement T2.docx
Download MS Word (19.8 KB)S6 proTGFb3 kd on avb6 and avb8 on cell surface.eps
Download EPS Image (2.3 MB)S3 SPR-3.eps
Download EPS Image (12.2 MB)S8 cancer cell line EC50.eps
Download EPS Image (2.1 MB)S5 FP probe kd.eps
Download EPS Image (2.5 MB)Disclosure statement
No potential conflict of interest was reported by the author(s).
Supplementary material
Supplemental data for this article can be accessed online at https://doi.org/10.1080/19420862.2024.2365891
Additional information
Funding
References
- Campbell ID, Humphries MJ. Integrin structure, activation, and interactions. Cold Spring Harb Perspect Biol. 2011;3(3):a004994–16. doi:10.1101/cshperspect.a004994. PMID: 21421922.
- Springer TA, Dustin ML. Integrin inside-out signaling and the immunological synapse. Curr Opin Cell Biol. 2012;24:107–15. doi:10.1016/j.ceb.2011.10.004. PMID: 22129583.
- Luo BH, Carman CV, Springer TA. Structural basis of integrin regulation and signaling. Annu Rev Immunol. 2007;25(1):619–47. doi:10.1146/annurev.immunol.25.022106.141618. PMID: 17201681.
- Xiao T, Takagi J, Coller BS, Wang JH, Springer TA. Structural basis for allostery in integrins and binding to fibrinogen-mimetic therapeutics. Nature. 2004;432(7013):59–67. doi:10.1038/nature02976. PMID: 15378069.
- Xiong JP, Stehle T, Zhang R, Joachimiak A, Frech M, Goodman SL, Arnaout MA. Crystal structure of the extracellular segment of integrin αVβ3 in complex with an Arg-Gly-Asp ligand. Science. 2002;296(5565):151–55. doi:10.1126/science.1069040. PMID: 11884718.
- Nagae M, Re S, Mihara E, Nogi T, Sugita Y, Takagi J. Crystal structure of α5β1 integrin ectodomain: atomic details of the fibronectin receptor. J Cell Biol. 2012;197:131–40. doi:10.1083/jcb.201111077. PMID: 22451694.
- Schumacher S, Dedden D, Nunez RV, Matoba K, Takagi J, Biertumpfel C, Mizuno N. Structural insights into integrin α5β1 opening by fibronectin ligand. Sci Adv. 2021;7(19):eabe9716. doi:10.1126/sciadv.abe9716. PMID: 33962943.
- Dong X, Hudson NE, Lu C, Springer TA. Structural determinants of integrin β-subunit specificity for latent TGF-β. Nat Struct Molecul Biol. 2014;21(12):1091–96. doi:10.1038/nsmb.2905. PMID: 25383667.
- Roy A, Shi L, Chang A, Dong X, Fernandez A, Kraft JC, Li J, Le VQ, Winegar RV, Cherf GM, et al. De novo design of highly selective miniprotein inhibitors of integrins αvβ6 and αvβ8. Nat Commun. 2023;14(1):5660. doi:10.1038/s41467-023-41272-z. PMID: 37704610.
- Wang J, Su Y, Iacob RE, Engen JR, Springer TA. General structural features that regulate integrin affinity revealed by atypical αVβ8. Nat Commun. 2019;10(1):5481. doi:10.1038/s41467-019-13248-5. PMID: 31792290.
- Bouvard D, Brakebusch C, Gustafsson E, Aszodi A, Bengtsson T, Berna A, Fassler R. Functional consequences of integrin gene mutations in mice. Circ Res. 2001;89(3):211–23. doi:10.1161/hh1501.094874. PMID: 11485971.
- Jo MH, Li J, Jaumouille V, Hao Y, Coppola J, Yan J, Waterman CM, Springer TA, Ha T. Single-molecule characterization of subtype-specific β1 integrin mechanics. Nat Commun. 2022;13(1):7471. doi:10.1038/s41467-022-35173-w. PMID: 36463259.
- Sheppard D. Roles of αv integrins in vascular biology and pulmonary pathology. Curr Opin Cell Biol. 2004;16:552–57. doi:10.1016/j.ceb.2004.06.017. PMID: 15363806.
- Coller BS, Shattil SJ. The GPIIb/IIIa (integrin αIIbβ3) odyssey: a technology-driven saga of a receptor with twists, turns, and even a bend. Blood. 2008;112(8):3011–25. doi:10.1182/blood-2008-06-077891. PMID: 18840725.
- Brandenberger R, Schmidt A, Linton J, Wang D, Backus C, Denda S, Muller U, Reichardt LF. Identification and characterization of a novel extracellular matrix protein nephronectin that is associated with integrin α8β1 in the embryonic kidney. J Cell Biol. 2001;154(2):447–58. doi:10.1083/jcb.200103069. PMID: 11470831.
- Slack RJ, Macdonald SJF, Roper JA, Jenkins RG, Hatley RJD. Emerging therapeutic opportunities for integrin inhibitors. Nat Rev Drug Discov. 2022;21(1):60–78. doi:10.1038/s41573-021-00284-4. PMID: 34535788.
- Mitjans F, Sander D, Adan J, Sutter A, Martinez JM, Jaggle CS, Moyano JM, Kreysch HG, Piulats J, Goodman SL. An anti-αv-integrin antibody that blocks integrin function inhibits the development of a human melanoma in nude mice. J Cell Sci. 1995;108(Pt 8):2825–38. doi:10.1242/jcs.108.8.2825. PMID: 7593323.
- Goodman SL, Holzemann G, Sulyok GA, Kessler H. Nanomolar small molecule inhibitors for αvβ6, αvβ5, and αvβ3 integrins. J Med Chem. 2002;45(5):1045–51. doi:10.1021/jm0102598. PMID: 11855984.
- Akiyama SK, Yamada SS, Chen WT, Yamada KM. Analysis of fibronectin receptor function with monoclonal antibodies: roles in cell adhesion, migration, matrix assembly, and cytoskeletal organization. J Cell Biol. 1989;109(2):863–75. doi:10.1083/jcb.109.2.863. PMID: 2527241.
- Li S, Wang H, Peng B, Zhang M, Zhang D, Hou S, Guo Y, Ding J. Efalizumab binding to the LFA-1 αL I domain blocks ICAM-1 binding via steric hindrance. Proc Natl Acad Sci U S A. 2009;106(11):4349–54. doi:10.1073/pnas.0810844106. PMID: 19258452.
- Yu Y, Zhu J, Mi LZ, Walz T, Sun H, Chen J, Springer TA. Structural specializations of α4β7, an integrin that mediates rolling adhesion. J Cell Biol. 2012;196(1):131–46. doi:10.1083/jcb.201110023. PMID: 22232704.
- Yu Y, Schurpf T, Springer TA. How natalizumab binds and antagonizes α4 integrins. J Biol Chem. 2013;288:32314–25. doi:10.1074/jbc.M113.501668. PMID: 24047894.
- Sheehan J, Marasco WA, Crowe JE, Boraschi D, Rappuoli R. Phage and yeast display. Microbiol Spectr. 2015;3(1):AID-0028–2014. doi:10.1128/microbiolspec.AID-0028-2014. PMID: 26104550.
- Boder ET, Raeeszadeh-Sarmazdeh M, Price JV. Engineering antibodies by yeast display. Arch Biochem Biophys. 2012;526:99–106. doi:10.1016/j.abb.2012.03.009. PMID: 22450168.
- Clackson T, Hoogenboom HR, Griffiths AD, Winter G. Making antibody fragments using phage display libraries. Nature. 1991;352(6336):624–28. doi:10.1038/352624a0.
- Gai SA, Wittrup KD. Yeast surface display for protein engineering and characterization. Curr Opin Struct Biol. 2007;17(4):467–73. doi:10.1016/j.sbi.2007.08.012. PMID: 17870469.
- Cheresh DA. Human endothelial cells synthesize and express an Arg-Gly-Asp-directed adhesion receptor involved in attachment to fibrinogen and von Willebrand factor. Proc Natl Acad Sci USA. 1987;84(18):6471–75. doi:10.1073/pnas.84.18.6471. PMID: 2442758.
- Coller BS, Peerschke EI, Scudder LE, Sullivan CA. A murine monoclonal antibody that completely blocks the binding of fibrinogen to platelets produces a thrombasthenic-like state in normal platelets and binds to glycoproteins IIb and/or IIIa. J Clin Invest. 1983;72(1):325–38. doi:10.1172/jci110973. PMID: 6308050.
- Graff C, Palmer C, Blakeley B, Mullen T. Gardet a inventors; anti-integrin antibodies and uses thereof. World Intellectual Property Organization; 2020 Apr 08.
- Li J, Su Y, Xia W, Qin Y, Humphries MJ, Vestweber D, Cabanas C, Lu C, Springer TA. Conformational equilibria and intrinsic affinities define integrin activation. Embo J. 2017;36(5):629–45. doi:10.15252/embj.201695803. PMID: 28122868.
- Violette SM, Weinreb PH, Simon KJ, Sheppard D, Leone DR, inventors; Biogen Idec MA Inc. Regents of the University of Californias assignee.^assignees. Anti-αvβ6 antibodies. USA; 2008 Dec 16.
- Taub R, Gould RJ, Garsky VM, Ciccarone TM, Hoxie J, Friedman PA, Shattil SJ. A monoclonal antibody against the platelet fibrinogen receptor contains a sequence that mimics a receptor recognition domain in fibrinogen. J Biol Chem. 1989;264(1):259–65. doi:10.1016/S0021-9258(17)31252-8. PMID: 2909518.
- Pampori N, Hato T, Stupack DG, Aidoudi S, Cheresh DA, Nemerow GR, Shattil SJ. Mechanisms and consequences of affinity modulation of integrin αVβ3 detected with a novel patch-engineered monovalent ligand. J Biol Chem. 1999;274(31):21609–16. doi:10.1074/jbc.274.31.21609.
- Kraft S, Diefenbach B, Mehta R, Jonczyk A, Luckenbach GA, Goodman SL. Definition of an unexpected ligand recognition motif for αvβ6 integrin. J Biolog Chem. 1999;274(4):1979–85. doi:10.1074/jbc.274.4.1979. PMID: 9890954.
- Dong X, Zhao B, Iacob RE, Zhu J, Koksal AC, Lu C, Engen JR, Springer TA. Force interacts with macromolecular structure in activation of TGF-β. Nature. 2017;542(7639):55–59. doi:10.1038/nature21035. PMID: 28117447.
- Li J, Springer TA. Energy landscape differences among integrins establish the framework for understanding activation. J Cell Biol. 2018;217(1):397–412. doi:10.1083/jcb.201701169. PMID: 29122968.
- Sun G, Guillon E, Holley SA. Integrin intra-heterodimer affinity inversely correlates with integrin activatability. Cell Rep. 2021;35(10):109230. doi:10.1016/j.celrep.2021.109230. PMID: 34107244.
- Lin FY, Li J, Xie Y, Zhu J, Huong Nguyen TT, Zhang Y, Zhu J, Springer TA. A general chemical principle for creating closure-stabilizing integrin inhibitors. Cell. 2022;185(19):3533–50.e27. doi:10.1016/j.cell.2022.08.008. PMID: 36113427.
- Wittrup KD. Protein engineering by cell-surface display. Curr Opin Biotechnol. 2001;12(4):395–99. doi:10.1016/s0958-1669(00)00233-0. PMID: 11551469.
- Ewert S, Huber T, Honegger A, Pluckthun A. Biophysical properties of human antibody variable domains. J Mol Biol. 2003;325(3):531–53. doi:10.1016/s0022-2836(02)01237-8. PMID: 12498801.
- Ewert S, Honegger A, Pluckthun A. Structure-based improvement of the biophysical properties of immunoglobulin VH domains with a generalizable approach. Biochem. 2003;42(6):1517–28. doi:10.1021/bi026448p. PMID: 12578364.
- Weinreb PH, Simon KJ, Rayhorn P, Yang WJ, Leone DR, Dolinski BM, Pearse BR, Yokota Y, Kawakatsu H, Atakilit A, et al. Function-blocking integrin αVβ6 monoclonal antibodies: distinct ligand-mimetic and nonligand-mimetic classes. J Biol Chem. 2004;279(17):17875–87. doi:10.1074/jbc.M312103200. PMID: 14960589.
- Dodagatta-Marri E, Ma HY, Liang B, Li J, Meyer DS, Chen SY, Sun KH, Ren X, Zivak B, Rosenblum MD, et al. Integrin αVβ8 on T cells suppresses anti-tumor immunity in multiple models and is a promising target for tumor immunotherapy. Cell Rep. 2021;36(1):109309. doi:10.1016/j.celrep.2021.109309. PMID: 34233193.
- Wang X, Guillem-Marti J, Kumar S, Lee D, Alamo KAE, Werther R, Zhao YT, Nguyen A, Kopyeva I, Huang B, et al. De novo design of α5β1-specific modulating proteins for enhanced cell-material interactions in regenerative medicine. BiorXiv. 2024.