
 ?Mathematical formulae have been encoded as MathML and are displayed in this HTML version using MathJax in order to improve their display. Uncheck the box to turn MathJax off. This feature requires Javascript. Click on a formula to zoom.
ABSTRACT
Precise measurement of the binding activity changes of therapeutic antibodies is important to determine the potential critical quality attributes (CQAs) in developability assessment at the early stage of antibody development. Here, we report a surface plasmon resonance (SPR)-based relative binding activity method, which incorporates both binding affinity and binding response and allows us to determine relative binding activity of antibodies with high accuracy and precision. We applied the SPR-based relative binding activity method in multiple forced degradation studies of antibody developability assessment. The current developability assessment strategy provided comprehensive, precise characterization of antibody binding activity in the stability studies, enabling us to perform correlation analysis and establish the structure–function relationship between relative binding activity and quality attributes. The impact of a given quality attribute on binding activity could be confidently determined without isolating antibody variants. We identified several potential CQAs, including Asp isomerization, Asn deamidation, and fragmentation. Some potential CQAs affected binding affinity of antibody and resulted in a reduction of binding activity. Certain potential CQAs impaired antibody binding to antigen and led to a loss of binding activity. A few potential CQAs could influence both binding affinity and binding response and cause a substantial decrease in antibody binding activity. Specifically, we identified low abundance Asn33 deamidation in the light chain complementarity-determining region as a potential CQA, in which all the stressed antibody samples showed Asn33 deamidation abundances ranging from 4.2% to 27.5% and a mild binding affinity change from 1.76 nM to 2.16 nM.
Introduction
Monoclonal antibodies (mAbs) are widely used as therapeutics targeting a range of cellular membrane and soluble antigens for various diseases, including cancer, autoimmune, and metabolic disorders. As of June 24, 2024, there were nearly 214 therapeutic antibody drugs approved or in regulatory reviews across the globe according to the dataset from the Antibody Society and approximately 1200 antibody therapeutics currently in clinical studies.Citation1–3 MAbs are sought after by numerous biopharmaceutical companies and scientific research institutes due to their good efficacy, low toxicity, and high development success rate.Citation4,Citation5 Compared to small molecule drugs, therapeutic antibody drugs generally possess strong binding potency to target antigens, offering the possibility of high specificity, high target occupancy, and low off-target toxicity.Citation6,Citation7
Target binding is essential for therapeutic antibodies to exert pharmacological activity.Citation8,Citation9 For most therapeutic antibodies, binding to a soluble ligand or cell membrane receptor can block the interaction of the ligand to the receptor, thereby disrupting the downstream signaling mediated by the receptor–ligand interaction.Citation10–12 Alternatively, for cytotoxic antibodies, following antibody binding to cellular membrane antigen, the subsequent Fcγ receptors binding to the Fc region of antibodies can elicit ADCC effector function, activate natural killer cells, and result in target cells depletion.Citation13–15 The interactions between antibody and antigen, as well as IgG Fc and Fc receptors, are considered as the primary mechanism of actions (MOAs) for antagonistic and cytotoxic antibodies, respectively. The binding activity of a given antibody to antigens or Fc receptors can serve as a surrogate for the biological activity,Citation16,Citation17 which is usually used to determine potential critical quality attributes (CQAs) in developability assessment at the early stage of antibody development. The identification of potential CQAs is primarily based on the assessment of product attribute impact on bioactivity, pharmacokinetics, immunogenicity, and safety.Citation16 Regarding the evaluation of product attribute impact on bioactivity, commercial potency bioassays usually have acceptance criteria at least ±20% wide. This necessitates enriching product variants under stress conditions and further isolating them through chromatographic separation to confidently monitor changes in bioactivity.Citation16 In addition, the International Conference on Harmonization Q6B document suggests that the binding assays of therapeutic antibody drugs to target antigens should be performed to determine the immunochemical property with respect to the specification setting.Citation18
Ligand binding assays commonly applied during antibody development include enzyme-linked immunosorbent assay (ELISA), surface plasmon resonance (SPR)-based active concentration, SPR-based binding affinity, and flow cytometry. ELISA might be the most widely used binding assay during manufacturability assessment to release testing. Yang et al. described ELISA as the most commonly used potency assay in antibody developability assessment, which was used to characterize the biological activity and determine the potential challenges of chemistry, manufacturing, and control (CMC) before initiation of process development.Citation19 This report showed, however, that ELISA had substantial variability and low sensitivity and could not confidently detect moderate binding activity alterations. SPR approaches, including active concentration and binding kinetics, are also common binding assays for antibody development and were recently included in the United States Pharmacopeia and Japanese Pharmacopoeia.Citation20,Citation21 Regarding the SPR-based active concentration method, Haberger et al. used it to evaluate the effects of post-translational modifications (PTMs) on the binding potency of an antibody in developability studies and identified multiple potential CQAs involving asparagine deamidation and methionine oxidation.Citation22 The active concentration method had high precision, but it was difficult to develop an active concentration assay due to challenges associated with determining the regeneration condition for an antigen protein. To address the challenge of regeneration, we set up an antigen capture active concentration method of high-density mouse IgG Fc fusion antigen capture followed by antibody injection format and found that this format had the issue of antigen availability. We designed another antibody capture active concentration method of low-density antibody capture followed by a high-concentration antigen injection format, but we found that the active concentration method could not detect the antibody-antigen dissociation rate alterations, thereby likely resulting in false negative experimental data. SPR-based binding kinetics analysis is widely applied at the antibody discovery stage to determine the binding affinity of antibodies.Citation23 DiCara et al. applied an SPR-based antibody capture binding kinetics format that focused on the ratio of the binding signals to the antibody capture levels and identified a significant specific activity loss of an antibody in the thermal stress testing, which was linked to an asparagine deamidation in the light chain complementarity-determining region (CDR).Citation24 Karlsson et al. reported a model-independent sensorgram comparison method that could be applied to comparability and biosimilar studies of biotherapeutics as a complement to kinetic data.Citation25 Lietz et al. used this sensorgram comparison method to determine a tyrosine sulfation in the variable region that affected the binding activity by increasing antigen dissociation rate.Citation26 Chen et al. applied the antibody-antigen binding kinetics method to evaluate the similarity of binding affinity between Kadcyla®, trastuzumab, and the biosimilars.Citation27 We previously used the binding kinetics format for relative binding affinity assessment and found that this approach had moderate variability as predicted. Flow cytometry has been used for therapeutic antibodies targeting membrane antigens that could not be expressed and purified, but this assay had low sensitivity and high variability.Citation28
To address these issues, we optimized the antibody capture binding kinetics format to reduce variability. We developed an SPR-based relative binding activity method that incorporated both binding affinity and binding response, allowing us to determine the relative binding activity of antibodies with high accuracy and precision. We applied the SPR-based relative binding activity method in multiple forced degradation studies of antibody developability assessment. Our developability assessment strategy provided a precise characterization of antibody binding activity in the stability studies. This enabled us to determine the impact of a given biophysical property on binding activity and identify potential CQAs in the developability studies without isolating antibody variants.
Results
The overview of SPR-based relative binding activity method
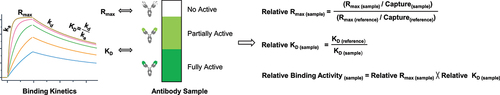
From the activity perspective, an antibody sample can be divided into two major subpopulations, namely active and not active antibodies, where the active subpopulation encompasses both partially active and fully active antibodies. Thus, understanding both the activity level of active antibodies and their abundances in a test sample will enable us to characterize the binding potency level of antibodies. The SPR-based binding kinetics analysis provides multiple antibody-antigen binding parameters involving the association rate constant ka, the dissociation rate constant kd, the equilibrium dissociation constant KD, the maximum binding response Rmax, and antibody capture levels. The KD constant has been widely used to represent antibody binding strength. The Rmax measure is proportional to the capture levels of active antibodies and can be used to reflect antibody binding capacity. The current relative binding activity method incorporates both binding affinity (KD) and binding response (Rmax) to determine the relative binding activity of a test sample normalized to the standard reference. Firstly, regarding relative Rmax of a test sample, the Rmax is normalized by the relevant capture levels as the normalized Rmax. Relative Rmax is equal to the normalized Rmax of a test sample divided by the normalized Rmax of the standard reference, which reflects relative binding capacity of antibodies. Secondly, relative KD of a test sample is equal to the KD of the standard reference divided by the KD of a test sample, which represents relative binding strength of antibodies. Thirdly, the relative binding activity of a test sample is generated by multiplying relative Rmax and relative KD, which characterizes the whole relative binding activity level of a test sample relative to the reference standard (). Consequently, the SPR-based relative binding activity method provides three layers of characterization for binding activity alterations: reduction based on changes in KD, loss based on changes in Rmax, and overall alterations considering both KD and Rmax. We then qualified and verified this method in forced degradation studies during the developability assessment of antibodies. We measured binding activity alterations, identified biophysical properties associated with these changes, and established the structure–function relationship for a specific antibody variant. This allowed us to determine multiple potential CQAs and demonstrate the suitability of SPR-based relative binding activity assessment in the stability studies of therapeutic antibodies.
Figure 1. The overview of SPR-based relative binding activity method. An antibody sample can be divided into two major subpopulations from the activity perspective, namely active and not active antibodies, where the active subpopulation comprises partially active and fully active antibodies. In antibody capture binding kinetics analysis, binding affinity (KD) represents antibody binding strength, and maximum binding response (Rmax) reflects antibody binding capacity. Regarding the relative binding activity assessment of a test sample normalized to the reference standard, relative KD reflects relative binding strength of antibodies, and relative Rmax reflects relative binding capacity of antibodies. Thus, the relative binding activity of a test sample is generated by multiplying relative Rmax and relative KD, which characterizes the overall relative binding activity level of a test sample relative to the reference standard.
Case study 1. Asp26 isomerization resulted in a significant reduction of binding activity for mAb-A
The first case study concerned an IgG4 antibody termed mAb-A. We carried out thermal stress stability studies for mAb-A in both the slightly acidic pH 5.5 and neutral pH 7.4 buffers. Firstly, we applied the SPR-based relative binding activity method to evaluate the binding activity of mAb-A in forced degradation studies. We observed that both relative KD and relative binding activity showed a time-dependent and significant reduction, whereas relative Rmax showed a mild decrease for both the slightly acidic and neutral stability studies. Relative KD and relative binding activity at the slightly acidic condition after 4 weeks dropped to nearly 25.0% and 23.3%, respectively (, and S1a,b). This suggested that relative binding activity alterations of mAb-A was largely associated with relative KD through decreased binding affinity. Next, we sought to identify the biophysical properties relevant to the relative binding activity alterations of mAb-A. Size exclusion chromatography (SEC) and non-reduced sodium dodecyl sulfate capillary electrophoresis (nrCE-SDS) analysis detected minimal changes of aggregates and fragments, respectively (Figure S1c-f). Mass spectrometry (MS)-based peptide mapping analysis identified that the isomerization of Asp26 followed by histidine in the heavy chain (HC) CDR1 region displayed a time-dependent increase in both the slightly acidic and neutral stability studies. Asp26 isomerization levels exceeded 70% at the slightly acidic condition after 4 weeks (, and S1g,h). Similarly, Yi et al. reported an unexpectedly high isomerization of Asp in the Asp-His motif in the heavy chain CDR2 region, dramatically affecting antibody binding activity.Citation29
Figure 2. Asp26 isomerization resulted in a significant reduction of binding activity for mAb-A. The mAb-A antibody was exposed to 40°C for 4 weeks in both the slightly acidic pH 5.5 and neutral pH 7.4 buffers. The stability samples were collected at the indicated time points. The relative binding activity was measured under the slightly acidic (a) and neutral (b) stability conditions including relative KD, relative Rmax, and relative binding activity, and then presented as mean ± standard deviation (SD) from three independent experiments, where the dot line binding profiles were not included in the data fitting analysis. The antigen solutions were separately injected at 30, 15, 7.5, 3.75, and 1.875 nM. Peptide mapping was performed. Asp26 isomerization in the heavy chain CDR1 region was identified and presented as the average from two independent tests for the slightly acidic (c) and neutral (d) stability studies. (e) Correlation analysis was performed between the Asp26 isomerization increase and three relative binding activity measures. (f) Correlation analysis was performed between relative ka, relative kd, and relative KD. (g) The D26T mutant was prepared. The thermal stress study was then performed. Similarly, the relative binding activity was measured and presented as mean ± SD from three independent experiments. (h) The classical SPR-based active concentration assay was developed through antigen immobilization followed by the injection of mAb-A stability samples. The binding signals were used to establish a calibration curve for active concentration analysis. (i) On the basis of the calibration curve, relative active concentrations could be calculated for mAb-A stability samples under the slightly acidic and neutral stability conditions and presented as mean ± SD from three independent experiments.
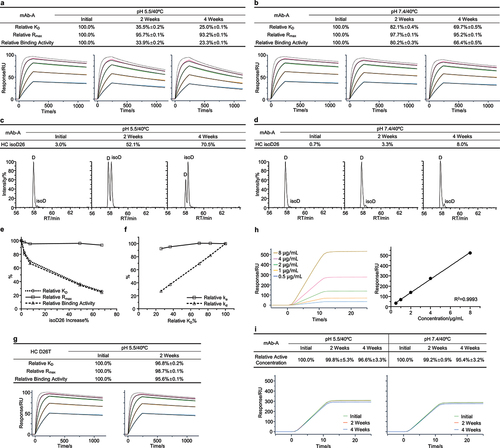
To determine whether Asp26 isomerization was associated with the reduction of binding activity, we performed a correlation analysis between Asp26 isomerization and three relative binding activity measures. We found that the Asp26 isomerization increase was closely related to changes in relative KD and relative binding activity (). Specifically, after 4 weeks in a slightly acidic buffer, the stressed antibody sample showed a 67% increase in Asp26 isomerization and a 75% reduction in relative KD. This indicated that Asp26 isomerization could dramatically affect the binding affinity of mAb-A. Furthermore, we observed that relative KD had a clear correlation with relative kd, suggesting that relative KD reduction was associated with increased dissociation rates (). Together, these results, as summarized in Table S1, showed that the heavy chain Asp26 isomerization could significantly affect the binding activity of mAb-A by increasing the dissociation rate and was considered as a potential CQA for mAb-A antibody development. Considering the amount of Asp26 isomerization and its effect on binding activity, mAb-A was reengineered to fix the Asp-His hot spot. We identified the D26T mutant and conducted a thermal stress testing in a slightly acidic solution. Compared to mAb-A wild type (WT) (), we observed a minimal reduction in relative KD and relative binding activity for the D26T mutant (). This confirmed that Asp26 isomerization was largely responsible for the reduction of relative KD and could significantly affect the binding activity for mAb-A during stability studies.
Finally, we carried out a head-to-head comparison between the SPR-based relative binding activity method and the SPR-based relative active concentration method. We developed the classical SPR-based active concentration assay for mAb-A and detected mild changes of relative active concentrations for both the slightly acidic and neutral stability studies. All the relative active concentrations were more than 95% (). This was consistent with our prior observation that the active concentration method could not monitor the dissociation rate alterations.
Case study 2. Fragmentation resulted in a significant decrease of binding activity for mAb-B
The second case study concerned an IgG1 antibody termed mAb-B. We performed thermal stress stability studies for mAb-B in both the neutral pH 7.4 and slightly acidic pH 6.0 buffers. Firstly, we used the SPR-based relative binding activity method to assess the binding activity of mAb-B in forced degradation studies. We observed that both relative KD and relative binding activity showed a substantial reduction in a time-dependent manner, whereas relative Rmax showed a mild decrease under both the neutral and slightly acidic stability conditions. Relative KD and relative binding activity at the neutral condition after 2 weeks decreased to 55.8% and 51.7%, respectively (, and S2a,b). This suggested that relative binding activity alterations of mAb-B was largely associated with relative KD through decreased binding affinity. Next, we sought to determine the quality attributes associated with the relative binding activity alterations of mAb-B. SEC analysis detected a minimal increase of aggregates (Figure S2c,d). Peptide mapping analysis did not identify considerable PTMs in the CDR regions (Figure S2e,f). The nrCE-SDS analysis showed a time-dependent increase of fragments in the neutral and slightly acidic stability studies. The fragment levels at the neutral stability condition exceeded 28% (). We performed MS analysis, measured the molecular weight of fragments, and localized the clipping between asparagine 93 and proline 94 of the light chain (LC) CDR3 region (). To determine whether fragmentation was responsible for reducing binding activity, we performed a correlation analysis between fragments and three relative binding activity measures. We found that the increase in fragments exhibited good relevance with relative KD and relative binding activity (). We observed that the stability sample in the neutral buffer at 2 weeks showed a 22% increase in fragments and a 44% reduction in relative KD. This indicated that the fragmentation could significantly affect the binding affinity of mAb-B. Moreover, we observed that relative KD had a clear correlation with relative kd (), indicating that an increase in dissociation rates was the cause for relative KD reduction. Together, these results, as summarized in Table S2, showed that the Asn-Pro fragmentation at the light chain CDR3 region could significantly affect the binding activity of mAb-B via increasing the dissociation rate and was considered as a potential CQA for mAb-B antibody development.
Figure 3. Fragmentation resulted in a significant decrease of binding activity for mAb-B. The mAb-B antibody was exposed to 40°C for 2 weeks in both the neutral pH 7.4 and slightly acidic pH 6.0 buffers. The stability samples were collected at the indicated time points. The relative binding activity was measured under the neutral (a) and slightly acidic (b) stability conditions including relative KD, relative Rmax, and relative binding activity, and then presented as mean ± SD from three independent experiments, where the assay concentrations of antigens were 100, 50, 25, 12.5, and 6.25 nM. The dot line binding profiles were not included in the data fitting analysis. The nrCE-SDS was performed. The fragments were measured and presented as the average from two independent tests for the neutral (c) and slightly acidic (d) stability studies. (e) Mass spectrometry was used to monitor the molecular weight of the stability samples. The clipping site was then derived. (f) Correlation analysis was performed between fragments increase and three relative binding activity measures. (g) Correlation analysis was performed between relative ka, relative kd, and relative KD. The N93L mutant was identified. The thermal stability study was then conducted. Similarly, (h) the relative binding activity was determined and presented as mean ± SD from three independent experiments. (i) The fragments were measured by nrCE-SDS.
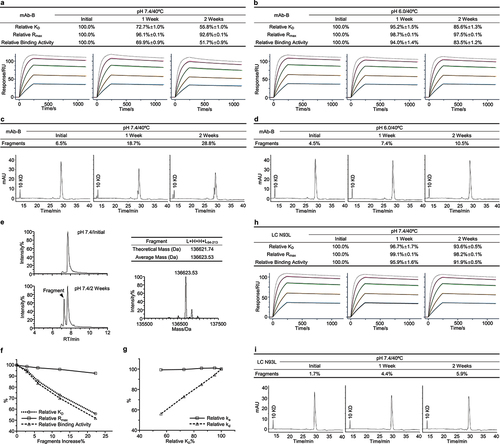
Considering the amount of the fragmentation and its effect on binding activity, mAb-B was reengineered to fix the Asn-Pro hot spot. We prepared the N93L mutant and performed a thermal stress study in a neutral solution. Compared to mAb-B WT (), the relative binding activity analysis showed that relative KD and relative binding activity had a mild reduction for the N93L mutant (). nrCE-SDS analysis showed a slight increase of fragments (), whereas the cleavage site was not localized (data not shown). This confirmed that the Asn-Pro fragmentation was largely responsible for the reduction of relative KD and could dramatically affect the binding activity for mAb-B during stability studies.
Case study 3. Asp53 isomerization led to a loss of binding activity for mAb-C
The third case study concerned a VHH fused to IgG4 Fc antibody termed mAb-C. We performed thermal forced degradation studies for mAb-C in the slightly acidic pH 5.5 buffer. Firstly, we applied the SPR-based relative binding activity method to monitor the binding activity of mAb-C in the stability studies. We observed that relative Rmax and relative binding activity showed a time-dependent, considerable decrease, whereas relative KD showed a mild reduction. Relative Rmax and relative binding activity at 4 weeks decreased to 66.5% and 60.9%, respectively ( and S3a). The decrease of relative Rmax suggested that some mAb-C antibodies were a complete loss of binding activity upon thermal stress. Next, we sought to investigate the biophysical properties relevant to the relative binding activity reduction of mAb-C. SEC and nrCE-SDS analysis detected a minimal increase of aggregates and fragments, respectively (Figure S3b,c). Peptide mapping analysis identified that the isomerization of Asp53 followed by glycine in the CDR2 region displayed a time-dependent increase. Asp53 isomerization levels at 4 weeks exceeded 39% ( and S3d). To determine whether Asp53 isomerization was relevant to the loss of binding activity, we performed a correlation analysis between Asp53 isomerization and three relative binding activity measures. We observed that Asp53 isomerization increase had a clear correlation with relative Rmax and relative binding activity (). Particularly, the increased amounts of Asp53 isomerization were equal to the decreased levels of relative Rmax, supporting that Asp53 isomerization completely abrogated antibody binding activity. Together, these results, as summarized in Table S3, showed that Asp53 isomerization could result in a loss of binding activity during the stability studies and was considered as a potential CQA for mAb-C antibody development.
Figure 4. Asp53 isomerization led to a loss of binding activity for mAb-C. (a) The mAb-C antibody was exposed to 40°C for 4 weeks in the slightly acidic pH 5.5 buffer. The stability samples were collected at the indicated time points. The relative binding activity measures were determined including relative KD, relative Rmax, and relative binding activity, and presented as mean ± SD from three independent experiments, where the dot line binding profiles were not included in the data fitting analysis. The antigen solutions were separately injected at 400, 200, 100, 50, and 25 nM. (b) Peptide mapping analysis was performed. Asp53 isomerization in the CDR2 region was identified and presented as mean ± SD from three independent experiments. (c) Correlation analysis was performed between the Asp53 isomerization increase and three relative binding activity measures. The G54A mutant was prepared. The thermal stress testing was then performed. Similarly, (d) the relative binding activity was measured and presented as mean ± SD from three independent experiments. (e) Asp5353 isomerization was determined by peptide mapping analysis.
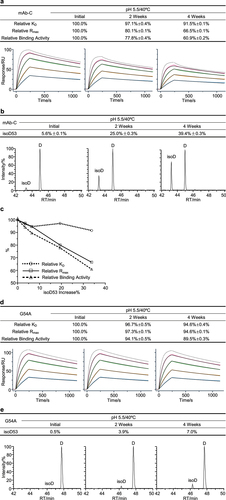
Considering the amount of Asp53 isomerization and its effect on binding activity, mAb-C was reengineered to fix the labile Asp-Gly hot spot. We designed the G54A mutant and conducted a thermal stability study in a slightly acidic buffer. Compared to mAb-C WT (), the relative binding activity analysis showed that relative Rmax and relative binding activity had a mild decrease in a time-dependent manner for the G54A mutant (). Peptide mapping analysis identified a slight increase of Asp53 isomerization in this mutant (). Again, the increased amounts of Asp53 isomerization were substantially equal to the decreased levels of relative Rmax. Similar to the report from DiCara et al.,Citation24 this confirmed that Asp53 isomerization was responsible for decreased relative Rmax and could completely impair the binding activity of mAb-C during stability studies.
Case study 4. Low abundance Asn33 deamidation was identified as a potential CQA for mAb-D
The fourth case study concerned an IgG4 antibody termed mAb-D. We carried out thermal forced degradation studies for mAb-D in both the slightly acidic pH 5.5 and neutral pH 7.4 buffers. Firstly, using the SPR-based relative binding activity method, we observed that relative KD, relative Rmax, and relative binding activity showed a trend of time-dependent reduction for both the slightly acidic and neutral stability studies. Relative KD, relative Rmax, and relative binding activity under the neutral stability condition reduced to approximately 81.3%, 88.1%, and 71.6%, respectively (, and S4a). It should be mentioned that the KD values for all the stability samples were in the range of 1.76–2.16 nM, representing a mild change of binding activity. Next, we sought to determine the biophysical properties associated with the relative binding activity alterations of mAb-D. Mild amounts of aggregates and fragments were detected by SEC and nrCE-SDS analysis (Figure S4b-e). Peptide mapping analysis identified that the deamidation of Asn33 followed by serine in the light chain CDR1 region displayed a time-dependent increase for both the slightly acidic and neutral stability studies. Asn33 deamidation levels at the neutral stability condition after 4 weeks exceeded 27% (, and S4f). To determine if Asn33 deamidation was a potential CQA, we analyzed its correlation with relative KD, relative Rmax, and relative binding activity. We found that the increase in Asn33 deamidation was closely related to all three measures of relative binding activity (). The stressed antibody sample in the neutral buffer after 4 weeks showed a 23% increase in Asn33 deamidation, a 19% reduction in relative KD, a 12% decrease in relative Rmax, and a 28% decrease in relative binding activity. Additionally, we observed that relative KD had a clear correlation with relative kd (), suggesting that relative KD reduction was associated with an increase in the dissociation rate.
Figure 5. Low abundance Asn33 deamidation was identified as a potential CQA for mAb-D. The mAb-D antibody was exposed to 40°C for 4 weeks in both the slightly acidic pH 5.5 and neutral pH 7.4 buffers. The stability samples were collected at the indicated time points. Relative binding activity measures were determined under the slightly acidic (a) and neutral (b) stability conditions including relative KD, relative Rmax, and relative binding activity, where the antigen concentrations were 100, 50, 25, 12.5, 6.25, and 3.125 nM. The dot line binding profiles were not included in the data fitting analysis. Peptide mapping was performed. Asn33 deamidation in the light chain CDR1 region was identified and quantitated for the slightly acidic (c) and neutral (d) stability studies, where deaN stood for the deamidated asparagine. (e) Correlation analysis was performed between Asn33 deamidation increase and three relative binding activity measures. (f) Correlation analysis was performed between relative ka, relative kd, and relative KD. The mAb-D antibody was incubated in the pH 9.0 buffer at 40°C for 4 weeks. Similarly, (g) Asn33 deamidation was determined by peptide mapping analysis. (h) The relative binding activity was measured using the antigen concentrations from 6.25 to 100 nM.
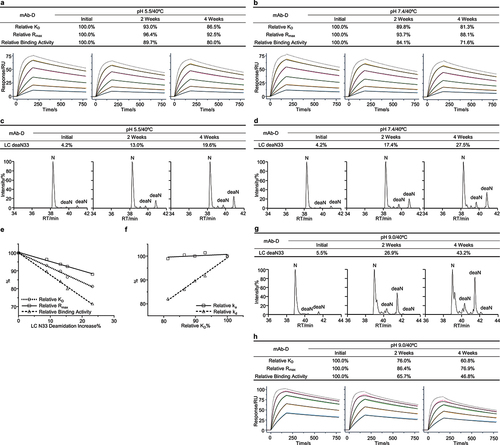
To confirm the impact of Asn33 deamidation on binding activity, we performed a high pH stress stability study for mAb-D in a pH 9.0 buffer. We observed a considerable increase in Asn33 deamidation () and a substantial reduction in relative KD, relative Rmax, and relative binding activity (). Regarding how Asn33 deamidation would affect antibody binding activity, we estimated that Asn33 deamidation influenced both antibody binding affinity and binding response through different deamidation variants and resulted in a substantial decrease of binding activity. The asparagine deamidation reaction would generate three major products: the succinimide, aspartic acid, and iso-aspartic acid. The contents of these Asn deamidation variants on protein level were difficult to correctly measure by conventional peptide mapping analysis. Compared to the asparagine residue, the succinimide, aspartic acid, and isoaspartate had different biophysical properties of conformation, charge, and hydrophobicity. Some Asn33 deamidation variants could affect antibody binding affinity and were associated with the reduced relative KD. Other Asn33 deamidation variants could impair antibody binding to antigen and were related to the decreased relative Rmax. Under this condition, the relative binding activity changes would reflect the overall impact of Asn33 deamidation on binding activity. Together, these results, as summarized in Table S4, suggested that the light chain Asn33 deamidation had an obvious impact on the binding activity of mAb-D in the stability studies and was considered as a potential CQA for mAb-D antibody development.
SPR-based relative binding activity method as a potential quality control release assay
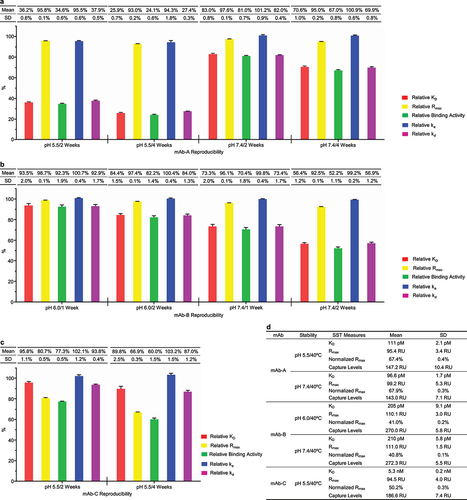
We performed method qualification studies for the SPR-based relative binding activity method and determined the critical parameters for analytical procedure qualification, including accuracy, precision, sensitivity, robustness, and system suitability.Citation30 Regarding accuracy, we identified the biophysical properties relevant to binding activity alterations in the case studies above, demonstrating that the SPR-based relative binding activity method had suitable accuracy for relative KD and high accuracy for relative Rmax. Precision posed the most significant challenge for method qualification due to the complexities of the SPR instrument and the sensor chip. In the case studies above, we observed that relative binding activity measures for eight groups of stability samples exhibited substantially low variations (). Further, we accomplished relative binding activity analysis for the five groups of stability samples of mAb-A, mAb-B, and mAb-C nine times in nearly one month and observed that the five relative binding activity measures were well repeated with standard deviation (SD) less than 2% for relative KD and nearly 0.2% for relative Rmax (). mAb-A had the best repeatability for the relative binding activity analysis, i.e., SD nearly 0.7% for relative KD and approximately 0.15% for relative Rmax (). Regarding sensitivity, we considered three times SD as the sensitivity. The representative mAb-A showed that the sensitivity for relative KD was nearly 2% and the sensitivity for relative Rmax was approximately 0.5%. Regarding robustness, we reanalyzed the experimental data using the two higher concentration points and obtained the same results (Figure S5a-c). This indicated that we could accomplish relative binding activity analysis for a pair of the standard reference and a test sample in 2 hours, representing a considerably high throughput. Additionally, mAb-A and mAb-B stability samples employed two pieces of sensor chips during nine experiments and showed the identical experimental results, indicating that our method could accommodate the impact of the sensor chip. Regarding system suitability, we established the system suitability testing (SST), which comprised four parameters: (1) KD, (2) Rmax, (3) normalized Rmax for the reference standard to ensure the quality of the reference standard and the relevant antigen, and (4) antibody capture levels for all the samples to reflect the consistency of the whole experimental process (). Together, we demonstrated that the SPR-based relative binding activity method had suitable accuracy, high reproducibility, and good robustness, which supported that the SPR-based relative binding activity method had the potential to be used as a quality control release and stability assay.
Figure 6. SPR-based relative binding activity method had the potential to become a quality control release assay. SPR-based relative binding activity analysis was performed for five groups of stability samples from mAb-A (a), mAb-B (b), and mAb-C (c) 9 times in approximately 40 days. The five relative binding activity measures, including relative KD, relative Rmax, relative binding activity, relative ka, and relative kd, were presented as mean and SD from nine independent experiments. (d) The SST was established for the five stability studies of mAb-A, mAb-B, and mAb-C. The SST parameters included KD, Rmax, and normalized Rmax for the reference standard, as well as antibody capture levels for all the stability samples. The mean and SD of the SST parameters for the five stability studies were presented.
Discussion
Precise measurement of the binding activity changes of antibodies is important to identify the potential CQAs in developability assessment at the early stage of antibody development. Here, we report a new SPR-based analytical procedure on the basis of the conventional antibody capture binding kinetics mode, which incorporates both binding affinity and binding response and allows us to determine the relative binding activity of antibodies with suitable accuracy and high precision. We applied the SPR-based relative binding activity method in multiple forced degradation studies of antibody developability assessment. We obtained an in-depth characterization for the relative binding activity of antibodies in the stability studies, which involved the reduction of binding activity based on relative KD, the loss of binding activity based on relative Rmax, and the overall binding activity alterations considering both relative KD and relative Rmax. Particularly, we determined that our relative binding activity analysis had high reproducibility and low variability comparable to the common physicochemical methods. This facilitated our analysis of the correlation between relative binding activity and product attributes to establish the structure-function relationship for a given quality attribute. We observed that some product attributes had a clear correlation with relative Rmax, in which the decreased amounts of relative Rmax was close to the increased levels of product variants. This indicated that this quality attribute could result in a loss of binding activity. We also observed that certain product attributes had good relevance with relative KD, suggesting that the quality attributes could influence antibody binding activity through decreased binding affinity.
We identified multiple potential CQAs in the developability assessment of antibodies, including fragmentation, Asp isomerization, and Asn deamidation. Some potential CQAs could affect antibody binding affinity via increasing the dissociation rate and result in a reduction of binding activity. Certain potential CQAs could impair antibody binding to antigen and lead to a loss of binding activity. A few potential CQAs could even influence both binding affinity and binding response through different PTMs variants and cause a substantial decrease in antibody binding activity. Together, our developability assessment strategy provided the comprehensive and precise characterization of antibody binding activity in the stability studies, which enabled us to determine the impact of product attributes on binding activity and identify potential CQAs without isolating antibody variants. The determination of potential CQAs represents an important first step for quality by design (QbD) development of therapeutic antibodies. Subsequently, limited development resources can be reallocated to the degradation pathway to fix the degradation hotspot through antibody reengineering, or a proper formulation buffer can be developed to ensure that the degradation levels are acceptable during storage and a suitable control strategy can be put in place to monitor the degradation and relative binding activity during manufacturing.Citation16,Citation19,Citation31–33
To apply SPR-based relative binding activity for CQA identification, we need to establish the relationship between binding activity and biological function,Citation16 which should certainly be molecule-specific. Here, we describe our viewpoints on understanding their relationship. Relative binding activity changes might be either weaker or stronger than relative biological activity alterations. The standard antibody consists of two identical heavy chains and two identical light chains. Depending on MOA, for some antibodies, one Fab binding to target antigen will be sufficient to achieve the biological activity, which is considered as monovalent binding, e.g., adalimumab,Citation16,Citation34 and for certain antibodies, both Fab binding to target antigen will be required to elicit the biological function, which is considered as bivalent binding, e.g., trastuzumab.Citation16,Citation35,Citation36 When an antibody has strong binding potency with a monovalent binding mode, a moderate relative-binding activity change mediated by the reduced binding affinity might not considerably affect the in vivo efficacy of antibodies. However, for an antibody with a bivalent binding mode, the impact of relative-binding activity alterations could be amplified. For example, a 10% decrease in relative Rmax might imply that close to 20% antibody could be affected, i.e., 15% antibody might be affected in one Fab arm and 2.5% antibody might be affected in two Fab arms. Although the relationship between biological function and binding activity might be a little complex, the detection of relative binding activity alterations usually implies the presence of some chemical modifications in the CDR regions, as well as likely higher-order structure alterations. Thus, the relative-binding activity method can provide valuable information for us to help discover the potential biophysical properties that might be missed through the standard peptide mapping method. Alternatively, when the quality attributes relevant to the binding activity changes cannot ultimately be identified, we will usually assume that the binding activity reduction is associated with higher-order structure changes, which can be inferred by our relative binding activity measures more precisely than the conventional biological activity.Citation16,Citation18
As a characterization assay, the SPR-based relative binding activity method can be applied to a variety of stages in antibody development, involving manufacturability study, process development, extended characterization for comparability studies before and after process changes, reference standard qualification, and formulation development. Furthermore, we demonstrated that the SPR-based relative binding activity method had suitable accuracy, high precision, and good robustness. This indicated that the SPR-based relative binding activity method could be used as a quality control release and stability assay for therapeutic antibody development, which would assist in the production of therapeutic antibody drugs with consistent efficacy through the precise control of binding activity. In summary, the SPR-based relative binding activity method represents a substantial advancement for assessing the relative binding activity of therapeutic antibodies at the development stage. This method employs an easy-to-use antibody capture binding kinetics mode without complex assay development and can be applied to most therapeutic antibodies.
Materials and Methods
Reagents and Materials
Histidine, acetic acid, sucrose, phosphate-buffered saline (PBS), sodium phosphate monobasic, sodium phosphate dibasic, SDS, citric acid, N-ethylmaleimide (NEM), iodoacetamide (IAM), dithiothreitol (DTT), acetonitrile, and urea were purchased from Sigma-Aldrich. Zeba spin desalting column, formic acid, 8 M guanidine-HCl solution, trifluoroacetic acid (TFA), and 1 M Tris-HCl pH 7.5 solution were purchased from Thermo Fisher. Protein A sensor chip, CM5 sensor chip, glycine 1.5 solution, glycine 2.5 solution, and human antibody capture kit were purchased from Cytiva. Sequencing grade modified trypsin was purchased from Promega. Glycerol free PNGase F was purchased from New England BioLabs.
The antibodies were expressed in HEK 293 cells or Chinese hamster ovary cells and purified by single-step protein A affinity chromatography using the Mabselect SuRe resin from Cytiva. The antibodies were exchanged to the PBS pH 7.4 buffer.
Forced degradation studies
The forced degradation experiments were performed using the constant climate chamber HPP110 from Memmert. The antibody samples were exchanged to the respective buffers of the slightly acidic buffer 1 (20 mM histidine pH 6.0, 9% sucrose), the slightly acidic buffer 2 (20 mM sodium acetate pH 5.5, 9% sucrose), the neutral buffer (PBS pH 7.4), and the high pH buffer (20 mM Tris-HCl pH 9.0), followed by exposure to thermal stress conditions of 40°C and relative humidity (RH) 75% for 2 weeks or 4 weeks. The stressed antibody samples were collected at the indicated time points and then measured using a battery of analytical methods.
Size-exclusion chromatography
SEC analysis was performed using the Agilent 1260 systems via the TSKgel G3000SWXL column (5 mm, 7.8 mm × 300 mm) from Tosoh. The mobile phase was a solution of 0.2 M sodium phosphate pH 7.0 at a flow rate of 0.5 mL/min. The UV absorbance was measured at a wavelength of 280 nm.
Non-reduced sodium dodecyl sulfate capillary electrophoresis
The Sciex PA800 plus pharmaceutical analysis system was used for nrCE-SDS analysis with a 20.0 cm effective length of capillary. The protein samples were exchanged to a denaturing buffer (20 mM phosphate pH 6.5, 5 mM citric acid, 1% SDS), followed by the addition of 5 mM N-ethylmaleimide (NEM). The mixture was incubated at 70°C for 10 min before injection. The instrument was operated at a voltage of 15 kV for protein separation. The UV detection was recorded at a wavelength of 220 nm.
Antibody mass analysis
Thermo Q-Exactive plus high-resolution orbitrap mass spectrometer was used for antibody mass and peptide mapping analysis. The mobile phase A was water containing 0.1% formic acid. The mobile phase B was acetonitrile containing 0.1% formic acid. The antibody samples were separated by the BioResolve RP mAb Polyphenyl column (Waters, 450 Å, 2.1 mm × 150 mm) at 80°C. The elution gradient was from 28% to 42% of mobile B for 11.4 min at a flow rate of 0.3 mL/min. The relevant mass spectrometer parameters included spray voltage 3.8 kV, capillary temperature 300°C, AGC target 3E6, maximum ion time 200 ms, in-source CID 20 eV, and scan range from m/z 500 to 4500. Full MS spectra were deconvoluted to determine the mass of antibody fragments by the Thermo Biopharma Finder 4.1 software using the Respect algorithm.
Peptide mapping analysis
Antibody samples (100 µg) were denatured using a buffer containing 100 mM Tris-HCl and 6.0 M guanidine HCl at pH 7.5. They were then reduced with 20 mM DTT at 37°C for 60 min, followed by alkylation with 50 mM IAM for 30 min at room temperature in the dark. The solution was buffer exchanged into 50 mM Tris-HCl pH 7.5 solution containing 1 M urea using a Zeba spin column according to the manufacturer’s instructions. Sequencing-grade modified trypsin was added to each sample (enzyme to protein ratio 1:50, w/w) and incubated at 37°C for 4 hours. 0.1% TFA was added to quench the proteolytic reaction. The tryptic peptide mixtures were separated by the Peptide BEH C18 column (Waters, 300 Å, 2.1 mm × 100 mm) at 50°C. The elution gradient was from 2% to 37% of mobile B for 77 min at a flow rate of 0.2 mL/min. The relevant mass spectrometer parameters included spray voltage 3.8 kV, capillary temperature 280°C, one full MS followed by five MS/MS scans, full MS scan range m/z 250 to 2000 with AGC target 3E6 and maximum ion time 100 ms, MS/MS scan range from m/z 110–2000 with AGC target of 1E5 and maximum ion time 200 ms. Dynamic exclusion was applied with an exclusion duration of 10 s. For PTMs characterization, the raw data from the Q-Executive mass spectrometer were searched against the relevant antibody sequences with multiple modifications using the Thermo Biopharma Finder 4.1 software. The relative abundances of PTMs were determined, followed by confirmation of manual check.
SPR-based relative binding activity analysis
The relative binding activity assessment of antibodies was performed by antibody-antigen binding kinetics mode of Biacore 8K from Cytiva. A group of the reference standard and test samples were analyzed in the identical Biacore channel. The antibody was captured by protein A sensor chip, or anti-human IgG Fc antibodies immobilized on a CM5 sensor chip at 25°C, followed by varying concentrations of antigen injection, respectively. The running buffer was HBS-EP+ (10 mM HEPES pH 7.4, 150 mM NaCl, 3 mM EDTA, 0.05% surfactant P20) at a flow rate of 30 μL/min. The sensor chip was regenerated by injection of glycine pH 1.5 or 3 M MgCl2 pH 2.1 solution for 30 s. The binding data was globally fitted using the Biacore Insight Evaluation software. The default fitting parameters were applied. The binding kinetics measures were determined based on a 1:1 binding model, including the association rate constant ka, the dissociation rate constant kd, the equilibrium dissociation constant KD, the maximum binding response Rmax, and antibody capture levels. Normalized to the reference standard, the relative binding activity measures of a test sample were calculated according to the following equations:
The antibody capture binding kinetics mode was optimized to reduce variability as follows. (1) The same Biacore channel was used for a group of the reference standard and test samples. (2) The antigen concentrations for relative binding activity analysis were determined based on the reference standard. A high concentration point that could reach or be close to the binding plateau should be determined. It was dependent on the fitting quality whether the high concentration point was included in the data fitting analysis. The same series of antigen concentrations was used for the reference standard and test samples. (3) The dissociation time was determined based on the reference standard, which could generate a moderate dissociation change for the reference standard. 4) The Rmax value of the reference standard was nearly 100 RU for monomeric antigens. The similar antibody capture levels were applied for the reference standard and test samples.
Biacore relative active concentration
The relative active concentrations of test samples versus the reference standard were determined using Biacore 8K from Cytiva. The antigen protein was immobilized on the CM5 sensor chip by amine coupling strategy dissolved in the acetate pH 5.0 solution to reach a relatively high coupling density of nearly 3600 RU. A serial dilution of standard antibodies with concentrations from 0.5 to 8 µg/mL was separately injected for 10 s. The binding responses at the stability stage were recorded and used to set up a calibration curve. All the samples were diluted to 4 µg/mL using the running buffer of HBS-EP+ and then injected at a flow rate of 30 μL/min at 25°C, followed by regeneration of the glycine pH 2.1 solution injection for 30 s. Based on the calibration curve, the active concentrations of antibodies were calculated. Normalized to the initial sample, relative active concentrations of test samples were obtained.
Abbreviations
| CDR | = | Complementarity-Determining Region |
| CE-SDS | = | Sodium Dodecyl Sulfate Capillary Electrophoresis |
| CMC | = | Chemistry, Manufacturing, and Control |
| CQAs | = | Critical Quality Attributes |
| deaN | = | deamidated Asparagine |
| ELISA | = | Enzyme-Linked ImmunoSorbent Assay |
| HC | = | Heavy Chain |
| isoD | = | isoAspartate |
| ka | = | Association Rate Constant |
| kd | = | Dissociation Rate Constant |
| KD | = | Equilibrium Dissociation Constant |
| LC | = | Light Chain |
| MOAs | = | Mechanism Of Actions |
| PTMs | = | Post-Translational Modifications |
| QbD | = | Quality by Design |
| Rmax | = | Maximum Binding Response |
| SEC | = | Size Exclusion Chromatography |
| SD | = | Standard Deviation |
| SPR | = | Surface Plasmon Resonance |
| SST | = | System Suitability Testing |
| WT | = | Wild Type |
Author contributions
S.W. designed the study and analyzed the data. Y.W. and Z.L. performed most experiments with help from Y.H., Z.W., and J.F. Q.W., Y.G., X.Z., G.C., C.C., and Y.W. provided antibodies. S.W. and Y.F. wrote the paper.
Supplementary Figure 3.pptx
Download MS Power Point (1.5 MB)Supplemental_material.docx
Download MS Word (3.1 MB)Supplementary Figure 1.pptx
Download MS Power Point (3 MB)Supplementary Figure 4.pptx
Download MS Power Point (4.1 MB)Supplementary Figure 5.pptx
Download MS Power Point (296.9 KB)Supplementary Figure 2.pptx
Download MS Power Point (1.6 MB)Acknowledgments
We thank all the members from the biopharmaceutical discovery who helped us by providing the antibodies and antigens for method development. We thank Dr. Zhuoxiao Cao for her support and helpful discussion. We thank the anonymous reviewers for their insightful comments and suggestions.
Disclosure statement
No potential conflict of interest was reported by the author(s).
Data availability statement
All the experimental data that support the findings of this study are presented in the main text and the supplemental material. For more information please contact to the corresponding author Shuai Wang.
Supplementary material
Supplemental data for this article can be accessed online at https://doi.org/10.1080/19420862.2024.2374607
Additional information
Funding
References
- Kaplon H, Crescioli S, Chenoweth A, Visweswaraiah J, Reichert JM. Antibodies to watch in 2023. Mabs-austin. 2023;15(1):2153410. doi:10.1080/19420862.2022.2153410. PMID:36472472.
- Carter PJ, Lazar GA. Next generation antibody drugs: pursuit of the ‘high-hanging fruit’. Nat Rev Drug Discov. 2018;17(3):197–14. doi:10.1038/nrd.2017.227. PMID:29192287.
- The Antibody Society. Therapeutic monoclonal antibodies approved or in regulatory review. [accessed 2024 June 24]. www.antibodysociety.org/antibody-therapeutics-product-data.
- Dimasi JA, Feldman L, Seckler A, Wilson A. Trends in risks associated with new drug development: success rates for investigational drugs. Clin Pharmacol Ther. 2010;87(3):272–77. doi:10.1038/clpt.2009.295. PMID:20130567.
- Reichert JM, Rosensweig CJ, Faden LB, Dewitz MC. Monoclonal antibody successes in the clinic. Nat Biotechnol. 2005;23(9):1073–78. doi:10.1038/nbt0905-1073. PMID:16151394.
- Sawant MS, Streu CN, Wu L, Tessier PM. Toward Drug-Like Multispecific Antibodies by Design. Int J Mol Sci. 2020;21(20):7496. doi:10.3390/ijms21207496. PMID:33053650.
- Reichert JM. Metrics for antibody therapeutics development. MAbs. 2010;2(6):695–700. dx.10.4161/mabs.2.6.13603. PMID:20930555.
- Jain T, Sun T, Durand S, Hall A, Houston NR, Nett JH, Sharkey B, Bobrowicz B, Caffry I, Yu Y. et al. Biophysical properties of the clinical-stage antibody landscape. Proc Natl Acad Sci USA. 2017;114(5):944–49. doi:10.1073/pnas.1616408114. PMID:28096333.
- Jiang XR, Song A, Bergelson S, Arroll T, Parekh B, May K, Chung S, Strouse R, Mire-Sluis A, Schenerman M. Advances in the assessment and control of the effector functions of therapeutic antibodies. Nat Rev Drug Discov. 2011;10(2):101–11. doi:10.1038/nrd3365. PMID:21283105.
- Papadopoulos N, Martin J, Ruan Q, Rafique A, Rosconi MP, Shi E, Pyles EA, Yancopoulos GD, Stahl N, Wiegand SJ. Binding and neutralization of vascular endothelial growth factor (VEGF) and related ligands by VEGF Trap, ranibizumab and bevacizumab. Angiogenesis. 2012;15(2):171–85. doi:10.1007/s10456-011-9249-6. PMID:22302382.
- Cohenuram M, Saif MW. Panitumumab the first fully human monoclonal antibody: from the bench to the clinic. Anticancer Drugs. 2007;18(1):7–15. doi:10.1097/CAD.0b013e32800feecb. PMID:17159497.
- Lee JY, Lee HT, Shin W, Chae J, Choi J, Kim SH, Lim H, Won Heo T, Park KY, Lee YJ. et al. Structural basis of checkpoint blockade by monoclonal antibodies in cancer immunotherapy. Nat Commun. 2016;7(1):13354. doi:10.1038/ncomms13354. PMID:27796306.
- de Haij S, Jansen JH, Boross P, Beurskens FJ, Bakema JE, Bos DL, Martens A, Verbeek JS, Parren PW, van de Winkel Jg. et al. In vivo cytotoxicity of type I CD20 antibodies critically depends on Fc receptor ITAM signaling. Cancer Res. 2010;70(8):3209–17. doi:10.1158/0008-5472.CAN-09-4109. PMID:20354182.
- Weng WK, Levy R. Two immunoglobulin G fragment C receptor polymorphisms independently predict response to rituximab in patients with follicular lymphoma. J Clin Oncol. 2003;21(21):3940–47. doi:10.1200/JCO.2003.05.013. PMID:12975461.
- Cartron G, Dacheux L, Salles G, Solal-Celigny P, Bardos P, Colombat P, Watier H. Therapeutic activity of humanized anti-CD20 monoclonal antibody and polymorphism in IgG Fc receptor FcgammaRIIIa gene. Blood. 2002;99(3):754–58. doi:10.1182/blood.v99.3.754. PMID:11806974.
- Alt N, Zhang TY, Motchnik P, Taticek R, Quarmby V, Schlothauer T, Beck H, Emrich T, Harris RJ. Determination of critical quality attributes for monoclonal antibodies using quality by design principles. Biologicals. 2016;44(5):291–305. doi:10.1016/j.biologicals.2016.06.005. PMID:27461239.
- ICH. Guideline Q5C. Stability Testing of Biotechnological/Biological Products. International Conference on Harmonisation; 1996.
- ICH. Guideline Q6B. specifications: test procedures and acceptance criteria for biotechnological/biological products. International Conference on Harmonisation; 1999.
- Yang X, Xu W, Dukleska S, Benchaar S, Mengisen S, Antochshuk V, Cheung J, Mann L, Babadjanova Z, Rowand J. et al. Developability studies before initiation of process development: improving manufacturability of monoclonal antibodies. MAbs. 2013;5(5):787–94. doi:10.4161/mabs.25269. PMID:23883920.
- United States Pharmacopeia. General Information/(1105)Immunological Test Methods-Surface Plasmon Resonance. USP-NF. Rockville, MD: United States Pharmacopeia; 2024. doi:10.31003/USPNF_M3070_03_01.
- Japanese Pharmacopoeia (JP17) General Information/Biotechnological/Biological Products-Surface Plasmon Resonance. 2474–78. 2016
- Haberger M, Bomans K, Diepold K, Hook M, Gassner J, Schlothauer T, Zwick A, Spick C, Kepert JF, Hienz B. et al. Assessment of chemical modifications of sites in the CDRs of recombinant antibodies: Susceptibility vs. functionality of critical quality attributes. MAbs. 2014;6(2):327–39. doi:10.4161/mabs.27876. PMID:24441081.
- Schräml M, Biehl M. Kinetic screening in the antibody development process. Methods Mol Biol. 2012;901:171–81. doi:10.1007/978-1-61779-931-0_11. PMID:22723101.
- DiCara DM, Andersen N, Chan R, Ernst JA, Ayalon G, Lazar GA, Agard NJ, Hilderbrand A, Hötzel I. High-throughput screening of antibody variants for chemical stability: identification of deamidation-resistant mutants. MAbs. 2018;10(7):1073–83. doi:10.1080/19420862.2018.1504726. PMID: 30130444.
- Karlsson R, Pol E, Å F. Comparison of surface plasmon resonance binding curves for characterization of protein interactions and analysis of screening data. Anal Biochem. 2016;502:53–63. doi:10.1016/j.ab.2016.03.007. PMID: 27019155.
- Lietz CB, Deyanova E, Cho Y, Cordia J, Franc S, Kabro S, Wang S, Mikolon D, Banks DD. Identification of tyrosine sulfation in the variable region of a bispecific antibody and its effect on stability and biological activity. MAbs. 2023;15(1):2259289. doi:10.1080/19420862.2023.2259289. PMID: 37742207.
- Chen L, Wang L, Shion H, Yu C, Yu YQ, Zhu L, Li M, Chen W, Gao K. In-depth structural characterization of Kadcyla® (ado-trastuzumab emtansine) and its biosimilar candidate. MAbs. 2016;8(7):1210–23. doi:10.1080/19420862.2016.1204502. PMID:27380163.
- Vaish A, Lin JS, Hj M, Grandsard PJ, Chen Q. Binding affinity determination of therapeutic antibodies to membrane protein targets: Kinetic Exclusion Assay using cellular membranes for anti-CD20 antibody. Anal Biochem. 2020;609:113974. doi:10.1016/j.ab.2020.113974. PMID:33010205.
- Yi M, Sun J, Sun H, Wang Y, Hou S, Jiang B, Xie Y, Ji R, Xue L, Ding X. et al. Identification and characterization of an unexpected isomerization motif in CDRH2 that affects antibody activity. MAbs. 2023;15(1):2215364. doi:10.1080/19420862.2023.2215364. PMID: 37229604.
- U.S. Food and Drug Administration. Analytical procedures and methods validation for drugs and biologics: guidance for industry. 2015.
- Rathore AS, Winkle H. Quality by design for biopharmaceuticals. Nat Biotechnol. 2009;27(1):26–34; dx.10.1038/nbt0109-26. PMID:19131992.
- Xu Y, Wang D, Mason B, Rossomando T, Li N, Liu D, Cheung JK, Xu W, Raghava S, Katiyar A. et al. Structure, heterogeneity and developability assessment of therapeutic antibodies. MAbs. 2019;11(2):239–64. doi:10.1080/19420862.2018.1553476. PMID:30543482.
- Raybould MIJ, Marks C, Krawczyk K, Taddese B, Nowak J, Lewis AP, Bujotzek A, Shi J, Deane CM. Five computational developability guidelines for therapeutic antibody profiling. Proc Natl Acad Sci USA. 2019;116(10):4025–30. doi:10.1073/pnas.1810576116. PMID:30765520.
- Berkhout LC, l’Ami Mj, Ruwaard J, Hart MH, Heer PO, Bloem K, Nurmohamed MT, van Vollenhoven Rf, Boers M, Alvarez DF. et al. Dynamics of circulating TNF during adalimumab treatment using a drug-tolerant TNF assay. Sci Transl Med. 2019;11(477):eaat3356. doi:10.1126/scitranslmed.aat3356. PMID:30700574.
- Harris RJ, Kabakoff B, Macchi FD, Shen FJ, Kwong M, Andya JD, Shire SJ, Bjork N, Totpal K, Chen AB. Identification of multiple sources of charge heterogeneity in a recombinant antibody. J Chromatogr B Biomed Sci Appl. 2001;752(2):233–45. doi:10.1016/s0378-4347(00)00548-x. PMID:11270864.
- Maadi H, Soheilifar MH, Choi WS, Moshtaghian A, Wang Z. Trastuzumab Mechanism of Action; 20 Years of Research to Unravel a Dilemma. Cancers (Basel). 2021;13(14):3540. doi:10.3390/cancers13143540. PMID:34298754.