
ABSTRACT
Monoclonal antibodies (mAb) and other biological drugs are affected by enzymatic polysorbate (PS) degradation that reduces product stability and jeopardizes the supply of innovative medicines. PS represents a critical surfactant stabilizing the active pharmaceutical ingredients, which are produced by recombinant Chinese hamster ovary (CHO) cell lines. While the list of potential PS-degrading CHO host cell proteins (HCPs) has grown over the years, tangible data on industrially relevant HCPs are still scarce. By means of a highly sensitive liquid chromatography-tandem mass spectrometry method, we investigated seven different mAb products, resulting in the identification of 12 potentially PS-degrading hydrolases, including the strongly PS-degrading lipoprotein lipase (LPL). Using an LPL knockout CHO host cell line, we were able to stably overexpress and purify the remaining candidate hydrolases through orthogonal affinity chromatography methods, enabling their detailed functional characterization. Applying a PS degradation assay, we found nine mostly secreted, PS-active hydrolases with varying hydrolytic activity. All active hydrolases showed a serine-histidine-aspartate/glutamate catalytical triad. Further, we subjected the active hydrolases to pH-screenings and revealed a diverse range of activity optima, which can facilitate the identification of residual hydrolases during bioprocess development. Ultimately, we compiled our dataset in a risk matrix identifying PAF-AH, LIPA, PPT1, and LPLA2 as highly critical hydrolases based on their cellular expression, detection in purified antibodies, active secretion, and PS degradation activity. With this work, we pave the way toward a comprehensive functional characterization of PS-degrading hydrolases and provide a basis for a future reduction of PS degradation in biopharmaceutical drug products.
Introduction
Enzymatic polysorbate (PS) degradation in biological drug formulations mediated by host cell proteins (HCPs) has become a widespread and acute challenge in the biopharmaceutical industry. As an indispensable surfactant, PS is used in drug formulations to prevent biopharmaceutical agents, often monoclonal antibodies (mAbs), from aggregation and minimizes surface adhesion and air-liquid interfacial stress.Citation1 PS is a heterogeneous mixture consisting of a hydrophilic polyoxyethylene sorbitan head group that is esterified to one or multiple hydrophobic fatty acids of varying length. Degradation of PS is driven via two independent pathways: Chemical degradation by auto-oxidation or hydrolysis and enzymatic degradation elicited by hydrolytic enzymes.Citation1 Chemical degradation has been successfully prevented by the use of buffering agents and anti-oxidants,Citation2–4 leaving hydrolytic enzymes acting on ester bonds (Enzyme class 3.1) as the major root cause of PS degradation. These enzymes are secreted in the bioprocess as HCPs originating from production cell lines derived from Chinese hamster ovary (CHO) cells.Citation5–8 Here, a small portion of hydrolytic HCPs that are particularly difficult to remove persist in the downstream purification process and eventually cause hydrolytic cleavage of PS in drug substance and drug product. The degradation of PS results in the accumulation of free fatty acid aggregates and associated (sub-)visible particle formation. This can adversely affect product safety and quality because these aggregates can potentially induce adverse immune responses, reduce product efficacy, or compromise its stability. In recent years, substantial effort has been put into the identification and characterization of potential HCPs acting on the ester bonds of PS.Citation9–14 One prominent example is Phospholipase B-Like 2 (PLBL2), which was long considered an active polysorbate-degrading HCP due to misinterpretation of results from contaminated recombinant HCP samples. This example highlights the importance of a well-designed purification and characterization strategy for recombinant HCPs to avoid misleading data interpretation as a result of persisting impurities.Citation15 As hydrolytic HCPs were found to cause PS degradation at trace levels, <10 ppm,Citation8 detection of these low-abundance enzymes represents a major analytical challenge for the biopharmaceutical community. Therefore, new innovative analytical methods were developed, including optimized sample preparation prior to mass spectrometric analysisCitation9–12 and activity-based protein profiling.Citation13,Citation14,Citation16 To date, advances in HCP detection have resulted in a comprehensive list of potentially PS-degrading protein contaminants detected at various stages of the bioprocess, but data regarding their enzymatic activity profiles against PS and an understanding of the impact of the downstream purification processes on these enzymes are still lacking. A less explored but promising approach to address this issue is the recombinant overexpression and simultaneous screening of multiple putative polysorbate-degrading HCPs, especially the hydrolase species.
Toward this end, we identified, systematically overexpressed and characterized a selected list of potentially critical CHO cell-derived hydrolases, which were previously detected in seven purified model mAb products via a state-of-the-art mass spectrometry approach. We further used a transposase-based expression system in combination with a newly established lipoprotein lipase (LPL) knockout CHO host cell line to generate stable cell pools expressing the candidate hydrolases in high yields, without contamination of LPL and by entailing Streptavidin (Strep)- and Histidine (His)-affinity tags. The latter enabled the implementation of orthogonal purification steps, ensuring high purity of the recombinantly expressed CHO hydrolases. Characterization studies with the purified hydrolases, including cellular localization data, activity testing toward PS degradation and pH activity profiling, were conducted. Finally, by compiling all data, we were able to build a knowledge base that assists in the prioritization and risk assessment of critical CHO cell-derived hydrolases at different points throughout the entire biopharmaceutical production process.
Results
Identification of hydrolytic host cell proteins in formulated mAb products
By means of a highly sensitive liquid chromatography-tandem mass spectrometry (LC-MS/MS) technique (down to 0.3 ppm), 7 mAb products were analyzed for their residual hydrolase content. Of note, the analyzed mAb products were industrially relevant molecules that were purified through a chemistry, manufacturing, and controls (CMC) bioprocess and were formulated to simulate preparation for clinical application. Across all investigated products, 12 hydrolytic enzymes acting on ester bonds (enzyme class, EC 3.1) were identified ().
Table 1. List of hydrolytic host cell proteins of the enzyme class 3.1, identified at least once in LC/MS-MS analyses of seven different antibody formulations.
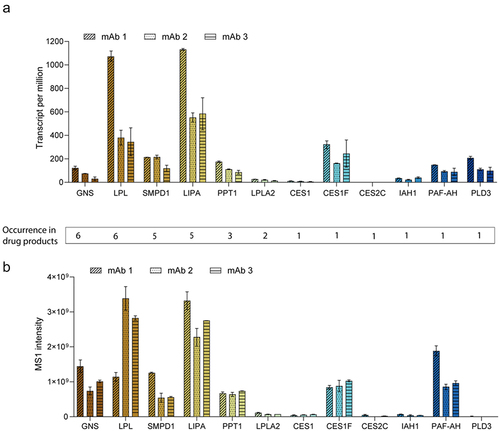
Although all mAb products were expressed using the same CHO expression platform, the number of identified hydrolases in the purified antibody products varied from 1 to 6 of the seven investigated samples. LPL, GNS, and SMPD1 were frequently identified as hydrolases, but others (CES2C, CES1(F), PLD3, IAH1, PAF-AH) were only found in single products. To investigate whether the expression of identified hydrolases correlated with their frequency of occurrence in purified antibodies, we analyzed previously compiled transcriptomics and proteomics data sets of three different, representative cell-line development campaigns (). Overall, a high and statistically significant correlation between transcriptome and proteome data was observed for all three mAb datasets (Suppl. Figure S1). Strikingly, for LPL, a frequently mentioned hydrolase in the context of PS degradation,Citation9,Citation13,Citation14,Citation17 the high occurrence in many mAb products correlated with high mRNA and protein expression in all investigated production cell lines. This was also true for SMPD1 and LIPA, although here high expression values correlated only with identification in 5 and 3 of the 7 analyzed mAb products, respectively. The hydrolases CES1F and PAF-AH showed high gene and protein expression although it was only found in one of the investigated mAb formulations. The other identified hydrolases were expressed at much lower levels and occurrence of identification was low, except for GNS, which was identified in 6 of 7 products (). In conclusion, expression of hydrolases varies substantially in CHO cells and mRNA and protein expression levels are not sufficiently predictive of the occurrence and abundance of the hydrolase in mAb products, which is probably due to unique interactions of difficult-to-remove hydrolases with the product and/or the chromatography columns.
Figure 1. (a) Gene expression data in transcripts per million of potentially PS-degrading hydrolases identified in drug products. Transcript data of producer cell lines from three different campaigns are depicted. One clone each (two timepoints, n = 2) was analyzed for monoclonal antibody (mAb) 1 and 2 and a producer pool (one timepoint, n = 24) was analyzed for mAb 3. Data are sorted in descending order according to their occurrence in seven investigated drug products. (b) Relative protein abundance (MS1 intensity) of potentially PS-degrading hydrolases identified in drug products. Protein expression data in cell culture supernatant from three different campaigns are depicted. One clone each (technical triplicates, n = 3) was analyzed for mAb 1 and 2 and a producer pool (technical duplicates, n = 2) was analyzed for mAb 3.
Knockout of PS-degrading LPL in CHO cells to allow for unbiased HCP characterizations
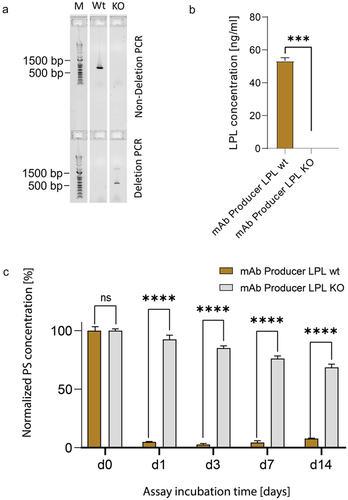
As LPL was most frequently identified in mAb product formulations, expressed at the highest level in CHO production cells and previously suggested as a source for substantial PS degradation,Citation17 we aimed to investigate the extent of LPL-related PS degradation in our platform process. Therefore, LPL was knocked out (KO) in an mAb-producing CHO cell line using CRISPR/Cas9 genome editing technology. A combination of two different polymerase chain reaction (PCR) experiments validated the complete bi-allelic removal of the LPL gene in the engineered production cell line (). The KO production cell line was fed-batch cultivated head-to-head with the respective originator mAb production cell line (expressing LPL) over a period of 14 days in an ambr®250 bioreactor system. Supernatant sampled on day 3 of the fed-batch process was measured using LPL enzyme-linked immunosorbent assay (ELISA), which confirmed the absence of LPL protein in samples of the LPL KO cell line (). Next, supernatant harvested at day 14 of the cultivation process was subjected to a fluorescence micelle assay (FMA) measuring PS20 degradation over time at five different time points post PS spiking (d0, d1, d3, d7, d14) (). Strikingly, in the supernatant of the non-edited parental CHO production clone (LPL wildtype (wt)), 95% of initially spiked PS content was degraded after one day of incubation. In contrast, the supernatant of LPL KO production cells elicited a significantly slower PS degradation rate resulting in only 7% degradation of initial PS levels after one day of incubation and 31% degradation after 14 days. While these data suggest a major PS-degrading activity by LPL, the observed residual PS-degrading activity clearly suggests that further hydrolases contribute to the total PS degradation activity. Therefore, an LPL KO cell line would certainly serve as an improved manufacturing host cell line for biologics, but also represents an ideal host cell line to characterize the additionally present hydrolases without the substantially masking PS degradation activity of LPL.
Figure 2. (a) Agarose gel electrophoresis for verification of biallelic lipoprotein lipase (LPL) knockout (KO) in mAb producer LPL KO (KO) versus mAb producer LPL wildtype (Wt). Deletion PCR and non-deletion PCR were performed with genomic DNA. Lack of bands in non-deletion PCRs indicates biallelic deletion. M = Marker. (b) LPL concentration in day 3 fed-batch samples of mAb producer cell lines with and without LPL KO. Cell lines were cultured head-to-head in an ambr®250 system and harvested cell culture supernatant was subjected to an LPL ELISA. (c) Polysorbate degradation in fed-batch samples of mAb producer cell lines with (brown) and without (gray) LPL assayed over a 14-day period. Cell lines were cultured head-to-head over 14 days in an ambr®250 system and harvested cell culture supernatant was subjected to a fluorescence micelle assay. Statistical significance was tested using ordinary two-way ANOVA with Šídák’s Multiple Comparison Test. p < 0.05 was considered as statistically significant. ns = not significant.
Secretion analysis of CHO hydrolases
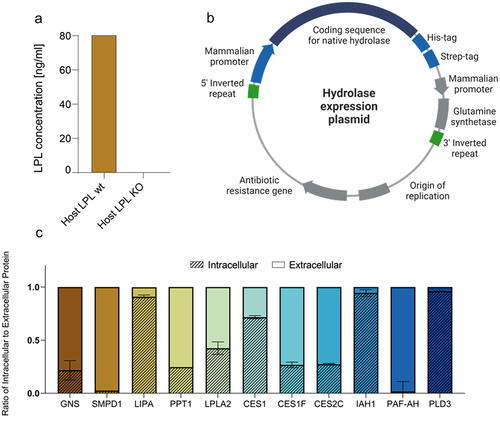
In order to characterize the additional hydrolases previously identified in mAb products and to analyze their potential PS degradation activity (), the remaining 11 CHO hydrolases were individually overexpressed in a CHO K1 glutamine synthetase (GS) LPL KO host cell line to avoid the masking potential of LPL. Here, the KO was realized via zinc finger nucleases (ZFN) and validated using LPL ELISA (). Native CHO coding sequences of the 11 hydrolases, containing no additional signal sequence, were cloned into a transposon expression plasmid including His- and Strep-Tags at the 3’-end of the hydrolase gene (). Next, transposon plasmids were stably introduced in the CHO K1 GS LPL KO host cell line using a transposase technology in combination with a GS-based metabolic selection approach to generate stable hydrolase expressing pools. As many of the identified hydrolases were annotated by UniProt as intracellular proteins, we wondered why potentially intracellular hydrolases were identified in the harvested supernatant and ultimately in the formulated mAb products. To determine whether the hydrolases are actively secreted into the supernatant, their localization in supernatant and cell pellet was quantified via the His-Tag after a three-day batch cultivation of all generated hydrolase overexpressing cell pools that displayed >98% viable cells at harvest (Supplementary Figure S2a). While the hydrolases PAF-AH and SMPD1 were fully secreted by the CHO cells, other proteins, including CES1F, CES2C, GNS, LPLA2, and PPT1, were partially detected in the intracellular fraction. Only LIPA, IAH1, and PLD3 were mainly localized intracellularly (). Other than PLD3, LIPA and IAH1 could be quantified in supernatant of the 3 mAb producer cell lines (), which might be due to mAb-HCP shuttling mechanisms or simply a reduced harvest viability of the assayed cell culture (59, 84, 88% for mAb1, 2, 3, respectively). As most of the overexpressed native CHO hydrolases are actively secreted, their occurrence in mAb products is not surprising.
Figure 3. (a) LPL concentration in day 3 fed-batch samples of mAb host cell lines with and without LPL KO. Cell lines were cultured head-to-head in an ambr®15 system and harvested cell culture supernatant was subjected to an LPL ELISA. (b) Hydrolase expression plasmid suitable for transposase-mediated stable transfection via inverted repeats recognition sites. His- and Strep- tags were added at the 3‘-end of the sequence coding for the native hydrolase. Glutamine synthetase was used for stable selection. Created by BioRender. (c) Relative protein amounts of expressed hydrolases as the ratio of intracellular to extracellular protein. Hydrolases were quantified using biolayer interferometry with his2 sensors on the Octet system. Average values of two replicates with standard deviations are shown.
Hydrolytic activity of CHO hydrolases against polysorbate
Next, we aimed for a detailed characterization of all overexpressed CHO hydrolases regarding their PS degradation potential. All stable hydrolase-expressing cell pools were cultivated in (fed-) batch mode and supernatants were harvested (Supplementary Figure S2b). The crude supernatant was spiked with PS (0.4 mg/mL) and PS degradation was investigated over a period of 14 days via FMA. Strong PS degradation activity was measured for hydrolases CES1F, CES2C, PPT1, and PAF-AH (). Furthermore, moderate PS degradation was elicited by LPLA2, and IAH1, while no PS degradation was observed in supernatants of cell pools overexpressing GNS, SMPD1, LIPA, CES1, and PLD3, which also served as a comparative baseline. Notably, the crude culture supernatant does not allow for the determination of the exact PS degradation activity for each enzyme, as the supernatant likely contained additional hydrolases or lacked hydrolases that are not efficiently secreted. Thus, for direct comparison with uniform starting concentrations, we developed a multi-step purification strategy to obtain highly purified protein. Toward this end, overexpressed proteins were purified from harvested cell culture supernatant or cell pellets using a combination of two orthogonal capture steps comprising an immobilized metal ion affinity column (IMAC) specifically binding the His-Tag on the recombinant hydrolases followed by a Strep-Tactin column to further capture the Strep-tagged hydrolases. In addition, size exclusion chromatography (SEC) was performed as a polishing step and for aggregate removal. After purification, the CHO hydrolases were tested for their catalytic activity toward PS20 via FMA. Contrary to the FMA performed with crude supernatant, purified enzymes were spiked at uniform concentrations in a formulation buffer containing PS20 and PS degradation was investigated over a period of 14 days as described before (). In contrast to the previous analysis of crude cell culture supernatant, purified CES1, IAH1, and LIPA now showed strong PS degradation activity. This observation aligns with the fact that these enzymes are not secreted and, as a result, are not present in the crude supernatant (see ). Strikingly, LPLA2 and PAF-AH now displayed the strongest PS degradation activity among all assayed hydrolases. For CES1F and CES2C, similar PS degradation was observed, while the hydrolase PPT1 now exhibited lower PS degradation activity as a purified enzyme. As before, GNS, SMPD1 and PLD3 displayed no PS degradation potential. Besides the above-mentioned drawbacks when measuring crude cell culture supernatant, it is important to note that the stability or aggregation of purified enzymes can influence the observed activity levels over time. In comparison with other hydrolases, PPT1 was particularly prone to aggregation during the purification process (Supplementary Figure S3).
Figure 4. (a) Polysorbate (PS) degradation over time of crude cell culture supernatant of hydrolase expressing cell lines determined via the fluorescence micelle assay. Cell culture supernatants of (fed-)batch fermentations were diluted in PS-spiked fresh cultivation medium and degradation was monitored over 14 days (d0, d1, d3, d7, d14). PS concentration was normalized to the initial PS concentration on d0. Average values of four technical replicates with standard deviations are shown. (b) PS degradation over time of purified hydrolases determined via the fluorescence micelle assay. Purified hydrolases were spiked into a formulation buffer to a final concentration of 20 µg/mL and degradation was monitored over 14 days (d0, d1, d3, d7, d14). PS concentration was normalized to the initial PS concentration on d0. Average values of four technical replicates with standard deviations are shown.
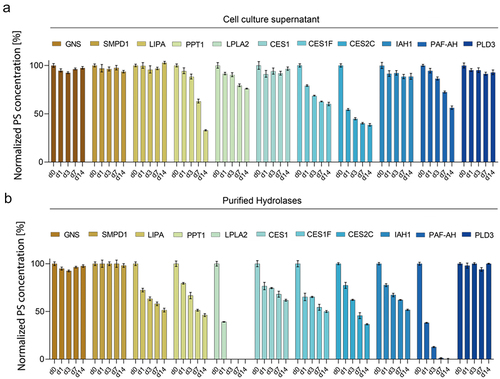
These experiments showed that hydrolase-containing crude cell culture supernatant can provide an initial indication of hydrolase-specific PS degradation potential, but purification of specific hydrolases is necessary to determine their specific enzymatic activity. In summary, 8 of 11 hydrolases previously identified in the mAb formulations displayed significant PS degradation activity. Of note, enzyme activity was measured under uniform pH conditions, whereby individual pH optima of the enzymes were not considered.
Comparison of active sites in the CHO hydrolases
To identify common features among the identified active hydrolases, we compared the active sites of both PS degrading and non-degrading hydrolases. We determined the active site residues of the CHO hydrolases by referring to UniProt annotations. In addition, we compared the protein sequences to orthologous enzymes with experimentally determined active sites (). A common catalytic triad consisting of a serine (Ser) – histidine (His) – aspartate/glutamate (Asp/Glu) motif was identified in PS-degrading hydrolases, which distinguished them from non-PS degrading enzymes ().
Table 2. Active site residues of hydrolases identified in seven industrial mAb formulations. Residues based on indicated literature and UniProt.
Enzymes with alternative catalytic sites (GNS, PLD3, and SMPD1) did not exhibit PS degradation activity. This finding is particularly valuable when new hydrolases are identified, as it provides a clear marker of potential PS degradation activity. It is important to note that previous research has shown that PS-degrading hydrolases are not limited to the enzyme sub-class of “carboxylic ester hydrolases” (3.1.1).Citation9 In fact, they can also be found within the broader enzyme class “acting on ester bonds” (3.1), which includes not only carboxylic-ester hydrolases but also thioester and phosphoester hydrolases, among others. This underscores the diverse enzymatic landscape involved in PS degradation and highlights the importance of the conserved catalytic triad as a predictive marker for PS degradation activity.
pH dependent activity of hydrolytic HCPs
The activity optimum of enzymes is strongly dependent on an ideal pH.Citation31 To further characterize and evaluate the pH optima of each identified hydrolase acting on PS, pH screenings with the purified enzymes were conducted (). Here, enzymatic activity was measured upon cleavage of ester bonds in an assay using 4-methylumbelliferyl decanoate (MUD4) as a PS surrogate. LIPA and LPLA2 displayed unique activity profiles with activity optima in a neutral or acidic pH, respectively. In contrast, the group of CES1, CES2C, IAH1, and PAF-AH revealed similar pH-dependent activity patterns with low activity in the low pH range and increasing activity with increasing pH values. Equally, the group of CES1F and PPT1 displayed pH optima at strongly basic pH values, while here activity at lower pH was also relatively high.
Figure 5. (a) pH dependent activity of the eight active hydrolases after purification. Values are normalized to highest activity of the respective hydrolase. Average values of duplicate analyses are shown. (b) Normalized hydrolytic activities of three mAb samples after the second polishing step at different pH values. Values are normalized to highest activity of the respective mAb sample. Average values of duplicate analyses are shown.
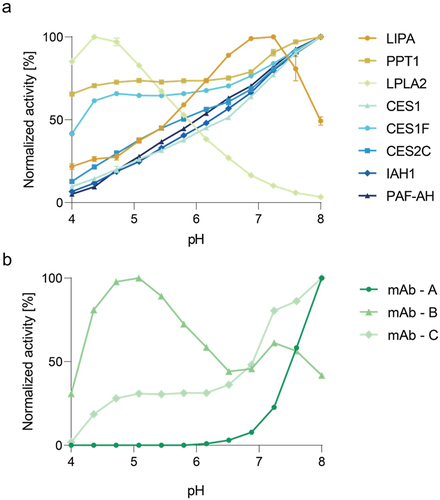
As the investigated hydrolases showed various pH-dependent activity profiles, this property might be harnessed to identify or exclude residual hydrolases in final drug products. To test this hypothesis, the ester cleaving activity of three model mAb formulations was analyzed in the same way as in the above-described pH screenings (). Varying pH-dependent PS degrading activities were observed, which may indicate the presence of various residual hydrolases with unique pH optima. mAb formulation A showed strong activity toward higher (basic) pH values, but no enzymatic activity under acidic pH conditions. In contrast, mAb formulation B displayed strong similarities to the combined activity profiles of LPLA2 and LIPA. Lastly, mAb formulation C also showed strong activity toward higher pH values. However, unlike mAb A, mAb C revealed a medium activity in the acidic pH range, suggesting the presence of CES1F and/or PPT1. In conclusion, differing pH activity profiles might be used to infer the presence or absence of specific hydrolases and could be a valuable resource when considering pH values of mAb formulation buffers.
CHO hydrolase risk matrix
In a final step, gathered data about actively PS-degrading hydrolases were summarized in a risk matrix (), which can serve as a guideline for prioritizing potentially critical HCPs for targeted removal or monitoring during bioprocess development. Based on identified values for gene expression, occurrence in mAb products, cellular localization, and the PS degradation activity, risk points were assigned and ranked in a final score. All risk categories were weighted equally (for rating approach, see Supplementary Table S1). The pH-dependent hydrolase activity was not incorporated into the risk matrix, as this factor is specific to the formulation buffer and must be assessed individually. Of note, proteomic data were not part of the risk matrix, as quantitative proteomic datasets may not be readily available for biopharmaceutical production processes.
Figure 6. Risk matrix summarizing investigated host cell protein (HCP) parameters. Only PS-degrading hydrolases are compared. Color gradient from green to red represents increasing risk of the HCP’s presence in drug product and/or causing PS degradation. Final score can be used for prioritization of HCP removal.
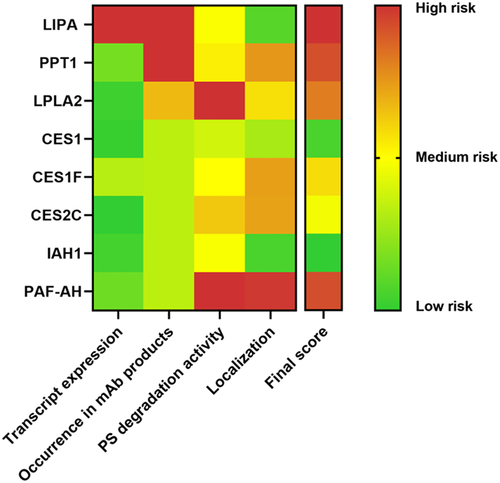
Furthermore, we were able to demonstrate strong correlation between proteome and transcriptome datasets (supported by localization data). As a result of this assessment, top ranked and thus to be prioritized in removal during the bioprocess are the hydrolases LIPA, PPT1, PAF-AH, and LPLA2, which all showed strong PS degradation activity likely catalyzed by the Ser, His, Asp/Glu triad. Among these, LIPA was the only intracellular hydrolase and was also highly expressed on mRNA level, thus rendering this enzyme particularly critical for bioprocesses with low cell viability or high cell lysis at the end of the fermentation and/or during harvest. LPLA2 and PAF-AH both displayed high PS degradation capacity, for PAF-AH in combination with efficient secretion, which rendered it with the higher risk score. IAH1 has the lowest risk score because it combined medium PS activity, intracellular localization and comparably low mRNA expression. This risk matrix can be used as a guideline to focus on the most critical PS-degrading HCPs in a CHO-based manufacturing process and helps to ensure efficient use of resources.
Discussion
Removal of PS-hydrolyzing HCPs from biologic products has proven challenging to the biopharmaceutical industry, jeopardizing the supply of innovative medicine.Citation1,Citation5,Citation6,Citation17 Thus, the identification and characterization of hydrolytic HCPs are crucial for understanding their potential impact on product stability, efficacy, and safety. In this study, we characterized 12 hydrolytic enzymes potentially acting on PS that were identified in seven different mAb preparations. Our results suggest that the presence of specific HCPs in purified mAbs is influenced by factors beyond gene expression levels, which is in line with literature on difficult-to-remove HCPs. Here, final formulation “contaminating” HCPs are reported to persist purification either via product association or co-elution due to product-resembling physicochemical protein properties.Citation32–36
In line with the previous work of Chiu et al., our study highlighted the importance of LPL as a major contributor to PS degradation.Citation17 Nevertheless, a CRISPR/Cas9 mediated LPL KO alone was not able to halt PS degradation completely, explaining the increasing efforts put into identification and characterization of additional hydrolytic HCPs.Citation9,Citation13,Citation14
By the systematic overexpression of hydrolytic HCPs other than LPL, we aimed for a system enabling the detailed characterization and, thus, a comprehensive risk assessment, of potentially critical CHO cell-derived HCPs acting on PS. We successfully demonstrated that hydrolase-containing crude cell culture supernatant can be applied in a PS degradation assay, providing strong indications toward hydrolase-specific PS degradation. In fact, only LIPA, IAH1, and CES1 did not confirm the results obtained with the purified hydrolases, which is probably due to their intracellular localization.
Following hydrolase purification, FMA data confirmed the list of PS-critical HCPs previously identified by several different groups.Citation6,Citation8,Citation9,Citation17,Citation37 In our study, we observed that the hydrolase SMPD1 was not active against PS, which presents a discrepancy with the findings reported in literature.Citation37,Citation38 Kovner et al. demonstrated very weak activity of SMPD1 against PS. However, it is important to consider that this could be attributed to residual HCPs, as only one affinity tag was used to purify hydrolases. In our study, we successfully purified SMPD1 as confirmed by a size exclusion chromatogram and Western blot against the C-terminal His tag (Suppl. Figure S4a). Furthermore, comparison of the separations of a SEC protein standard mixture and SMPD1 shows that the protein elutes according to the apparent molecular weight of the monomer (72 kDa), demonstrating that no aggregation has occurred (Suppl. Figure S4b). To our knowledge, our work is the first to include three orthogonal capture steps for hydrolase purifications and activity data based on a uniform starting concentration, enabling direct comparison of PS degradation rates. Here, we demonstrate varying enzymatic activity for different hydrolases, which explains why enzyme abundance does not consistently correspond to the extent of PS degradation in a drug product.
Another important aspect is the localization of hydrolytic HCPs, especially in terms of CHO proteins, as localization data are oftentimes not experimentally determined. Low harvest viabilities lead to the release of intracellular HCPs, changing the HCP profile in the cell culture harvest including PS-degrading enzymes.Citation39 Thus, cell viability at harvest and cell-straining harvest procedures can be of particular importance in products contaminated with predominantly intracellular HCPs.
Enzymes active against PS were found to possess the classical catalytic triad, which consists of Serine (Ser), Histidine (His), and Aspartate/Glutamate (Asp/Glu). This finding is consistent with the activities of PS hydrolases investigated in previous research.Citation9,Citation13 However, acid ceramidase possessing the same catalytic triad does not exhibit PS degrading activity.Citation9,Citation13 In contrast to the enzymes investigated here, acid ceramidase belongs to EC number 3.5 and not 3.1. Thus, the catalytic triad is a prerequisite for PS degradation, but other protein properties are similarly important.
Furthermore, we found that purified mAb formulations exhibited varying activity pH profiles, suggesting the involvement of multiple enzymes in PS degradation. This further supports the idea that the specific enzymes, which are active with regard to PS degradation, depend on the downstream purification process and the specific mAb product. Although these data do not conclusively identify a hydrolase active in a drug product, activity pH profiles can help exclude specific enzyme groups and provide information on which group is significantly involved in PS hydrolysis. This information is particularly useful when multiple hydrolases are identified, and it is unclear which of them are primarily involved in PS hydrolysis in a particular product. Furthermore, use of potential preventive strategies, such as changing the pH of a formulation buffer to reduce PS-degrading activity of specific HCPs, may be beneficial. However, it should be considered that pH changes are limited to the stability range of the product and may cause chemical PS degradation in extreme pH conditions.Citation40,Citation41
Based on our findings, we developed a risk matrix to prioritize hydrolases for further investigation and potential mitigation strategies. Of note, LPL would most likely have scored the highest in the risk matrix, as it showed highest gene and protein expression values and was found in 6 of 7 mAb products. In addition, LPL wt cell lines strongly degraded PS in comparison to LPL KO cell lines, which is in line with current literature confirming strong PS degradation by LPL.Citation17 Strikingly, LIPA, despite being mainly localized intracellularly, is frequently found in mAb preparations and scores the highest final score in the risk matrix. According to our data, approximately 10% of LIPA is secreted or at least found in the cell culture supernatant. Considering its high expression level, it is conceivable that even at low secretion levels, relatively high concentrations of LIPA are reached in the cell culture supernatant comparable to or even higher than that of other PS hydrolases. Additionally, low harvest viabilities or increased cell lysis induced by the harvest method or necrosis might increase the release of intracellular LIPA, offering an easy-to-implement counter measurement. Although the risk matrix provides a guidance of which hydrolases should be more closely monitored in the final drug product, individual products can differ in their hydrolase profile. Therefore, an individual case assessment is necessary, considering also other factors as the pH-dependent activity profiles or the level of similarity toward the specific biopharmaceutical.
This work provides a valuable overview facilitating decision-making toward future strategies to mitigate PS degradation. Due to the individual inherent features of the identified HCPs, multiple mitigation strategies are conceivable and must/can be combined to develop a PS degradation-free final drug product. Starting with the cell-line development, it was shown, that critical HCPs can be removed completely using genome engineering tools such as zinc finger nucleases or CRISPR/Cas9.Citation17,Citation42 Another cell-line engineering approach would be the knockdown of several hydrolases using artificial miRNAs or siRNAs.Citation43 Given the essentiality of some HCPs for the CHO cell, other methods focused on the two main mechanisms responsible for retaining HCPs during purification: product association or product co-elution.Citation32 Tackling product association of specific HCPs, the molecule itself could be engineered to prevent specific interactions.Citation44 However, this concept is only feasible if the functionality of the product remains intact.Citation45 More common is the use of stringent wash buffers during the downstream chromatography steps, which may include extreme pH values and wash additives.Citation35,Citation46,Citation47 It is important to note that not every wash buffer can be used because some may compromise product quality. In general, HCP removal during purification can be realized by many other methods, such as flocculation,Citation48 depth filtration,Citation49 and various chromatography modes.Citation46 Of note, industrial bioprocesses are striving for platform processes that mostly do not allow the introduction of additional HCP reduction steps to ensure timely development and reduced complexity. Thus, using our results, it will be possible to optimize and adapt existing purification processes to specifically remove critical HCPs. Finally, PS degradation can be reduced by alternative formulation strategies. Besides changing the pH of the formulation buffer, the addition of hydrolase inhibitors or fatty acid solubilizer were successfully applied to reduce PS degradation and/or particle formation.Citation50 Moreover, alternative surfactants as Poloxamer 188 were effectively used due to their lack of cleavable ester bonds.Citation50 However, other than PS20, which has an excellent safety profile, any new formulation ingredient must address toxicology and stability concerns, requiring laborious and time-consuming safety analyses.Citation1,Citation50 Our system of stably HCP-overexpressing CHO cells enabled the robust supply of HCPs without contamination by the strongly PS-degrading LPL enzyme and facilitates the expansion of this dataset in the future. In conclusion, PS degradation represents a highly relevant problem in the biopharmaceutical industry that can only be solved through joint efforts of all bioprocess-involved departments.
Materials and methods
Hydrolase identification by LC/MS-MS
Sample preparation
For each mAb, 8 mg of ultrafiltration/diafiltration material was diluted using purified water to the final volume of 370 µl, and pH was adjusted using 10 μL of 1 M Tris/HCl buffer (pH 8.0). 4 µg of trypsin was added to each sample, and samples were incubated at 37°C for 2 h, at 550 RPM. Dithiothreitol (DTT) was added to each sample to 13.4 mM final concentration, followed by 10 min incubation at 95°C for 10 min, 550 RPM. Undigested mAb was pelleted by 5 min centrifugation at 15,000 g, and supernatants were transferred to fresh tubes. Samples were acidified using 15 μL of 10% formic acid (FA) and desalted using C18 StageTips and dried by vacuum centrifuge. Purified dried peptides were fractionated using tip-based basic reversed-phase (BRP) fractionation. For BRP-fractionation 10 mM ammonium formate elution buffers were prepared with ascending acetonitrile (ACN) concentration. The pH of the elution buffers was adjusted to 10 using 28% NH4OH and BRP tip columns were prepared using 14 layers of C18 Empore Extraction material (3 M). Columns were equilibrated by applying 100 µl of methanol, 100 µl of 10 mM ammonium formate, 20% ACN, and 100 µl of 10 mM ammonium formate, 5% ACN. Dried samples were resolubilized in 200 µl of 10 mM ammonium formate, 5% ACN and were loaded to columns, and flow-through was collected as the first fraction after 3 min centrifugation at 2500 g. Subsequent fractions were collected using the elution buffers with 7.5%, 10.0%, 12.5%, 15.0%, 17.5%, 20.0%, and 50.0% ACN, and all fractions were dried using a vacuum centrifuge until further analysis.
LC-MS/MS data acquisition
The dried samples were reconstituted in a solution containing 5% ACN and 5% FA, and then loaded onto a PepMap® RSLC C18 Easy-spray column (#ES903, ThermoFisher) at a flow rate of 300 nL/min using solvent A (0.1% FA in water) at a column temperature of 60°C, using a Dionex UltiMate 3000 RSLCnano system (ThermoFisher Scientific, Waltham). Peptides were separated with a 240-min linear gradient, starting from 98% solvent A and 2% solvent B (0.1% FA in ACN) to 65% solvent A and 35% solvent B, at a flow rate of 250 nL/min. The column was washed with four cycles of zigzag washing steps, ranging from 2% solvent B to 95% solvent B.
The eluted peptides from the analytical column were subjected to positive ionization at 2.0 kV using the EASY-Spray™ Source (ThermoFisher Scientific, Waltham) of an Exploris 480 mass spectrometer, equipped with a FAIMS pro interface (ThermoFisher Scientific, Waltham). The mass spectrometer was operated in data-dependent acquisition (DDA) mode with survey scans acquired from m/z 300 to 1600 in the Orbitrap analyzer at a resolution of 60,000 at four different compensation voltages (CV −40, −65, −75, −90), followed by fragmentation of the most abundant ions. MS/MS spectra were obtained using higher-energy collisional dissociation (HCD) at 30%. The isolation window was set at 2 m/z, the Orbitrap resolution at 15,000, the target value at 1E5, and the maximum injection time set at auto. Selected precursor ions for fragmentation (including charge state 2–8) were excluded for 30 s, and the repeat count was set at 1.
Data analysis
Acquired raw files were analyzed using Proteome Discoverer 2.2 with the Mascot and SEQUEST algorithms in one combined search. The search was performed against the Chinese hamster UniProt proteome database (UP000001075). The applied search parameters were as follows: a full tryptic digestion and a maximum missed cleavage of 3, dynamic modifications of oxidation at methionine and acetylation at protein N-termini, the minimum peptide length of 6, and a maximum of 144. The precursor mass tolerance and fragment mass tolerance were set to 10 ppm and 0.02 Da, respectively. Data filter criteria were set as 1% and 5% false discovery rate (FDR) for peptides and proteins, respectively. A protein was considered as identified when at least two unique peptides fulfilling the mentioned criteria could be identified. UniprotCitation51 and BRENDACitation52 databases were used for the enzyme class determination of the HCPs.
Hydrolase quantification by LC/MS-MS
Sample preparation
An equivalent of 100 µg antibody from harvested cell culture supernatant were denaturized with 80 μl of 7 M guanidine· HCl, 0.4 M tris-HCl buffer at a final volume of 180 µl. Samples were reduced in 5 mM DTT for 30 min at 56°C for 30 min and alkylated with 10 mM Chloroacetamide at room temperature in the dark for 45 min. Afterward samples were diluted to a final volume of 800 µl with 25 mM Tris-HCl before adding 1.5 µg of Trypsin/LysC mix (#V5073, Promega). Digestion was carried out overnight for at least 18 h. Digested samples were desalted using Pierce™ Peptide Desalting Spin Columns (#89851, ThermoFisher Scientific) as described in the manufacturer’s manual and dried until further use.
LC-MS/MS data acquisition
The dried samples were reconstituted in 2% ACN and 0.1% FA and trapped on a Pierce™ Neo 5 µm C18 300 µm × 5 mm Trap cartridge (#174500, ThermoFisher Scientific) at a flow rate of 30 µl/min using a Dionex UltiMate 3000 RSLCnano System (ThermoFisher Scientific, Waltham). Subsequently, peptides were eluted in back flush on to a PepMap™ RSLC C18 Easy-spray column (#ES75500PN, ThermoFisher Scientific) (75 mm inner diameter x 50 cm, 2 mm particle size, 100 Å) with a 120-min linear gradient at a flow rate of 300nL/min, starting from 98% solvent A and 2% solvent B (0.1% FA in ACN) to 65% solvent A and 35% solvent B, at a flow rate of 300 nl/min. Afterward, the column was washed with 80% solvent B before being equilibrated with 98% solvent A and 2% solvent B.
The eluted peptides were subjected to ionization at 2.0 kV using an EASY-Spray™ Source (ThermoFisher Scientific, Waltham) of an Exploris 480 mass spectrometer, equipped with a FAIMS pro interface (ThermoFisher Scientific, Waltham). The mass spectrometer was operated in DDA mode with full scans acquired from m/z 300 to 1600 in the Orbitrap analyzed at a resolution of 60,000 followed by fragmentation of the 10 most abundant ions at three different compensation voltages (CV −50, −65, −85). Tandem mass spectra were obtained using HCD at 30%. The isolation window was set at 2 m/z, the Orbitrap resolution at 15,000, the target value at 1E5, and the maximum injection time set at auto. Selected precursor ions for fragmentation (including charge state 2 − 8) were excluded for 45 s, and the repeat count was set at 1.
Data analysis
Raw files were analyzed using Proteome Discoverer 3.0 using Mascot and SEQUEST search algorithms in one combined search using the Chinese Hamster TrEMBL proteome database (downloaded 01.03.2023, 57854 entries). Database search was carried out using search parameters as follows: full tryptic digestion and a maximum missed cleavage of 2, dynamic modifications of oxidation at methionine and acetylation at protein N-termini, the minimum peptide length of 6, and a maximum of 144. The precursor mass tolerance and fragment mass tolerance were set to 10 ppm and 0.02 Da, respectively. Data filter criteria were set as 1% FDR for peptides and proteins. Peak areas deriving from the full scans were used for relative quantification using the precursor ions quantifier node with default settings in Proteome Discoverer.
Cell culture
CHO K1 producer cell lines were cultured with Boehringer Ingelheim (BI) proprietary medium in 125 mL shake flasks on an orbital shaker (Infors HT, Bottmingen) with 120 rpm (50-mm orbit). Cells were seeded with 5 × 10⁵ viable cells/mL and passaged every 2–3 days. Viable cell density and viability were determined by trypan blue exclusion using Vi-CELL BLU (Beckman Coulter, Brea). Cultured cells were maintained at 36.5°C and 5% CO2.
Gene expression analysis
RNA was isolated from 5 × 10⁶ cells using QIAsymphony RNA Kit and the QIAsymphony (Qiagen, Hilden). The RNA quality was assessed using the Fragment Analyzer with the RNA Kit (DNF-471-0500, Agilent) and samples with RNA quality numbers of ≥ 7.5 were processed further. Strand-specific RNA libraries were prepared using the NEBNext Ultra II Directional RNA Library Kit and the NEBNext Poly(A) mRNA Magnetic Isolation Module (#E7760, # E7490, New England Biolabs). Libraries were sequenced on Illumina’s NovaSeq 6000 (Illumina, San Diego) in 100 bp paired-end mode generated mean read counts of 3 × 10⁷ read pairs per sample. Sequencing data was analyzed with GeneData Selector® software (Genedata, Basel). Sequence reads were quality filtered, adapter sequences were trimmed off, and high-quality reads were mapped to BI’s proprietary CHO K1 genome. Protein coding sequences were annotated, counted, and normalized to library size. Gene expression was calculated as transcripts per million reads (TPM).
Generation of LPL KO cell lines
Generation of LPL KO cell lines producing mAb was done via CRISPR/Cas9 deletion technology. In brief, 180 pmol Alt-R™ Sp. Cas9 (#1081059, Integrated DNA Technologies) was complexed to 220 pmol Alt-R™ sgRNAs (Integrated DNA Technologies) (Upstream: TCTACCGCGCTCCAGCCCTT; Downstream: GGTCTTGGCGCACTCTAGAA) and transfected via the NEON electroporation system (Thermo Fisher Scientific, Waltham) in 5 × 10⁶ cells. Transfected cells were resuspended in 25 mL culture medium in 125 mL shaking flasks and single cell sorted via FACSAriaTM (BD Bioscience, San Jose) after 3 days cultivation. Following expansion, biallelic LPL KO clones were identified via (Non-)Deletion PCR of extracted gDNA (non-deletion primer:fw: tggggcaacggtactgtaga; rev: aacgtaccgtctgctgcg; Deletion primer:fw: tggggcaacggtactgtaga; rev: ctggatgtgaggaagctacttcc). In addition, lack of LPL expression on protein level was confirmed by ELISA measurement (#SEA386Mu, Cloud-Clone Corp.).
Deletion of LPL in CHO host cells was performed with a ZFN pair targeting exon 7 (Sigma-Aldrich). 2 µg of each ZFN were transfected with the NEON electroporation device in 1 × 10⁶ cells and transferred into 10 mL medium in a 50 mL TPP. Single-cell cloning was performed 3 days after transfection and LPL KO validation was executed via ELISA.
Fed-batch cultivation
Fed-batch cultivation of LPL KO and LPL wt was performed in ambr15®/ambr250® (Sartorius, Göttingen) micro bioreactors under BI standard cultivation conditions. After 14 days cultivation, supernatant was harvested by centrifugation and filtration.
Generation of stably expressing hydrolase cell lines and recombinant hydrolase expression
For hydrolase expression, a transposase system was used in combination with a glutamine selection system. Hydrolase sequences were extracted from the proprietary CHO K1 transcriptome and cloned into a transposase recognition sequence harboring expression plasmid. For purification purposes, a C-terminal His- and Strep Tag were added to the native hydrolase coding sequences. 3 µg transposon plasmid and 1.5 µg transposase expression plasmid were transfected (NEON electroporation system) into 5 × 10⁶ cells and cells were resuspended in 5 mL medium and incubated statically. Selection pressure was applied one day post-transfection, and cells were expanded in 40 mL medium. After reaching a viability of > 40% and a VCC of > 1.5×10⁵ cells/mL, cells were transferred in 25 mL medium in a shaking flask and cultivated until reaching viabilities > 95%. Stable hydrolase expressing cell pools were (fed-)batch cultivated in 1.5 L cultures over 5–12 days and cell pellet/supernatant was harvested via centrifugation and stored at −70°C.
Enzyme localization
Expression and localization of the protein of interest was analyzed with biolayer interferometry using Anti-His2 biosensors (Octet® Anti-HIS2 #18–5114, Sartorius) on an Octet HTX platform (ForteBio, Fremont, CA). For protein localization, cell pellets were lysed using the same volume of lysis buffer (50 mM Tris pH 8, 150 mM NaCl, 1% Triton X-100) as the corresponding cell culture supernatant. This ensured a consistent comparison between intracellular and extracellular protein levels. The ratio of the amount of intracellular- and extracellular protein was then calculated.
Purification of recombinant hydrolases
Recombinant hydrolases were purified using two orthogonal capture steps followed by SEC on an Akta Avant 150 system (Cytiva, Marlborough). Initially, immobilized metal affinity chromatography (IMAC) was performed using a nickel-nitrolotriacetic acid column (HisTrap FF crude #17528601, Cytiva). The column was equilibrated with buffer containing 20 mM Hepes pH 8, 150 mM NaCl and 20 mM imidazole. After sample loading, the column was washed with the same buffer until baseline absorbance at 280 nm. The bound protein was eluted by an imidazole gradient over 10 column volumes (20–500 mM). Elution fractions were pooled and loaded onto a Strep-Tactin column (StrepTrap XT #29401323, Cytiva) according to manufacturer’s instructions. Proteins were eluted with a step elution of 10 mM HEPES, 150 mM NaCl and 50 mM biotin at pH 8. Samples containing the protein of interest, as determined by SDS-PAGE, were pooled and polished by SEC (HiLoad 16/600 Superdex 200 pg #28989335, Cytiva). The recombinant hydrolase monomers were identified by comparing the chromatogram to a molecular weight standard. Fractions containing pure protein were aliquoted and stored at −70°C.
Fluorescence micelle assay for determining polysorbate degradation
The assay was performed as described before.Citation43 Purified hydrolases were spiked into a typical formulation buffer (50 mM Histidine pH 6) at a final concentration of 25 µg/mL and mixture was incubated at room temperature. At different time points (d0, d1, d3, d7, d14), samples were frozen at −70°C. Hydrolase containing cell culture supernatant was diluted in PS spiked (0.4 mg/mL), fresh cultivation media.
pH-dependent activity
The esterase activity assay was fully automated using a Fluent Control (Tecan Group, Männerdorf) and employed 4-methylumbelliferyl decanoate (MUD4) as a substrate to evaluate hydrolytic activity at various pH values between 4 and 8. Multi-component buffers were prepared at pH 4 and 8, and a master mix containing the MUD4 substrate was created. The multi-component buffers were mixed in a 12-column reservoir trough to generate a linear pH gradient. The assay was performed in a 96-well plate with the following composition per well: 75 µ sample, 75 µL water, 150 µL master mix at various pH values. MUD4 is a nonfluorescent ester that, upon cleavage by esterases, releases the fluorescent product 4-methylumbelliferon (MU). This cleavage of the ester bond results in an increase in fluorescence signal within the sample, which can be detected using excitation and emission wavelengths of 355 nm and 460 nm (Sepctra Max M series, Molecular Devices, San José), respectively. By measuring the assay at different pH values, pH-dependent activities can be investigated. The fluorescence intensity is proportional to the amount of fluorogenic substrate (MUD4) being cleaved, allowing for the quantification of esterase activity in the sample under various pH conditions.
Abbreviations
| API | = | Active Pharmaceutical Ingredient |
| CES1 | = | Liver carboxylesterase 1-like protein |
| CES1(F) | = | Carboxylesterase 1 (F) |
| CES2C | = | Carboxylic ester hydrolase 2C |
| CHO | = | Chinese hamster ovary |
| CMC | = | Chemistry, manufacturing, and controls |
| CRISPR/Cas9 | = | Clustered Regularly Interspaces Short Palindromic Repeats/CRISPR-associated protein 9 |
| EC | = | Enzyme Commission |
| ELISA | = | Enzyme-linked immunosorbent assay |
| FMA | = | Fluorescence micelle assay |
| GNS | = | N-acetylglucosamine-6-sulfatase |
| HCP | = | host cell protein, His: Histidine |
| IMAC | = | Immobilized Metal Ion Affinity Column |
| IAH1 | = | Isoamyl acetate-hydrolyzing esterase 1-like |
| KO | = | Knockout |
| LC-MS/MS | = | Liquid chromatography-tandem mass spectrometry |
| LIPA | = | Lysosomal acid lipase |
| LPL | = | Lipoprotein lipase |
| LPLA2 | = | Group XV phospholipase A2 |
| mAb | = | monoclonal antibody |
| MUD4 | = | 4-methylumbelliferyl decanoate |
| PAF-AH | = | Platelet-Activating Factor Acetylhydrolase |
| PCR | = | Polymerase Chain Reaction |
| PLB3 | = | Phospholipase D3 |
| PLBL2 | = | Phospholipase B-Like 2 |
| PS | = | polysorbate, ppm: parts per million |
| PPT1 | = | Palmitoyl-proteinthioesterase 1 |
| SMPD1 | = | Sphingomyelinphosphodiesterase |
| Strep | = | Streptavidin |
Author contributions
M.M., L.W., N.Z., K.O., S.F., D.L. designed the study.
D.H. designed plasmids for overexpression.
M.M., L.W., V.S., A.D., B.L. performed the experiments.
M.M., L.W., V.S., A.D., B.L. performed analysis and interpretation of data.
M.M. and L.W. wrote the manuscript.
All authors provided critical feedback and helped shape the research, analysis, and manuscript.
KMAB-2024-0042R1_Supplements_final.docx
Download MS Word (395.1 KB)Acknowledgments
The authors gratefully acknowledge support by team members of ADB, 1CLD, LS DSP, ES PD from Boehringer Ingelheim Pharma GmbH & Co. KG.
Disclosure statement
No potential conflict of interest was reported by the author(s).
Supplementary material
Supplemental data for this article can be accessed online at https://doi.org/10.1080/19420862.2024.2375798
Additional information
Funding
References
- Dwivedi M, Blech M, Presser I, Garidel P. Polysorbate degradation in biotherapeutic formulations: identification and discussion of current root causes. Int J Pharm. 2018;552(1–2):422–15. doi:10.1016/j.ijpharm.2018.10.008. PMID:30300706.
- Bates TR, Nightingale CH, Dixon E. Kinetics of hydrolysis of polyoxyethylene (20) sorbitan fatty acid ester surfactants. J Pharm Pharmacol. 1973;25(6):470–477. doi:10.1111/j.2042-7158.1973.tb09135.x. PMID:4146586.
- Kerwin BA. Polysorbates 20 and 80 used in the formulation of protein biotherapeutics: structure and degradation pathways. J Pharm Sci. 2008;97(8):2924–2935. doi:10.1002/jps.21190. PMID:17973307.
- Yarbrough M, Hodge T, Menard D, Jerome R, Ryczek J, Moore D, Baldus P, Warne N, Ohtake S. Edetate disodium as a polysorbate degradation and monoclonal antibody oxidation stabilizer. J Pharm Sci. 2019;108(4):1631–1635. doi:10.1016/j.xphs.2018.11.031. PMID:30502482.
- Dixit N, Salamat-Miller N, Salinas PA, Taylor KD, Basu SK. Residual host cell protein promotes polysorbate 20 degradation in a sulfatase drug product leading to free fatty acid particles. J Pharm Sci. 2016;105(5):1657–1666. doi:10.1016/j.xphs.2016.02.029. PMID:27032893.
- Hall T, Sandefur SL, Frye CC, Tuley TL, Huang L. Polysorbates 20 and 80 degradation by group XV lysosomal phospholipase A2 isomer X1 in monoclonal antibody formulations. J Pharm Sci. 2016;105(5):1633–1642. doi:10.1016/j.xphs.2016.02.022. PMID:27056628.
- McShan AC, Kei P, Ji JA, Kim DC, Wang YJ. Hydrolysis of polysorbate 20 and 80 by a range of carboxylester hydrolases. PDA J Pharm Sci Technol. 2016;70(4):332–345. PMID:27020650. doi:10.5731/pdajpst.2015.005942.
- Zhang S, Xiao H, Molden R, Qiu H, Li N. Rapid polysorbate 80 degradation by liver carboxylesterase in a monoclonal antibody formulated drug substance at early stage development. J Pharm Sci. 2020;109(11):3300–3307. doi:10.1016/j.xphs.2020.07.018. PMID:32721471.
- Graf T, Tomlinson A, Yuk IH, Kufer R, Spensberger B, Falkenstein R, Shen A, Li H, Duan D, Liu W. et al. Identification and characterization of polysorbate-degrading enzymes in a monoclonal antibody formulation. J Pharm Sci. 2021;110(11):3558–3567. doi:10.1016/j.xphs.2021.06.033. PMID:34224732.
- Madsen JA, Farutin V, Carbeau T, Wudyka S, Yin Y, Smith S, Anderson J, Capila I. Toward the complete characterization of host cell proteins in biotherapeutics via affinity depletions, LC-MS/MS, and multivariate analysis. mAbs. 2015;7(6):1128–1137. doi:10.1080/19420862.2015.1082017. PMID:26291024.
- Mörtstedt H, Makower Å, Edlund P-O, Sjöberg K, Tjernberg A. Improved identification of host cell proteins in a protein biopharmaceutical by LC-MS/MS using the ProteoMiner™ Enrichment Kit. J Pharm Biomed Anal. 2020;185:113256. doi:10.1016/j.jpba.2020.113256. PMID:32229402.
- Thompson JH, Chung WK, Zhu M, Tie L, Lu Y, Aboulaich N, Strouse R, Mo WD. Improved detection of host cell proteins (HCPs) in a mammalian cell-derived antibody drug using liquid chromatography/mass spectrometry in conjunction with an HCP-enrichment strategy. Rapid Commun Mass Spectrom. 2014;28(8):855–860. doi:10.1002/rcm.6854. PMID:24623688.
- Li X, Chandra D, Letarte S, Adam GC, Welch J, Yang R-S, Rivera S, Bodea S, Dow A, Chi A. et al. Profiling active enzymes for polysorbate degradation in biotherapeutics by activity-based protein profiling. Analytical Chem. 2021;93(23):8161–8169. doi:10.1021/acs.analchem.1c00042. PMID:34032423.
- Liu G-Y, Nie S, Zheng X, Li N. Activity-based protein profiling probe for the detection of enzymes catalyzing polysorbate degradation. Analytical Chem. 2022;94(24):8625–8632. doi:10.1021/acs.analchem.2c00059. PMID:35679579.
- Zhang S, Xiao H, Goren M, Burakov D, Chen G, Li N, Tustian A, Adams B, Mattila J, Bak H. Putative phospholipase B-Like 2 is not responsible for polysorbate degradation in monoclonal antibody drug products. JPharmSci. 2020;109(9):2710–2718. doi:10.1016/j.xphs.2020.05.028. PMID:32534029.
- Dehghani A, Binder F, Zorn M, Feigler A, Fischer KI, Felix MN, Happersberger P, Reisinger B. Investigating pH effects on enzymes catalyzing polysorbate degradation by activity-based protein profiling. JPharmSci. 2023. doi:10.1016/j.xphs.2023.09.013. PMID:37758159.
- Chiu J, Valente KN, Levy NE, Min L, Lenhoff AM, Lee KH. Knockout of a difficult-to-remove CHO host cell protein, lipoprotein lipase, for improved polysorbate stability in monoclonal antibody formulations. Biotechnol Bioeng. 2017;114(5):1006–1015. doi:10.1002/bit.26237. PMID:27943242.
- Wang D, Zou L, Jin Q, Hou J, Ge G, Yang L. Human carboxylesterases: a comprehensive review. Acta Pharmaceutica Sin B. 2018;8(5):699–712. doi:10.1016/j.apsb.2018.05.005. PMID:30245959.
- Satoh T, Hosokawa M. The mammalian carboxylesterases: from molecules to functions. Annual review of pharmacology and toxicology. Annu Rev Pharmacol Toxicol. 1998;38(1):257–88. doi:10.1146/annurev.pharmtox.38.1.257. PMID:9597156.
- Marino T, Russo N, Toscano M. Catalytic mechanism of the arylsulfatase promiscuous enzyme from Pseudomonas aeruginosa. Chemistry (Weinheim an der Bergstrasse, Ger). 2013;19(6):2185–2192. doi:10.1002/chem.201201943. PMID:23280779.
- Robertson DA, Freeman C, Morris CP, Hopwood JJ. A cDNA clone for human glucosamine-6-sulphatase reveals differences between arylsulphatases and non-arylsulphatases. Biochemical J. 1992;288(Pt 2):539–544. doi:10.1042/bj2880539. PMID:1463457.
- Appel MJ, Bertozzi CR. Formylglycine, a post-translationally generated residue with unique catalytic capabilities and biotechnology applications. ACS Chem Biol. 2015;10(1):72–84. doi:10.1021/cb500897w. PMID:25514000.
- Ma J, Lu Q, Yuan Y, Ge H, Li K, Zhao W, Gao Y, Niu L, Teng M. Crystal structure of isoamyl acetate-hydrolyzing esterase from Saccharomyces cerevisiae reveals a novel active site architecture and the basis of substrate specificity. Proteins: Struct, Function, Bioinf. 2011;79(2):662–668. doi:10.1002/prot.22865. PMID:21069734.
- Rajamohan F, Reyes AR, Tu M, Nedoma NL, Hoth LR, Schwaid AG, Kurumbail RG, Ward J, Han S. Crystal structure of human lysosomal acid lipase and its implications in cholesteryl ester storage disease. J Lipid Res. 2020;61(8):1192–1202. doi:10.1194/jlr.RA120000748. PMID:32482718.
- Emmerich J, Beg OU, Peterson J, Previato L, Brunzell JD, Brewer HB, Santamarina-Fojo S. Human lipoprotein lipase. Analysis of the catalytic triad by site-directed mutagenesis of Ser-132, Asp-156, and His-241. J Biol Chem. 1992;267(6):4161–65. doi:10.1016/S0021-9258(19)50642-1. PMID:1371284.
- Glukhova A, Hinkovska-Galcheva V, Kelly R, Abe A, Shayman JA, Tesmer JJG. Structure and function of lysosomal phospholipase A2 and lecithin: cholesterol acyltransferase. Nat Commun. 2015;6(1):6250. doi:10.1038/ncomms7250. PMID:25727495.
- Samanta U, Bahnson BJ. Crystal structure of human plasma platelet-activating factor acetylhydrolase: structural implication to lipoprotein binding and catalysis. J Biol Chem. 2008;283(46):31617–24. doi:10.1074/jbc.M804750200. PMID:18784071.
- Nibbeling EAR, Duarri A, Verschuuren-Bemelmans CC, Fokkens MR, Karjalainen JM, Smeets CJLM, de Boer-Bergsma JJ, van der Vries G, Dooijes D, Bampi GB. et al. Exome sequencing and network analysis identifies shared mechanisms underlying spinocerebellar ataxia. Brain: J Neurol. 2017;140(11):2860–2878. doi:10.1093/brain/awx251. PMID:29053796.
- Bellizzi JJ, Widom J, Kemp C, Lu JY, Das AK, Hofmann SL, Clardy J. The crystal structure of palmitoyl protein thioesterase 1 and the molecular basis of infantile neuronal ceroid lipofuscinosis. Proceedings of the National Academy of Sciences of the United States of America; Vol. 97. 2000. p. 4573–478. doi:10.1073/pnas.080508097. PMID:10781062.
- Gorelik A, Illes K, Heinz LX, Superti-Furga G, Nagar B. Crystal structure of mammalian acid sphingomyelinase. Nat Commun. 2016;7(1):12196. 10.1038/ncomms12196. PMID:27435900.
- Bisswanger H, editor. pH and temperature dependence of enzymes. In: Enzyme kinetics: principles and methods. John Wiley & Sons, Ltd; 2017. p. 145–152.
- Singh SK, Mishra A, Yadav D, Budholiya N, Rathore AS. Understanding the mechanism of copurification of “difficult to remove” host cell proteins in rituximab biosimilar products. Biotechnol Prog. 2020;36(2):e2936. doi:10.1002/btpr.2936. PMID:31661608.
- Levy NE, Valente KN, Choe LH, Lee KH, Lenhoff AM. Identification and characterization of host cell protein product-associated impurities in monoclonal antibody bioprocessing. Biotechnol Bioeng. 2014;111(5):904–912. doi:10.1002/bit.25158. PMID:24254318.
- Aboulaich N, Chung WK, Thompson JH, Larkin C, Robbins D, Zhu M. A novel approach to monitor clearance of host cell proteins associated with monoclonal antibodies. Biotechnol Prog. 2014;30(5):1114–1124. doi:10.1002/btpr.1948. PMID:25044920.
- Shukla AA, Hinckley P. Host cell protein clearance during protein a chromatography: development of an improved column wash step. Biotechnol Prog. 2008;24(5):1115–1121. doi:10.1002/btpr.50. PMID:19194921.
- Valente KN, Levy NE, Lee KH, Lenhoff AM. Applications of proteomic methods for CHO host cell protein characterization in biopharmaceutical manufacturing. Curr Opin Biotechnol. 2018;53:144–150. doi:10.1016/j.copbio.2018.01.004. PMID:29414072.
- Kovner D, Yuk IH, Shen A, Li H, Graf T, Gupta S, Liu W, Tomlinson A. Characterization of recombinantly-expressed hydrolytic enzymes from Chinese hamster ovary cells: identification of host cell proteins that degrade polysorbate. JPharmSci. 2023;112(5):1351–1363. 10.1016/j.xphs.2023.01.003. PMID:36646283.
- Gupta SK, Graf T, Edelmann FT, Seelmann H, Reintinger M, Hillringhaus L, Bergmann F, Wiedmann M, Falkenstein R, Wegele H. et al. A fast and sensitive high-throughput assay to assess polysorbate-degrading hydrolytic activity in biopharmaceuticals. Eur J Pharm Biopharmaceutics: Off J Arbeitsgemeinschaft Fur Pharmazeutische Verfahrenstech e V. 2023;187:120–129. doi:10.1016/j.ejpb.2023.04.021. PMID:37116764.
- Hogwood CEM, Bracewell DG, Smales CM. Measurement and control of host cell proteins (HCPs) in CHO cell bioprocesses. Curr Opin Biotechnol. 2014;30:153–160. doi:10.1016/j.copbio.2014.06.017. PMID:25032907.
- Dwivedi M, Buske J, Haemmerling F, Blech M, Garidel P. Acidic and alkaline hydrolysis of polysorbates under aqueous conditions: Towards understanding polysorbate degradation in biopharmaceutical formulations. Eur J Pharm Sci. 2020;144:105211. doi:10.1016/j.ejps.2019.105211. PMID:31931121.
- Glücklich N, Dwivedi M, Carle S, Buske J, Mäder K, Garidel P. An in-depth examination of fatty acid solubility limits in biotherapeutic protein formulations containing polysorbate 20 and polysorbate 80. Int J Pharm. 2020;591:119934. doi:10.1016/j.ijpharm.2020.119934. PMID:33059015.
- Kol S, Ley D, Wulff T, Decker M, Arnsdorf J, Schoffelen S, Hansen AH, Jensen TL, Gutierrez JM, Chiang AWT. et al. Multiplex secretome engineering enhances recombinant protein production and purity. Nat Commun. 2020;11(1):1908. doi:10.1038/s41467-020-15866-w. PMID:32313013.
- Weiß L, Schmieder-Todtenhaupt V, Haemmerling F, Lakatos D, Schulz P, Fischer S. Multi-lipase gene knockdown in Chinese hamster ovary cells using artificial microRNAs to reduce host cell protein mediated polysorbate degradation. Biotechnol Bioeng. 2023. 121(1):329–340. doi:10.1002/bit.28563. PMID:37743807.
- Hecht ES, Mehta S, Wecksler AT, Aguilar B, Swanson N, Phung W, Dubey Kelsoe A, Benner WH, Tesar D, Kelley RF. et al. Insights into ultra-low affinity lipase-antibody noncovalent complex binding mechanisms. mAbs. 2022;14(1):2135183. doi:10.1080/19420862.2022.2135183. PMID:36284469.
- Ranjan S, Chung WK, Hofele R, Heidbrink Thompson J, Bee J, Zhang L, Robbins D, Cramer SM. Investigation of cathepsin D–mAb interactions using a combined experimental and computational tool set. Biotechnol Bioeng. 2019;116(7):1684–1697. doi:10.1002/bit.26968. PMID:30882893.
- Li Y. Effective strategies for host cell protein clearance in downstream processing of monoclonal antibodies and Fc-fusion proteins. Protein Expression Purif. 2017;134:96–103. doi:10.1016/j.pep.2017.04.006. PMID:28414067.
- Chollangi S, Parker R, Singh N, Li Y, Borys M, Li Z. Development of robust antibody purification by optimizing protein-A chromatography in combination with precipitation methodologies. Biotechnol Bioeng. 2015;112(11):2292–2304. doi:10.1002/bit.25639. PMID:25950654.
- Kang YK, Hamzik J, Felo M, Qi B, Lee J, Ng S, Liebisch G, Shanehsaz B, Singh N, Persaud K. et al. Development of a novel and efficient cell culture flocculation process using a stimulus responsive polymer to streamline antibody purification processes. Biotechnol Bioeng. 2013;110(11):2928–37. doi:10.1002/bit.24969. PMID:23740533.
- Yigzaw Y, Piper R, Tran M, Shukla AA. Exploitation of the adsorptive properties of depth filters for host cell protein removal during monoclonal antibody purification. Biotechnol Prog. 2006;22(1):288–296. doi:10.1021/bp050274w. PMID:16454522.
- Roy I, Patel A, Kumar V, Nanda T, Assenberg R, Wuchner K, Amin K. Polysorbate degradation and particle formation in a high concentration mAb: formulation strategies to minimize effect of enzymatic polysorbate degradation. J Pharm Sci. 2021;110(9):3313–3323. doi:10.1016/j.xphs.2021.05.012. PMID:34077768.
- The UniProt Consortium, Bateman A, Martin M-J, Orchard S, Magrane M, Ahmad S, Alpi E, Bowler-Barnett EH, Britto R, Bye-A-Jee H. et al. UniProt: the universal protein knowledgebase in 2023. Nucleic Acids Res. 2023;51(D1):D523–31. doi:10.1093/nar/gkac1052. PMID:36408920.
- Chang A, Jeske L, Ulbrich S, Hofmann J, Koblitz J, Schomburg I, Neumann-Schaal M, Jahn D, Schomburg D. BRENDA, the ELIXIR core data resource in 2021: new developments and updates. Nucleic Acids Res. 2021;49(D1):D498–508. doi:10.1093/nar/gkaa1025. PMID:33211880.