
 ?Mathematical formulae have been encoded as MathML and are displayed in this HTML version using MathJax in order to improve their display. Uncheck the box to turn MathJax off. This feature requires Javascript. Click on a formula to zoom.
ABSTRACT
Сoding sequences of seven housekeeping genes: actin SaACT7, ubiquitin-conjugating protein SaUBC10, glyceraldehyde-3-phosphate dehydrogenase SaGAPDH, protein of the large subunit of ribosomes SaL2, α-tubulin SaTUA, translation elongation factor SaeEF1α, and protein phosphatase SaPP2A were identified as candidate reference genes for expression analysis of target genes in the extremely salt tolerant plant Suaeda altissima (L.) Pall. The expression profiles of the genes differed. SaACT7 and SaeEF1α demonstrated the highest expression levels, while the lowest expression levels were found for SaPP2A and SaTUA. SaPP2A and SaeEF1α genes were the most stably expressed at different steady-state salinity levels and different nitrate concentrations in nutrient solutions (NSs). SaL2, SaPP2A, and SaeEF1α genes showed the greatest stability of expression when nitrate was added to nutrient solution of plants grown under conditions of nitrate deficiency. Less constant expression was demonstrated in this experiment by SaACT7 and SaTUA. SaL2, SaACT7, SaeEF1α, and SaUBC10 genes showed the smallest expression changes under salt shock. To validate the use of the most stably expressed genes for normalization of gene expression, we checked them as reference genes to study the expression of the nitrate transporter gene SaNPF6.3 in S. altissima roots under conditions of different salinity and different nitrate supply.
Introduction
The genus Suaeda Forrsk. belongs to the family Amaranthaceae (subfamily Chenopodioideae). Species of this genus are mostly herbaceous succulent plants and are typical euhalophytes [Citation1,Citation2]. Due to the ability of Suaeda species to populate highly saline soils and the recent progress in Suaeda transcriptomics and genomics, members of this genus have become model plants for investigating mechanisms underlying salt tolerance [Citation2,Citation3]. The habitat of Suaeda altissima, to which this paper is devoted, is often coastal solonchaks (https://ehaloph.uc.pt/showplant/11496, cited 2023 Nov 19). This species is widespread in the European part of Russia, the Caucasus, Crimea, Western Siberia and Central Asia [Citation4] (https://ehaloph.uc.pt/showplant/11496, cited 2023 Nov 19). In hydroponics, S. altissima is able to grow in nutrient solutions (NSs) both in the absence and presence of NaCl at concentrations up to 1 M, while 250 mM NaCl stimulates its growth [Citation5]. Due to these properties and the ability to grow under hydroponic conditions allowing strict control of the NS ionic composition, S. altissima is used as a model to study the Na+- and Cl–-homeostasis mechanisms in salt tolerant plants [Citation6–11]. S. altissima is also of interest from a practical point of view. In arid lands, this species may be used in artificial phytocenosis as a fodder plant [Citation12], as well as for phytoremediation of saline and degraded territories subjected to unsustainable exploitation and natural desertification process. Being a salt-accumulating halophyte, S. altissima is a promising species for the extraction of heavy metals from soil [Citation13]. Attempts have been made to use the closely related species S. salsa for soil desalinization [Citation14,Citation15].
In plants inhabiting saline soils, uptake and further transport of K+ and NO3–, both essential for life, occurs in competition with Na+ and Cl–, which may be toxic [Citation16–20]. At high NaCl concentrations in the environment, ion-transporting proteins of halophytes, unlike those of glycophytes, cope with uptake and distribution of the essential ions throughout the plant. The halophytic ion channels and transporters are assumed to differ from their glycophytic orthologs by primary structure and, accordingly, ionic selectivity and kinetic characteristics which allows halophytes to take up essential elements under saline conditions [Citation18–21].
The studies on the primary structure and functional features of ion-transporting proteins from Suaeda species is an important facet of investigations of the mechanisms underlying salt tolerance [Citation22–27]. The development of nucleotide sequencing techniques has allowed the analysis of transcriptomes and genomes of members of the Suaeda genus [Citation28–30]. Arrays of short RNA reads were obtained from S. fruticosa [Citation28] and S. glauca [Citation29], analysis of which, based on the de novo transcriptome assembly method, allowed identification of the coding sequences for a number of genes in S. altissima [Citation23,Citation25–27,Citation31]. Genomic DNA sequences were assembled, and a large number of genes in S. glauca [Citation32,Citation33] and S. aralocaspica [Citation34,Citation35] involved in various metabolic processes and physiological functions were annotated.
Understanding the mechanisms responsible for salt tolerance requires the discovery of their specific molecular determinants (comprehensively reviewed in [Citation36–38]). One approach to identifying molecular determinants is to examine the expression of candidate genes for involvement in the formation of a given trait. Quantitative real-time polymerase chain reaction after reverse transcription (RT-qPCR) is widely used to study the expression of genes of interest, which allows quantification of their mRNA content in tissues. However, in order to obtain correct results and their proper interpretation, it is necessary to use reference genes, the expression level of which does not noticeably fluctuate under changing experimental conditions. The reliability of reference genes, i.e. the stability of their expression is species-specific and can change significantly under biotic and abiotic environmental factors. Therefore, the selection of reference genes should be carried out for each species separately and in accordance with the objectives of the experiment. Particularly, the expression of a reference gene should be maintained at the same level in control and experimental samples when elucidating the effects of NaCl on the expression of genes of interest.
A large number of experiments have been done to identify the stability of expression of reference genes in model (Arabidopsis thaliana, Nicotiana tabacum) and cultivated (e.g. Solanum tuberosum, Pisum sativum, Oryza sativa, Glycine max, Hordeum vulgare, Triticum aestivum, Vitis vinifera, Prunus persica, Fragaria spp, Pyrus bretschneideri) plants (a comprehensive list of plant species and the corresponding references is not provided here due to the limitations of space). Less work has been done for wild plants of arid climates compared to model and cultivated; especially little is known for halophytes.
To investigate the effects of NaCl and salt tolerance mechanisms in Suaeda altissima, the reference genes suggested for the halophytes Salicornia europaea [Citation39], Suaeda aralocaspica [Citation40], Hordeum brevisubulatum [Citation41] and Suaeda glauca [Citation42] were checked. A set of six genes was considered for S. aralocaspica as candidate reference genes: β-TUB and GAPDH were shown to be expressed most stably at different stages of plant development, ACTIN exhibited the highest expression stability under abiotic stresses of different types, and expression of 18S rRNA and 28S rRNA, genes of ribosomal RNAs was the least stable under these conditions [Citation40]. A set of ten genes was presented for S. glauca. The PP2A and TUA5 genes showed the highest expression stability in different tissues under different salinity regimes, the DREB1D gene was expressed the least stably [Citation42]. In the present work, we selected seven genes involved in different vital cellular processes and physiological functions (hereafter candidate genes) and tested them for application as reference genes in studies of high salinity and nitrate deficiency effects on target gene expression in the euhalophyte Suaeda altissima. They included the housekeeping genes [Citation43] encoding the proteins of the cytoskeleton, protein synthesis/degradation machineries and important biochemical processes: SaACT7 actin, SaUBC10 ubiquitin-conjugating protein, SaGAPDH glyceraldehyde-3-phosphate dehydrogenase, SaL2 ribosome large subunit protein, SaTUA α-tubulin, SaeEF1α translation elongation factor, and SaPP2A protein phosphatase. Among them, the most stably expressed genes were selected under conditions of salt stress and nitrate deficiency and tested for suitability to use as reference genes for S. altissima when studying the expression of the nitrate transporter gene SaNPF6.3.
Materials and methods
Plant material
S. altissima (L.) Pall. was cultivated in hydroponics under controlled conditions, as it was described previously [Citation26]. Briefly, the plants were illuminated with high pressure sodium lamps DNaZ_400 (Re- flux, Russia) with a photoperiod of 12 h/12 h (day/night) and a light intensity of 300 µmol photons/(m−2 s−1) and grown in Robinson-Downton medium [Citation44]. The concentration of NO3– was changed from 5 mM to 15 mM (standard concentration) or 0.5 mM (nitrate deficiency). In the case of long-term salinity (250 mM or 750 mM), NaCl was added to the NS of 28-day-old plants in increment of 50 mM (first 5 days) and 100 mM (next 5 days). In order to simulate salt shock, NaCl was added to the NS of 45-day-old plants to produce a concentration of 250 mM in one-step. To investigate the stability of candidate gene expression, 45-day-old plants grown (1) in the NS under long-term salinity (250 mM, 750 mM NaCl) or in the absence of NaCl at the background of standard or low NO3–, (2) in the absence of NaCl at low NO3– followed by one-step addition of NO3– to a final concentration of 5 mM, and (3) in the absence of NaCl at low NO3– followed by one-step addition of NaCl in a concentration of 250 mM were used.
Extraction of total RNA from plant material and synthesis of the first strand cDNA
Total RNA was isolated by the hot phenolic method, as described earlier [Citation26] and was used as a template for the first-strand cDNA synthesis. For amplification of the 3´- and 5´- end transcript sequences by the Step-Out RACE method, the first-strand cDNA was synthesized on a total RNA template using MINT revertase (Evrogen, Russia). To obtain full-length cDNAs and quantify the representation of the gene transcripts in S. altissima organs, first-strand cDNA synthesis was performed on a total RNA template using (dT)15 primer and MMLV revertase (Evrogen, Russia).
Cloning the coding sequences of candidate reference genes
In silico search for sequences homologous to AtACT7 (AT5G09810, NP_196543.1), AteEF1α (AT1G07940, NP_001030993.1), AtGAPDH (AT1G13440.1, NP_172801.1), AtUBC10 (AT5G53300.1, NP_001190528.1), AtL2 (AT2G18020.1, NP_179393.1), AtTUA (AT5G19780.1, NP_197478.1), and AtPP2A (AT1G69960, NP_177154.1) was performed using the earlier transcriptome of Suaeda fruticosa (L.). Forssk, a closely related species S. altissima, de novo assembled by us [Citation31]. Further on, the contigs of the assembled S. fruticosa transcriptome were translated into amino acid sequences. In the data obtained, the search of the sequences that were most similar to A. thaliana proteins AtACT7, AteEF1α, AtGAPDH, AtUBC10, AtL2, AtTUA, and AtPP2A was accomplished using the BLAST program (https://blast.ncbi.nlm.nih.gov/Blast.cgi). The primer pairs (Supplementary Material, Table S1) were matched using the contigs identified in the assembled S. fruticosa transcriptome. The full-size coding sequences of the homologous S. altissima genes were then amplified from S. altissima cDNA template with these primers using Encyclo-polymerase (Eurogen, Russia). PCR products were cloned into pAL2-T (Evrogen, Russia) or pTZ57R/T (Thermo Fisher, USA) vector, sequenced and deposited in GenBank: SaACT7 (MK615596), SaeEF1α (MN076325), SaGAPDH (OP752353), SaL2 (OP752354), SaPP2A (OP752355), SaUBC10 (OP752356), SaTUA (OP752357) (Supplementary materials, Table S2).
Quantitative analysis of transcripts for candidate reference genes in S. altissima organs
The quantitative analysis of transcripts was performed by RT-qPCR using a LightCycler® 96 System (Roche Diagnostics Corporation, Indianapolis, USA). A reaction mixture with intercalating dye SYBR Green I (Evrogen, Moscow, Russia) was used. The amplification program was designed according to the manufacturer’s recommendations. The primers for the candidate genes SaeEF1α, SaACT7, SaGAPDH, SaTUA, SaUBC10, SaL2, SaPP2A, and for the nitrate transporter gene SaNPF6.3 (Supplementary Material, Table. S1, ) were selected using Light Cycler Probe Design Software 2.0 (Roche, USA).
Figure 1. Expression profiles of S. altissima candidate reference genes as box plots. Raw Cq values are represented on the ordinate axis. The box shows the 25th and 75th percentiles of data sampling, and the whiskers indicate the maximum and minimum values ignoring drop-out ones. The median and mean are indicated by a cross and a cross line, respectively. (a, b) – long-term salinity (0, 250, 750 мМ NaCl); (c, d) – one-step increase in the concentration of nitrate in the NS from 0.5 to 5 mM; (e, f) – salt shock (250 мМ NaCl); (a, c, e) – roots, (b, d, f) – leaves.
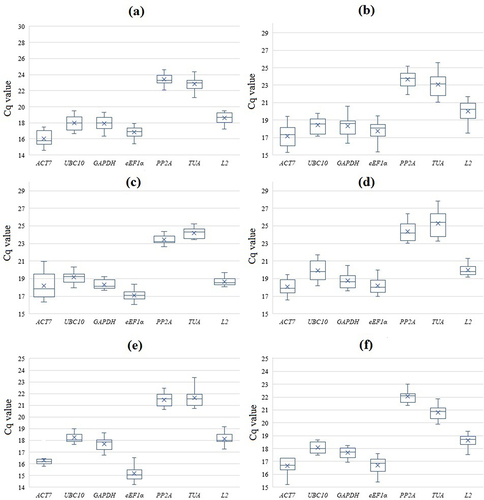
The results are based on three biological replicates, each biological replicate was performed in 3 analytical replicates. The material for obtaining one biological replicate was a mixture of finely chopped organs (roots or leaves) collected from 5–6 plants grown in hydroponics.
Determination of candidate gene expression stability using geNorm algorithm
To compare the expression stability of candidate genes based on the geNorm algorithm, M values, normalization factors (NF) and pairwise variations (Vn/n + 1) of normalization factors were calculated for each candidate gene according to [Citation45] (https://genorm.cmgg.be/). The M value specifies the stability of gene expression. The threshold value of M value is 1.5; if the value of M is greater than 1.5, the gene expression is unstable and the use of this gene as a reference gene is excluded. The smaller the value of M, the greater is the stability of the gene expression. The minimum number of reference genes sufficient to normalize target gene expression in RT-qPCR reliably was determined by calculating pairwise variations in normalization factors. The threshold value of Vn/n + 1 is 0.15, when Vn/n + 1 ˂ 0.15, the inclusion of one more gene in the stability assay does not affect normalization. Sequential inclusion of genes in the analysis should be continued until the Vn/n + 1 values are reduced to the threshold level.
Determination of candidate gene expression stability using NormFinder algorithm
Determination of expression stability using NormFinder algorithm was performed according to [Citation46] (https://moma.dk/normfinder-software). This algorithm is based on the calculation of intra- and intergroup variations. Genes with the lowest expression stability values are expressed the most stably.
Determination of candidate gene expression stability using BestKeeper software tool
Determination of expression stability using BestKeeper software was performed in accordance with [Citation47] (https://www.gene-quantification.de/bestkeeper.html). Standard deviation (SD) and coefficient of variation (CV) are the parameters of the BestKeeper software tool that determine the stability of gene expression. The smaller the SD and CV values, the more stable the expression of reference genes. If the SD value of a gene is greater than 1, the gene is excluded from normalization.
Normalization of the nitrate transporter gene SaNPF6.3 expression
To validate the suitability of the selected genes as reference genes for S. altissima, we examined expression of the nitrate transporter gene SaNPF6.3 cloned previously (NCBI, GenBank OQ330855), under different conditions and evaluated its expression profiles. For this purpose, the normalization factor was first calculated as a geometric mean of expression levels of selected reference genes according to the equation:
where NF is the normalization factor; Сq1, Сq2, … , Сqn are the threshold levels of reference genes with the most stable expression [Citation45]. Then, the relative level of expression of SaNPF6.3 transcripts was determined according to the formula: NF/2CqSaNRT1.1, where CqSaNRT1.1 is the value of SaNPF6.3 expression threshold level. The values of SaNPF6.3 transcript abundances are presented as means ± SD, the values for the control conditions are taken as a unit. One-factor analysis of variance was performed, *P ≤.05; **P ≤.01 based on 3–5 biological replicates.
Results
Seven genes, SaACT7, SaeEF1α, SaGAPDH, SaL2, SaPP2A, SaUBC10, SaTUA were pre-selected so that suitable reference genes could then be selected from these genes to investigate salinity and nitrate deficiency effects on the expression of target genes in S. altissima. The coding sequences of the candidate genes were cloned and translated into amino acid sequences. The latter were highly conservative. Alignment with the orthologs from A. thaliana showed that the proportion of identical amino acid residues for each of the seven proteins exceeded 90% (Supplementary materials, Table S2). All candidate genes were expressed at different stages of plant development. Expression occurred in 21- and 45-day-old plants in cotyledons, leaves, roots, and stems, as well as in 60-day-old plants in flowers (Supplementary materials, Table S3) at a relatively stable levels indicating the importance of all these candidate genes for S. altissima. It is interesting to mention that the threshold values of cycle numbers (Cq values) were higher (indicating lower abundance of transcripts) for all the genes in flowers of 60-day-old plants (Supplementary materials, Table S3).
The stability of candidate gene expression was investigated using three statistical algorithms and software tools (geNorm, NormFinder, and BestKeeper) for different NaCl and nitrate concentrations in the NS. The threshold values of cycle numbers (Cq values) in RT-qPCRs varied significantly among the different genes. The lowest Cq values were for actin and elongation factor, while the highest Cq values were for protein phosphatase and tubulin. The threshold values of cycle numbers ranged from 14.61 (ACT7) to 27.84 (PP2A) (, Supplementary materials, Table S3). Overall, the profiles of candidate gene expression patterns were similar in the three experimental designs (see Material and methods), as well as in roots and leaves, although differences in gene expression levels were observed (). The levels of candidate gene transcript abundance under all experimental conditions decreased in the series ACT7 ≥ eEF1α ˃ GAPDH ˃ UBC10 ˃ L2 ˃ TUA ≥ PP2A. We concluded that the Cq values are rather similar in the replicates. Most of Cq values in the replicates for the majority of candidate genes were located near the median ().
geNorm
The analysis of candidate gene expression stability using the geNorm program algorithm () is based on the comparison of Mj values of candidate genes [Citation45]. Mj represents the average standard deviation of a logarithm-transformed expression level set of a candidate gene j relative to other candidate genes. The larger the Mj value, the less stable is the expression of gene j. The best reference gene corresponds to the minimum value of Mj. The stability of candidate gene expression according to geNorm analysis varied significantly; however, for all candidate genes in each experiment Mj values was below the threshold level of 1.5 ranging from 1.39 (ACT7) to 0.36 (L2) ().
Figure 2. Stability of candidate reference gene expression using geNorm algorithm. Candidate reference gene expression stability values, Mj, calculated using geNorm algorithm in S. altissima organs. Mj values for each reference gene are ranked in descending order (from left to right), corresponding to increasing stability of candidate reference gene expression. (a, b) – long-term salinity (0, 250, 750 mM NaCl); (c, d) – one-step increase in the concentration of nitrate in the NS from 0.5 to 5 mM; (e, f) – salt shock (250 mM NaCl); (a, c, e) – roots; (b, d, f) – leaves.
Figure 3. Determination of the optimal number of reference genes for target gene expression normalization under conditions of salt stress and nitrate deficiency in S. altissima organs based on analysis of pairwise variation values (Vn/n +1) of normalization factors of the candidate reference genes. 1 – long-term salinity (0, 250, 750 mM NaCl), roots; 2 –long-term salinity (0, 250, 750 mM NaCl), leaves; 3 – one-step increase in the concentration of nitrate in the NS from 0.5 to 5 mM, roots; 4 – one-step increase in the concentration of nitrate in the NS from 0.5 to 5 mM, leaves; 5 – salt shock (250 mM NaCl), roots; 6 – salt shock (250 mM NaCl), leaves.
Under long-term salinity conditions at different nitrate availability in the NS, PP2A˃eEF1α˃L2˃TUA were the more stably expressed genes in roots and PP2A˃GAPDH˃eEF1α˃TUA in leaves (). When the nitrate concentration in nitrate-deficient medium (0.5 mM) was raised to 5 mM, a more stable expression was observed for L2 ˃PP2A ˃eEF1α˃ UBC10 genes in roots and eEF1α˃PP2A˃L2˃UBC10 genes in leaves (). In the salt shock experiments, the stability of candidate gene expression decreased in L2>ACT7>>eEF1α>UBC10 (roots) and L2>ACT7>>eEF1α>GAPDH (leaves) series (). The least stably expressed genes according to the geNorm algorithm were ACT7 under long-term salinity conditions at different nitrate availability in the NS; ACT7, GAPDH, and TUA when nitrate was added to nitrate-deficient medium; TUA in roots and PP2A in leaves in the salt shock experiment ().
The optimal number of reference genes required for accurate normalization under the conditions of each experiment was determined by calculating the pairwise variation values (Vn/n + 1) of normalization factors (NFs) in roots and leaves (). According to the analysis in the long-term salinity and salt shock experiments, the use of the two most stably expressed genes was sufficient to reliably normalize the expression in both roots and leaves (), because the V2/3 value under these conditions was below than the threshold level of 0.15. In the experiment with nitrate addition to nitrate-deficient medium, the use of two genes was also sufficient to normalize expression in roots, but three genes were required to normalize expression in leaves (V2/3 = 0.232; V3/4 = 0.149).
NormFinder
The lower the value of the expression stability index calculated according to NormFinder’s algorithm [Citation46], the higher is the expression stability (). In the long-term salinity experiments, PP2A˃eEF1α˃L2˃GAPDH genes were more stably expressed in roots and PP2A˃GAPDH˃eEF1α˃TUA genes in leaves. In the experiments with nitrate addition to nitrate-deficient medium, higher expression stability was observed for the genes L2˃PP2A˃SaeEF1α˃TUA in roots and for eEF1α˃PP2A˃L2˃UBC10 in leaves. In the case of salt shock, the more stably expressed genes were L2˃UBC10˃eEF1α˃ACT7 in roots and L2˃TUA˃GAPDH˃UBC10 in leaves. In the salt-shock experiments, relatively small values of the expression stability index were found for all candidate genes in leaves () indicating their stable expression in this organ. Overall, the assessment of candidate gene expression stability for S. altissima using the NormFinder algorithm is similar to that according to geNorm program.
Table 1. Values of the expression stability index of S. altissima candidate reference genes calculated using NormFinder program algorithm.
BestKeeper
According to the algorithm of the BestKeeper program, the stability of candidate gene expression is assessed by the values of the standard deviation of gene expression levels (SD) and coefficients of their variation (CV) [Citation47]. The genes with the lowest SD and CV values are characterized by the most stable expression, the genes with SD values greater than 1 are referred to as unstably expressed genes and are excluded from consideration. In the experiments with long-term salinity, PP2A ˃ L2 ˃˃eEF1α˃GAPDH were more stably expressed genes in roots and PP2A ˃UBC10˃GAPDH˃eEF1α in leaves (). In the case of nitrate addition to nitrate-deficient medium, L2˃PP2A˃eEF1α˃GAPDH genes were expressed more stably in roots and L2˃eEF1α˃GAPDH˃GAPDH˃ACT7 genes in leaves. Under salt shock conditions, ACT7˃L2˃UBC10˃PP2A genes in roots and the L2˃UBC10˃GAPDH ˃PP2A genes in leaves displayed little fluctuation of expression. ACT7 and TUA were characterized by the highest instability at long-term salinity and when nitrate was added to the NS; SD values for ACT7 and TUA exceeded unity under these experimental conditions.
Table 2. Expression stability indices (SD, CV) of S. altissima candidate reference genes calculated using BestKeeper program.
Summarizing the results of calculations using these three algorithms, we can conclude that the more stably expressed candidate genes in the organs of S. altissima were (1) PP2A and eEF1α under long-term salinity at different nitrate concentrations in the NS; (2) PP2A, eEF1α, L2 when nitrate was added to the nitrate-deficient NS; and (3) L2, ACT7, eEF1α, and UBC10 under condition of salt shock.
Expression of the nitrate transporter gene SaNPF6.3
Among the candidate genes, the more stably expressed genes were used as reference genes to calculate normalization factors and to investigate the relative abundance of transcripts in SaNPF6.3, a nitrate transporter gene of the NPF/NRT1 family, in roots (). The product of this gene is involved in nitrate uptake by roots and probably in chloride transport [Citation27]. SaNPF6.3 expression in roots depended on NaCl and nitrate concentration in the NS (). The relative representation of SaNPF6.3 transcripts increased at low nitrate concentration (0.5 mM) and decreased at standard nitrate concentration (15 mM) as NaCl concentration increased (). Increasing the nitrate concentration up to 5 mM in the nitrate-deficient NS resulted in induction of the transporter expression (). Stimulation of the SaNPF6.3 expression was also observed in response to salt shock (). The SaNPF6.3 expression profiles calculated relative to those of single genes (ACT7, TUA) were different from profiles calculated based on normalization factors using two reference genes. The use of single reference genes for normalization of expression resulted in larger errors in the calculations ().
Figure 4. Relative representation of transcripts of the nitrate transporter gene SaNPF6.3 in S. altissima roots under: (a) long-term salinity (0, 250, 750 mM NaCl) at different nitrate availability (0.5 or 15 mM NO3–) in the NS relative to the normalization factor NF (eEF1+PP2A) (black bars, 1) and ACT7 (gray bars, 2); (b) salt shock (250 mM NaCl) at low nitrate concentration in the NS (0. 5 mM) relative to NF (ACT7+L2) (black bars, 1) and TUA (gray bars, 2); (c) one-step increase in nitrate concentration in the NS from 0.5 to 5 mM relative to NF (eEF1+PP2A) (black bars, 1) and ACT7 (gray bars, 2). Different letters indicate significant difference (p-value <.05).
Discussion
To select the stably expressed genes in the S. altissima, we checked the housekeeping genes [Citation43] which encode cytoskeleton proteins (SaACT7 actin and SaTUA α-tubulin), proteins related to protein synthesis (SaL2 ribosome large subunit protein, SaeEF1α translation elongation factor) and controlled protein degradation (SaUBC10 ubiquitin-conjugating protein) as well as proteins for presumably stable biochemical and regulation processes (SaGAPDH glyceraldehyde-3-phosphate dehydrogenase, SaPP2A protein phosphatase).
For analysis of the gene expression, we employed three algorithms implemented in GeNorm, NormFinder, and BestKeeper programs. The GeNorm algorithm is based on pairwise comparison of expression levels of several candidate genes and calculation of the corresponding variances. The main shortcoming of this method is the dependence of the results on the correlation in expression levels of different candidate genes, if the latter are subjected to co-regulation [Citation45]. In the NormFinder program, the approach based on modeling the expression of each reference gene separately is used instead of pairwise comparison of gene expression levels. In this case, experimental samples are divided into several groups, and the measure of the candidate gene expression stability is the index, which is determined based on the calculation of intragroup and intergroup variances. Unlike the GeNorm method, the NormFinder algorithm is robust to the presence of correlation in the expression levels of co-regulated genes [Citation46]. The BestKeeper algorithm, like geNorm, is based on pairwise comparison of the candidate gene expression levels, but includes correlation analysis of the expression of compared candidate gene pairs [Citation47].
The stability of the pre-selected candidate gene expression differed markedly depending on the experimental conditions, i.e. the changes in ionic composition of the NS during the experimental procedures. For example, the transcript level of cytoskeleton S. altissima ACT7 fluctuated when NaCl concentration changed in the NS in the long-term salinity experiments, but was maintained at the control level under salt-shock conditions.
Comparing the results of this study with S. altissima with those obtained using other plant species, expression stability of a particular gene depends on plant species. The gene GAPDH from S. altissima occupied a predominantly intermediate position in the expression stability series of the candidate genes; however, its ortholog from S. aralocaspica was one of the most stably expressed genes in a study of the effects of salinity [Citation40]. High stability of ACT7 expression was observed in Arachis hypogaea [Citation48] and in a study of the effects of NaCl on Apocynum venetum [Citation49], but an ortholog of this gene from S. glauca was one of the least stably expressed genes [Citation42]. The cytoskeleton TUA gene was characterized by a stable expression in S. glauca [Citation42], while according to the results of our work, the expression of its ortholog in S. altissima was either the least stable (when nitrate was added to nitrate-deficient medium and under salt shock) or intermediate (under long-term salinity conditions and different availability of nitrate). In the present study, the stability of protein synthesis/degradation L2 and UBC10 gene expression was investigated for the first time for a member of the genus Suaeda: L2 was among the most stable genes under most treatments, especially in roots, UBC10 had intermediate position.
Overall, our results confirm that it is not possible to select a universal reference gene suitable for normalizing the expression of target genes in different plants as well as studying the effects of different factors on the expression of a particular target gene. The reasons are likely in species-specific cell biology and gene expression patterns. The stability of expression for even the selected housekeeping genes can undergo considerable variation depending on the factors acting on the plant and is highly species-specific. Nevertheless, the results obtained in our work suggest that a number of these genes can be used to normalize the expression of S. altissima target genes in examining NaCl effects and differences in nitrate availability. For example, the gene of the ribosomal protein L2 was one of the most stably expressed under almost all changes in the ionic composition of the NS of S. altissima plants in the course of our experiments. It should be noted that the slight differences in expression stability observed for the same genes using geNorm, NormFinder, and BestKeeper may be attributed to differences in the mathematics of the algorithms.
The changes in the expression of the selected housekeeping genes in plant organs and under different experimental treatments are themselves of interest. For example, the difference between Cq values for the cytoskeleton genes SaACT7 actin and SaTUA α-tubulin was higher (in favor of SaACT7 actin and its abundance over SaTUA mRNA) in flowers of 60-day-old plants (Supplementary materials, Table S3) posing questions about the abundance of the corresponding proteins and cytoskeleton rearrangements during development. Interestingly and oppositely, actin7 is a vegetative actin in Arabidopsis [Citation50], while α1-tubulin gene of A. thaliana is preferentially expressed in flowers [Citation51]. In this context, it is useful to compare results of quantitative real-time PCR with results from RNA sequencing and microarrays: each of the methods has shortcomings and errors bringing discrepancies between them – although housekeeping genes of actin and GAPDH expressed similarly in each method [Citation52]. So far, the information on halophyte gene expression (in particular for species of the genus Suaeda) comes mostly from quantitative real-time PCR, while RNA sequencing has only been completed for a few species. For Suaeda maritima, the results of RNA sequencing demonstrated similar expression changes to qPCR for most transcription factors under salinity treatment [Citation53]. Results of RNA sequencing also mostly coincided with qPCR for ten dysregulated genes checked in Suaeda salsa under 300 mM NaCl [Citation54].
The opportunity of using the selected stable expressed genes of S. altissima and choosing the best way of normalization was tested for the nitrate transporter SaNPF6.3, a putative ortholog of the transporter/transceptor AtNPF6.3 (CHL1/NRT1.1) [Citation55] (). We have previously demonstrated a nitrate-transporting function of SaNPF6.3 and suggested that this protein may also be an element of the system involved in maintaining chloride homeostasis under salinity as well as processes underlying salt tolerance in S. altissima [Citation27]. Normalization factor calculated on the basis of two or more reference genes has preference over using a single reference gene improving normalization reliability in RT-qPCR and decreasing its errors [Citation45]. Our results confirm this conclusion. To determine the optimal number of reference genes for normalizing SaNPF6.3 expression in RT-qPCR, geNorm program was used. The combination of two of the most stably expressed genes of the seven candidate genes was sufficient to normalize expression of this gene in S. altissima roots. The transcript representation of SaNPF6.3 in roots under long-term salinity and after nitrate addition (, black bars) was determined relative to NF calculated from the expression levels of the two stably expressed genes, SaPP2A and SaeEF1α. In the case of salt shock, two other candidate genes were used for NF calculation, L2 and ACT7 (, black bars). For comparison, the SaNPF6.3 transcript levels were also obtained using only one reference gene (, gray bars), ACT7 for conditions of long-term salinity and nitrate addition and TUA for salt shock. The advantage of using two reference genes over a single one for the SaNPF6.3 normalization can be also seen in this work with NFs on the basis of two genes (, black bars) and in our previous study [Citation27] where SaNPF6.3 transcript abundance was detected under the same conditions and with the same genes (SaPP2A or SaeEF1α, for normalization) but using them as single reference gene. With all experimental designs, similar results were obtained in the present and previous studies. It should be noted that a similar dependence of SfNPF6.3 transcript abundance on NaCl concentration in the medium was also previously observed [Citation31]. Although the results obtained with NFs calculated using two and a single reference gene are generally similar, the former have the advantage of lower scatter in the resulting data and smaller standard errors.
The set of genes used here and the study of their expression stability under different saline conditions and different availability of nitrate can serve as a basis for conducting similar experiments on other halophytes. The selected genes can serve as reference genes in RT-qPCR in studies of salt tolerance mechanisms of S. altissima and closely related species. The genes expressed at relatively low levels (L2, TUA, PP2A) can be used to normalize the expression of weakly expressed genes, such as genes of ion channels and transporters. The candidate genes with relatively high expression levels (ACT7, eEF1α, GAPDH) can be used as reference genes to investigate the expression for genes of interest with higher transcript representation, for example, genes of major metabolic pathways, such as photosynthesis and respiration, as well as genes involved in biosynthesis of osmotically active compounds and secondary metabolites.
Author contributions
Conceptualization: YB, ON; methodology: YB, ON; formal analysis: DK, ON, YB, AK; investigation: ON, DK, AK; writing – original draft preparation: YB; writing – review and editing: YB, ON, VV; visualization: YB, KD, ON; supervision: YB, ON; funding acquisition: ON, YB, VV. All authors have read and agreed to the published version of the manuscript.
Supplemental Material
Download MS Word (263.3 KB)Acknowledgments
The authors sincerely thank Professor Tim Flowers for his kind detailed comments on the text.
Disclosure statement
No potential conflict of interest was reported by the author(s).
Data availability statement
The datasets used and/or analyzed during the current study are available from the corresponding authors upon reasonable request.
Supplementary material
Supplemental data for this article can be accessed online at https://doi.org/10.1080/19420889.2024.2372313
Additional information
Funding
References
- Schütze P, Freitag H, Weising K. An integrated molecular and morphological study of the subfamily Suaedoideae Ulbr. (Chenopodiaceae). Plant Syst Evol. 2003;239(3–4):257–14. doi: 10.1007/s00606-003-0013-2
- Wang X, Shao X, Zhang W, et al. Genus Suaeda: advances in phytology, chemistry, pharmacology and clinical application (1895–2021). Pharmacol Res. 2022;179:106203. doi: 10.1016/j.phrs.2022.106203
- Flowers TJ. Salt tolerance in Suaeda maritima (L.) Dum. The effect of sodium chloride on growth, respiration, and soluble enzymes in a comparative study with Pisum sativum L. J Exp Bot. 1972;23(2):310–321. doi: 10.1093/jxb/23.2.310
- Lomonosova M, Freitag H. Typification of plant names in Suaedoideae (Chenopodiaceae) published by P. Pallas, C. A. Meyer and A. Bunge. Willdenowia - Annals of the Botanic Garden and Botanical Museum Berlin-Dahlem. 2011;41(2):217–229. doi: 10.3372/wi.41.41202
- Balnokin YV, Kurkova EB, Myasoedov NA, et al. Structural and functional state of thylakoids in a halophyte Suaeda altissima before and after disturbance of salt–water balance by extremely high concentrations of NaCl. Russ J Plant Physiol. 2004;51(6):815–821. doi: 10.1023/B:RUPP.0000047831.85509.a6
- Lun’kov RV, Andreev IM, Myasoedov NA, et al. Functional identification of H+-ATPase and Na+/H+-antiporter in the plasma membrane isolated from the root cells of salt-accumulating halophyte Suaeda altissima. Russ J Plant Physiol. 2005;52(5):635–644. doi: 10.1007/s11183-005-0094-6
- Balnokin YV, Kurkova EB, Khalilova LA, et al. Pinocytosis in the root cells of a salt-accumulating halophyte Suaeda altissima and its possible involvement in chloride transport. Russ J Plant Physiol. 2007;54(6):797–805. doi: 10.1134/S102144370706012X
- Shuvalov AV, Orlova JV, Khalilova LA, et al. Evidence for the functioning of a Cl−/H+ antiporter in the membranes isolated from root cells of the halophyte Suaeda altissima and enriched with Golgi membranes. Russ J Plant Physiol. 2015;62(1):45–56. doi: 10.1134/S1021443715010124
- Flowers TJ, Colmer TD. Salinity tolerance in halophytes. New Phytol. 2008;179(4):945–963. doi: 10.1111/j.1469-8137.2008.02531.x
- Flowers TJ, Munns R, Colmer TD. Sodium chloride toxicity and the cellular basis of salt tolerance in halophytes. Ann Bot. 2015;115(3):419–431. doi: 10.1093/aob/mcu217
- Balnokin YV, Kotov AA, Myasoedov NA, et al. Involvement of long-distance Na+ transport in maintaining water potential gradient in the medium-root-leaf system of a halophyte Suaeda altissima. Russ J Plant Physiol. 2005;52(4):489–496. doi: 10.1007/s11183-005-0072-z
- Shamsutdinova EZ, Kosolapov VM, Kenzhegaliev GK, et al. Breeding salt-tolerant cultivar of a halophytic annual Suaeda altissima L. in the Caspian semidesert. Russ Agric Sci. 2017;43(6):478–481. doi: 10.3103/S1068367417060155
- Toderich KN, Shuyskaya EV, Khujanazarov TM, Ismail S, Kawabata Y. The structural and functional characteristics of Asiatic desert halophytes for phytostabilization of polluted sites. In: Plant Adaptation and Phytoremediation. 2010; 245–274. doi: 10.1007/978-90-481-9370-7_12
- Wang L, Wang X, Jiang L, et al. Reclamation of saline soil by planting annual euhalophyte Suaeda salsa with drip irrigation: a three-year field experiment in arid northwestern China. Ecol Eng. 2021;159:106090. doi: 10.1016/j.ecoleng.2020.106090
- Wang S, Zhao Z, Ge S, et al. The effects of Suaeda salsa/Zea mays L. intercropping on plant growth and soil chemical characteristics in saline soil. Agriculture. 2022;12(1):107. doi: 10.3390/agriculture12010107
- Rubinigg M, Posthumus F, Ferschke M, et al. Effects of NaCl salinity on 15N-nitrate fluxes and specific root length in the halophyte Plantago maritima L. Plant Soil. 2003;250(2):201–213. doi: 10.1023/A:1022849928781
- Amtmann A, Armengaud P, Volkov V. Potassium nutrition and salt stress. In: Blatt M, editor. Membrane transport in plants. Oxford: Blackwell Publishing; 2004. p. 293–339.
- Song J, Ding X, Feng G, et al. Nutritional and osmotic roles of nitrate in a euhalophyte and a xerophyte in saline conditions. New Phytol. 2006;171(2):357–366. doi: 10.1111/j.1469-8137.2006.01748.x
- Kudo N, Fujiyama H. Responses of halophyte Salicornia bigelovii to different forms of nitrogen source. Pedosphere. 2010;20(3):311–317. doi: 10.1016/S1002-0160(10)60019-7
- Yuan JF, Feng G, Ma HY, et al. Effect of nitrate on root development and nitrogen uptake of Suaeda physophora under NaCl salinity. Pedosphere. 2010;20(4):536–544. doi: 10.1016/S1002-0160(10)60043-4
- Flowers TJ, Troke PF, Yeo AR. The mechanism of salt tolerance in halophytes. Annu Rev Plant Physiol. 1977;28(1):89–121. doi: 10.1146/annurev.pp.28.060177.000513
- Wang WY, Liu YQ, Duan HR, et al. SsHKT1;1 is coordinated with SsSOS1 and SsNHX1 to regulate Na+ homeostasis in Suaeda salsa under saline conditions. Plant Soil. 2020;449(1–2):117–131. doi: 10.1007/s11104-020-04463-x
- Nedelyaeva OI, Shuvalov AV, Karpichev IV, et al. Molecular cloning and characterisation of SaCLCa1, a novel protein of the chloride channel (CLC) family from the halophyte Suaeda altissima (L.) Pall. J Plant Physiol. 2019;240:152995. doi: 10.1016/j.jplph.2019.152995
- Nedelyaeva OI, Shuvalov AV, Balnokin YV. Chloride channels and transporters of the CLC family in plants. Russ J Plant Physiol. 2020;67(5):767–784. doi: 10.1134/S1021443720050106
- Nedelyaeva OI, Popova LG, Volkov VS, et al. Molecular cloning and characterization of SaCLCd, SaCLCf, and SaCLCg, novel proteins of the chloride channel family (CLC) from the halophyte Suaeda altissima (L.) Pall. Plants. 2022;11(3):409. doi: 10.3390/plants11030409
- Nedelyaeva OI, Popova LG, Khramov DE, et al. Chloride channel family in the euhalophyte Suaeda altissima (L.) Pall: cloning of novel members SaCLCa2 and SaCLCc2, General characterization of the family. Int J Mol Sci. 2023;24(2):941. doi: 10.3390/ijms24020941
- Nedelyaeva OI, Khramov DE, Khalilova LA, et al. Molecular cloning, expression and transport activity of SaNPF6.3/SaNRT1.1, a novel protein of the low-affinity nitrate transporter family from the euhalophyte Suaeda altissima (L.) Pall. Membranes. 2023;13(10):845. doi: 10.3390/membranes13100845
- Diray-Arce J, Clement M, Gul B, et al. Transcriptome assembly, profiling and differential gene expression analysis of the halophyte Suaeda fruticosa provides insights into salt tolerance. BMC Genomics. 2015;16(1):353. doi: 10.1186/s12864-015-1553-x
- Jin H, Dong D, Yang Q, et al. Salt-responsive transcriptome profiling of Suaeda glauca via RNA sequencing. PLOS ONE. 2016;11(3):e0150504. doi: 10.1371/journal.pone.0150504
- Guo SM, Tan Y, Chu HJ, et al. Transcriptome sequencing revealed molecular mechanisms underlying tolerance of Suaeda salsa to saline stress. PLOS ONE. 2019;14(7):1–23. doi: 10.1371/journal.pone.0219979
- Shuvalov AV, Yurchenko AA, Nedelyaeva OI, et al. Identification of some anion transporter genes in the halophyte Suaeda altissima (L.) Pall. and their expression under nitrate deficiency and salinity. Russ J Plant Physiol. 2021;68(5):873–882. doi: 10.1134/S1021443721050174
- Cheng Y, He X, Priyadarshani SVGN, et al. Assembly and comparative analysis of the complete mitochondrial genome of Suaeda glauca. BMC Genomics. 2021;22(1):1–15. doi: 10.1186/s12864-021-07490-9
- Yi L, Sa R, Zhao S, et al. Chromosome-scale, haplotype-resolved genome assembly of Suaeda glauca. Front Genet. 2022;13:1–7. doi: 10.3389/fgene.2022.884081
- Wang L, Ma G, Wang H, et al. A draft genome assembly of halophyte Suaeda aralocaspica, a plant that performs C4 photosynthesis within individual cells. Gigascience. 2019;8(9):1–9. doi: 10.1093/gigascience/giz116
- Cao J, Cheng G, Wang L, et al. Genome-wide identification and analysis of the phosphoenolpyruvate carboxylase gene family in Suaeda aralocaspica, an annual halophyte with single-cellular C4 anatomy. Front Plant Sci. 2021;12:1–23. doi: 10.3389/fpls.2021.665279
- Munns R, Tester M. Mechanisms of salinity tolerance. Annu Rev Plant Biol. 2008;59(1):651–681. doi: 10.1146/annurev.arplant.59.032607.092911
- Volkov V. Salinity tolerance in plants. Quantitative approach to ion transport starting from halophytes and stepping to genetic and protein engineering for manipulating ion fluxes. Front Plant Sci. 2015;6:873. doi: 10.3389/fpls.2015.00873
- Volkov V, Beilby MJ. Editorial: salinity tolerance in plants: mechanisms and regulation of ion transport. Front Plant Sci. 2017;8:1795. doi: 10.3389/fpls.2017.01795
- Xiao X, Ma J, Wang J, et al. Validation of suitable reference genes for gene expression analysis in the halophyte Salicornia europaea by real-time quantitative PCR. Front Plant Sci. 2015;5:1–11. doi: 10.3389/fpls.2014.00788
- Cao J, Wang L, Lan H. Validation of reference genes for quantitative RT-PCR normalization in Suaeda aralocaspica, an annual halophyte with heteromorphism and C4 pathway without Kranz anatomy. PeerJ. 2016;4:e1697. doi: 10.7717/peerj.1697
- Zhang L, Zhang Q, Jiang Y, et al. Reference genes identification for normalization of qPCR under multiple stresses in Hordeum brevisubulatum. Plant Methods. 2018;14(1):1–14. doi: 10.1186/s13007-018-0379-3
- Wang M, Ren T, Marowa P, et al. Identification and selection of reference genes for gene expression analysis by quantitative real-time PCR in Suaeda glauca’s response to salinity. Sci Rep. 2021;11(1):8569. doi: 10.1038/s41598-021-88151-5
- Joshi CJ, Ke W, Drangowska-Way A, et al. What are housekeeping genes? PLOS Comput Biol. 2022;18(7):e1010295. doi: 10.1371/journal.pcbi.1010295
- Robinson SP, Downton WJS. Potassium, sodium and chloride ion concentrations in leaves and isolated chloroplasts of the halophyte Suaeda australis R. Br. Funct Plant Biol. 1985;12(5):471–479. doi: 10.1071/PP9850471
- Vandesompele J, De Preter K, Pattyn F, et al. Accurate normalization of real-time quantitative RT-PCR data by geometric averaging of multiple internal control genes. Genome Biol. 2002;3(7):1–12. doi: 10.1186/gb-2002-3-7-research0034
- Andersen CL, Jensen JL, Ørntoft TF. Normalization of real-time quantitative reverse transcription-PCR data: a model-based variance estimation approach to identify genes suited for normalization, applied to bladder and colon cancer data sets. Cancer Res. 2004;64:5245–5250. doi: 10.1158/0008-5472.CAN-04-0496
- Pfaffl MW, Tichopad A, Prgomet C, et al. Determination of stable housekeeping genes, differentially regulated target genes and sample integrity: bestKeeper – Excel-based tool using pair-wise correlations. Biotechnol Lett. 2004;26(6):509–515. doi: 10.1023/B:BILE.0000019559.84305.47
- Chi X, Hu R, Yang Q, et al. Validation of reference genes for gene expression studies in peanut by quantitative real-time RT-PCR. Mol Genet Genomics. 2012;287(2):167–176. doi: 10.1007/s00438-011-0665-5
- Xu Z, Wang M, Zhou J, et al. Identification and validation of stable reference genes for gene expression analysis in sword-leaf dogbane using quantitative reverse transcriptase polymerase chain reaction. J Am Soc Hortic Sci. 2018;143(6):508–517. doi: 10.21273/JASHS04554-18
- Kandasamy MK, Burgos-Rivera B, McKinney EC, et al. Class-specific interaction of profilin and ADF isovariants with actin in the regulation of plant development. The Plant Cell. 2007;19(10):3111–3126. doi: 10.1105/tpc.107.052621
- Ludwig SR, Oppenheimer DG, Silflow CD, et al. The α1-tubulin gene of Arabidopsis thaliana: primary structure and preferential expression in flowers. Plant Mol Biol. 1988;10(4):311–321. doi: 10.1007/BF00029881 PMID: 24277562.
- Rachinger N, Fischer S, Böhme I, et al. Loss of gene information: discrepancies between RNA sequencing, cDNA microarray, and qRT-PCR. Int J Mol Sci. 2021;22(17):9349. doi: 10.3390/ijms22179349
- Gharat SA, Parmar S, Tambat S, et al. Transcriptome analysis of the response to NaCl in Suaeda maritima provides an insight into salt tolerance mechanisms in halophytes. PLOS ONE. 2016;11(9):e0163485. doi: 10.1371/journal.pone.0163485 PMID: 27682829.
- Zhang X, Yao Y, Li X, et al. Transcriptomic analysis identifies novel genes and pathways for salt stress responses in Suaeda salsa leaves. Sci Rep. 2020;10(1):4236. doi: 10.1038/s41598-020-61204-x
- Tsay Y-F, Schroeder JI, Feldmann KA, et al. The herbicide sensitivity gene CHL1 of arabidopsis encodes a nitrate-inducible nitrate transporter. Cell. 1993;72(5):705–713. doi: 10.1016/0092-8674(93)90399-B