
 ?Mathematical formulae have been encoded as MathML and are displayed in this HTML version using MathJax in order to improve their display. Uncheck the box to turn MathJax off. This feature requires Javascript. Click on a formula to zoom.
Abstract
Comfort is among the priorities of wearers, this creates a requirement to understand and measure footwear comfort within the real-world where footwear is being used. Comfort is subjective however associations have been drawn to biomechanical parameters. Prediction of real-world footwear or insole comfort based upon biomechanical parameters is appealing due to the reduction of potential participant biases. This study aims to develop an equation to predict insole comfort from real-world biomechanics data. Five conditions were evaluated, a control (participant shoe only) and four commercially available insole conditions (Insole A, B, C, D). The RunScribe IMU was worn for one day per condition for the participants normal daily activity, measuring previously validated variables: vertical ground reaction force (GRF), vertical GRF loading rate (GRFr), impact shock (IS), braking shock, total shock, pronation excursion (PE), and maximum pronation velocity (PV). Comfort was measured using a 100 mm visual analogue scale (VAS). A mixed model with fixed effects was used to develop the comfort equation, pseudo r2 statistics were assessed to identify the best equation. All combinations of conditions were tested from single conditions to all 5 together. The following equation was defined using data from insole A and insole B: Comfort = 96.557 + (−0.456*GRFr) + (−11.757*IS) + (−2.869*PE) + (0.142*PV). Marginal pseudo r2 = 0.175 and conditional pseudo r2 = 0.675, meaning that 17.5% of the variance in comfort was explained by the biomechanics variables. Previous footwear comfort equations focused on different biomechanics variables including EMG, plantar pressure, loading rates and lower limb kinematics and reported larger explained variance (34.9%–71.4%). Additional variables would be required to improve the current equation; however, it provides insight into how comfort could be improved for usage within product development, as well as measuring comfort during testing.
Introduction
Shoe comfort is a crucial aspect for manufacturers (Che et al., Citation1994) and wearers, with qualitative research identifying comfort as the most frequently mentioned footwear theme, with the ideal shoe needing to be comfortable (Anderson et al., Citation2017). Further qualitative studies have identified comfort as a priority when purchasing footwear for clinical populations (Frecklington et al., Citation2019; Naidoo et al., Citation2011). Comfort of orthotics and footwear is subjective and highly specific to the individual (Anderson et al., Citation2020). There is no conclusive evidence for the effectiveness of orthotics overall for improving comfort (Menz & Bonanno, Citation2021), however there is prevalent evidence surrounding the effectiveness of contoured orthotics for increasing comfort (Mündermann et al., Citation2001, Citation2003; Springett et al., Citation2007) and reducing pain (De Almeida et al., Citation2016; Springett et al., Citation2007). Limited biomechanical data was collected alongside these comfort reports to fully understand factors contributing to changes in reported comfort in wearers. Custom and prefabricated orthotics utilize contouring to increase the contact between the foot and the orthotic, in turn increasing the pressure in the medial midfoot and subjective comfort (Che et al., Citation1994). Associations have also been made between contoured orthoses and reduction of ankle eversion in both walking and running (Branthwaite et al., Citation2004; Kosonen et al., Citation2017; Rodrigues et al., Citation2013). These findings subsequently link both increased medial midfoot pressure and reduced ankle eversion to increased comfort perception, indicating a potential to utilize midfoot pressure data as a method of estimating frontal plane motion of the foot. Running research has shown inversion–eversion range of motion to contribute negatively (β = −0.268) to subjective footwear comfort within a regression analysis (Ryu et al., Citation2021). Over a series of studies maximum pronation has been shown to have a mixed effect on comfort, with both negative correlations (r = −0.12 to −0.38) showing greater maximum pronation to be associated with improved overall footwear liking, and a positive correlation (r = 0.28) showing decreases in maximum pronation to improve overall footwear liking (Hennig, Citation2017). Research within running has identified reduced loading rates (Dinato et al., Citation2015) and maximum loading rate and reduced vertical impact peak (Mündermann et al., Citation2003) whilst wearing shoes and insoles reported as the most comfortable. Previous research has therefore shown clear variation of comfort which can be related to changes in biomechanics including reduced ground reaction force (GRF) loading rates, frontal plane ankle motion and increased midfoot pressure.
Due to the subjective nature of footwear comfort, traditional measurement relies on the participant reporting comfort through Likert scales, visual analogue scales (VASs), and ranking of preference (Menz & Bonanno, Citation2021). These traditional methods rely on the individual providing an accurate report of the comfort they experience, which can be influenced by a range of factors. Previous research has utilized a trained panel of wearers to ensure reliable comfort measures (Delattre & Cariou, Citation2018), such a panel would be subject to lengthy training processes and may be difficult to implement due to participant availability when footwear developments span multiple years. The ability to develop an equation with the comfort score being dependent upon the biomechanics of the insole product removes the requirement for subjective reports. This eliminates the requirement for external participants within an industry setting, reducing subjectivity and biases from comfort measurement enabling internal comfort testing to be completed. This streamlines testing with only the requirement to collect biomechanical data and removing recall bias when completing questionnaires (Althubaiti, Citation2016) and potential aesthetic bias when testing commercially available products designed to be appealing to consumers (Crolic et al., Citation2019). Limited work has been completed using biomechanics data to predict comfort, this has been completed in running footwear (Dinato et al., Citation2015), insoles (Mündermann et al., Citation2003) and high heeled footwear with total contact inserts (Hong et al., Citation2005). These regression studies reported R2 values of 0.56, 0.35 and 0.72 respectively.
Previous studies relating biomechanical data to footwear comfort perceptions utilize traditional laboratory style data collections with force plates, 3D motion capture, EMG and plantar pressure on flat walkways (Dinato et al., Citation2015; Hong et al., Citation2005; Mündermann et al., Citation2003). These approaches only allow a small number of steps at controlled speeds to be captured in a controlled environment with comfort tested only over this period. This does not necessarily reflect the behaviour of individuals within the real-world, with traditional lower activity occupations completing 2835 steps daily (Steele & Mummery, Citation2003) and more active occupations, such as postal workers completing more than 22,000 steps per day (Tigbe et al., Citation2011). Preference for footwear has also been observed to change from initial assessments to after a workday (Anderson et al., Citation2020), demonstrating the importance of capturing comfort during externally valid use of an insole.
Methods for capturing data within the real-world include inertial measurement units (IMU’s) applied for measurement of sporting movements (Arlotti et al., Citation2022; Eitzen et al., Citation2021) and running (Benson et al., Citation2022). IMU’s have however largely been applied within laboratory scenarios on treadmills for running (Benson et al., Citation2022) despite obvious real-world application. There is some evidence of real-world IMU use, however this is still limited and applications should be broadened into environments where controlling data collection is not as easy as inside the laboratory. The RunScribe IMU is one such system identified for use within the real-world measurement of lower limb biomechanics. Applications to date have assessed the validity (Koldenhoven & Hertel, Citation2018; Lewin et al., Citation2022) and sensitivity (Lewin et al., Citation2023) of the RunScribe, alongside usage as a standalone method for assessment of footwear (Russo et al., Citation2022). The RunScribe is capable of measuring lower limb kinematics, kinetics and accelerations, with some associations to increased comfort (Mündermann et al., Citation2003; Ng et al., Citation2021). IMU’s are however unable to measure plantar pressure which is key within footwear testing for comfort (Mueller, Citation1999). Smart insoles are capable of this (Almuteb et al., Citation2022), however the portability of these is however still under question, as the term ‘smart insole’ covers frequently utilized laboratory grade equipment, such as the Pedar-X and TekScan F-Scan plantar pressure measurement systems. More portable systems that can be feasibly used for real-world data collection may be unsuitable for application within footwear and orthotic testing due to the thickness of the device and impact this may have upon the measured biomechanics and the ability to measure the true impact of the intervention.
Aims and hypothesis
The aim of this study is to develop an equation for prediction of footwear comfort scores based upon biomechanics data from a real-world data collection method. It is hypothesized that the equation will enable a prediction of whether comfort increases or decreases.
Method
Participants
A sample of thirty participants (male = 15, female = 15; age = 31.9 ± 10.8 years, height = 1.73 ± 0.09 m, body mass = 72.7 ± 12.5 kg, UK Shoe size = 7.43 ± 2.19) completed the study protocol given ethical clearance by the University of Salford School of Health and Society Ethics Committee (Reference number 6395). All participants provided written informed consent via a consent form prior to participation in the study protocol.
Insole conditions
Each participant wore five insole conditions (, ) each for a day of wear whilst the RunScribe IMU was used to measure gait parameters. Participants were instructed to complete the study protocol on days where they would be completing the same activities (i.e. Walking the dog, working, etc.). The type of activity was not controlled across participants, as the aim of the study was to capture data from typical daily activities. Participants used a single shoe of their choice for all five days of the data collection. The control condition was the participants shoe with the existing insole, and for the subsequent insole conditions the original insole was removed and replaced with each of the four insole conditions. The order of insoles was randomized, and they were worn for a full day of wear each. Insole conditions were chosen due to their difference in features related to shape and material, and subsequent influence on the outcome variables and perceived comfort.
Figure 1. Insole conditions included within the study.
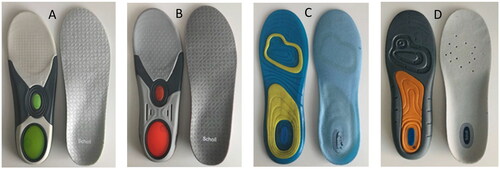
Table 1. Details of insole conditions included within the study.
RunScribe IMU
The RunScribe IMU (Scribe Labs, Moss Beach, CA) is a commercially available IMU used for the measurement of several gait parameters pertinent to the performance of orthotic products. Previous research has been conducted to quantify the validity and sensitivity of the RunScribe IMU for the variables within this study (Lewin et al., Citation2022, Citation2023). The RunScribe units were affixed to the laces of the participants footwear () and calibrated as per manufacturer instructions. This was used for gait measurement throughout the participants normal daily activity to quantify biomechanical gait parameters for further statistical exploration (). The RunScribe quantifies maximum values of biomechanical variables per step, these values were taken for further analysis. Values from left and right feet were averaged to create a single value for each variable. Total number of steps was also extracted and averaged across participants for each of the tested insole conditions.
Figure 2. Placement of the RunScribe IMU and illustration of where the RunScribe extracts variables within data processing: a) GRF rate, b) impact shock, c) pronation excursion and d) maximum pronation velocity.
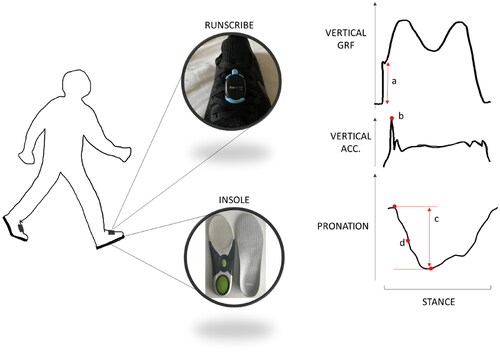
Table 2. Definition of variables measured by the RunScribe IMU.
Visual analogue scale
The visual analogue scale (VAS) was used to measure comfort as it is the most frequently used measurement method (Matthias et al., Citation2021), and offers continuous data for subsequent prediction of comfort scores. The 100 mm VAS was completed immediately following the wear period, and was used to allow participants to give a rating of comfort for each orthotic condition. The left anchor was ‘least comfort imaginable’ with the right anchor being ‘most comfort imaginable’ (Mündermann et al., Citation2002). Participants were instructed to make a mark along the scale to report a comfort score. The distance of the mark from the left side of the line was measured in millimetres and recorded to give a comfort score, where the minimum score would be 0 and the maximum score would be 100.
Statistics
A linear mixed model with fixed effects with comfort as the dependant variable and independent variables: GRF rate, impact shock (IS), pronation excursion (PE) and pronation velocity (PV) was used to define the comfort equation using SPSS statistics version 26 (IBM, Armonk, NY). Independent variables were tested for multicollinearity, independent variables correlated with an r-value greater than 0.7 were assessed for removal, the variable which was deemed less influential to footwear comfort was removed. This included the removal of GRF, total shock and braking shock. The linear mixed model analysis was completed on all combinations of insole conditions from each insole condition alone, to all 5 insole conditions together. Marginal and conditional pseudo R2 were used as an explanation of the percentage of variance explained by the fixed and random factors within the model respectively (Nakagawa & Schielzeth, Citation2013), and was used to determine the best equation for further usage.
The linear mixed model with fixed effects was used as an alternative to a traditional linear regression allowing multiple observations per participant to be included within the analysis. The variables were therefore entered into the model simultaneously without the requirement for contributing to the model in a statistically significant manner.
Results
Group means for all variables tested using the RunScribe including average number of steps taken and perceived comfort on the VAS (), a friedman test showed there was no significant differences between conditions (p = 0.920) for number of steps taken during the testing period.
Table 3. Results from the RunScribe IMU and perceived comfort for all variables entered into the regression analysis (mean ± SD).
Upon assessing model statistics, the best model (EquationEquation (1)(1)
(1) ) was seen when combining insole A and insole B, therefore there was a total of 60 observations entered into the analysis. The mixed model with fixed effects had marginal R2 = 0.175 and conditional R2 = 0.675, and showed IS and PE to be significant predictors of comfort, whereas PV and GRF rate did not add significantly to the model (). Regarding the impact of changes in these variables, reducing GRF rate, IS and PE would increase predicted comfort, whereas reducing PV would reduce the comfort score given by the model.
(1)
(1)
Table 4. Statistics from mixed model with fixed effects analysis used to configure the comfort equation.
Discussion
The purpose of the study was to define an equation for the prediction of insole comfort from biomechanical data collected using a real-world collection method. The variables measured and used to define the equation included kinematic (PE and velocity), kinetic (GRF rate) and acceleration (IS) variables. IS and PE contributed significantly to the equation (p = 0.019 and p = 0.013, respectively), whereas GRF rate (p = 0.849) and PV (p = 0.071) did not. Using group mean data, the predicted comfort given by the equation for the control condition (70.1) is greater than that of insole C (67.7) and insole D (68.5). Regarding the hypothesis of the study, there is some evidence that the equation can detect whether comfort is increasing or decreasing in conditions. In this example specifically that Insole C is less comfortable than both the control condition and insole D. However the predicted relationship between the control condition and insole D was not aligned with the comfort scores given by the participants. Data from insole A and B could not be used within this test as it was used to define the equation; therefore, further work is required to fully determine the accuracy of the comfort scores given by the equation.
The low marginal pseudo R2 value demonstrated the model to only account for 17.5% of the variability of comfort scores to be predicted by the fixed effects within the model. The higher conditional pseudo R2 value shows 67.5% of the variance to be accounted for by the fixed and random effects within the model. The random effects within the model are the tested population, therefore the high conditional R2 values shows a large amount of variation in the comfort scores given by the individuals within the population. Changes in comfort in this instance have a high level of individuality on the participant level, with the variables entered into the equation having a small effect on the comfort score. For example, when wearing insole A one individual had data (GRFr = 15.00 N/kg/s, IS = 1.55 g, PE = 12.60°, PV = 228.53°/s, comfort = 64). Another individual with similar biomechanical data (GRFr = 14.45 N/kg/s, IS = 1.99 g, PE = 13.07°, PV = 242.52°/s, comfort = 34). Thus showing that even with very similar biomechanics, individuals can have very different perceived comfort.
When looking to make predictions as is the case within the current research, the variance explained by the fixed factors only is the most important statistic. A traditional linear regression approach would only allow for a single observation per participant to enter statistical analysis, meaning that the comfort equation would only be defined from a single condition. Using a mixed model with fixed effects in the current method allows for multiple observations per participant to enter the model, allowing the equation to be defined using multiple insole conditions. This allows the equation to be more applicable for future usage as when using one condition the comfort scores could be highly related to specific features of the single condition. This method also reduces the impact of extreme data points (comfort reports or biomechanical variables) that are input into the analysis as a greater number of observations were entered when using two conditions (60) than one (30).
Despite not all resulting in significant relationships, the variables in the equation were all included as relevant factors that could be considered in footwear design to promote comfort. Reduction in GRF rate has previously been linked to increased comfort (Ng et al., Citation2021) and is indicative of cushioning properties within footwear (Logan et al., Citation2010; Soares et al., Citation2018). Increased insole thickness and contouring enables reduced IS with no subsequent effect on comfort perception (Bonanno et al., Citation2019). Insoles have frequently displayed effectiveness in reduction of foot and ankle motion resulting from increased contouring (Cheung et al., Citation2011), however, no studies within this meta-analysis assessed impacts upon comfort. Within the current equation increasing maximum PV would increase the comfort score, however this was initially assumed to contribute negatively to comfort due to the perceived association with lower limb injuries (Messier & Pittala, Citation1988). The interaction between PE and PV must be considered for their impact upon one another. If the overall amount of pronation is reduced, it would be assumed that PV would also reduce as there is less joint rotation to be completed within the same timeframe, with these two factors have opposite effects on the predicted comfort score. Although not included in the current investigation, these pronation variables could be associated with prior outcomes assessed using plantar pressure in the medial midfoot (Dos Santos et al., Citation2017). Increased plantar pressure from insole application in the medial midfoot (Che et al., Citation1994) and overall midfoot (Yung-Hui & Wei-Hsien, Citation2005) increases reported footwear comfort. Increasing the medial arch height of an insole may therefore positively impact comfort by reducing PE, increasing medial midfoot pressure, and potential contributions to reduced IS, whereby two of these factors positively contributed to comfort in the current investigation.
Previous research predicting footwear comfort from biomechanics data utilized a wide range of variables within the analysis (Mündermann et al., Citation2003). This research reported the equation to account for 34.9% of the variance for differences in comfort using 15 variables including Kinetics, Kinematics, and EMG. EMG data was collected on 7 lower limb muscles, with 9 variables taken from each site. The final equation included 10 EMG measurements out of 15 total variables. Kinematic and kinetic variables entered included internal tibial rotation, maximum ankle plantarflexion, maximum foot inversion, maximum ankle plantarflexion moment and vertical impact peak of GRF. Comparing these previous results with those in the current investigation, both equations include a measure of ankle kinematics. The equation previously defined (Mündermann et al., Citation2003) includes maximum inversion angle as a factor in which an increase in this angle would increase comfort score given by the equation. The current equation shows the predicted comfort score to be reduced as a result of increased pronation. These two findings may contrast each other, the greater maximum inversion angle associated with increased comfort (Mündermann et al., Citation2003) could be indicative of an increased eversion range of motion, which in the current investigation has been shown to have a negative impact on perceived comfort.
Other prediction of comfort work used multiple linear regression and entered eight variables: peak forefoot pressure, peak rearfoot pressure, forefoot pressure integral, forefoot contact areas, loading rate at 80 (force rate between 20 and 80% of foot and ground contact during first peak), loading rate at 100 (force rate between 0 and 100% of the first peak), first and second peak forces and peak push-off rate (rate of second peak force between minimum value until the second peak) (Dinato et al., Citation2015). The equation reported for whole foot comfort within this study had an adjusted R2 = 0.56. Research conducted in high heeled footwear with a total contact orthotic used stepwise regression to identify factors towards reported comfort measured on a 100 mm VAS (Hong et al., Citation2005). The stepwise analysis entered peak midfoot pressure, impact force, and the first peak vertical GRF to define an equation that explained 71.4% of the variance in reported comfort. Both of these studies identify a kinetics variable as a significant predictor within the regression model, which is not the case with GRF rate within the current results. The current RunScribe method cannot measure GRF directly and uses an equation defined during running (Di Michele, Citation2008) utilizing other variables that can be measured by the RunScribe to calculate GRF and GRF rate. Validation within walking has shown moderate intraclass correlation coefficients (0.627) for GRF rate (Lewin et al., Citation2022).
Previous studies were completed during running (Dinato et al., Citation2015; Mündermann et al., Citation2003) or in high heeled footwear (Hong et al., Citation2005) which may reduce the transferability of results to this study. It could be concluded that additional, more complex variables would be required within the current equation to improve prediction of comfort. The nature of the data collection method used within this study is low cost ($599) compared to more traditional methods of measuring the included variables, with low participant burden whilst collecting data within the real world. This is more accessible within an industry setting, whereby the availability of equipment and individuals for implementation of some of the more complex variables is low. However, this real-world approach introduces further variables affecting comfort perceptions beyond control which are not present within the laboratory scenario. By capturing data over multiple days there is potential effect of different activity intensity over different days, but also a range of psychological factors which may impact general mood across different days impacting comfort scores either negatively or positively. The utilization of a comfort equation is beneficial within industry settings to aid the development process, enabling testing to be streamlined within the early stages. As traditional comfort measures are reliant on participant reports (Menz & Bonanno, Citation2021), a comfort equation requires only quantitative data to be collected, processed and entered into the equation to generate comfort data. In an industry setting this will enable comfort data to be generated internally, where brand bias would impact the ability for internal participants to give a reliable comfort score. This allows product benchmarking to be completed based upon the scores of previous products, ensuring future experimental developments are superior before progressing through development phases. Regression analysis has been previously used primarily to identify the biomechanical contributors to footwear comfort (Dinato et al., Citation2015; Hong et al., Citation2005; Mündermann et al., Citation2003), enabling data collected to be actionable through knowledge of footwear and orthotic design and subsequent impact on lower limb biomechanics for input into the equation. The current equation explains a low percentage of variance (17.5%); however, the coefficients within the equation demonstrate an impact upon the comfort score in response to biomechanical changes resulting from changes in orthotic design. Material properties can impact loading rates and IS which shifts the predicted comfort scores. Similarly with orthotic shapes for control of motion, changes in kinematic properties at the foot and ankle shift the predicted comfort score given by the equation. Using the group average values from the current investigation there is only a maximum change in predicted comfort of 2.4 mm, which does not meet the level of minimal clinical important difference of 9.6 mm or 10.2 mm defined for the VAS (Mills et al., Citation2010). Utilizing the coefficients and the previously defined MCID a specific magnitude of change in biomechanics can be targeted within orthotic design to ensure a meaningful change in comfort is created. Within the industry setting this would allow for decisions to be made on design specifications when moving through development phases. Such an equation would also enable consistency in the outcome across developments. If collecting comfort in more traditional ways, subjective comfort measures would have to be generated from the same group of individuals within a controlled environment, which would be difficult to implement spanning developments over multiple years.
A large limitation within the development of the comfort equation is related to the benefit of the data collection environment. In order to collect data from the regular daily activities of participants there is an absence of control within the real-world environment leading to a range of variables which may influence comfort not being controlled. These have been discussed and include activity intensity and duration requests were however made to participants to complete the testing on days that would be similar, which appears to have been followed due to non-significant differences in number of steps. Footwear fit may have also impacted the comfort scores given by the participants, as insole conditions differed in thickness this may have impacted fit across each of these conditions. This introduces another factor contributor to footwear comfort that is not accounted for within the equation. These factors could contribute to the comparatively weaker predictions of the current equation compared to those from a laboratory study.
Conclusion
The equation formed by this study contributes towards the prediction of orthotic comfort during everyday use. The equation however accounts for a very low percentage of the variance in comfort reports. The use case of a comfort equation within industry is strong, enabling comfort to be quantified without the need for external opinions. The ability to action results through knowledge of insole design and biomechanical response is also crucial within the product development process allowing meaningful changes to be made in a calculated manner.
Acknowledgments
This article was written within a Knowledge Transfer Partnership funded by Innovate UK and Scholl’s Wellness Company (KTP011560). The funder or company had no involvement in the data collection, processing or paper writing. This grant was hosted at the University of Salford and achieved with Prof Chris Nester as PI and Dr Carina Price as CO-I.
Disclosure statement
The authors report there are no competing interests to declare.
Data availability statement
The data are available upon reasonable request made to the corresponding author.
Additional information
Funding
References
- Almuteb, I., Hua, R., & Wang, Y. (2022). Smart insoles review (2008-2021): Applications, potentials, and future. Smart Health, 25, 100301. https://doi.org/10.1016/j.smhl.2022.100301
- Althubaiti, A. (2016). Information bias in health research: Definition, pitfalls, and adjustment methods. Journal of Multidisciplinary Healthcare, 9, 211–217. https://doi.org/10.2147/JMDH.S104807
- Anderson, J., Williams, A. E., & Nester, C. (2017). An explorative qualitative study to determine the footwear needs of workers in standing environments. Journal of Foot and Ankle Research, 10(1), 41. https://doi.org/10.1186/s13047-017-0223-4
- Anderson, J., Williams, A. E., & Nester, C. (2020). Development and evaluation of a dual density insole for people standing for long periods of time at work. Journal of Foot and Ankle Research, 13(1), 42. https://doi.org/10.1186/s13047-020-00402-2
- Arlotti, J. S., Carroll, W. O., Afifi, Y., Talegaonkar, P., Albuquerque, L., Burch, R. F. V., Ball, J. E., Chander, H., & Petway, A. (2022). Benefits of IMU-based wearables in sports medicine: Narrative review. International Journal of Kinesiology and Sports Science, 10(1), 36–43). https://doi.org/10.7575/aiac.ijkss.v.10n.1p.36
- Benson, L. C., Räisänen, A. M., Clermont, C. A., & Ferber, R. (2022). Is this the real life, or is this just laboratory? A scoping review of IMU-based running gait analysis. Sensors, 22(5), 1722. https://doi.org/10.3390/s22051722
- Bonanno, D. R., Ledchumanasarma, K., Landorf, K. B., Munteanu, S. E., Murley, G. S., & Menz, H. B. (2019). Effects of a contoured foot orthosis and flat insole on plantar pressure and tibial acceleration while walking in defence boots. Scientific Reports, 9(1), 1688. https://doi.org/10.1038/s41598-018-35830-5
- Branthwaite, H. R., Payton, C. J., & Chockalingam, N. (2004). The effect of simple insoles on three-dimensional foot motion during normal walking. Clinical Biomechanics, 19(9), 972–977. https://doi.org/10.1016/j.clinbiomech.2004.06.009
- Che, H., Nigg, B. M., & De Koning, J. (1994). Relationship between plantar pressure distribution under the foot and insole comfort. Clinical Biomechanics, 9(6), 335–341. https://doi.org/10.1016/0268-0033(94)90062-0
- Cheung, R. T. H., Chung, R. C. K., & Ng, G. Y. F. (2011). Efficacies of different external controls for excessive foot pronation: A meta-analysis. British Journal of Sports Medicine, 45(9), 743–751. https://doi.org/10.1136/bjsm.2010.079780
- Crolic, C., Zheng, Y., Hoegg, J., & Alba, J. W. (2019). The influence of product aesthetics on consumer inference making. Journal of the Association for Consumer Research, 4(4), 398–408. https://doi.org/10.1086/705033
- De Almeida, J. S., Vanderlei, F. M., Pastre, E. C., Martins, R. A. D. M., Padovani, C. R., & Filho, G. C. (2016). Comparison of two types of insoles on musculoskeletal symptoms and plantar pressure distribution in a work environment: A randomized clinical trial. Clinical Medicine & Research, 14(2), 67–74. https://doi.org/10.3121/cmr.2016.1301
- Delattre, N., & Cariou, A. (2018). Women perception of shoe cushioning as a function of mechanical properties of footwear using a sensory trained panel method. Footwear Science, 10(1), 11–19. https://doi.org/10.1080/19424280.2017.1403973
- Di Michele, R. (2008). Relationships between running economy and mechanics in middle-distance runners [Dissertation thesis]. Alma Mater Studiorum Università di Bologna. Dottorato di ricerca in Discipline delle attività motorie e sportive, 20 Ciclo. https://doi.org/10.6092/unibo/amsdottorato/783.
- Dinato, R. C., Ribeiro, A. P., Butugan, M. K., Pereira, I. L. R., Onodera, A. N., & Sacco, I. C. N. (2015). Biomechanical variables and perception of comfort in running shoes with different cushioning technologies. Journal of Science and Medicine in Sport, 18(1), 93–97. https://doi.org/10.1016/j.jsams.2013.12.003
- Dos Santos, J. O. L., Manfio, E. F., Carpes, F. P., Bezerra, E. D. S., Palhano, R., & Avila, A. O. V. (2017). Change of pronation angle of the subtalar joint has influence on plantar pressure distribution. Revista Brasileira de Cineantropometria e Desempenho Humano, 19(3), 316–322. https://doi.org/10.5007/1980-0037.2017v19n3p316
- Eitzen, I., Renberg, J., & Færevik, H. (2021). The use of wearable sensor technology to detect shock impacts in sports and occupational settings: A scoping review. Sensors (Basel, Switzerland), 21(15), 4962. https://doi.org/10.3390/s21154962
- Frecklington, M., Williams, A., Dalbeth, N., McNair, P., Gow, P., & Rome, K. (2019). The footwear experiences of people with gout: A qualitative study. Journal of Foot and Ankle Research, 12(1), 38. https://doi.org/10.1186/s13047-019-0349-7
- Hennig, E. (2017). Running shoe quality perception of runners can be predicted from biomechanical variables. Footwear Science, 9(sup1), S5–S6. https://doi.org/10.1080/19424280.2017.1313890
- Hong, W. H., Lee, Y. H., Chen, H. C., Pei, Y. C., & Wu, C. Y. (2005). Influence of heel height and shoe insert on comfort perception and biomechanical performance of young female adults during walking. Foot & Ankle International, 26(12), 1042–1048. https://doi.org/10.1177/107110070502601208
- Koldenhoven, R. M., & Hertel, J. (2018). Validation of a wearable sensor for measuring running biomechanics. Digital Biomarkers, 2(2), 74–78. https://doi.org/10.1159/000491645
- Kosonen, J., Kulmala, J. P., Müller, E., & Avela, J. (2017). Effects of medially posted insoles on foot and lower limb mechanics across walking and running in overpronating men. Journal of Biomechanics, 54, 58–63. https://doi.org/10.1016/j.jbiomech.2017.01.041
- Lewin, M., Price, C., & Nester, C. (2022). Validation of the RunScribe inertial measurement unit for walking gait measurement. PLoS One, 17(8), e0273308. https://doi.org/10.1371/journal.pone.0273308
- Lewin, M., Price, C., & Nester, C. (2023). Can a shoe-mounted IMU identify the effects of orthotics in ways comparable to gait laboratory measurements? Journal of Foot and Ankle Research, 16(1), 54. https://doi.org/10.1186/s13047-023-00654-8
- Logan, S., Hunter, I., Hopkins, J. T., Feland, J. B., & Parcell, A. C. (2010). Ground reaction force differences between running shoes, racing flats, and distance spikes in runners. Journal of Sports Science & Medicine, 9(1), 147–153. http://www.jssm.org
- Matthias, E. C., Banwell, H. A., & Arnold, J. B. (2021). Methods for assessing footwear comfort: A systematic review. Footwear Science, 13(3), 255–274. https://doi.org/10.1080/19424280.2021.1961879
- Menz, H. B., & Bonanno, D. R. (2021). Footwear comfort: A systematic search and narrative synthesis of the literature. Journal of Foot and Ankle Research, 14(1), 63. https://doi.org/10.1186/s13047-021-00500-9
- Messier, S. P., & Pittala, K. A. (1988). Etiologic factors associated with selected running injuries. Medicine and Science in Sports and Exercise, 20(5), 501–505. https://doi.org/10.1249/00005768-198810000-00012
- Mills, K., Blanch, P., & Vicenzino, B. (2010). Identifying clinically meaningful tools for measuring comfort perception of footwear. Medicine and Science in Sports and Exercise, 42(10), 1966–1971. https://doi.org/10.1249/MSS.0b013e3181dbacc8
- Mueller, M. (1999). Application of plantar pressure assessment in footwear and insert design. Journal of Orthopaedic & Sports Physical Therapy, 29(12), 747–755. https://doi.org/10.2519/jospt.1999.29.12.747
- Mündermann, A., Nigg, B. M., Humble, R. N., & Stefanyshyn, D. J. (2003). Orthotic comfort is related to kinematics, kinetics, and EMG in recreational runners. Medicine and Science in Sports and Exercise, 35(10), 1710–1719. https://doi.org/10.1249/01.MSS.0000089352.47259.CA
- Mündermann, A., Nigg, B. M., Stefanyshyn, D. J., & Neil Humble, R. (2002). Development of a reliable method to assess footwear comfort during running. Gait & Posture, 16(1), 38–45.). https://doi.org/10.1016/s0966-6362(01)00197-7
- Mündermann, A., Stefanyshyn, D. J., & Nigg, B. M. (2001). Relationship between footwear comfort of shoe inserts and anthropometric and sensory factors. Medicine & Science in Sports & Exercise, 33(11), 1939–1945. http://www.acsm-msse.org
- Naidoo, S., Anderson, S., Mills, J., Parsons, S., Breeden, S., Bevan, E., Edwards, C., & Otter, S. (2011). “I could cry, the amount of shoes I can’t get into”: A qualitative exploration of the factors that influence retail footwear selection in women with rheumatoid arthritis. Journal of Foot and Ankle Research, 4(1), 21. https://doi.org/10.1186/1757-1146-4-21
- Nakagawa, S., & Schielzeth, H. (2013). A general and simple method for obtaining R2 from generalized linear mixed-effects models. Methods in Ecology and Evolution, 4(2), 133–142. https://doi.org/10.1111/j.2041-210x.2012.00261.x
- Ng, J. W., Chong, L. J. Y., Pan, J. W., Lam, W. K., Ho, M., & Kong, P. W. (2021). Effects of foot orthosis on ground reaction forces and perception during short sprints in flat-footed athletes. Research in Sports Medicine, 29(1), 43–55. https://doi.org/10.1080/15438627.2020.1755673
- Rodrigues, P., Chang, R., TenBroek, T., & Hamill, J. (2013). Medially posted insoles consistently influence foot pronation in runners with and without anterior knee pain. Gait & Posture, 37(4), 526–531. https://doi.org/10.1016/j.gaitpost.2012.09.027
- Russo, L., Montagnani, E., Buttari, D., Ardigò, L. P., Melenco, I., Larion, A., Migliaccio, G. M., & Padulo, J. (2022). Track running shoes: A case report of the transition from classical spikes to “super spikes” in track running. Applied Sciences, 12(20), 10195. https://doi.org/10.3390/app122010195
- Ryu, S., Stefanyshyn, D., Kong, S., & Park, S. K. (2021). Effects of a curved heel shape in a running shoe on biomechanical variables and comfort. Applied Sciences, 11(8), 3613. https://doi.org/10.3390/app11083613
- Soares, D., Charalambous, L., Rodrigues, P., & Mitchell, A. (2018). Effects of midsole thickness on single leg drop landing ground reaction force and dynamic stability. https://commons.nmu.edu/isbs/vol36/iss1/122
- Springett, K. P., Otter, S., & Barry, A. (2007). A clinical longitudinal evaluation of pre-fabricated, semi-rigid foot orthoses prescribed to improve foot function. The Foot, 17(4), 184–189. https://doi.org/10.1016/j.foot.2007.04.005
- Steele, R., & Mummery, K. (2003). Occupational physical activity across occupational categories. Journal of Science and Medicine in Sport, 6(4), 398–407. https://doi.org/10.1016/s1440-2440(03)80266-9
- Tigbe, W. W., Lean, M. E. J., & Granat, M. H. (2011). A physically active occupation does not result in compensatory inactivity during out-of-work hours. Preventive Medicine, 53(1–2), 48–52. https://doi.org/10.1016/j.ypmed.2011.04.018
- Yung-Hui, L., & Wei-Hsien, H. (2005). Effects of shoe inserts and heel height on foot pressure, impact force, and perceived comfort during walking. Applied Ergonomics, 36(3), 355–362. https://doi.org/10.1016/j.apergo.2004.11.001