
Abstract
Pop-up satellite archival tags (n = 31) were deployed on Yellowfin Tuna Thunnus albacares in the Gulf of Mexico for periods ranging from 14 to 95 d. Differences in diel vertical behavior were assessed by comparing time spent at temperature relative to the surface temperature (ΔT). Pooled samples revealed that 31% of darkness hours, 20% of twilight hours, and 12% of daylight hours were spent in the uniform-temperature surface layer (i.e., ΔT = 0). Total time spent above 100 m was less during daylight (90.0%) than during darkness (99.8%), suggesting greater exploration of deeper depths during daylight hours. Maximum depth visited ranged from 208 to 984 m, and minimum temperature visited ranged from 5.4°C to 11.8°C. Only a small proportion of total time was spent at temperatures colder than 8°C below the surface temperature. Horizontal excursions for the majority of individuals were less than 100 km from the point of release; however, three individuals moved distances of 411–1,124 km, suggesting that this species has the capability to move relatively long distances within the Gulf of Mexico. The ΔT values are provided in tabular format and serve as direct input variables for use in habitat standardization models.
Received January 7, 2014; accepted June 8, 2014
The Yellowfin Tuna Thunnus albacares is a highly migratory pelagic fish that is distributed worldwide in most tropical and subtropical areas. Economically, this species represents the number-one tropical tuna harvested by U.S. commercial fishermen in the Atlantic Ocean (NMFS Citation2013). The International Commission for the Conservation of Atlantic Tunas (ICCAT) is mandated to manage the single Atlantic-wide Yellowfin Tuna stock. This includes a responsibility to gather catch and effort data, conduct stock assessments, determine stock abundance, and invoke management practices that conserve the stock. Uncertainties do occur in the stock assessment process, particularly in instances where catch data are deficient or where gear interactions are poorly understood. Incorporating relevant biological data into the stock assessment process can reduce these uncertainties because catch itself is influenced by individual species’ behavior and habitat preferences. For example, a correlation between the temporal and spatial behavior of tunas and their vulnerability to longline and surface fishing gears has been demonstrated (Boggs Citation1992; Bigelow and Maunder Citation2007).
Integration of vertical habitat preference and hook depth with catch and effort statistics is useful for reducing uncertainties associated with estimating relative abundance (Maunder et al. Citation2006). Key factors influencing habitat use by Yellowfin Tuna include environmental conditions, physiological traits, and foraging behavior (Brill and Lutcavage Citation2001). Hinton and Nakano (Citation1996) introduced a model incorporating behavioral constraints into the standardization of catch and effort statistics. Major input variables for the model include the proportions of time spent within each degree of water temperature relative to the surface temperature (ΔT); ΔT is a major environmental factor governing the vertical habitat preference (i.e., depth distribution) of tunas and tuna-like species (Hinton and Nakano Citation1996; Brill and Lutcavage Citation2001; Goodyear et al. Citation2008; Hoolihan et al. Citation2011b).
One mechanism that allows monitoring of horizontal and vertical movements of marine species is electronic tagging (Sibert and Nielsen Citation2001; Nielsen et al. Citation2009). Previous electronic tagging studies have indicated that Yellowfin Tuna prefer to spend most of their time above the thermocline in the uniform-temperature surface layer (Block et al. Citation1997; Brill et al. Citation1999a; Schaefer et al. Citation2007; Weng et al. Citation2009). Pop-up satellite archival tags (PSATs) offer certain advantages over other types of electronic tags. The PSATs can be deployed for comparatively long periods (months) extending well beyond the time it typically takes the fish to recover and resume normal behavior after capture (Hoolihan et al. Citation2011a). The PSATs also have the advantage of being less dependent on fisheries than other tagging technologies, which require recapture (Arnold and Dewar Citation2001); PSATs need not be physically retrieved for data recovery. Instead, the PSAT detaches from the fish on a pre-programmed date and then transfers the stored data via the Argos satellite system (Block et al. Citation1998). The objective of this study was to deploy PSATs on Yellowfin Tuna in the Gulf of Mexico (GOM) to (1) investigate horizontal and vertical movement behavior and (2) compile detailed habitat use information that can be applied to spatiotemporal distributions and relative abundance estimations using habitat standardization modeling.
METHODS
We examined data that were collected from PSATs deployed on Yellowfin Tuna (n = 31) in the northern GOM during 2008–2011 (models MK10-PAT and Mini-PAT; Wildlife Computers, Redmond, Washington). Specimens were captured in the proximity of petroleum production platforms by using recreational fishing gear, and a 71- × 127-cm Frabill landing net (Plano Molding Company, Plano, Illinois) was then used to lift the fish onboard for tagging. Net and fish were placed together on a “bean bag” chair; a wet cloth was used to subdue the fish by covering the eyes, and a hose running salt water was placed in the mouth for gill aeration. The PSAT tethers consisted of a medical-grade nylon anchor with toggles attached to approximately 18 cm of 181.4-kg (400-lb) monofilament. Anchors were inserted in an anterolateral direction between the pterygiophores of the first or second dorsal fin. Tags were programmed to collect depth (pressure), ambient temperature, and light level data at 10- or 15-s intervals. The PSATs were programmed for deployment periods of 90, 150, or 180 d (). Our analysis included Argos-transmitted summary data from either 1-h or 4-h time blocks programmed into the PSATs. Each time block included (1) the proportion of time spent within each depth bin (25-m resolution); (2) the proportion of time spent within each temperature bin (2°C bin resolution); and (3) PSAT depth–temperature (PDT) profile messages. For cases in which PSATs were physically recovered (n = 7), the full archived data recorded at 10- or 15-s intervals were accessible.
TABLE 1. Summary of tagging information for 31 Yellowfin Tuna that were monitored with pop-up satellite archival tags (PSATs; Wildlife Computers) in the Gulf of Mexico (PAT = pop-up archival transmitting tag; DAL = days at liberty).
Using methods described by Luo et al. (Citation2006), the distribution patterns of pooled data by hours of darkness, twilight, and daylight were interpolated using linear methods to 1°C temperature bins and 1-m depth bins. Luo et al. (Citation2006) concluded that there is a very low rate of error associated with this method of simulation. These bin periods were determined by comparing the time of sunrise and sunset at release and pop-up locations. A daylight bin was defined when the entire bin duration fell between 1 h after sunrise and 1 h before sunset. A darkness bin was defined when the entire bin duration fell between 1 h after sunset and 1 h before sunrise. All bins that did not fit into one of these two categories were classified as crepuscular (i.e., twilight). This was done to ensure that the daylight and darkness categories were not compromised by bins falling into the crepuscular periods. The PDT data for a depth of 1 m or less were used to calculate average daily surface temperature (T0). When surface temperatures were lacking, previous and subsequent day records were used to linearly interpolate values. Generated temperatures (GTs) per hour (n = 720) were estimated for each depth bin using a random normal distribution based on the PDT temperature range. The GT histogram was then compared to the temperature (T) data histogram. Differences in numbers were corrected by removing values in positive bins and adding them randomly to the negative bins. Values of ΔT were then calculated by subtracting the GT values from the T0 values, and we tabulated the proportion of time spent at decreasing temperatures with a 1°C bin resolution. Proportions of records within successively deeper layers of temperature relative to the surface temperature (ΔT) were assembled, and the mean ΔT values were calculated for each distribution (Hoolihan et al. Citation2012b).
WC-DAP and WC-GPE2 software (Wildlife Computers) were used for the initial processing of light-level geolocation data, followed by a sea surface temperature-corrected Kalman filter (Nielsen et al. Citation2006; Lam et al. Citation2008). A custom bathymetry filter was then used to relocate any points that were on land or in shallow water based on 2- × 2-min grid ETOPO2 bathymetry data (National Geophysical Data Center Citation2006) and the daily maximum depth from the tag. For each point where maximum daily depth was greater than the bathymetric depth, we selected all grid cells along the longitude where bathymetric depth was greater than the daily maximum depth within ±1°C of the previous day's latitude, and we then assigned a final location to a single cell that was randomly selected from that group (Hoolihan and Luo Citation2007).
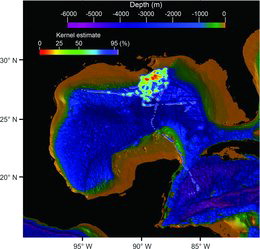
Horizontal movements were analyzed for spatial variation using the kernel density estimators described by Worton (Citation1995). Estimated values were cumulated based on highest to lowest areas of density whereby the 25% kernel area contour is reflective of the highest observed densities and the 95% contours represent up to 95% density areas (Hammerschlag et al. Citation2012). Values were plotted using Interactive Data Language software (www.ittvis.com).
RESULTS
We deployed PSATs on 31 Yellowfin Tuna in the GOM to monitor vertical and horizontal habitat use. Of these, six PSATs were excluded from our analyses because the fish either died or the PSAT remained attached for less than 10 d (Hoolihan et al. Citation2011a). The remaining 25 fish included in our analyses ranged in size from 98 to 158 cm FL, with estimated weights ranging from 22.6 to 70.0 kg. Days at liberty (DAL) ranged from 14 to 95 (mean = 45.2 DAL), while linear displacement between the release and pop-up locations ranged from 0 to 1,128 km (mean = 146.0; ).
Vertical Behavior
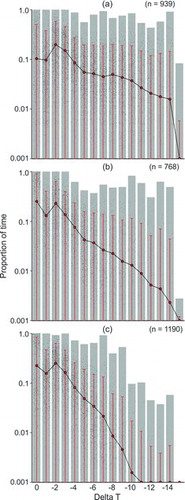
Differences in diel vertical behavior of Yellowfin Tuna were compared by pooling individual histogram sets derived from periods of daylight (n = 1,190), twilight (n = 768), and darkness (n = 939) and were illustrated by using the range and proportions of time spent at ΔT for each period (). The derived percentiles of mean ΔT for the pooled samples revealed that around 12% of daylight hours, 20% of twilight hours, and 31% of darkness hours were spent in the uniform-temperature surface layer (i.e., ΔT = 0; ). The distributions for the percentiles of mean ΔT did exhibit variability.
TABLE 2. Proportions of time spent at each temperature relative to the surface temperature (ΔT) during darkness, twilight, and daylight for 25 Yellowfin Tuna that were monitored with pop-up satellite archival tags (PSATs). Proportions were derived from combined data (archival data recovered from MK-10 PSATs; mini-PAT series data; and archival data simulated from transmitted MK-10 PSATs). Dashes indicate zero probability. Data were sorted in order of decreasing ΔT (left column); proportions of time spent at the various temperatures were then calculated for a range of percentiles. As an example, for 75% of the data points during darkness, 10.6% were at surface temperature (ΔT = 0, top row) and 30.6% were at 2°C below surface temperature (ΔT = −2, third row).
The distributions for time (%) spent at depth during the daytime and nighttime were significantly different (χ2 = 35.4, df = 15, P < 0.001), showing that more time was spent nearer to the surface during darkness (). For example, 52.4% of time was recorded in the upper 20 m of the water column at night compared with just 20.9% during daylight hours. The distributions of time at temperature were significantly different as well (χ2 = 35.8, df = 20, P < 0.05), corresponding to the differences in the time-at-depth distributions (). Total time spent above 100 m was less (90.0%) during daylight than during darkness (99.8%), suggesting more exploration of deeper depths during the daylight hours ().
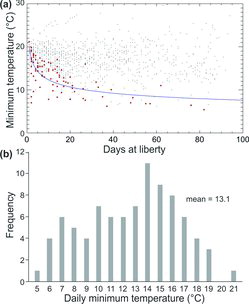
Preference of Yellowfin Tuna for the uniform-temperature surface layer was obvious from the ΔT time-at-temperature distributions (), although it did not preclude short-duration dives into deeper, colder strata. The maximum depths visited by individuals from this group ranged from 208 to 984 m, and minimum temperatures visited ranged from 5.4°C to 11.8°C. Vertical movements to depths below the thermocline were generally brief and occurred infrequently relative to vertical movements within the uniform-temperature surface layer. We questioned whether the longer monitoring periods in our study would provide a more detailed account of actual Yellowfin Tuna habitat use in comparison with earlier short-term studies (Holland et al. Citation1990; Brill et al. Citation1999a). If true, we surmised that encountering evidence of deeper dives and lower minimum temperatures should increase with the length of deployment. To confirm this, we compared novel maximum daily depths and minimum temperatures with DAL (, ). The novel maximum daily depth (Dmax) increased, extending into deeper strata over time (i.e., DAL; Dmax = 113.55·DAL0.376; r = 0.708, F = 85.2, df = 86, P < 0.0001; ). There was also a trend toward colder novel minimum daily temperatures over time (Dmax = 19.96·DAL−0.209; r = −0.678, F = 73.3, df = 87, P < 0.0001), reflecting the trend observed for increasing daily maximum depths (). However, both the novel maximum daily depths and minimum temperatures were highly variable over time (, ).
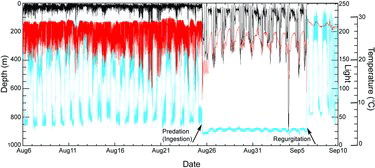
Mortality by predation was suspected for at least four Yellowfin Tuna in our study () based on their altered vertical habitat use (i.e., depth and temperature readings). For example, PSAT data from fish 3 () indicated a radical change in behavior after about 20 DAL (). Maximum depths increased greatly, but ambient water temperature readings were much warmer than expected for the depths attained. Rather, they were more consistent with internal abdominal temperature, suggesting predation (e.g., shark) and ingestion of the PSAT. Depth and temperature data suggested that this PSAT () was regurgitated after about 30 DAL, allowing it to float to the surface and transmit.
Horizontal Behavior
The kernel density estimated from horizontal tracking data indicated that the highest densities of movement were confined to a relatively small area around the release locations (). Three individuals (fish 23, 24, and 26; ) undertook more lengthy excursions. Fish 23 moved 557 km to the western GOM; fish 24 moved 1,124 km in a southerly direction into the Caribbean; and fish 26 moved southeasterly 411 km into the area of the Loop Current. All three fish exhibited higher periods at liberty (85–90 DAL). However, time was not the sole factor regulating long-distance movement, as many other tagged fish had comparable DAL periods and remained in relative proximity to their release locations (; ).
DISCUSSION
Habitat preference and vertical movement behavior of Yellowfin Tuna are influenced by a variety of factors, including physiological capabilities, oceanographic features, environmental conditions, and prey species behavior (Dizon and Brill Citation1979; Block et al. Citation1997; Brill and Lutcavage Citation2001). Yellowfin Tuna in the GOM remained primarily within the uniform-temperature surface layer. This was similar to the findings of Weng et al. (Citation2009) for six PSAT-monitored Yellowfin Tuna in the GOM and to the results of earlier ultrasonic tracking studies near Hawaii, California, French Polynesia, and the Comoros Islands (Carey and Olson Citation1982; Holland et al. Citation1990; Cayré and Marsac Citation1993; Block et al. Citation1997; Josse et al. Citation1998; Brill et al. Citation1999a). A notable difference between PSAT and ultrasonic tracking studies is that extremes in the maximum depth and minimum temperature used are more likely to be detected over the longer deployment periods associated with PSAT use (, ). Yellowfin Tuna were present in deeper, colder depths below the thermocline, albeit with less frequency and for shorter periods in comparison with vertical movement activities above the thermocline (Schaefer et al. Citation2011). Our study recorded Yellowfin Tuna as deep as 984 m, with ambient temperatures as low as 5.4°C. Studies based on implanted archival tagging of Yellowfin Tuna in the eastern Pacific Ocean revealed that the fish are capable of diving to at least 1,600 m (Schaefer et al. Citation2014). Presumably, the main purpose of deep diving is associated with foraging activity, which also allows them to prey upon deep-dwelling species. Deep diving can also be an advantage when used tactically to elude predators, such as sharks and billfishes.
Constraints on cardiac function are the primary reason why Yellowfin Tuna do not spend more time below the warmer uniform-temperature surface layer (Brill and Lutcavage Citation2001). Heart temperature in tunas and billfishes is directly affected by changes in water temperature because the heart is on the water side of their vascular countercurrent heat exchangers (Brill et al. Citation1999b; Galli et al. Citation2009). This fact supports prior evidence that most tropical tunas and billfishes generally seek out the warmest water available and is further supported by empirical data showing that Yellowfin Tuna, Blue Marlins Makaira nigricans, White Marlins Kajikia albida, and Sailfish Istiophorus platypterus usually spend only a small fraction of total time at temperature in waters colder than −8 ΔT (Goodyear et al. Citation2008; Hoolihan et al. Citation2011b, Citation2012a).
Because tunas and billfishes are sight feeders, their foraging activities should be more prevalent during daylight hours. The presumption that most descents below the thermocline are associated with foraging activity is supported by comparing the percentiles of mean ΔT for darkness and daylight hours for Yellowfin Tuna in the present study (). The percentiles plainly indicate an increased use of deeper, colder depths during daylight hours and more surface-oriented behavior during darkness, suggesting an opportunity to take advantage of warmer temperatures when foraging opportunities are low. Previous studies have also reported greater deep-diving behavior during daylight hours for Yellowfin Tuna as well as billfishes, which share similar physiological traits (Holland et al. Citation1990; Block et al. Citation1997; Brill et al. Citation1999a; Schaefer et al. Citation2007, 2011, 2014; Goodyear et al. Citation2008; Weng et al. Citation2009; Hoolihan et al. Citation2011b, Citation2012a).
While ambient temperature is clearly a major factor limiting vertical movements of Yellowfin Tuna, other factors also affect their use of vertical habitat. Brill (Citation1996) pointed out several high-performance physiological traits of Yellowfin Tuna, including rapid rates of somatic growth, gonadal growth, digestion, and recovery from exhaustive exercise. Each of these energy demands requires oxygen delivery rates in excess of those needed for routine metabolic functions as well as the sustained propulsion that is mandatory for obligate ram ventilators, such as tunas and billfishes (Brill Citation1996). Therefore, these species must adhere to environmental conditions (e.g., depths) that provide adequate levels of dissolved oxygen to maintain these functions. Known areas with hypoxic conditions are associated with limited vertical habitat use by tunas and tuna-like species (Prince and Goodyear Citation2006; Prince et al. Citation2010; Stramma et al. Citation2012). Although hypoxic conditions of varying severity do form periodically along the continental shelf near the Mississippi River's outflow into the northern GOM (Rabalais et al. Citation1996), there were no apparent indications that this phenomenon impacted the behavior of Yellowfin Tuna in the present study.
Unfortunately, only 4 of the 31 deployed PSATs remained attached for the entire pre-programmed period (), and those four PSATs were programmed for 90 d. We concluded that at least four of the premature releases in our study () were the result of predation (presumably sharks). Predation followed by predator ingestion of the PSAT was assumed when depth increased greatly for extended periods, counter to the vertical behavior we normally witnessed in Yellowfin Tuna. Concomitant to these depth changes, temperature readings were elevated above the values expected for a given depth; these temperatures were relatively constant, suggesting that the PSAT was ingested and therefore recorded the predator's internal body temperature. In addition, light level measurements were negligible, suggesting that the PSAT was shielded from light after being ingested. When the PSAT reverted to recording temperature values that were plausible for the concurrent depth values and started transmitting data via the Argos system, the PSAT was presumed to have been regurgitated. Predatory behavior resulting in PSAT ingestion has been reported in previous studies (Kerstetter et al. Citation2004; Béguer-Pon et al. Citation2012; Lacroix Citation2014). Predation may have been responsible for the loss of other Yellowfin Tuna in our study, particularly when PSATs were at large for only a few days ().
All of our Yellowfin Tuna were captured in close proximity to petroleum production structures (i.e., platforms). In addition to their intended purpose, these structures function as fish aggregating devices (FADs). Foraging Yellowfin Tuna and their prey are known to aggregate around FADs (Holland et al. Citation1990; Cayré Citation1991; Itano and Holland Citation2000). In turn, larger predators that target Yellowfin Tuna (e.g., sharks and Blue Marlins) take advantage of this situation. In fact, shark predation on Yellowfin Tuna that were hooked and being retrieved near the GOM petroleum production structures was a problem acknowledged by local fishermen.

None of the PSATs with 150- or 180-d deployments functioned for full term. Early or premature release can result for a variety of reasons, including breakage of the tether component, breakage of the corrosive link pin, failure of the anchor mechanism, failure of PSAT internal programming or hardware, and predation (Musyl et al. Citation2011). In many cases, it is difficult to pinpoint any single reason for PSAT failure. In some instances, events such as predation can be ascertained by scrutinizing the transmitted or stored archival data. Notification of pin breakage is provided by Argos transmission, although there is no way to determine the exact cause of the breakage. Possible reasons that may contribute to metal fatigue and pin breakage include (1) behaviors exhibited by Yellowfin Tuna during the pursuit of prey (i.e., rapid turning and jumping out of the water) and (2) misidentification of the PSAT as prey and subsequent attack on the PSAT by other Yellowfin Tuna during a feeding frenzy.
Except for three individuals (; ), the Yellowfin Tuna in our study did not undertake long-distance horizontal movements. Conventional tagging studies indicate that Yellowfin Tuna are capable of long-distance movements, even trans-Atlantic crossings beginning from the GOM (Ortiz Citation2001; Prince and Goodyear Citation2007). Detection of long-distance movements is more likely when tag deployment periods increase to the point of encompassing seasonal changes that induce population migrations. None of the PSATs in our study exceeded 95 DAL (); thus, the chances of revealing seasonal movements were lessened. Factors such as spawning activity, environmental conditions, and foraging opportunities may provide an incentive to remain in one locale for an extended period. The petroleum production platform FADs certainly contribute to more opportune foraging situations. The presence of nearly 4,000 such structures in the northern GOM (NOAA Citation2012) may entice Yellowfin Tuna to remain in a specific area for extended periods; this could explain why the Yellowfin Tuna in our study stayed within relative proximity to their release locations.
Yellowfin Tuna remain economically important in countries throughout their range, where the bulk of catches are attributed to commercial and artisanal fleets using longline and purse-seine gears. A 2011 ICCAT assessment of Atlantic Yellowfin Tuna based on production and age-structured models estimated a 76% probability that the stock was either (1) overfished or (2) overfished and undergoing overfishing (ICCAT Citation2011). For stock assessment purposes, knowledge of hook depth and vertical habitat preference (i.e., distribution) of the catch (Hinton and Nakano Citation1996; Bigelow et al. Citation2006) are important considerations for reducing the uncertainties that are often associated with estimating fishing effort and relative abundance from longline catch rate indices. Longline hook depth has been shown to affect species selectivity of longline sets (Boggs Citation1992); however, there are difficulties in accurately estimating hook depth (Rice et al. Citation2007). Habitat-based standardization models were developed to improve the methodology for estimating relative abundance, and standardization of historical catch and effort data, through use of detailed information on actual hook depth and vertical distribution of catch (Hinton and Nakano Citation1996; Bigelow et al. Citation2002; Maunder et al. Citation2006). We have presented tabulated ΔT percentiles that can be used as direct input variables for entry into habitat-based standardization models, such as the one described by Hinton and Nakano (Citation1996). As such, the results of the present study represent the most comprehensive description to date for actual vertical habitat use by Yellowfin Tuna in the Atlantic Ocean. However, this information was obtained from a localized area of the northern GOM. Variation in oceanographic features can affect fish behavior (Rooker et al. Citation2012), so vertical habitat use by Yellowfin Tuna in other areas of the Atlantic Ocean may differ from that identified in the present study.
ACKNOWLEDGMENTS
Funding was provided in part by a grant from the National Oceanic and Atmospheric Administration (NOAA)–Fisheries Cooperative Research Program. J. Hoolihan's contribution was carried out in part under the auspices of the Cooperative Institute for Marine and Atmospheric Studies, a Cooperative Institute of the University of Miami and the NOAA (Cooperative Agreement Number NA1RJ1266). The McDaniel Charitable Foundation provided logistical support for field work in Venice, Louisiana. The views expressed herein are those of the authors and do not necessarily reflect the views of NOAA or any of its subagencies. Reference to commercial products does not imply endorsement by the National Marine Fisheries Service or the authors.
Related Research Data
REFERENCES
- Arnold, G., and H. Dewar. 2001. Electronic tags in marine fisheries research. Pages 7–4 in J.R. Sibert and J.L. Nielsen, editors. Proceedings of the symposium on tagging and tracking marine fish with electronic devices. Kluwer Academic, Dordrecht, The Netherlands. 468 pp.
- Béguer-Pon, M., J. Benchetrit, M. Castonguay, K. Aarestrup, S.E. Campana, M.J. W. Stokesbury, and J.J. Dodson. 2012. Shark predation on migrating adult American Eels (Anguilla rostrata) in the Gulf of St. Lawrence. PloS ONE [online serial] 7:e46830.
- Bigelow, K.A., J. Hampton, and N. Miyabe. 2002. Application of a habitat-based model to estimate effective longline fishing effort and relative abundance of Pacific Bigeye Tuna (Thunnus obesus). Fisheries Oceanography 11:143–55.
- Bigelow, K.A., and M.N. Maunder. 2007. Does habitat or depth influence catch rates of pelagic species? Canadian Journal of Fisheries and Aquatic Sciences 64:1581–1594.
- Bigelow, K., M.K. Musyl, F. Poisson, and P. Kleiber. 2006. Pelagic longline gear depth and shoaling. Fisheries Research 77:173–183.
- Block, B.A., H. Dewar, C. Farwell, and E.D. Prince. 1998. A new satellite technology for tracking the movements of Atlantic Bluefin Tuna. Proceedings of the National Academy of Sciences of the USA 95:9384–9389.
- Block, B.A., J.E. Keen, B. Castillo, H. Dewar, E.V. Freund, D.J. Marcinek, R.W. Brill, and C. Farwell. 1997. Environmental preferences of Yellowfin Tuna (Thunnus albacares) at the northern extent of its range. Marine Biology 130:119–132.
- Boggs, C.H. 1992. Depth, capture time, and hooked longevity of longline-caught pelagic fish: timing bites of fish with chips. U.S. National Marine Fisheries Service Fishery Bulletin 90:642–658.
- Brill, R.W. 1996. Selective advantages conferred by the high performance physiology of tunas, billfishes, and dolphin fish. Comparative Biochemistry and Physiology A 113:315.
- Brill, R.W., B.A. Block, C.H. Boggs, K.A. Bigelow, E.V. Freund, and D.J. Marcinek. 1999a. Horizontal movements and depth distribution of large adult Yellowfin Tuna (Thunnus albacares) near the Hawaiian Islands, recorded using ultrasonic telemetry: implications for the physiological ecology of pelagic fishes. Marine Biology 133:395–408.
- Brill, R.W., T.E. Lowe, and K.L. Cousins. 1999b. How water temperature really limits the vertical movements of tunas and billfishes—it's the heart, stupid. Pages 57–62 in K. Gamperl, A. Farrell, and D. MacKinlay, editors. Cardiovascular function in fishes. American Fisheries Society, Bethesda, Maryland.
- Brill, R.W., and M. Lutcavage. 2001. Understanding environmental influences on movements and depth distributions of tunas and billfishes can significantly improve population assessments. Pages 179–198 in G.R. Sedberry, editor. Island in the stream. American Fisheries Society, Symposium 25, Bethesda, Maryland.
- Carey, F.G., and R.J. Olson. 1982. Sonic tracking experiments with tunas. International Commission for the Conservation of Atlantic Tunas (ICCAT) Collective Volume of Scientific Papers 17:458–466.
- Cayré, P. 1991. Behaviour of Yellowfin Tuna (Thunnus albacares) and Skipjack Tuna (Katsuwonus pelamis) around fish aggregating devices (FADs) in the Comoros Islands as determined by ultrasonic tagging. Aquatic Living Resources 4:1–12.
- Cayré, P., and F. Marsac. 1993. Modelling the Yellowfin Tuna (Thunnus albacares) vertical distribution using sonic tagging results and local environmental parameters. Aquatic Living Resources 6:1–14.
- Dizon, A.E., and R.W. Brill. 1979. Thermoregulation in Yellowfin Tuna, Thunnus albacares. Physiological Zoology 52:581–593.
- Galli, G.L. J., H.A. Shiels, and R.W. Brill. 2009. Temperature sensitivity of cardiac function in pelagic fishes with different vertical mobilities: Yellowfin Tuna (Thunnus albacares), Bigeye Tuna (Thunnus obesus), Mahimahi (Coryphaena hippurus), and Swordfish (Xiphias gladius). Physiological and Biochemical Zoology 82:280–290.
- Goodyear, C.P., J. Luo, E.D. Prince, J.P. Hoolihan, D. Snodgrass, E.S. Orbesen, and J.E. Serafy. 2008. Vertical habitat use of Atlantic Blue Marlin (Makaira nigricans): interaction with pelagic longline gear. Marine Ecology Progress Series 365:233–245.
- Hammerschlag, N., A.J. Gallagher, J. Wester, J. Luo, and J.S. Ault. 2012. Don't bite the hand that feeds: assessing ecological impacts of provisioning ecotourism on an apex marine predator. Functional Ecology 26:567–576.
- Hinton, M.G., and H. Nakano. 1996. Standardizing catch and effort statistics using physiological, ecological, or behavioral constraints and environmental data, with an application to Blue Marlin (Makaira nigricans) catch and effort data from Japanese longline fisheries in the Pacific. Inter-American Tropical Tuna Commission Bulletin 21:171–200.
- Holland, K.N., R.W. Brill, and R.K. C. Chang. 1990. Horizontal and vertical movements of Yellowfin and Bigeye Tuna associated with fish aggregating devices. U.S. National Marine Fisheries Service Fishery Bulletin 88:493–507.
- Hoolihan, J.P., and J. Luo. 2007. Determining summer residence status and vertical habitat use of Sailfish (Istiophorus platypterus) in the Arabian Gulf. ICES Journal of Marine Science 64:1791–1799.
- Hoolihan, J.P., J. Luo, F.J. Abascal, S.E. Campana, G. De Metrio, H. Dewar, M.L. Domeier, L.A. Howey, M.E. Lutcavage, M.K. Musyl, J.D. Neilson, E.S. Orbesen, E.D. Prince, and J.R. Rooker. 2011a. Evaluating post-release behaviour modification in large pelagic fish deployed with pop-up satellite archival tags. ICES Journal of Marine Science 68:880–889.
- Hoolihan, J.P., J. Luo, C.P. Goodyear, E.S. Orbesen, and E.D. Prince. 2011b. Vertical habitat use of Sailfish (Istiophorus platypterus) in the Atlantic and eastern Pacific, derived from pop-up satellite archival tag data. Fisheries Oceanography 20:192–205.
- Hoolihan, J.P., J. Luo, and E.D. Prince. 2012a. Preliminary analysis of time spent at temperature relative to the surface temperature for White Marlin monitored with pop-up satellite archival tags. International Commission for the Conservation of Atlantic Tunas (ICCAT) Collective Volume of Scientific Papers 68:1585–1589.
- Hoolihan, J.P., R.J. D. Wells, J. Luo, J.R. Rooker, and E.D. Prince. 2012b. Preliminary analysis of time spent at temperature relative to the surface temperature for Yellowfin Tuna monitored with pop-up satellite archival tags in the Gulf of Mexico. International Commission for the Conservation of Atlantic Tunas (ICCAT) Collective Volume of Scientific Papers 68:979–983.
- ICCAT (International Commission for the Conservation of Atlantic Tunas). 2011. Report of the 2011 ICCAT Yellowfin Tuna stock assessment. ICCAT, Madrid.
- Itano, D.G., and K.N. Holland. 2000. Movement and vulnerability of Bigeye (Thunnus obesus) and Yellowfin tuna (Thunnus albacares) in relation to FADs and natural aggregation points. Aquatic Living Resources 13:213–223.
- Josse, E., P. Bach, and L. Dagorn. 1998. Simultaneous observations of tuna movements and their prey by sonic tracking and acoustic surveys. Hydrobiologia 371/372:61–69.
- Kerstetter, D.W., J.J. Polovina, and J.E. Graves. 2004. Evidence of shark predation and scavenging on fishes equipped with pop-up satellite archival tags. U.S. National Marine Fisheries Service Fishery Bulletin 102:750–756.
- Lacroix, G.L. 2014. Large pelagic predators could jeopardize the recovery of endangered Atlantic Salmon. Canadian Journal of Fisheries and Aquatic Sciences 71:343–350.
- Lam, C.H., A. Nielsen, and J.R. Sibert. 2008. Improving light- and temperature-based geolocation by unscented Kalman filtering. Fisheries Research 91:15–25.
- Luo, J.G., E.D. Prince, C.P. Goodyear, B.E. Luckhurst, and J.E. Serafy. 2006. Vertical habitat utilization by large pelagic animals: a quantitative framework and numerical method for use with pop-up satellite tag data. Fisheries Oceanography 15:208–229.
- Maunder, M.N., M.G. Hinton, K.A. Bigelow, and A.D. Langley. 2006. Developing indices of abundance using habitat data in a statistical framework. Bulletin of Marine Science 79:545–559.
- Musyl, M.K., M.L. Domeier, N. Nasby-Lucas, R.W. Brill, L.M. McNaughton, J.Y. Swimmer, M.S. Lutcavage, S.G. Wilson, B. Galuardi, and J.B. Liddle. 2011. Performance of pop-up satellite archival tags. Marine Ecology Progress Series 433:1–28.
- National Geophysical Data Center. 2006. Two-minute gridded global relief data (ETOPO2 v2). National Oceanic and Atmospheric Administration, National Geophysical Data Center, Boulder, Colorado. Available: www.ngdc.noaa.gov/mgg/fliers/06mgg01.html. (September 2014).
- Nielsen, A., K.A. Bigelow, M.K. Musyl, and J.R. Sibert. 2006. Improving light-based geolocation by including sea surface temperature. Fisheries Oceanography 15:314–325.
- Nielsen, J.L., H. Arrizabalaga, N. Frangoso, A. Hobday, M. Lutcavage, and J. Sibert, editors. 2009. Tagging and tracking of marine animals with electronic devices. Springer, London.
- NMFS (National Marine Fisheries Service). 2013. Fisheries of the United States 2012. Page 135 in A. Lowther, editor. NMFS, Silver Spring, Maryland.
- NOAA (National Oceanic and Atmospheric Administration). 2012. Oil and gas exploration. NOAA, Office of Ocean Exploration and Research. Available: //oceanexplorer.noaa.gov/explorations/06mexico/bacground/oil/media/platform_600.html. (November 2013).
- Ortiz, M. 2001. Review of tag-releases and recapture for Yellowfin Tuna from the U.S. CTC program. International Commission for the Conservation of Atlantic Tunas (ICCAT) Collective Volume of Scientific Papers 52:215–221.
- Prince, E.D., and C.P. Goodyear. 2006. Hypoxia-based habitat compression of tropical pelagic fishes. Fisheries Oceanography 15:451–464.
- Prince, E.D., and C.P. Goodyear. 2007. Consequences of ocean scale hypoxia constrained habitat for tropical pelagic fishes. Gulf and Caribbean Research 19:17–20.
- Prince, E.D., J. Luo, C.P. Goodyear, J.P. Hoolihan, D. Snodgrass, E.S. Orbesen, J.E. Serafy, M. Ortiz, and M.J. Schirripa. 2010. Ocean scale hypoxia-based habitat compression of Atlantic istiophorid billfishes. Fisheries Oceanography 19:448–462.
- Rabalais, N.N., R.E. Turner, Q. Dortch, W.J. Wiseman, and B.K. S. Gupta. 1996. Nutrient changes in the Mississippi River and system responses on the adjacent continental shelf. Estuaries 19:386–407.
- Rice, P.H., C.P. Goodyear, E.D. Prince, D. Snodgrass, and J.E. Serafy. 2007. Use of catenary geometry to estimate hook depth during near-surface pelagic longline fishing: theory versus practice. North American Journal of Fisheries Management 27:1148–1161.
- Rooker, J.R., J.R. Simms, R.J. D. Wells, S.A. Holt, G.J. Holt, J.E. Graves, and N.B. Furey. 2012. Distribution and habitat associations of billfish and Swordfish larvae across mesoscale features in the Gulf of Mexico. PloS ONE [online serial] 7:e34180.
- Schaefer, K.M., D.W. Fuller, and G. Aldana. 2014. Movements, behavior, and habitat utilization of Yellowfin Tuna (Thunnus albacares) in waters surrounding the Revillagigedo Islands Archipelago Biosphere Reserve, Mexico. Fisheries Oceanography 23:65–82.
- Schaefer, K.M., D.W. Fuller, and B.A. Block. 2007. Movements, behavior, and habitat utilization of Yellowfin Tuna (Thunnus albacares) in the northeastern Pacific Ocean, ascertained through archival tag data. Marine Biology 152:503–525.
- Schaefer, K.M., D.W. Fuller, and B.A. Block. 2011. Movements, behavior and habitat utilization of Yellowfin Tuna (Thunnus albacares) in the Pacific Ocean off Baja California, Mexico, deternined from archival tag data analyses, including unscented Kalman filtering. Fisheries Research 112:22–37.
- Sibert, J.R., and J.L. Nielsen, editors. 2001. Electronic tagging and tracking in marine fisheries. Kluwer, Dordrecht, The Netherlands.
- Stramma, L., E.D. Prince, S. Schmidtko, J. Luo, J.P. Hoolihan, M. Visbeck, D.W. R. Wallace, P. Brandt, and A. Körtzinger. 2012. Expansion of oxygen minimum zones may reduce available habitat for tropical pelagic fishes. Nature Climate Change 2:33–37.
- Weng, K.C., M.J. W. Stokesbury, A.M. Boustany, A.C. Seitz, S.L. H. Teo, S.K. Miller, and B.A. Block. 2009. Habitat and behaviour of Yellowfin Tuna Thunnus albacares in the Gulf of Mexico determined using pop-up satellite archival tags. Journal of Fish Biology 74:1434–1449.
- Worton, B.J. 1995. Using Monte Carlo simulation to evaluate kernel-based home range estimators. Journal of Wildlife Management 59:794–800.