
Abstract
Implementation of circle hook regulations in the Gulf of Mexico will impact the length structure and age structure of the snapper–grouper fishery catch as well as demographic data for stock assessments; therefore, an understanding of circle hook selectivity patterns is critical. Indirect selectivity analysis of the vertical-line catch of Red Snapper Lutjanus campechanus and Vermilion Snapper Rhomboplites aurorubens showed that for both species, there were significant differences in mean FL among hook sizes, broad length frequency distributions, and wide selectivity curves. Although the results suggest that hook size regulations could be a useful management strategy for targeting desired size-classes of these snappers, the broadly overlapping length distributions indicate that undersized catch would not be eliminated. Selectivity curves generated from the different families of distributions produced equally good fit to the data and provided a basis for evaluating various selectivity curves when the size structure of the sampled population is unknown. If the size structure of the population is known, then the use of direct selectivity methods is recommended. Right-skewed distributions generally fit the data best, suggesting that hook regulations are likely to be more effective if the desired goal is to reduce the amount of undersized catch by eliminating small hook sizes. Conversely, elimination of large hooks appears to be less likely to reduce the catch of larger size-classes because mouth gape is likely the primary limiting factor and small hooks can catch large fish. Catch rates were significantly different among hook sizes; thus, regulations based on hook size could impact fishing effort and change the dynamics of how the snapper–grouper fishery is prosecuted. Tradeoffs between moderate improvements in size-class targeting, changes in effort, and various components of fishing mortality (i.e., catch and regulatory discards) will require further investigation through simulation modeling or field experimentation.
Received April 23, 2014; accepted September 16, 2014
Demographic data that inform stock assessments about the size structure and age structure of a population are critical for a clear understanding of the status of a fished stock. It is also critical to consider information about gear selectivity given that it has direct impacts on length composition and therefore demographic data. In ideal situations, the length distribution of the sampled population is known and gear selectivity can be measured directly (Kirkwood and Walker Citation1986; Millar and Holst Citation1997). However, in most cases the length distributions are not completely known, which has led to the development of methods that indirectly estimate gear selectivity (Holt Citation1963; Regier and Robson Citation1966; Boy and Crivelli Citation1988; Helser et al. Citation1991, 1994; Henderson and Wong Citation1991; Millar Citation1992). Indirect estimation of gear selectivity utilizes the size distribution of the catch from each simultaneously deployed gear type and is therefore limited to the portion of the population that comes into contact with the gear (Millar and Fryer Citation1999). The fitted selectivity curves are also known as contact selection curves or retention curves because these are the fish that were retained by the gear after contact (Munro and Somerton Citation2001). The functional forms of gill-net and trawl selectivity curves have been researched extensively, whereas the functional forms for hook selectivity curves remain somewhat uncertain (Kenchington Citation1993; Millar Citation1995). Knowledge of how gear selectivity influences the catch of managed species is important for improving catch efficiency in directed fisheries, providing guidance to management on regulatory actions, and informing the assessment process (McAuley et al. Citation2007). Given that hooks are the primary gear used to target the snapper–grouper complex in the Gulf of Mexico (GOM), it follows that hook selectivity patterns associated with reef fish from this region require research attention, particularly as regulations and gears change through time.
Relative to hook selectivity, the functional forms for gill-net and trawl selectivity are better established and the assumption concerning proportionality is more easily evaluated, likely as a result of how gill nets and trawls operate to capture fish. Conversely, hook selectivity patterns are not well established, and one common approach is to use methods outlined for gill nets (Millar and Fryer Citation1999). This can be problematic since little is known about hook selectivity in general (Kenchington Citation1993) and because gill-net selectivity is assumed to operate under Baranov's principle of geometric similarity. Baranov's principle states that because similar mesh sizes are geometrically similar and because fish of the same species are also geometrically similar, the selectivity curves for differing mesh sizes are likely to be similar (Hamley Citation1975). The same relationship may or may not hold true for mouth gape, which is the factor most likely to limit hook selectivity (Yamashita et al. Citation2009). Gill-net selectivity curves tend to be narrow, and the shape of the curves is well established. In contrast, selection curves for hooks are likely to be very broad (Pope et al. Citation1975), but the general shape is unclear: some studies have suggested asymptotic curves (McCraken Citation1963; Erzini et al. Citation1998; Patterson et al. Citation2012), and other studies have postulated dome-shaped relationships (Millar and Holst Citation1997). The fundamental property of the indirect method is that a functional relationship is being fitted to catch data with no information about the sampled population. Therefore, a method that tests various functions against catch data, such as the SELECT method (Millar Citation1992), could prove useful.
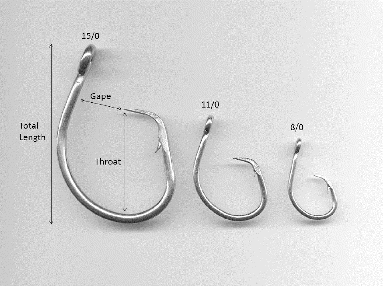
In gill-net selectivity analysis, the assumption about proportionality in the gear is well established because the mesh is typically in a square or diamond pattern, making sizes and proportions easy to measure. Furthermore, the relationship between body size and the effectiveness of a particular mesh appears to be a proportional function. Conversely, there are numerous ways of measuring hook dimensions, including total length, gape, throat, wire diameter, bite, barb, shank, front length, offset, and bend (). The various hook dimensions all have the potential to be limiting factors relative to the size of fish selected by the gear. Furthermore, it is unclear whether the jaw structure (primarily gape) of different fishes also relates proportionally to the effectiveness of a hook size, as has been established for gill nets.
FIGURE 1. Three circle hook sizes (8/0, 11/0, and 15/0; Mustad series 39960D) used in the study. Selected measurements describing the properties of a hook are indicated (see Table 1).
Beginning in 2008, the Gulf of Mexico Fishery Management Council began requiring recreational anglers fishing in federal waters to use non-stainless-steel circle hooks when catching reef fishes with natural bait (NOAA 2013), and some states bordering the GOM, such as Florida, are following suit (Sauls and Ayala Citation2012). This regulation could potentially change which portions of the fishery (i.e., sizes or ages) are vulnerable to fishing pressure. Due to the potential effects on fishing mortality and the implications for evaluating age structure and size structure in the population, an examination of hook selectivity patterns for GOM reef fish species is needed. Further, if hook size demonstrates clear selectivity patterns, then regulations could be tailored to effectively manage the size composition of catches attributable to various sectors.
The objectives of this investigation were to (1) evaluate mean size and length frequency distributions of Red Snapper Lutjanus campechanus and Vermilion Snapper Rhomboplites aurorubens captured on three commonly used circle hook sizes (8/0, 11/0, and 15/0) and (2) use these data to generate selectivity curves by applying indirect selectivity analyses. We sought to investigate the quality of fit of the combined data set to the normal (fixed spread and proportional spread), gamma, lognormal, and inverse Gaussian distributions. We fitted the data in two different ways; the first assumed that fishing power was equal among hook gape sizes, and the second assumed that fishing power was proportional to hook gape size. Results of these analyses will provide insight to fisheries managers about how the size structure and age structure of the Red Snapper catch are influenced by hook selectivity; furthermore, these results may improve sector-specific catch efficiency, provide guidance to management on regulatory actions, and be useful during the population assessment process.
METHODS
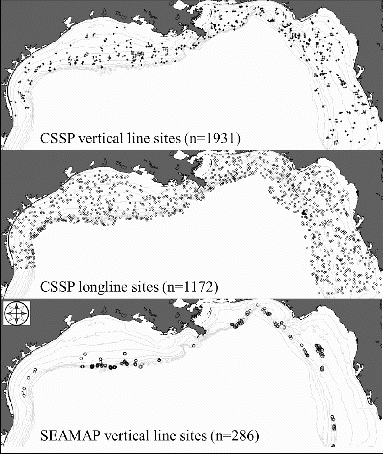
General methods.—Data used in the analysis were obtained from fishery-independent surveys conducted in the GOM by the National Marine Fisheries Service (NMFS) Mississippi Laboratories, including the Congressional Supplemental Sampling Program (CSSP) and the Southeast Area Monitoring and Assessment Program's (SEAMAP) annual video survey of reef fishes. During the CSSP survey, both vertical-line (CSSP-VL) and longline (CSSP-LL) gears were deployed; although data from both portions were included in this analysis, only vertical line data were used to estimate hook selectivity curves. The SEAMAP reef fish survey (hereafter, SEAMAP-VL) deploys vertical-line gear at 50% of the selected camera-drop stations using the same protocols as the CSSP-VL survey. The CSSP and SEAMAP surveys were conducted on the continental shelf of the northern GOM from Brownsville, Texas, to the Dry Tortugas (). Sampling in the CSSP survey took place in a single year from April 7 to October 25, 2011. The SEAMAP-VL survey did not match CSSP-VL protocols until 2012; therefore, only the 2012 and 2013 survey data were included. Site selection during all surveys followed a random stratified design (Campbell et al. Citation2012a, Citation2012b). For both surveys, stations were randomly selected from areas outside the boundaries of the Flower Garden Banks National Marine Sanctuary, the Madison–Swanson Marine Protected Area, the Steamboat Lumps Marine Protected Area, and the Florida Middle Grounds; stations were also at least 1.852 km (1 nautical mile) away from (1) oil and gas platform structures or (2) any other station in the stratum.
FIGURE 2. Maps of the northern Gulf of Mexico, showing sites that were randomly selected for sampling by the Congressional Supplemental Sampling Program (CSSP) vertical line survey (top panel), CSSP longline survey (middle panel), and Southeast Area Monitoring and Assessment Program (SEAMAP) vertical line survey (bottom panel).
Gear deployment and biological sampling.—The CSSP-VL and SEAMAP-VL surveys used identical protocols for gear deployment and biological sampling. At all sites, the deployed vertical line was composed of 300 m of 2-mm, light-blue, 181-kg-test monofilament mainline, with a 6.7-m, 181-kg-test detachable backbone, which was attached to the terminal end of the mainline. Ten gangions constructed of 45-kg-test, twisted monofilament line were attached at 61-cm intervals on the backbone. Each backbone used one size of circle hook on a single deployment. Circle hooks deployed were Mustad Series 39960D hooks of sizes 8/0, 11/0, and 15/0 (; ). Hook size to be fished on a reel was determined randomly at the start of each fishing day and then was rotated clockwise among reel positions on the starboard, aft, and port sides of the vessel at each subsequent station. All three hook types were deployed at each sampling location and therefore were fished with equal effort during the experiment. Hooks were baited with Atlantic Mackerel Scomber scombrus that were cut to match the size of each hook (heads and tails excluded). A 5–10-kg weight was placed at the terminal end of the backbone to ensure stability and to ensure that the hooks were not fished directly on the bottom; a buoy was attached at the surface to maintain the vertical position of the line. During deployment, the vertical line remained attached to the vessel; however, line was slowly paid out so that the gear was fished without dragging over the bottom. Gear was deployed on the bottom for 5 min and was then retrieved.
TABLE 1. Dimensions (mm) of the three Mustad circle hooks (all belonging to series 39960D) used during the Congressional Supplemental Sampling Program's vertical line survey in the northern Gulf of Mexico.
The CSSP-LL survey was conducted throughout the northern GOM and sampled the same geographical region as the CSSP-VL component; however, the gears sampled different habitat types. Vertical line was deployed over known high-relief reef, and longline was deployed over mud bottom to avoid hangs in complex habitat. The CSSP-LL portion of the survey used SEAMAP bottom longline protocols (Driggers et al. Citation2012) so that the data stream was compatible with the ongoing annual bottom longline survey of the GOM. Importantly, the CSSP-LL survey used the same model and size (15/0) of circle hook as both vertical line surveys, and the hooks were baited with Atlantic Mackerel cut to match the hook size. Red Snapper lengths were analyzed for each gear type (CSSP-VL and CSSP-LL); Vermilion Snapper were not captured in the longline surveys, and thus their lengths could not be analyzed with respect to gear type.
Catch was identified, weighed (kg), and measured (FL, mm). Otoliths and gonads were removed from a randomly selected subset of fish, ensuring spatiotemporal coverage. Differences in catch rate (fish·hook−1·h−1) and FL of Red Snapper and Vermilion Snapper were tested using factorial ANOVA, where treatments included cruise (CSSP-VL or SEAMAP-VL) and circle hook size (8/0, 11/0, or 15/0). All of the catch rate data were first log transformed to meet the assumptions of normality. Likewise, we tested for differences in distributions among hook sizes by using the Kolmogorov–Smirnov test. Additionally, differences in Red Snapper FL were analyzed in relation to gear type (CSSP-VL and CSSP-LL) by using either all hook sizes combined or the 15/0 hook size only.
Selectivity analysis.—We used log-linear models to fit five families of distributions to the NMFS Mississippi Laboratories’ vertical-line FL data using methodology outlined by Millar and Holst (Citation1997) and Millar and Fryer (Citation1999). Catch frequencies were calculated for each hook size by using 25-mm length bins. Each selection curve was fitted twice: first under the assumption that fishing power is equal among hook sizes, and then under the assumption that fishing power is proportional to hook size (). Families of models included normal fixed spread (NF-E for the assumption of equal fishing power; NF-P for the assumption of proportional fishing power), normal proportional spread (NP-E and NP-P), gamma (G-E and G-P), lognormal (LN-E and LN-P), and inverse Gaussian (IG-E and IG-P). All of the families observe geometric similarity; the NF models are the exception since the spread of the curve is fixed across hook sizes. Because the manufacturer's hook number (i.e., 8/0, 11/0, and 15/0) does not represent an actual measurement of hook size, those values were not used to estimate gear proportionality. Instead, a measurement of the hook gape was used to model the relative proportions of the hooks (; ). Model deviance and Akaike's information criterion (AIC) were used to determine the best-fitting model.
TABLE 2. Brief descriptions of the models and their associated abbreviations.
RESULTS
Red Snapper
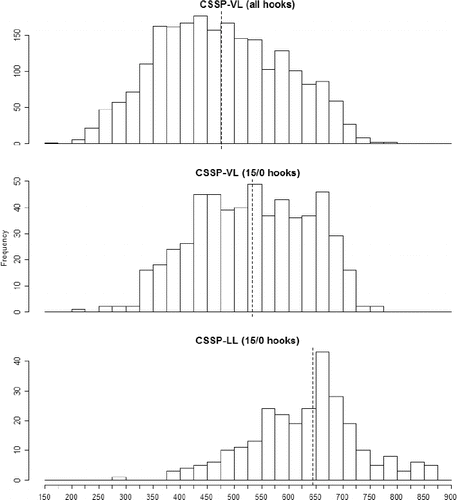
In total, 2,062 Red Snapper were caught with vertical-line gear during the CSSP-VL (n = 1,707) and SEAMAP-VL (n = 355) cruises; these fish ranged in size from 154 to 782 mm FL (). Evaluation of Red Snapper length frequency histograms (FL) showed wide distributions (range of FL) for each survey and indicated that FL increased with increasing hook size (). Factorial ANOVA of Red Snapper FL data from the vertical-line catch resulted in a significant model (F5, 2,056 = 45.63, P < 0.0001) for which the hook size (F2 = 54.36, P < 0.0001) and survey (F1 = 10.79, P = 0.001) were significant but the interaction term was nonsignificant. Red Snapper mean FL from the vertical-line catch increased with increasing hook size and was shortest from the CSSP-VL survey for all hook types tested (). Kolmogorov–Smirnov tests indicated significant differences between the 8/0 and 15/0 hook sizes (test statistic KSa = 5.69, P < 0.0001) and between 11/0 and 15/0 hooks (KSa = 4.78, P < 0.0001) but showed no difference between the 8/0 and 11/0 hooks (KSa = 1.73, P > 0.05). Red Snapper sampled during the CSSP-VL survey showed increasing mean FL with increasing hook size (8/0 [mean ± SD]: 441.58 ± 116.27 mm; 11/0: 456.88 ± 113.73 mm; 15/0: 531.61 ± 107.74 mm). Similarly, during the SEAMAP-VL survey, Red Snapper mean FL increased with increasing hook size (8/0 [mean ± SD]: 462.97 ± 94.69 mm; 11/0: 479.03 ± 103.31 mm; 15/0: 543.86 ± 90.37 mm). One-way ANOVA tests of FLs showed that Red Snapper from the CSSP-LL survey were significantly longer than those from the CSSP-VL survey () when all hook sizes were combined (F1, 2,443 = 1,173.3, P < 0.0001) and when only the 15/0 hook size was considered (F1, 1,197 = 326.31, P < 0.0001). Red Snapper FLs were greatest in the CSSP-LL survey (mean ± SD = 645.51 ± 105.24 mm) and shortest in the CSSP-VL survey (all hooks [mean ± SD]: 475.66 ± 115.55 mm; 15/0 hooks: 533.72 ± 104.98 mm).
FIGURE 3. Length frequency histograms (mm FL) of Gulf of Mexico Red Snapper caught on circle hooks of three sizes (8/0: top panels; 11/0: middle panels; 15/0: bottom panels) during the Congressional Supplemental Sampling Program's vertical line survey (CSSP-VL; left panels) and the Southeast Area Monitoring and Assessment Program's vertical line survey (SEAMAP-VL; right panels). The vertical dashed line indicates the mean FL for each group.
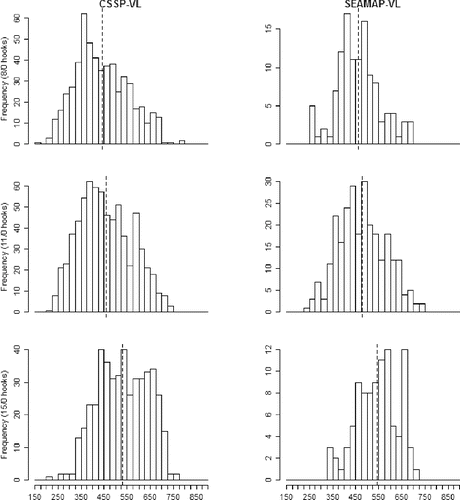
FIGURE 4. Length frequency distributions (mm FL) of Gulf of Mexico Red Snapper caught during the Congressional Supplemental Sampling Program's vertical line survey (CSSP-VL), with data for all hooks combined (top panel) or data for 15/0 hooks only (middle panel); and the length frequency distribution of Red Snapper caught on 15/0 hooks during the CSSP longline survey (CSSP-LL; bottom panel). The vertical dashed line indicates the mean FL for each group.
Factorial ANOVA of Red Snapper catch rate data showed a significant model (F5, 6,465 = 10.6, P < 0.0001) in which hook size (F2 = 4.9, P = 0.0074) and survey (F1 = 37.56, P < 0.0001) were significant but the interaction term was nonsignificant. Catch rates were higher during the SEAMAP-VL survey (1.14 fish·hook−1·h−1) than during the CSSP-VL survey (1.08 fish·hook−1·h−1). Catch rates were significantly different among hook sizes during both surveys. The 11/0 hook showed the highest catch rate (CSSP-VL: 1.09 fish·hook−1·h−1; SEAMAP-VL: 1.18 fish·hook−1·h−1), followed by the 8/0 hook (CSSP-VL: 1.07 fish·hook−1·h−1; SEAMAP-VL: 1.13 fish·hook−1·h−1) and the 15/0 hook (CSSP-VL: 1.06 fish·hook−1·h−1; SEAMAP-VL: 1.12 fish·hook−1·h−1). Although there were differences in catch rate between surveys and among hook types, those differences were small, and the significant P-values were likely attributable to large sample sizes.
Vermilion Snapper
In total, 645 Vermilion Snapper ranging in FL from 159 to 563 mm were caught with vertical-line gear during the CSSP-VL (n = 543) and SEAMAP-VL (n = 102) cruises. Evaluation of length frequency histograms showed that distributions of Vermilion Snapper from the vertical-line catch were similar regardless of survey and captured a broad size range (). Factorial ANOVA of Vermilion Snapper FL showed a significant model (F5, 639 = 14.88, P < 0.0001) in which hook size (F2 = 20.39, P < 0.0001) was significant, whereas survey and the interaction terms were not significant. Kolmogorov–Smirnov tests showed significant differences in distribution between the 8/0 and 11/0 hooks (KSa = 3.27, P < 0.0001) but no differences between 8/0 and 15/0 hooks (KSa = 2.01, P > 0.05) or between 11/0 and 15/0 hooks (KSa = 1.32, P > 0.05). Mean FL increased with hook size in both of the vertical line surveys (). Mean FL (mm) of Vermilion Snapper sampled during the CSSP-VL survey increased with increasing hook size (8/0 [mean ± SD]: 297.18 ± 78.62 mm; 11/0: 345.61 ± 85.17 mm; 15/0: 385.06 ± 113.63 mm). Similarly, during the SEAMAP-VL survey, the FL of Vermilion Snapper increased with increasing hook size (8/0 [mean ± SD]: 321.87 ± 53.82 mm; 11/0: 341.45 ± 61.42 mm; 15/0: 421.25 ± 61.78 mm). No Vermilion Snapper were captured during the CSSP-LL portion of the CSSP survey. Catch was also low on the 15/0 hook for both the CSSP-VL (15 fish) and SEAMAP-VL (4 fish) surveys.
FIGURE 5. Length frequency histograms (mm FL) of Gulf of Mexico Vermilion Snapper caught on circle hooks of three sizes (8/0: top panels; 11/0: middle panels; 15/0: bottom panels) during the Congressional Supplemental Sampling Program's vertical line survey (CSSP-VL; left panels) and the Southeast Area Monitoring and Assessment Program's vertical line survey (SEAMAP-VL; right panels). Vertical dashed line indicates the mean FL for each group.
Results of the factorial ANOVA of Vermilion Snapper catch rate data showed a significant model (F5, 6,465 = 28.26, P < 0.0001), where hook size (F2 = 36.35, P < 0.0001) and survey (F1 = 8.63, P = 0.003) were significant and the interaction term was nonsignificant. Catch rates of Vermilion Snapper were higher during SEAMAP-VL (1.04 fish·hook−1·h−1) than during the CSSP-VL survey (1.03 fish·hook−1·h−1). Catch rates were significantly different among all hook sizes, and for both surveys the highest catch rate occurred with the 8/0 hook (CSSP-VL: 1.05 fish·hook−1·h−1; SEAMAP-VL: 1.07 fish·hook−1·h−1), followed by the 11/0 hook (CSSP-VL: 1.03 fish·hook−1·h−1; SEAMAP-VL: 1.04 fish·hook−1·h−1) and the 15/0 hook (CSSP-VL: 1.0 fish·hook−1·h−1; SEAMAP-VL: 1.0 fish·hook−1·h−1). Although there were differences in Vermilion Snapper catch rates between surveys and among hook types, those differences were small, and the significant P-values are likely due to large sample sizes.
Selectivity Curves
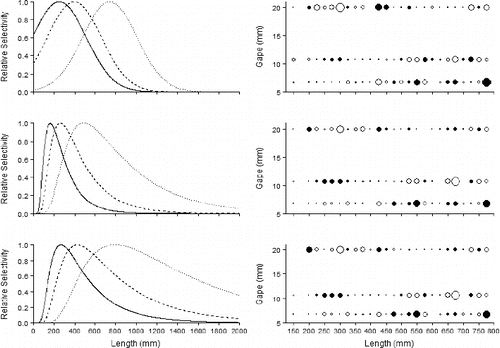
Evaluating the AIC and deviance values from Red Snapper selectivity curve fitting () revealed that the best-fitting models were NF-E (AIC = 459.2; deviance = 77.6), followed by IG-P (AIC = 459.7; deviance = 78.1) and IG-E (AIC = 467.1; deviance = 85.5). Those models were followed by LN-E, LN-P, NF-P, G-E, G-P, NP-E, and NP-P, respectively (). All model fits resulted in broad selectivity curves for Red Snapper regardless of the theoretical distribution tested; only the three best (NF-E, IG-P, and IG-E) are plotted here (; ). Of the three distributions with the lowest AIC values, the NF-E model was the broadest, followed by IG-P and IG-E. Ascending portions of both IG selectivity curves were steeper than those of the NF-E. Plots of residuals further supported that the selectivity curves are very broad (). In regions of the distributions where catch frequency was low, the residuals showed high variation that resulted in underfitting or overfitting of the models. Regardless of the selectivity curve, the 8/0 hooks showed the lowest variation at the smallest sizes, the 11/0 hooks showed the lowest variation at medium sizes, and the 15/0 hooks showed the lowest variation at the largest sizes. Due to differences in the shape of the curve fits, Red Snapper FLs at half selection (50%) and full selection (100%) were noticeably different, despite the relatively similar AIC values. Shortest FLs at full selection were associated with the IG-E model (8/0: 170 mm; 11/0: 260 mm; 15/0: 490 mm). Longest FLs at full selection were associated with the IG-P model (8/0: 270 mm; 11/0: 425 mm; 15/0: 800 mm). Lengths at full selection for the NF-E model were similar to those of the IG-P model despite the obvious difference in the shape of the curve. Predicted FLs at half selection for the IG curve fits were shorter for the IG-E model (8/0: 90 mm; 11/0: 140 mm; 15/0: 260 mm) than for the IG-P model (8/0: 140 mm; 11/0: 220 mm; 15/0: 410 mm). Of all the models, the NF-E model showed the shortest predicted FLs for the two smallest hooks (8/0: 0 mm; 11/0: 90 mm), but it had the longest predicted FL for the 15/0 hook (435 mm).
TABLE 3. Log-linear fits to the Red Snapper and Vermilion Snapper data from the combined vertical-line catch obtained by the Congressional Supplemental Sampling Program and the Southeast Area Monitoring and Assessment Program. Models are listed in the order of best to worst fitting as determined by deviance and Akaike's information criterion (AIC), evaluated separately for each species. Model abbreviations are defined in Table 2. For the distributions used, location parameters are μ, shape parameters are k and α, and scale parameters are σ and λ.
FIGURE 6. Selection curves (left panels) and deviance residual plots (right panels) for Red Snapper caught on circle hooks of three sizes (8/0 = solid curve; 11/0 = dashed curve; 15/0 = dotted curve) for the normal fixed-spread model with equal fishing power (top panels), the inverse Gaussian model with equal fishing power (middle panels), and the inverse Gaussian model with proportional fishing power (bottom panels). Solid circles represent positive residuals, and open circles represent negative residuals; the area of the circle is proportional to the square of the residual. Hook sizes are plotted based on the hook gape measurement (8/0: 6.75-mm gape; 11/0: 10.7-mm gape; 15/0: 20-mm gape).
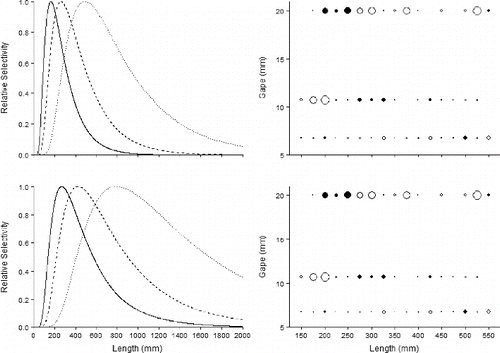
Evaluation of the AIC and deviance values from Vermilion Snapper selectivity curve fitting () revealed that the best-fitting model was LN-E (AIC = 245; deviance = 42.5), followed by LN-P (AIC = 245; deviance = 42.5), IG-E (AIC = 246; deviance = 43.7), and IG-P (AIC = 246; deviance = 44). Those models were followed by G-E, G-P, NF-E, NP-E, NF-P, and NP-P, respectively (). All of the predicted Vermilion Snapper selectivity curves were broad regardless of the theoretical distribution tested; only the two best-fitting models (LN-E and LN-P) are plotted here (). The four best-fitting distributions were right skewed, while the worst distributions were symmetrical. In regions of the distributions where catch frequency was low, the residuals showed high variation resulting in underfitting or overfitting of the models, as evidenced by large residuals in those regions (). Evaluation of residual plots showed that regardless of the selectivity curve, the 8/0 hooks showed the lowest variation at the smallest sizes, while the 11/0 hooks exhibited the lowest variation at medium to large sizes. Residuals for the 15/0 hooks showed a high degree of variability, likely reflective of low catch frequencies. The shape of the selectivity curves and AIC values were similar for the LN-E and LN-P models, however, and Vermilion Snapper FLs at half selection and full selection were noticeably larger for the LN-P model. The shortest FLs at full selection were associated with the LN-E model (8/0: 305 mm; 11/0: 520 mm; 15/0: 950 mm). The longest FLs at full selection were associated with the LN-P model (8/0: 395 mm; 11/0: 620 mm; 15/0: 1,010 mm). Predicted FLs at half selection were shorter for the LN-E model (8/0: 195 mm; 11/0: 295 mm; 15/0: 570 mm) than for the LN-P model (8/0: 230 mm; 11/0: 360 mm; 15/0: 690 mm).
FIGURE 7. Selection curves (left panels) and deviance residual plots (right panels) for Vermilion Snapper caught on circle hooks of three sizes (8/0 = solid curve; 11/0 = dashed curve; 15/0 = dotted curve) for the lognormal model with equal fishing power (top panels) and the lognormal model with proportional fishing power (bottom panels). Solid circles represent positive residuals, and open circles represent negative residuals; the area of the circle is proportional to the square of the residual. Hook sizes are plotted based on the hook gape measurement (8/0: 6.75-mm gape; 11/0: 10.7-mm gape; 15/0: 20-mm gape).
DISCUSSION
Results of the analysis were similar for both Red Snapper and Vermilion Snapper: although there were significant differences in mean FL among hook sizes for each species, the length frequency distributions had wide ranges and considerable overlap among hook sizes, which resulted in broad selectivity curves. These results suggest that hook size regulations could potentially be a useful management strategy to more effectively target desired size-classes of Red Snapper or Vermilion Snapper in the GOM. Although hook size regulations might better target size-classes of these two species, the broadly overlapping length distributions indicate that this type of regulation would not eliminate undersized catch altogether. Selectivity curves generated from fundamentally different families of distributions produced equal fits to the data (e.g., the Red Snapper data fits to the normal and IG distributions). The theoretical fits tested in these analyses give some basis upon which to evaluate various selectivity curves, but the indirect method used here is still limited in applicability given that little is known about the size structure of the population being sampled; therefore, further development of direct methodologies is encouraged. Right-skewed distributions generally provided the best fit to the data, indicating that hook regulations are likely to be more effective if the desired goal is to reduce the amount of undersized catch by eliminating small hook sizes. Conversely, elimination of large hooks appears to be less likely to reduce the catch of larger size-classes because mouth gape is probably the primary limiting factor and small hooks continue to catch relatively large fish (i.e., small hooks fit into large mouths). Catch rates were significantly different among hook sizes; thus, regulations based on hook size could impact fishing effort and change the dynamics of how the snapper–grouper fishery is prosecuted. Tradeoffs between moderate improvements in size-class targeting, changes in effort, and the various components of fishing mortality (i.e., catch and regulatory discards) will require further investigation through simulation modeling or field experimentation.
Broad length frequency distributions and positive relationships between hook size and FL for both Red Snapper and Vermilion Snapper corroborate the results of the hook selectivity study conducted by Patterson et al. (Citation2012) in the GOM; that study used a direct method to estimate selectivity. Another difference between the two studies is that the present study used a setup common to the commercial fishing sector, whereas Patterson et al. (Citation2012) used a setup typically observed in the recreational fishery. Although our methodology would suggest that the present results are most relevant for the commercial fishing sector, the fact that the two studies produced similar results indicates that the setup is less important than the hooks themselves. Broad selectivity curves and increasing fish length with increasing hook size are corroborated in many studies on the topic (Ralston Citation1982; Otway and Craig Citation1993; Erzini et al. Citation1996, 2003; Weaver Citation1996; Bacheler and Buckel Citation2004; Yamashita et al. Citation2009). These results imply that hook size regulations could be used to more effectively target length-classes of Red Snapper or Vermilion Snapper in the GOM. The issue with the use of hook size to manage either of these snapper fisheries is that the length frequency distributions in both our study and the Patterson et al. (Citation2012) study were broad and overlapping. For instance, the largest Red Snapper in the data presented here were caught on the smallest (8/0) hook; conversely, the largest (15/0) hook captured Red Snapper as small as 219 mm. Therefore, while hook size regulations might shift the mean trend in the intended direction, the overall impact from a frequency standpoint might not be significant enough to eliminate problems associated with catching fish from the size-classes the regulations were intended to protect. For Red Snapper, 15/0 was the only hook size that showed significant differences in length distribution as revealed by the Kolmogorov–Smirnov test. Unlike Red Snapper, Vermilion Snapper did show significant differences in length distributions between the 8/0 and 11/0 hook sizes, but data from 15/0 hooks were insufficient for obtaining a decent test of distributions. We envision several hook size management scenarios that have similar theoretical underpinnings in that all are intended to maximize reproductive output, but they do so by protecting different portions of the population and they operate under different assumptions.
One possibility is to increase the minimum hook size allowed (i.e., eliminate small hook sizes), which theoretically would reduce fishing mortality of undersized, immature Red Snapper and Vermilion Snapper. Decreasing mortality for length-classes of immature fish increases the likelihood that successful reproduction will occur before fishery removals impact the population. Part of the historical issue in the Red Snapper fishery has been the high frequency of regulatory discards coupled with considerable uncertainty in discard mortality rates (Campbell et al. Citation2010). One benefit of minimum hook size regulations is that regulatory discards in the catch would be reduced, thereby eliminating or reducing the uncertainty associated with the discard mortality portion of the total fishery catch (i.e., a higher proportion of the captured fish are landed rather than discarded). Length frequency distributions from this study and the Patterson et al. (Citation2012) study suggest that hook size regulations might not target size-classes efficiently enough to achieve meaningful reductions in regulatory discards from the catch, even though each study did show significant differences among hook sizes. The high degree of uncertainty in currently applied release mortality rates and the disagreement about which methodologies are most appropriate to estimate those rates further exacerbate this particular problem (CitationCampbell et al. 2014). Finding ways to improve population growth through regulating the catch may be more effective in reducing the amount of discard in the fishery.
While Red Snapper might benefit from the elimination of small hook sizes, the catch of Vermilion Snapper would be greatly reduced, particularly if the minimum hook size is 15/0. Therefore, an increase in effort would be needed to fill Vermilion Snapper bag limits, while Red Snapper would not be excluded from the catch, and the problem of high amounts of regulatory discard would not have been addressed. Throughout the GOM, it is rare to have complete separation in the catches of these two species such that Red Snapper can be avoided when Vermilion Snapper are being targeted or vice versa. Management of the two species by using hook size regulations is confounded due to their broadly overlapping spatial distributions. A regulation affecting Red Snapper will always affect Vermilion Snapper, and this effect is likely to extend to the entire suite of snapper–grouper species being targeted in the GOM. It is important to remember that this study used a commercial snapper fishery-type setup that consisted of 10 hooks on gangions, with the weight deployed beneath (i.e., bandit reel), whereas the recreational fishery tends to have a wide variety of setups, including some in which the weight is located above a single hook. Ultimately, the vertical-line gear as we deployed it was not effective for capturing groupers, so our data do not provide information on patterns of selectivity for grouper species. Therefore, the present results are most useful for evaluating selectivity in the commercial snapper fisheries.
Protection of immature size-classes through the elimination of small hooks is theoretically feasible, particularly if the right-skewed selectivity curves are correct, but the desired effect on the population relies on the assumption that density-dependent mortality has impacted the population before fish recruit to the vertical-line fishery. If density-dependent factors still affect the population at larger fish sizes, then any benefits of lower fishing mortality are reduced because natural mortality would act to remove individuals. For GOM Red Snapper, density-dependent relationships with mortality are theorized to impact the population at some point prior to recruitment to reef habitat (e.g., before age 3), at which point the fish become vulnerable to the directed fishery (Gazey et al. Citation2008; Cowan et al. Citation2011). Ideally, a clearer understanding of the mechanisms regulating the Red Snapper and Vermilion Snapper populations would be obtained before a hook regulation is implemented (Winemiller and Rose Citation1992; Rose et al. Citation2001).
Under the second envisioned scenario, the fishery is managed by eliminating large hooks (e.g., 15/0), which would potentially decrease fishing mortality for the largest Red Snapper with the highest fecundities (Collins et al. Citation2001; Porch et al. Citation2007). The strategy assumes that reproductive potential lost through mortality is offset by increased egg production in older and larger fish because they produce more eggs (Walters et al. Citation2008; Venturelli et al. Citation2009); this strategy has been recommended since the first Red Snapper assessments in the 1980s (Goodyear Citation1995; Hood et al. Citation2007). Given the significant differences in Red Snapper FL among hook sizes, it seems to be a feasible management strategy. However, significant differences in FL between the vertical-line data (CSSP-VL and SEAMAP-VL, 15/0 hook) and the longline data (CSSP-LL, 15/0 hook) suggest that the largest Red Snapper are not available in the high-relief reef tracts where vertical-line gear is deployed. An ontogenetic shift in habitat preference from high-relief habitat to mud flats has been reported in other studies and is thought to occur between ages 6 and 8 (Gallaway et al. Citation2009; Cowan et al. Citation2011). Therefore, the implication is that elimination of the largest hook (15/0) would only have a small effect because the Red Snapper size-classes that the regulation is aimed to protect are not occupying the habitat where vertical lines are used. Protection of the largest size-classes of Red Snapper was likely achieved by the elimination of longline gear from GOM waters shallower than 50 m; that regulation was implemented in 1990, and its benefits are now impacting the fishery as existing year-classes age (Cowan et al. Citation2011). This strategy requires patience because Red Snapper periodically produce a large year-class every 5–10 years (Rose et al. Citation2001), and reproductive output is not maximized until age 13 (Porch et al. Citation2007); therefore, the benefits of this management strategy might be decades in the making.
For Red Snapper and Vermilion Snapper, right-skewed distributions such as LN-E, LN-P, IG-E, and IG-P provided the best fit to the data, with the one exception being the NF-E model for Red Snapper. Right-skewed distributions make sense when the mechanistic limitations of hooking gears are considered. If mouth gape is the limiting factor that regulates the effectiveness of hooking gears, as has been suggested previously (Yamashita et al. Citation2009), then large hooks are less efficient at capturing fish with small mouth gapes than small hooks are at capturing fish with large gapes (i.e., small hooks fit into large mouths). This result is particularly evident from the Vermilion Snapper catch, as very few fish were captured on the 15/0 hook size; for both species, catch rates were lowest on this largest hook. In contrast, large fish of either species were captured on the smallest hook; in fact, the largest individual Red Snapper collected during this study was captured on the smallest hook size. Therefore, it appears that hook size is more limiting in one direction. The curves for the right-skewed distributions had steeply ascending portions, thereby supporting the hypothesis that elimination of smaller hooks would be the more effective type of regulation.
Although right-skewed distributions offered the best fit to the data, the fact that we had large sample sizes for Red Snapper but large differences between deviance values and df suggests that the tested distributions were inappropriate for Red Snapper. This result is further supported by the deviance residual plots. Because the right-skewed distributions generally showed the best fit, asymptotic selectivity models would perhaps be more appropriate for Red Snapper. The difference between model df and deviance was small for Vermilion Snapper, so the unimodal types of distribution appear to be appropriate for this species.
The symmetrical distributions, such as NF-P, G-E, and G-P, yielded the worst fit to the Red Snapper data; the one exception was the NF-E model, which showed the best fit. The implication of the NF-E model—that Red Snapper are selected throughout their life history—is likely associated with the fixed-spread property that forces geometrical symmetry across all hook sizes. Despite the good fit criteria for the NF-E model, this model does not make sense when considering the catch itself, and the result is further diminished because the symmetrical distributions otherwise showed the poorest fit in all other cases for both species.
The nature of the right-skewed selection curves indicates that larger Red Snapper are still present in the population but are not selected by the hook sizes used in our study; unfortunately, this possibility cannot be evaluated with indirect selectivity analysis. In a similar study where selectivity curves were estimated directly by coupling video and catch data (Patterson et al. Citation2012), it was suggested that a dome-shaped function fit best for the two smallest hook sizes (9/0 and 12/0), while either a logistic curve or a dome-shaped curve was appropriate for the largest hook size (15/0), which was tested with two different hook combinations. The hypothesis that larger fish are present in the population but are not selected by the 15/0 hook is supported by the fact that the largest Red Snapper sampled in NMFS GOM surveys have been captured by using bottom longline gear (Mitchell et al. Citation2004), and this result is confirmed in the CSSP survey data presented here. Furthermore, the International Game Fish Association's world-record Red Snapper captured with rod and reel had a stretched TL of 1,016 mm (40 in), which is approximately 100 mm longer than fish captured in any of the NMFS surveys. The absence of the largest Red Snapper in the catch from these vertical line surveys could be due to deployment of the gear over high-relief habitat rather than in mud flats, which is not a commercially practical deployment strategy.
Plots of residuals presented further evidence that the predicted selectivity curves were wide, resulting in substantial overfitting and underfitting of the model at TLs where catch occurred at low frequency, such as when large fish were captured on small hooks or vice versa. The implication is the same as hypothesized earlier—that is, hook size management applications may not be precise enough to result in the desired effect (i.e., protection of a given size-class of fish), and normal models for selectivity curves are probably not appropriate even if AIC values indicate that they are the best-fitting models. Furthermore, due to the broadness in the length frequency distributions, the effects of hook size regulations on the length composition and catch rates of the fishery should be thoroughly investigated in a population model and preferably in the assessment model itself.
Overall, our investigation demonstrated that broad selectivity curves were produced for Red Snapper and Vermilion Snapper, similar to the results of other studies on hook selectivity. Although the selectivity curves were broad, the right-skewed nature of the best-fitting models suggests that the elimination of small hooks could help to reduce the catch of undersized Red Snapper and Vermilion Snapper. The effect of bait size was not investigated here, and the fact that bait size was held constant to hook size may have impacted the results. Future studies should include a component that maintains a constant bait size while varying the hook size. The setup used for vertical-line gear in the present study is common in the commercial snapper–grouper fishery; therefore, our results are most relevant for the commercial sector than for the recreational sector and are most appropriate for Red Snapper and Vermilion Snapper. Indirect estimation of selectivity curves was an effective method given that we could not directly estimate the length composition of the sampled population. In future studies, it would be optimal to couple the length composition data from the catch with data collected via optical systems, which have fewer associated biases and allow for direct estimation of selectivity.
Related Research Data
REFERENCES
- Bacheler, N. M., and J. A. Buckel. 2004. Does hook type influence the catch rate, size, and injury of grouper in a North Carolina commercial fishery? Fisheries Research 69:303–311.
- Boy, V., and A. J. Crivelli. 1988. Simultaneous determination of gillnet selectivity and population age-class distribution for two cyprinids. Fisheries Research 6:337–345.
- Campbell, M. D., W. B. Driggers, B. Sauls, and J. Walter. 2014. Release mortality in the Red Snapper fishery: a meta-analysis of three decades of research. U.S. National Marine Fisheries Service Fishery Bulletin 112:283–296.
- Campbell, M. D., A. Pollack, T. Henwood, J. Provaznik, and M. Cook. 2012a. Summary report of the Red Snapper (Lutjanus campechanus) catch during the 2011 Congressional Supplemental Sampling Program. SouthEast Data Assessment and Review, SEDAR31-DW17, North Charleston, South Carolina. Available: http://www.sefsc.noaa.gov/sedar/.
- Campbell, M. D., K. R. Rademacher, P. Felts, B. Noble, M. Felts, and J. Salisbury. 2012b. SEAMAP reef fish video survey: relative indices of abundance of Red Snapper, July 2012. SouthEast Data Assessment and Review, SEDAR31-DW08, North Charleston, South Carolina. Available: http://www.sefsc.noaa.gov/sedar/.
- Campbell, M. D, J. Tolan, R. Strauss, and S. L. Diamond. 2010. Relating angling-dependent fish impairment to immediate release mortality of Red Snapper (Lutjanus campechanus). Fisheries Research 106:64–70.
- Collins, L. A., G. R. Fitzhugh, L. Mourand, L. A. Lombardi, W. T. Walling, W. A. Fable, M. R. Burnett, and R. J. Allman. 2001. Preliminary results from a continuing study of spawning and fecundity in the Red Snapper (Lutjanidae: Lutjanus campechanus) from the Gulf of Mexico, 1998–1999. Proceedings of the Gulf and Caribbean Fisheries Institute 52:34–47.
- Cowan, J. H. Jr., C. B. Grimes, W. F. Patterson III, C. J. Walters, A. C. Jones, W. J. Lindberg, D. J. Sheehy, W. E. Pine III, J. E. Powers, M. D. Campbell, K. C. Lindeman, S. L. Diamond, R. Hilborn, H. T. Gibson, and K. A. Rose. 2011. Red Snapper management in the Gulf of Mexico: science- or faith-based? Reviews in Fish Biology and Fisheries 21:187–204.
- Driggers, W. B., E. R. Hoffmayer, and M. D. Campbell. 2012. Feeding chronology of seven species of carcharhinid sharks in the western North Atlantic Ocean as inferred from longline capture data. Marine Ecology Progress Series 465:185–192.
- Erzini, K., J. M. S. Gonçalves, L. Bentes, P. G. Lino, and J. Cruz. 1996. Species and selectivity in a Portuguese multispecies artisanal long-line fishery. ICES Journal of Marine Science 53:811–819.
- Erzini, K., J. M. S. Gonçalves, L. Bentes, P. G. Lino, and J. Ribeiro. 1998. Species and size selectivity in a ‘Red’ Sea Bream longline ‘métier’ in the Algarve (southern Portugal). Aquatic Living Resources 11:1–11.
- Erzini, K., J. M. S. Gonçalves, L. Bentes, P. G. Lino, J. Ribeiro, and K. I. Stergiou. 2003. Quantifying the roles of competing static gears: comparative selectivity of longlines and monofilament gill nets in a multi-species fishery of the Algarve (southern Portugal). Scientia Marina 67:341–352.
- Gallaway, B. J., S. T. Szedlmayer, and W. J. Gazey. 2009. A life history review for Red Snapper in the Gulf of Mexico with an evaluation of the importance of offshore petroleum platforms and other artificial reefs. Reviews in Fisheries Science 17:48–67.
- Gazey, W. J., B. J. Gallaway, J. G. Cole, and D. A. Fournier. 2008. Age composition, growth, and density-dependent mortality in juvenile Red Snapper estimated from observer data from the Gulf of Mexico penaeid shrimp fishery. North American Journal of Fisheries Management 28:1828–1842.
- Goodyear, C. P. 1995. Red Snapper in U.S. waters of the Gulf of Mexico. National Marine Fisheries Service, Southeast Fisheries Science Center, Miami Laboratory, MIA-95/96-05, Miami.
- Hamley, J. M. 1975. Review of gillnet selectivity. Journal of the Fisheries Research Board of Canada 32:1943–1969.
- Helser, T. E., R. E. Condrey, and J. P. Geaghan. 1991. A new method of estimating gillnet selectivity, with an example for Spotted Seatrout, Cynoscion nebulosus. Canadian Journal of Fisheries and Aquatic Sciences 48:487–492.
- Helser, T. E., J. P. Geaghan, and R. E. Condrey. 1994. Estimating size composition and associated variance of a fish population for gillnet selectivity, with an example for Spotted Seatrout, Cynoscion nebulosus. Fisheries Research 19:65–86.
- Henderson, B. A., and J. L. Wong. 1991. A method for estimating gillnet selectivity of Walleye (Stizostedion vitreum vitreum) in multimesh multifilament fill nest in Lake Erie, and its application. Canadian Journal of Fisheries and Aquatic Sciences 48:2420–2428.
- Holt, S. J. 1963. A method for determining gear selectivity and its application. International Commission for the Northwest Atlantic Fisheries (ICNAF) Special Publication 5:106–115.
- Hood, P. B., A. J. Strelcheck, and P. Steele. 2007. A history of Red Snapper management in the Gulf of Mexico. Pages 267–284 in W. F. Patterson III, J. H. Cowan Jr., G. R. Fitzhugh, and D. L. Nieland, editors. Red Snapper ecology and fisheries in the U.S. Gulf of Mexico. American Fisheries Society, Symposium 60, Bethesda, Maryland.
- Kenchington, T. J. 1993. Estimation of the functional form of selectivity by baited hooks: a graphical approach. Canadian Journal of Fisheries and Aquatic Sciences 50:772–780.
- Kirkwood, G. P., and T. I. Walker. 1986. Gill net mesh selectivity for Gummy Shark, Mustelus antarcticus Gunter, taken in south-eastern Australian waters. Australian Journal of Marine and Freshwater Research 37:689–697.
- McAuley, R. B., C. A. Simpfendorfer, and I. W. Wright. 2007. Gillnet mesh selectivity of the Sandbar Shark (Carcharhinus plumbeus): implications for fisheries management. ICES Journal of Marine Science 64:1702–1709.
- McCraken, F. D. 1963. Selection by cod end meshes and hooks on cod, haddock, flatfish and redfish. International Commission for the Northwest Atlantic Fisheries (ICNAF) Special Publication 5:131–155.
- Millar, R. B. 1992. Estimating the size-selectivity of fishing gear by conditioning on the total catch. Journal of the American Statistical Association 67:962–968.
- Millar, R. B. 1995. The functional form of hook and gillnet selection curves can not be determined from comparative catch data alone. Canadian Journal of Fisheries and Aquatic Sciences 52:883–891.
- Millar, R. B., and R. J. Fryer. 1999. Estimating the size-selection curves of towed gears, traps, nets and hooks. Reviews in Fish Biology and Fisheries 9:89–116.
- Millar, R. B., and R. Holst. 1997. Estimation of gillnet and hook selectivity using log-linear models. ICES Journal of Marine Science 54:471–477.
- Mitchell, K. M., T. Henwood, G. R. Fitzhugh, and R. J. Allman. 2004. Distribution, abundance, and age structure of Red Snapper (Lutjanus campechanus) caught on research longlines in the U.S. Gulf of Mexico. Gulf of Mexico Science 22:164–172.
- Munro, P. T., and D. A. Somerton. 2001. Maximum likelihood and non-parametric methods for estimating trawl footrope selectivity. ICES Journal of Marine Science 58:220–229.
- NOAA (National Oceanic and Atmospheric Administration). 2013. Fisheries of the Caribbean, Gulf of Mexico, and South Atlantic. Federal Register 78:74(17 April 2013):22950–23052.
- Otway, N. M., and J. R. Craig. 1993. Effects of hook size on the catches of undersized snapper Pagrus auratus. Marine Ecology Progress Series 93:9–15.
- Patterson, W. F. III, C. E. Porch, J. H. Tarnecki, and A. J. Strelcheck. 2012. Effect of circle hook size on reef fish catch rates, species composition, and selectivity in the northern Gulf of Mexico recreational fishery. Bulletin of Marine Science 88:647–665.
- Pope, J. A., A. R. Margetts, J. M. Hamley, and E. F. Akyuz. 1975. Manual of methods for fish stock assessment part III: selectivity of fishing gear. FAO Fisheries Technical Paper 41.
- Porch, C. E., G. R. Fitzhugh, M. W. Jackson, M. S. Duncan, and L. A. Collins. 2007. Modeling the dependence of batch fecundity on size and age for use in stock assessments of Red Snapper in U.S. Gulf of Mexico waters. Pages 229–244 in W. F. Patterson III, J. H. Cowan Jr., G. R. Fitzhugh, and D. L. Nieland, editors. Red Snapper life history, ecology, and fisheries in the United States Gulf of Mexico. American Fisheries Society, Symposium 60, Bethesda, Maryland.
- Ralston, S. 1982. Influence of hook size in the Hawaiian deep-sea handline fishery. Canadian Journal of Fisheries and Aquatic Sciences 39:1297–1302.
- Regier, H. A., and D. S. Robson. 1966. Selectivity of gillnets, especially to Lake Whitefish. Journal of the Fisheries Research Board of Canada 23:423–454.
- Rose, K. A., J. H. Cowan Jr., K. O. Winemiller, R. A. Myers, and R. Hilborn. 2001. Compensatory density dependence in fish populations: importance, controversy, understanding, and prognosis. Fish and Fisheries 2:293–327.
- Sauls, B., and O. Ayala. 2012. Circle hook requirements in the Gulf of Mexico: application in recreational fisheries and effectiveness for conservation of reef fishes. Bulletin of Marine Science 88:667–679.
- Venturelli, P. A., B. J. Shuter, and C. A. Murphy. 2009. Evidence for harvest-induced maternal influences on the reproductive rates of fish populations. Proceedings of the Royal Society of London B 276:919–924.
- Walters, C. J., R. Hilborn, and V. Christensen. 2008. Surplus production dynamics in declining and recovering fish populations. Canadian Journal of Fisheries and Aquatic Sciences 65:2536–2551.
- Weaver, D. C. 1996. Feeding ecology and ecomorphology of three sea basses (Pisces: Serranidae) in the northeastern Gulf of Mexico. Master's thesis. University of Florida, Gainesville.
- Winemiller, K. O., and K. A. Rose. 1992. Patterns of life-history diversification in North American fishes: implications for population regulation. Canadian Journal of Fisheries and Aquatic Sciences 49:2196–2220.
- Yamashita, H., D. Shiode, and T. Tokai. 2009. Longline hook selectivity for Red Tilefish Branchiostegus japonicas in the east China Sea. Fisheries Science 75:863–874.