
Abstract
Native to the central USA, the Blue Catfish Ictalurus furcatus and the Flathead Catfish Pylodictis olivaris have been widely introduced into many Atlantic slope rivers and are now found in several drainages of the Chesapeake Bay. Fisheries managers are concerned that these large, long-lived catfish species may be contributing to observed declines in anadromous species, such as the American Shad Alosa sapidissima, Blueback Herring A. aestivalis, and Alewife A. pseudoharengus, all of which once comprised major U.S. fisheries. We assessed spatiotemporal variability and selectivity in the diets of Blue Catfish and Flathead Catfish during the spawning migration of these alosines. Catfish stomachs were collected during March–May in nontidal freshwater, tidal freshwater, oligohaline, and mesohaline portions of the James River. Diet contents were extracted from 2,495 catfish, 69.86% of which had prey items present in their foreguts (N = 1,743). We used DNA barcoding to identify degraded fish prey; nearly 30 taxa that would have otherwise gone undetected were identified in this manner. Blue Catfish had broad, omnivorous diets, whereas Flathead Catfish fed solely on other fish. Alosines were found in 4.46% of Blue Catfish stomachs and 16.67% of Flathead Catfish stomachs. Flathead Catfish selectively preyed on American Shad and, to a lesser degree, river herring. Alosines were consumed more frequently in nontidal freshwater areas, particularly in the high-gradient reach between Bosher Dam and the 14th Street Bridge, and predation on alosines peaked in April. Our results suggest that Flathead Catfish are likely to have a greater per capita impact on depleted alosines. Furthermore, dams and other obstacles to fish movement may increase alosines’ vulnerability to predation by large catfish.
Received July 6, 2016; accepted December 4, 2016
Introduced species are a growing concern for fisheries managers, as they can suppress native species, alter food web dynamics, and threaten biodiversity (Moyle and Light Citation1996; Jelks et al. Citation2008). Many introduced species cause serious declines in the abundance or diversity of native species and may cause substantial economic harm (Folkerts Citation1999). Habitat degradation and introduced species are major drivers of ecosystem change, yet the high correlation between the two makes it difficult to distinguish which factor is causing the observed changes (MacDougall and Turkington Citation2005; Light and Marchetti Citation2007). The question often remains whether an invasive species is the driver of change or merely the passenger of human-mediated changes, such as pollution, habitat degradation and fragmentation, climate change, or a combination thereof (MacDougall and Turkington Citation2005; Light and Marchetti Citation2007).
Blue Catfish Ictalurus furcatus and Flathead Catfish Pylodictis olivaris are both large, long-lived species that can weigh in excess of 50 kg and can live for over 25 years (Graham Citation1999; Jackson Citation1999). Blue Catfish are native to the Mississippi River drainage, with populations extending southward into Mexico and Central America (Graham Citation1999). Flathead Catfish are native to the Mississippi River, Rio Grande, and Mobile River drainages, with native populations also occurring in northeastern Mexico and the Great Lakes region (Jackson Citation1999). Both catfish species have been widely introduced outside of their native ranges and are now found in several Atlantic and Pacific drainages (Graham Citation1999; Jackson Citation1999).
Blue Catfish were introduced into Virginia tributaries of the Chesapeake Bay during the 1970s and 1980s (Jenkins and Burkhead Citation1994), a time when many fisheries had collapsed or were on the brink of collapse (Smith Citation1985; Rothschild et al. Citation1994; Richards and Rago Citation1999). Blue Catfish populations have since expanded, and the species now dominates the ichthyofaunal biomass in certain areas (Greenlee and Lim Citation2011). They are currently found within every major tributary of the Chesapeake Bay and have been captured in salinities as high as 14.7‰ (Schloesser et al. Citation2011). The ability of Blue Catfish to thrive in brackish habitats has allowed them to spread downriver into oligohaline and mesohaline areas (Schloesser et al. Citation2011), where electrofishing capture rates of this species have been as high as 6,000 fish/h (Greenlee and Lim Citation2011).
Flathead Catfish were originally introduced into the James River, Virginia, but are now established in the James, Potomac, and Susquehanna River drainages (Jenkins and Burkhead Citation1994; Brown et al. Citation2005; Orrell and Weigt Citation2005). We have also captured several juvenile and mature individuals (N = 22) from the York River, where Flathead Catfish had previously been undocumented (our personal observations). Both Blue Catfish and Flathead Catfish are accustomed to foraging in the muddy rivers of their native ranges and are well adapted to life in the present-day Chesapeake Bay, which has been transformed into a turbid, nutrient-rich system due to agricultural runoff and other anthropogenic disturbances (Boesch et al. Citation2001).
Blue Catfish are omnivorous, often consuming vegetation, mollusks, insects, and crustaceans, with larger individuals shifting to piscivory (Edds et al. Citation2002; Eggleton and Schramm Citation2004). Conversely, Flathead Catfish are almost exclusively piscivorous, even at small sizes (Jackson Citation1999; Herndon and Waters Citation2002; Pine et al. Citation2005). Flathead Catfish have earned respect and admiration from anglers and biologists, mostly for their size, strength, and predatory aggressiveness (Jackson Citation1999). Their piscivorous nature has also earned them a reputation as a dangerous invasive species (Fuller et al. Citation1999), and food web simulation models have projected up to 50% declines in native fish biomass after the establishment of Flathead Catfish (Pine et al. Citation2007). Blue Catfish and Flathead Catfish are both capable of inhabiting brackish waters, although Flathead Catfish seem to prefer lower-salinity areas, whereas Blue Catfish routinely use estuarine waters (Perry Citation1969; Bringolf et al. Citation2005; Schloesser et al. Citation2011). The diverse food habits of these nonnative catfishes have the potential to impact a multitude of imperiled or commercially valuable native species, including the American Shad Alosa sapidissima, Alewife Alosa pseudoharengus, Blueback Herring Alosa aestivalis, American Eel Anguilla rostrata, and blue crab Callinectes sapidus (Haro et al. Citation2000; Lipcius and Stockhausen Citation2002; Limburg and Waldman Citation2009).
A major question has been whether introduced catfish are preying heavily upon depleted anadromous clupeids, including river herring (i.e., Blueback Herring and Alewives) and American Shad—species that once supported major fisheries along the Atlantic coast (Hall et al. Citation2012; Bethoney et al. Citation2013). These anadromous clupeids, collectively known as alosines, spend much of their lives at sea but return to freshwater portions of Virginia’s tidal rivers every spring to spawn (Garman and Nielsen Citation1992). Dramatic declines in alosine populations have been observed over recent years (Limburg and Waldman Citation2009), and despite ongoing restoration efforts, these species have reached all-time low abundances across much of their range (Hasselman and Limburg Citation2012). Several possible causes have been implicated in the observed stock declines, including overfishing, habitat loss, climate change, barriers to migration, and predation (Hall et al. Citation2012; Bethoney et al. Citation2013; Brown et al. Citation2013). Although predation is likely only a part of the larger problem, the presence of introduced catfishes within key migratory pathways may hinder alosine restoration efforts.
Previous studies have provided valuable insight into the feeding ecology of Blue Catfish within the Chesapeake Bay, yet they have been unable to quantify predation on alosines by introduced catfish. MacAvoy et al. (Citation2000) conducted stable isotope analysis and suggested that marine-derived nutrients contributed to the diets of Blue Catfish; however, their study was limited to a very small sample (N = 22) from one location on the Rappahannock River. Schloesser et al. (Citation2011) provided a more thorough description of Blue Catfish feeding habits in Virginia’s tidal rivers, but that study was limited to oligohaline and mesohaline portions of the rivers and captured primarily small fish (≤590 mm FL). This is problematic because Blue Catfish regularly grow much larger (>1,000 mm FL), and larger individuals are more likely to be piscivorous (Edds et al. Citation2002). Information on Flathead Catfish is scarce within the scientific literature, and there are no published descriptions of this species’ diet within the Chesapeake Bay. Moreover, there have been no targeted efforts to quantify Blue Catfish or Flathead Catfish predation on Alosa spp. during their spring spawning migration in any Atlantic slope drainage.
We focused our research on answering the following specific questions: (1) “What are Blue Catfish and Flathead Catfish eating during the spring, and do alosines contribute to their diets?”; (2) “Are these nonnative catfish selectively feeding on alosines or are they preying on them in proportion to their relative abundance in the environment?”; and (3) “How does catfish predation on alosines vary spatially and temporally during the spring?”
METHODS
Sampling efforts were focused within the James River because it supports dense populations of large Blue Catfish and Flathead Catfish (Harris and Jones Citation2008; Greenlee and Lim Citation2011) and once supported large Alosa spp. migrations (Aunins and Onley Citation2009; Hilton et al. Citation2011). Blue Catfish and Flathead Catfish were collected in the James River from March to May, as these months corresponded with the spring spawning movements of Blueback Herring, Alewives, and American Shad within the Chesapeake Bay (Garman and Nielsen Citation1992; Hewitt et al. Citation2009; Hilton et al. Citation2011). The majority of sampling was conducted in 2015, although some fish were collected during spring 2014.
Collection of Specimens
Electrofishing was used to sample catfish, as this method collects both active and inactive fish (Bowen Citation1996). Low-frequency electrofishing is the preferred method for sampling Blue Catfish, but it is ineffective until waters warm to 18°C, and it becomes optimal at temperatures greater than 22°C (Justus Citation1994; Bodine and Shoup Citation2010). Water temperatures did not reach 18°C until late May, so high-frequency electrofishing (60 Hz, 325 V, 12 A) was used to collect catfish during March, April, and most of May. High-frequency electrofishing is limited to shallow-water habitat and is much more time intensive than low-frequency electrofishing. Given this constraint, early spring sampling efforts focused on areas that were shallow enough for the gear to work—typically less than 2 m deep (Justus Citation1994). Sampling was slow, and usually only one or two fish were collected at a time, often hundreds of meters apart. Sampling during March–May occurred in several areas that were known to contain alosines during their spawning migration. Hundreds of sites were sampled in nontidal freshwater (the tailwaters of Bosher Dam and the area near the Manchester Bridge), tidal freshwater, and three tidal estuarine creeks (). The primary sampling area, where most sampling occurred, extended from the end of the fall line in Richmond to the Dutch Gap Conservation Area, as alosines are known to congregate in this reach during the spring. The primary reach was divided into numbered 500-m sections, and a random number generator was used to select the sampling locations. Additional sites were located in brackish tributaries of the James River (Herring, Wards, and Gordon creeks), which are also known to contain alosines during the spring (). The three tributaries are either oligohaline or mesohaline, with recorded salinities ranging from 1‰ to 10‰. Each major area was sampled at least once per week from March 1 through May 31.
FIGURE 1. Map of the major sampling areas (rectangles) in the James River near Richmond, Virginia. The upper panel depicts the nontidal freshwater sampling areas just west of Richmond (Bosher Dam and Manchester Pool); the lower panel shows the tidal sampling areas southeast of Richmond (tidal freshwater [primary sampling area]; and Herring, Wards, and Gordon creeks).
![FIGURE 1. Map of the major sampling areas (rectangles) in the James River near Richmond, Virginia. The upper panel depicts the nontidal freshwater sampling areas just west of Richmond (Bosher Dam and Manchester Pool); the lower panel shows the tidal sampling areas southeast of Richmond (tidal freshwater [primary sampling area]; and Herring, Wards, and Gordon creeks).](/cms/asset/df659ef9-3ce9-4ecd-8377-962289e844e1/umcf_a_1271844_f0001_b.gif)
Low-frequency electrofishing was used once the water temperatures warmed to 18°C in late May, thus allowing us to sample fish in deeper water (>3 m); however, very few catfish were encountered in deep water, and none of those individuals had prey items in their stomachs. Upon capture, diet contents were obtained by sacrificing the fish or by extracting the contents from live fish via pulsed gastric lavage, which has been demonstrated as very effective for use with Blue Catfish and Flathead Catfish (Waters et al. Citation2004). Stomach contents were extracted within 30 min of capture; the time, water temperature, tidal phase, and coordinates were recorded for each sampling event. Fish total weight and TL were also recorded, and diet contents were placed on ice and later frozen. In the laboratory, prey items were thawed, weighed, counted, and identified to the lowest possible taxon.
Molecular Identification of Fish Prey
Partially digested fish prey that are unrecognizable by gross morphology represent a major obstacle for diet studies, often resulting in the loss of important information (Dunn et al. Citation2010; Carreon-Martinez et al. Citation2011). Previous studies have demonstrated that for Blue Catfish, empty stomachs are common and fish prey are rare in the stomach contents (Schloesser et al. Citation2011), emphasizing the importance of properly identifying fish remains when trying to quantify predation on rare species. Furthermore, some species digest faster than others, which can lead to erroneous conclusions about the relative importance of prey items when digestion has rendered them unidentifiable (Hyslop Citation1980). Known as differential digestion, this phenomenon has also been demonstrated to impact conclusions pertaining to selectivity and electivity (Ivlev Citation1961). To mediate this potential bias, we utilized advanced molecular techniques (via methods described by Moran et al. Citation2015) to identify partially digested fish.
Prior to lysis, samples were defrosted and rinsed with ethanol. Utensils were sterilized with a 10% bleach mixture; rinsed with autoclaved, deionized water; and allowed to dry. A 10-mm × 10-mm piece of tissue was excised and transferred to a sterilized microcentrifuge tube by using sterilized utensils. Next, 180 μL of digestive solution were transferred to each microcentrifuge tube along with 20 μL of proteinase K. Samples were incubated at 56°C to allow for proper lysis. Manual extraction was conducted by using protocols listed in a DNeasy Blood and Tissue Kit (Qiagen, Hilden, Germany).
Blue Catfish and Flathead Catfish prey upon many species of fish, so we selected universal mitochondrial cytochrome oxidase 1 (CO1) primers that would amplify DNA for all potential prey fish within the Chesapeake Bay. The DNA sequences for the mitochondrial CO1 gene were amplified by using a cocktail of four fish primers (FishF2_t1, FishR2_t1, VF2_t1, and FR1d_t1) that were developed for the CO1-3 region (Ivanova et al. Citation2007). The PCR amplifications also followed the protocol of Ivanova et al. (Citation2007), with minor modifications. Polymerase chain reaction was conducted in a total volume of 12.5 μL, which included 6.25 μL of 10% trehalose, 2.00 μL of ultrapure water, 1.25 μL of 10× PCR buffer (10-mM KCl, 10-nM [NH4]2SO4, 20-mM tris-HCl [pH 8.8], 2-mM MgSO4, and 0.1% Triton X-100), 0.625 μL of MgCl2 (50 mM), 0.125 μL of each primer (0.01 mM), 0.0625 μL of each deoxynucleotide triphosphate (10 mM), 0.0625 μL of Taq DNA polymerase (New England BioLabs, Ipswich, Massachusetts), and 2.0 μL of DNA template (mean concentration = 74 μg/mL). The PCR was performed on a Bio-Rad MyCycler with the following thermocycling conditions: initial denaturation at 94°C for 2 min; followed by 35 cycles of 94°C for 30 s, annealing at 52°C for 40 s, and 72°C for 1 min; and a final extension step at 72°C for 10 min. The PCR products were sequenced using the BigDye Terminator Cycle Sequencing Kit version 3.1 on an ABI 3730 DNA Sequencer (Applied Biosystems, Inc., Foster City, California). Sequencing reactions were initiated using the C_FishF1_t1 or C_FishR1_t1 primers of Ivanova et al. (Citation2007); sequenced samples were analyzed using Bioedit, and raw sequences were edited in Sequencher version 4.5 (Gene Codes Corp., Ann Arbor, Michigan). Edited samples were then identified by using the Basic Local Alignment Search Tool (BLAST; National Center for Biotechnology Information; www.ncbi.nlm.nih.gov/guide/sequence-analysis/). Possible species were determined based on high quintile scores from percent identification, percent query cover, and maximum identification score as references.
Fish Prey Selectivity
Selectivity indices compare the relative abundance of prey in the environment to their frequency of occurrence in the diet (Chipps and Garvey Citation2007). Relative abundance of fish prey taxa in the James River was assessed twice during 2015 (once in April and once in May) by using high-frequency, pulsed-DC electrofishing (60 Hz, 30% duty cycle, ~300 V). Relative prey abundance was estimated at 60 randomly selected locations (30 locations/month) within the primary sampling reach (see above) by utilizing three 120-s electrofishing passes at each site. Many selectivity studies have used depletion methods to estimate population sizes for prey species; however, these methods can be inherently biased, often leading to erroneous conclusions (Peterson et al. Citation2004). A simpler approach is to estimate the relative abundance of each prey species, which is often more pragmatic (Link Citation2004). These methods still assume equal capture probabilities for the different prey species—a reasonable assumption, as electrofishing has been demonstrated to be effective for estimating multispecies relative abundance in lotic habitats (Edwards et al. Citation2003).
Data Analysis
Sample size sufficiency
Cumulative prey curves (rarefaction curves) were used to assess whether our sample size was sufficient to describe the food habits of Blue Catfish and Flathead Catfish during the spring. Cumulative prey curves plot the total number of unique taxa in the diet versus the total number of stomachs analyzed, and sample size is considered sufficient once the curve reaches an asymptote (Ferry and Cailliet Citation1996). We computed rarefaction curves and associated 95% confidence intervals (CIs) by use of EstimateS version 9.1 (R. K. Colwell, Boulder, Colorado), with the cumulative number of unique prey taxa plotted against the randomly pooled samples. This random process was repeated 500 times to generate means and associated CIs. We used the slope (B) of the last four subsamples (linear regression) as an objective criterion for sample size sufficiency; sample size was considered sufficient at B-values of 0.05 or less (Bizzarro et al. Citation2007; Brown et al. Citation2012).
Ontogenetic diet shifts
Blue Catfish often exhibit onto-genetic shifts in diet, transitioning from omnivory to piscivory as they grow (Edds et al. Citation2002; Eggleton and Schramm Citation2004). An understanding of the size at which this shift occurs for Blue Catfish in the James River is important, as smaller individuals are unlikely to prey upon native fish species. To assess ontogenetic shifts in Blue Catfish diets, we placed prey items into logical categories based on ecology (vegetation, invertebrates, mollusks, crustaceans, fish, and miscellaneous), and we grouped Blue Catfish into 100-mm length classes. Indices of prey percent by weight (%W) were used to determine the TL at which Blue Catfish switched to piscivory. Logit and arcsine transformations of %W data failed to satisfy parametric assumptions, so the transformations were abandoned and nonparametric methods were used instead (Cortes Citation1997; Zar Citation1999; Warton and Hui Citation2011). Kruskal–Wallis ANOVA tests were used to determine whether predator length significantly influenced the %W of the major prey categories (Zar Citation1999). If significant differences were detected, post hoc Tukey’s multiple comparisons on ranks were used to determine the length(s) at which the diet shifts occurred (Conover and Iman Citation1981). Statistical significance was evaluated at an α of 0.05.
Diet composition
Prey importance was assessed by using both single and compound indices. Gravimetric (%W) indices were used to determine which prey items were nutritionally valuable, while percent occurrence (%O) indices were used to determine which prey items were routinely utilized at the population level (Macdonald and Green Citation1983). Compound indices were also used because they provide a more balanced understanding of the dietary importance of different prey (Pinkas et al. Citation1971; Bigg and Perez Citation1985; Cortes Citation1997; Brown et al. Citation2012). The traditionally used index of relative importance (IRI) is inherently flawed, as it combines mathematically dependent measures (Ortaz et al. Citation2006). Because of this, frequently occurring prey items are overemphasized, whereas rare prey items are underemphasized (Brown et al. Citation2012). Given these concerns, we decided to use the prey-specific IRI (PSIRI; Brown et al. Citation2012). Percent PSIRI values were used to estimate the difference in the importance of different food sources,
where %Oi is the frequency of occurrence for prey type i; %Ni is the percent by number of prey type i in all stomachs containing prey type i; and %Wi is the percent by weight of prey type i in all stomachs containing prey type i.
Spatiotemporal effects
Understanding the spatial vari-ability in predation on Alosa species will be important for future strategies to control nonnative catfishes, so logistic regression analysis was used to determine whether sampling location or sampling month could predict the occurrence of American Shad, Blueback Herring, or Alewives in the diets of catfish. Logistic regression was used, as it does not require assumptions of normality or homoscedasticity; furthermore, it is useful for describing relationships between a dichotomous outcome variable and one or more categorical descriptor variables (Peng et al. Citation2002). Logistic regression was performed using a generalized linear model with a logit link function and a binary error distribution (Goodnight Citation1982), which took the general form
where pAlosa is the probability that an individual catfish has an alosine in its stomach; β0 is the intercept; β1, β2, … βj are coefficients of spatiotemporal factors (month and spatial location); and X1, X2, … Xj are the variables of the spatiotemporal factors. Statistical significance was evaluated at an α of 0.05.
Prey selectivity
Many different selectivity indices exist, none of which satisfy all statistical criteria (Chipps and Garvey Citation2007). We used Chesson’s selectivity index (Chesson’s α), as it is recommended for most situations and has previously been used to describe feeding selectivity by nonnative Flathead Catfish in North Carolina (Baumann and Kwak Citation2011). Chesson’s α was determined separately for Blue Catfish and Flathead Catfish during April and May and was calculated for individual prey species as
where ri is the percent occurrence of fish species i in the diet; pi is the proportion of fish species i available in the system; rj and pj are the corresponding values for all fish species; and m is the number of fish taxa available in the system based on relative abundance sampling. Percent occurrence was calculated as the number of catfish whose stomachs contained prey fish of a given taxon divided by the total number of stomachs containing any fish. Relative prey abundance (i.e., proportion of the available prey field) was calculated as the mean proportion of a fish species per sampling event (Juanes et al. Citation2001; Link Citation2004). Chesson’s α was calculated for individual prey species by using stomachs from catfish captured within the same sampling section during the same time (April and May). The selectivity index ranges from 0 to 1, with completely random feeding occurring at 1/m (m = the total number of prey types found during sampling). Prey items with Chesson’s α values greater than the random feeding value 1/m were considered “selected,” whereas prey items with Chesson’s α values that were less than 1/m were deemed “not selected” (Chesson Citation1978). Our selectivity analysis focused on Alosa spp. and those species that were consumed by catfish and also found during relative abundance sampling. Only species that were present in multiple stomachs (N > 1) were analyzed, as inclusion of rare prey can be problematic (Confer and Moore Citation1987).
RESULTS
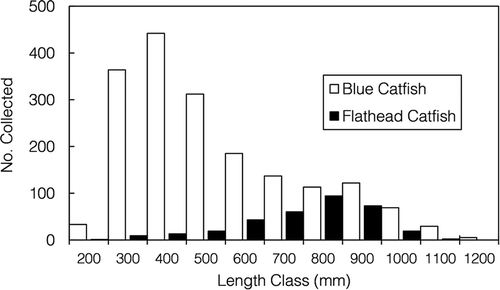
Stomach contents were extracted from a total of 2,495 catfish sampled during March–May. Blue Catfish (N = 2,164) were more commonly encountered than Flathead Catfish (N = 331), although Flathead Catfish had a larger average size (). High-frequency electrofishing enabled the capture of many larger fish: 30.41% of Blue Catfish (N = 658) and 87.31% of Flathead Catfish (N = 289) exceeded 600 mm TL. Prey items were found in 1,539 (71.12%) of the Blue Catfish stomachs and 204 (61.63%) of the Flathead Catfish stomachs.
FIGURE 2. Length frequency (mm TL) distributions for the 2,164 Blue Catfish and 331 Flathead Catfish that were collected from the James River during March–May 2014–2015.
Sample Size Sufficiency
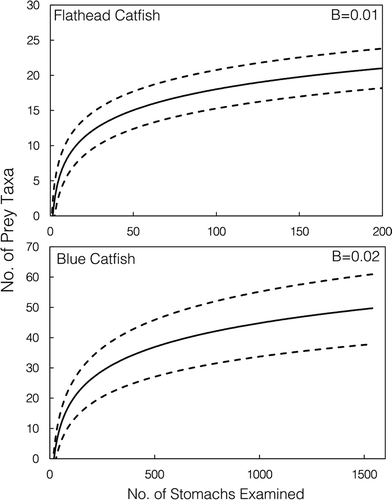
Cumulative prey curves for both Blue Catfish and Flathead Catfish achieved slopes of less than 0.05 (B = 0.02 and 0.01, respectively), indicating adequate sample sizes for diet description (Brown et al. Citation2012; ). Sample size requirements were much greater for Blue Catfish, as they ate a broader array of prey species than Flathead Catfish (~50 prey taxa versus 20 prey taxa), and the Blue Catfish prey curve required over 1,000 stomachs to reach a sufficient asymptote.
FIGURE 3. Cumulative prey curves (solid lines) and 95% confidence intervals (dashed lines) based on stomach content data from Flathead Catfish (N = 204; upper panel) and Blue Catfish (N = 1,539; lower panel) collected from the James River during March–May 2014–2015. The last four endpoints for both slopes (B) reached asymptotes, indicating that sampling was sufficient for diet description (B < 0.05).
Ontogenetic Shifts
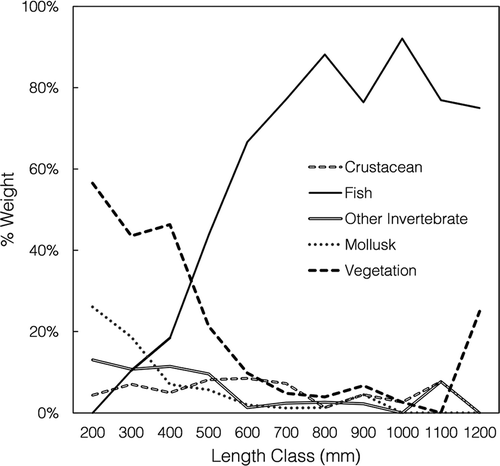
Flathead Catfish were exclusively piscivorous, so ontogenetic shifts were not analyzed for this species. Smaller Blue Catfish relied heavily on vegetation, mollusks, and invertebrates, whereas larger Blue Catfish began to include more fish in their diets (). Length-specific analysis indicated a significant ontogenetic shift (Kruskal–Wallis ANOVA test: P < 0.01), and post hoc testing indicated a significant increase in piscivory at 500 mm TL (Tukey’s honestly significant difference test on ranks: P < 0.01; ).
FIGURE 4. Percent by weight of the major prey groups consumed by Blue Catfish within each 100-mm length class (mm TL) collected from the James River during March–May 2014–2015. At 500 mm TL, Blue Catfish began to include significantly more fish in their diets (Tukey’s honestly significant difference test on ranks: P < 0.01).
Diet Composition
Blue Catfish exhibited a broad diet consisting of insects, vegetation, mollusks, crustaceans, reptiles, amphibians, fish, birds, mammals, cnidarians, and anthropogenic debris (). Smaller Blue Catfish mostly consumed vegetation, detritus, mollusks, and other invertebrates. Blue Catfish larger than 500 mm TL became more piscivorous but still fed on crustaceans, mollusks, and vegetation (). It is important to note that although Blue Catfish were far more abundant than Flathead Catfish, the Blue Catfish population primarily consisted of small individuals (≤500 mm TL), and the difference in relative abundance between Flathead Catfish and larger, piscivorous Blue Catfish (>500 mm TL) was less substantial ().
TABLE 1. Diet composition (percent by number [%N], percent by weight [%W], and percent occurrence [%O]) of prey taxa in the stomach contents of Blue Catfish (N = 1,539) sampled from the James River, Virginia, during March–May 2014–2015.
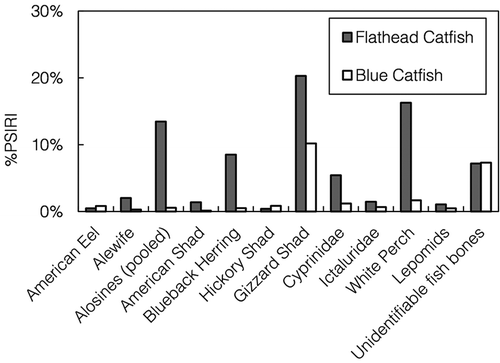
Many species of fish were consumed by Blue Catfish (), yet only a few species were consumed regularly. For the Blue Catfish population as a whole, Gizzard Shad were the dominant fish prey consumed in terms of %W and %O (). Alosines were found in 4.46% of Blue Catfish stomachs during the spring; however, these alosines consisted mostly of Hickory Shad, which were found in 1.17% of the stomachs. American Shad, Alewives, and Blueback Herring were all found in less than 1% of Blue Catfish stomachs. Blue Catfish also preyed upon American Eels, White Perch, sunfishes Lepomis spp., and members of Cyprinidae and Ictaluridae (). Although DNA barcoding did enable us to identify 27 species of fish consumed by Blue Catfish (), unidentifiable fish bones were still routinely encountered in catfish stomachs during the spring (). Larger, piscivorous Blue Catfish (>500 mm TL) consumed fish more frequently, and Gizzard Shad (33.92%) and White Perch (7.73%) were the dominant prey consumed in terms of %O (). For large Blue Catfish, the most commonly consumed Alosa species based on %O was Hickory Shad (4.99%), followed by Blueback Herring (2.99%), Alewife (2.49%), and American Shad (0.35%; ).
TABLE 2. Diet composition (percent by number [%N], percent by weight [%W], and percent occurrence [%O]) of prey taxa in the stomach contents of Blue Catfish (N = 1,539) sampled from the James River during March–May 2014–2015.
FIGURE 5. Percent by weight (%W) and percent occurrence (%O) for fish prey consumed by Flathead Catfish (upper panel) and “piscivorous” (>500-mm TL) Blue Catfish (lower panel) in the James River during March–May 2014–2015. The “alosines” category includes pooled Alewives, American Shad, Blueback Herring, and Hickory Shad.
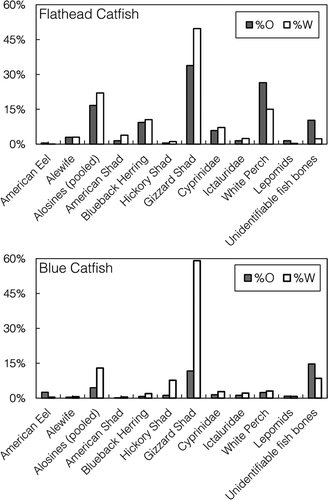
Unlike Blue Catfish, even small Flathead Catfish were exclusively piscivorous, feeding on several species of fish (). Flathead Catfish preyed heavily on Gizzard Shad, White Perch, and alosines, which were found in 16.67% of stomachs (). In contrast to Blue Catfish, for which the most commonly consumed alosine was the Hickory Shad, Flathead Catfish preyed primarily upon Blueback Herring, which were found in 9.31% of stomachs (). American Shad were found in 1.47% of Flathead Catfish stomachs, and Alewives were present in 2.94% of stomachs.
TABLE 3. Diet composition (percent by number [%N], percent by weight [%W], and percent occurrence [%O]) of prey taxa in the stomach contents of Flathead Catfish (N = 204) sampled from the James River during March–May 2014–2015.
In terms of relative importance, fish prey were generally more important in the diets of Flathead Catfish than in the diets of Blue Catfish (). We compared piscivorous sizes (>500 mm TL) of Blue Catfish to Flathead Catfish, which were exclusively piscivorous. For piscivorous Blue Catfish, Gizzard Shad were the most important fish prey consumed (PSIRI = 10.19%), whereas Flathead Catfish relied on Gizzard Shad, White Perch, and alosines, primarily Blueback Herring. The PSIRI for the four alosine species pooled was 13.46% for Flathead Catfish and only 0.56% for Blue Catfish (), further indicating major differences in the utilization of alosine prey by the two catfish species.
FIGURE 6. Prey-specific index of relative importance (%PSIRI) for fishes consumed by Blue Catfish and Flathead Catfish in the James River during March–May 2014–2015. The “alosines” category includes pooled Alewives, American Shad, Blueback Herring, and Hickory Shad.
Spatiotemporal Analysis
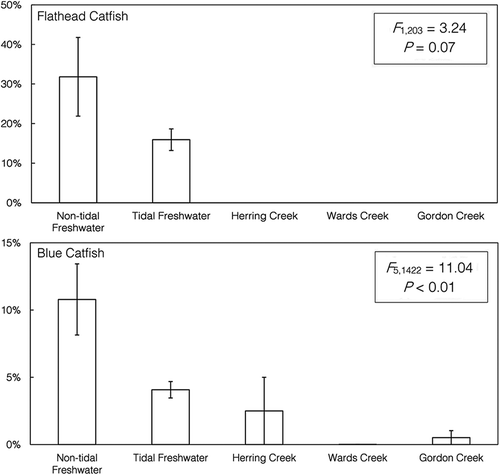
Blue Catfish were sampled at hundreds of sites within five distinct sampling areas: nontidal freshwater, tidal freshwater, Herring Creek, Wards Creek, and Gordon Creek. Due to numerous rapids and hazardous river conditions, fish from nontidal freshwater locations were sampled at dozens of sites in the pool below Bosher Dam and the pool near the Manchester Bridge (). Spatial analysis showed a significantly higher occurrence of Alosa predation (~10% occurrence) in these areas, with the majority of samples coming from the tailwaters of Bosher Dam (P < 0.01; ). The %O of Alosa spp. in the diets of Blue Catfish within Herring, Wards, and Gordon creeks and tidal freshwater areas was generally less than 5% (). Temporally, predation on alosines was not observed in March, but it peaked in April and declined in May. This likely corresponded with the pulse of alosines through our sample locations, which is driven by a variety of abiotic factors (Kissil Citation1974; Tyus Citation1974). Flathead Catfish were only regularly encountered in tidal freshwater and nontidal freshwater areas; although more Alosa predation occurred in nontidal freshwater (31.82%) than in tidal freshwater (15.93%), the difference was not significant (P = 0.07; ). A few Flathead Catfish (N = 3) were encountered in oligohaline creeks (Herring and Wards creeks), but their stomach contents did not include alosines.
FIGURE 7. Results of logistic regression used to analyze binary differences in alosine presence (1 = present; 0 = absent) in the spring diets of Flathead Catfish (upper panel) and Blue Catfish (lower panel) collected from each sampling area in the James River (note that the y-axis scale differs between panels). Error bars =SEs. A significant difference was detected for Blue Catfish, and post hoc testing revealed that Blue Catfish predation on alosines was significantly higher in nontidal freshwater areas (Tukey’s honestly significant difference test: P < 0.01).
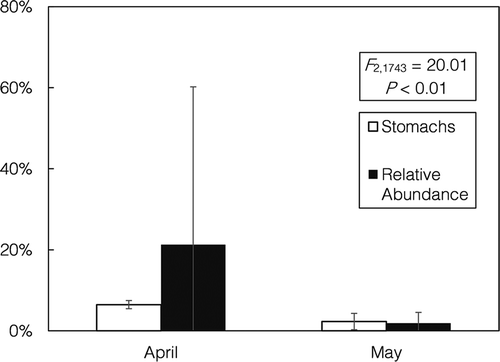
Temporal analysis revealed significant differences in predation on Alosa spp. during the spring (). Predation on alosines peaked in April and continued into May but was not detected in March. This trend generally corresponded with the relative abundance of Alosa spp. in the environment, which was highly variable but peaked at approximately 20% during April ().
FIGURE 8. Monthly percent occurrence (%O) of alosines in the diets of nonnative Blue Catfish and Flathead Catfish from the James River (stomachs) and the percentage of alosines encountered during prey abundance sampling (relative abundance). Error bars = SEs. Alosine occurrence in catfish diets was significantly higher in April than in May (logistic regression: P < 0.001); March data are omitted from the graph because no predation on alosines was observed during that month.
Fish Prey Selectivity
No conclusive selectivity patterns (based on Chesson’s α) were detected for Blue Catfish in April (). There was positive selectivity for cyprinids and White Perch, but the 95% CIs overlapped with neutral feeding. In May, Blue Catfish selectively fed on Hickory Shad, which were commonly encountered during our relative abundance sampling (). Blue Catfish also showed selective feeding on Alosa spp. (all four species pooled), river herring, and White Perch, but those patterns were inconclusive due to overlap between 95% CIs and neutral feeding (1/m). Blue Catfish selectivity for American Shad was not assessed, as American Shad were only found in one Blue Catfish stomach, and the inclusion of extremely rare prey can be problematic in selectivity studies (Confer and Moore Citation1987).
FIGURE 9. Prey selectivity (Chesson’s α) for Flathead Catfish (upper panels) and Blue Catfish (lower panels) collected from the James River during April (left column) and May (right column). The error bars = 95% confidence intervals. The dotted line represents the value 1/m, which indicates neutral selectivity; prey above the dotted line were selected, whereas prey below the line were not selected. The “alosines” category includes all four Alosa spp. pooled into one group.
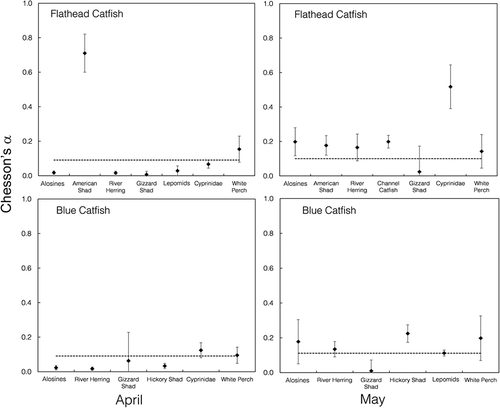
During April, Flathead Catfish selectively preyed on American Shad (). Flathead Catfish also demonstrated inconclusive selective feeding on White Perch, as 95% CIs overlapped with neutral feeding. In May, Flathead Catfish selectively preyed on Alosa spp., Channel Catfish, cyprinids, and American Shad (). There was inconclusive selectivity of river herring and White Perch due to 95% CI overlap with neutral feeding.
DISCUSSION
Blue Catfish and Flathead Catfish had differing food habits during the spring. Blue Catfish had diverse, omnivorous diets indicative of a generalist feeding strategy, whereas Flathead Catfish fed solely on piscine prey. Differences in food habits were further emphasized by the results from our cumulative prey curve analysis. Although the cumulative prey curves for both species reached sufficient asymptotes (B < 0.05), the sample size requirements for Blue Catfish were much greater, and the curve did not reach an asymptote until nearly 1,000 stomachs had been examined. It is logical that an opportunistic omnivore would have greater sample size requirements than a piscivore, as omnivores consume a much broader array of prey species. Blue Catfish diet studies with extremely limited replication have been published (e.g., MacAvoy et al. Citation2000; N = 22); however, we recommend the inclusion of cumulative prey curves to assess whether sample size is sufficient, since inadequate replication can lead to erroneous conclusions (Ferry and Cailliet Citation1996).
Flathead Catfish predation on alosines was concerning, as Alosa spp. were found in up to 30% of stomachs in certain areas. The primary alosine consumed by Flathead Catfish was Blueback Herring, which was found in nearly 10% of stomachs; Flathead Catfish also consumed American Shad and Alewives but to a lesser degree. Even small Flathead Catfish were piscivorous; this is likely mediated by their huge gape size, which is among the largest observed in any North American freshwater fish species (Slaughter and Jacobson Citation2008). Because of their voracious feeding habits, Flathead Catfish are already considered to be one of the most ecologically harmful introduced species in the United States (Fuller et al. Citation1999), and several studies have empirically demonstrated declines in native fish populations after the introduction of Flathead Catfish (Guier et al. Citation1984; Ashley and Buff Citation1988; Thomas Citation1995; Kwak et al. Citation2006).
In contrast to our observations of Flathead Catfish, we found that Blue Catfish consumed invertebrates, mollusks, crustaceans, amphibians, reptiles, birds, mammals, anthropogenic waste (including condoms, feminine products, and raw sewage), and nearly 30 taxa of fish. In Blue Catfish stomachs, Alosa spp. were only occasionally encountered, and these were primarily Hickory Shad, which are common in Virginia’s tidal rivers. Analysis of Blue Catfish dietary ontogeny revealed a significant shift to piscivory at 500 mm TL, yet even large Blue Catfish rarely consumed alosines. Alewives and Blueback Herring were found in less than 3% of the stomachs from “piscivorous” (>500-mm TL) Blue Catfish, and American Shad were found in less than 0.50% of the stomachs. Blue Catfish have incredibly diverse diets, and few selective feeding patterns emerged; thus, we would classify Blue Catfish as opportunistic omnivores. This hypothesis could explain the low occurrence of depleted alosines in Blue Catfish stomachs. If this is the case, then future Blue Catfish predation on Alosa spp. could still be a problem, as it is likely to increase if alosine populations begin to recover.
High site-specific variability in the relative abundance of prey yielded broad 95% CIs, so few conclusive selectivity patterns emerged. Blue Catfish exhibited no selectivity patterns in April, yet they began to selectively feed on Hickory Shad in May. The Hickory Shad we observed in May had already spawned and may have been weakened from the rigors of reproduction. Although other Alosa spp. would be weakened by the spawn as well, Hickory Shad were the most abundant alosine encountered—further supporting the hypothesis that Blue Catfish are opportunistic feeders. Moreover, observed predation on Hickory Shad may actually be scavenging, as alosines are susceptible to high levels of postspawn mortality (Durbin et al. Citation1979) and Blue Catfish are known to scavenge (Graham Citation1999).
Flathead Catfish displayed several selectivity patterns. They selectively consumed American Shad during April and May, although again, we were unable to discern predation events from scavenging events. It is well known, however, that Flathead Catfish prefer live prey and are less prone to scavenging than other North American ictalurids (Jackson Citation1999); thus, scavenging is unlikely. Several American Shad were found in the stomachs of Flathead Catfish, whereas American Shad were rarely encountered during our relative abundance sampling. Our selectivity analysis assumes equal capture probability among prey species, which could be problematic since American Shad are large-bodied, strong swimmers that generally occur deeper in the water column than other Alosa spp. (Waldman Citation2013), potentially making them less susceptible to electrofishing gear. If this is the case, then Flathead Catfish selectivity for American Shad may have been overestimated in our study, but the fact remains that Flathead Catfish still consumed American Shad more frequently than did Blue Catfish. Flathead Catfish also selectively preyed on cyprinids—mostly Common Carp—and Channel Catfish; neither Common Carp nor Channel Catfish are native to the James River (Jenkins and Burkhead Citation1994).
Consumption of alosines was rare in estuarine creeks but increased further upstream in tidal freshwater and nontidal freshwater areas. The James River from Bosher Dam to the bottom of the fall line is full of boulders, rapids, and remnants of old bridges and dams. This complex structure offers numerous points from which catfish can ambush their prey, and predation on alosines was significantly higher in this area than in other sampling areas. Alosine predation was particularly high in the tailwaters of Bosher Dam, located just west of Richmond, Virginia. Bosher Dam is a low-head dam that was originally constructed in 1823 and currently serves no major purpose. A vertical slot fishway was constructed at Bosher Dam in 1999, but it appears that the dam is still an obstacle to anadromous fish passage, as alosines were consumed more often at this dam and were found in approximately 10% of Blue Catfish stomachs and 32% of Flathead Catfish stomachs. Seasonally, predation on Alosa spp. peaked in April and declined in May, whereas no Alosa predation was observed in March. Given this evidence, targeted removal efforts should be focused during the period from early April through the end of May. Removal of nonindigenous catfish from big rivers is probably futile for population control (Bonvechio et al. Citation2011) and is likely to be met with opposition from special interest groups (Weller and Geihsler Citation1999), but it could still help to mitigate alosine predation in areas that become “traps” for migrating alosines. If attempted, mitigation efforts should focus on structures that act as barriers to alosine migration, as predation on Alosa spp. was highest in those areas. We realize that the term “barriers to migration” is a vague descriptor; therefore, more research will be necessary to identify these critical areas within the Chesapeake Bay if removal programs are to be attempted.
Although Blue Catfish do not appear to be “apex predators” as previously suggested (MacAvoy et al. Citation2000), introduced generalists are quite capable of replacing native species through biotic homogenization, a process that can cause major changes in community structure and ecosystem function (Olden et al. Citation2004). Generalists are so capable of replacing natives that ecologists often call them “winner” species (Layman and Allgeier Citation2011), and this recognition has sparked renewed interest in the characterization of generalist species worldwide (Bolnick et al. Citation2002; Clavel et al. Citation2010; Araújo et al. Citation2011; Loxdale et al. Citation2011). Ecological resistance to invasion is often directly proportional to native species richness, as the presence of a greater number of native species reduces the available niche space through competition (Lockwood et al. Citation2013). The incredibly omnivorous nature of Blue Catfish may make them immune to competition, as they can survive on abundant resources (e.g., detritus or vegetation). Flathead Catfish do not appear to have much competition either: Virginia’s tidal rivers lack native, large-bodied competitor species except for the Bowfin Amia calva and the Longnose Gar. Striped Bass may also compete with nonnative catfish, although the majority of the Striped Bass population is only present in the tidal freshwater portions of Virginia’s rivers during the spring, thus limiting its temporal overlap with Blue Catfish and Flathead Catfish (Walter and Austin Citation2003). Neither Bowfins nor Longnose Gars offer much competition for invading catfish. Bowfins specialize in swampy backwater habitat and only rarely occupy brackish waters (Jenkins and Burkhead Citation1994), whereas Longnose Gars feed on smaller fish like silversides (Atherinopsidae) and are generally unable to prey on fish that exceed 200 mm TL (Tyler Citation1994). Therefore, large nonnative catfish are likely the only resident fish that are capable of consuming the 300–400-mm adult Gizzard Shad that dominate the biomass of freshwater and oligohaline portions of the James River (Garman and Mitchell Citation1989). Predation can also limit the success of invasive species (Lockwood et al. Citation2013), but native fish species are unable to prey on anything but the smallest Blue Catfish or Flathead Catfish; however, these catfish are susceptible to avian predation (Glass and Watts Citation2009). Furthermore, both catfish species have locking defensive pectoral and dorsal spines, which have been demonstrated to prevent ingestion of catfish by predators (Bosher et al. Citation2006). These and other factors have likely played a role in the success of nonnative catfishes within Virginia’s tidal rivers.
Although the problems associated with introduced species are well documented, many freshwater fish introductions have had minimal ecological impacts accompanied by great societal benefits (Gozlan Citation2008). The attention Blue Catfish receive as an invasive species in Virginia waters has been the center of much controversy because the James River now hosts a nationally recognized trophy fishery that financially benefits numerous local guides and tackle shops. In addition, Blue Catfish support viable commercial fisheries in several of Virginia’s tidal rivers, and harvest has been increasing steadily since the early 2000s (Schloesser et al. Citation2011). The success of Blue Catfish in tidal rivers of Virginia has had a polarizing effect and has resulted in disagreement among stakeholders: some detest Blue Catfish, citing ecosystem changes since the species’ introduction, whereas others rely on this resource for their livelihood. It has been argued that all fish introductions should be considered “guilty until proven innocent” (Simberloff Citation2007), while other authors have insisted that conclusions about the impacts of nonnative species should be based on “quantifiable empirical evidence and not a priori statements” (Gozlan Citation2008). Here, we have demonstrated that Blue Catfish do not routinely consume migrating adult alosines during the spring, but Blue Catfish predation on alosine juveniles as they emigrate from rivers during the fall remains a concern. Moreover, there are still concerns about the impacts of Blue Catfish on native White Catfish, which have declined substantially since the introduction of Blue Catfish (Tuckey and Fabrizio Citation2010), and on blue crabs, which are among the most commercially valuable species in the Chesapeake Bay (Sharov et al. Citation2003).
Many factors have been implicated in the decline of Alosa spp. along the Atlantic coast (Bethoney et al. Citation2013), but can predation really play a role? Although correlation does not equate to causation, there was a significant statistical relationship between the relative abundance of Striped Bass and the increasing mortality of Blueback Herring and American Shad in the Connecticut River, prompting suspicion that predation was a major driver of the observed declines (Savoy and Crecco Citation2004). The Striped Bass is a large piscivore that occurs in sympatry with Alewives, Blueback Herring, and American Shad and is known to travel well above the salt wedge in large rivers to gorge on these alosines during the spring (Savoy and Crecco Citation2004; Davis and Schultz Citation2009). Moreover, the Atlantic Striped Bass population has recovered to near-historic levels (Hartman and Margraf Citation2003) and has been implicated in contributing to coastwide alosine declines (Davis and Schultz Citation2009). Our results demonstrate that Flathead Catfish routinely consume American Shad and Blueback Herring; therefore, the combined predation pressure from Flathead Catfish and Striped Bass may have a significant impact on migrating alosines in rivers where the two piscivores co-occur. Interestingly, Alosa spp. were found in 16–32% of Flathead Catfish stomachs, which is similar to the percent occurrence of river herring in the spring diets of Striped Bass occupying tidal freshwater portions of the Chesapeake Bay (~29%; Walter and Austin Citation2003).
Our study demonstrates that (1) Flathead Catfish are likely to have a greater per capita impact on alosines than Blue Catfish but (2) Blue Catfish may exert a greater overall effect due to their larger population sizes. However, population estimates are needed to permit these comparisons. Blue Catfish are generally more abundant than Flathead Catfish, but the Blue Catfish population is largely comprised of small, nonpiscivorous individuals. Length frequency histograms from this study indicate that differences between the relative abundance of Flathead Catfish and piscivorous (>500 mm TL) Blue Catfish are considerably less substantial. Thus, Flathead Catfish—at least within the freshwater and tidal freshwater portions of the James River—are exerting a greater impact on native fish species than previously anticipated.
Alosine populations crashed long before nonnative catfishes became established in Virginia’s tidal rivers (Bethoney et al. Citation2013), so it is unlikely that the catfishes are major contributors to these declines. Instead, alosine populations are likely driven by a combination of several problems, including degraded spawning habit, obstacles to fish passage, and increasing predation by piscivores (ASMFC Citation2012; Brown et al. Citation2013; Bethoney et al. Citation2014). Moreover, the bycatch of river herring and American Shad within offshore fisheries may be extreme and is believed to be hindering restoration efforts for these species (Bethoney et al. Citation2013; Hasselman et al. Citation2016). Striped Bass stocks have increased substantially since the 1980s (Richards and Rago Citation1999); therefore, we also recommend a re-evaluation of the spring diets of Striped Bass in Virginia’s tidal rivers, as declining alosine abundance may be driven by the composite effect of increasing native and nonnative predator biomass.
Our findings provide valuable insight into the interactions between introduced catfishes and Alosa spp., but descriptions of Blue Catfish and Flathead Catfish diets across broad spatiotemporal scales within the Chesapeake Bay are needed. Furthermore, we cannot quantify population-level consumption without credible estimates of population size and length structure for both catfish species, although estimates of Blue Catfish density (fish/ha) have been generated for Powell Creek, an oligohaline tributary of the James River (Aaron Bunch, Virginia Department of Game and Inland Fisheries, personal communication). Flathead Catfish density within the tidal freshwater portion of the James River has also been estimated (Jason Emmel, Virginia Tech, personal communication). Flathead Catfish populations should be monitored closely because future expansion within the York River is inevitable, and piscivorous Flathead Catfish are known to cause major declines in native fish biomass.
We have provided the first published description of the diet for introduced Flathead Catfish within the Chesapeake Bay; this is particularly important because Flathead Catfish are well known as dangerous invaders (Fuller et al. Citation1999) and future expansion of the species is likely (Brown et al. Citation2005). The present study also represents the first focused description of alosine predation by nonnative catfishes during the spring, a period when marine nutrient inputs from Alosa spp. restructure the food web within Virginia’s tidal rivers (MacAvoy et al. Citation2000). Our estimates of alosine predation have widespread implications, since Blue Catfish and Flathead Catfish have been introduced into many Atlantic slope drainages from Pennsylvania to Florida (Graham Citation1999; Jackson Citation1999), and many of these rivers support spawning populations of alosines (Schmidt et al. Citation2003; Ray and Robins Citation2016). Although river-specific estimates of alosine predation by introduced catfishes will be useful in the future, estimates from this study can be applied to other Atlantic slope rivers in the interim. Our findings can be used in the construction of ecosystem models and subsequent ecosystem-based management recommendations (Pauly et al. Citation2000; Harvey et al. Citation2003), thereby facilitating the future management of nonindigenous Blue Catfish and Flathead Catfish in Atlantic drainages.
ACKNOWLEDGMENTS
This project would have been impossible without assistance from the following: Michael Moore, Hunter Hatcher, and Hae Kim reviewed and commented on previous drafts of the manuscript; the anonymous reviewers supplied comments and insights that improved the manuscript; Bob Greenlee and Yan Jiao provided guidance and assistance during ongoing nonnative catfish research; the Smithsonian Institution, particularly Rob Aguilar and Matt Ogburn, assisted with the use of advanced molecular techniques to identify digested piscine prey; Robbie Willis, Kirk Dunn, Kaylie Johnson, and Alan Weaver helped with the collection of stomachs; and Allison Mosley, Hae Kim, and John Woodward spent hours of effort in the laboratory and sorted through thousands of bags of rancid stomach contents. Data collection for this project was funded by the Virginia Department of Game and Inland Fisheries through a Federal Aid in Sport Fish Restoration Grant from the U.S. Fish and Wildlife Service. Student support and publication fees were provided by a graduate student research fellowship from Virginia Sea Grant.
Related Research Data
References
- Araújo, M. S., D. I. Bolnick, and C. A. Layman. 2011. The ecological causes of individual specialisation. Ecology Letters 14:948–958.
- Ashley, K. W., and B. Buff. 1988. Food habits of Flathead Catfish in the Cape Fear River, North Carolina. Proceedings of the Annual Conference Southeastern Association of Fish and Wildlife Agencies 41(1987):93–99.
- ASMFC (Atlantic States Marine Fisheries Commission). 2012. River herring benchmark assessment: volume I. ASMFC, Stock Assessment Report 12-02, Washington, D.C.
- Aunins, A., and J. E. Onley. 2009. Migration and spawning of American Shad in the James River, Virginia. Transactions of the American Fisheries Society 138:1392–1404.
- Baumann, J. R., and T. J. Kwak. 2011. Trophic relations of introduced Flathead Catfish in an Atlantic river. Transactions of the American Fisheries Society 140:1120–1134.
- Bethoney, N. D., B. P. Schondelmeier, K. D. Stokesbury, and W. S. Hoffman. 2013. Developing a fine scale system to address river herring (Alosa pseudoharengus, A. aestivalis) and American Shad (A. sapidissima) bycatch in the U.S. Northwest Atlantic mid-water trawl fishery. Fisheries Research 141:79–87.
- Bethoney, N. D., K. D. Stokesbury, B. P. Schondelmeier, W. S. Hoffman, and M. P. Armstrong. 2014. Characterization of river herring bycatch in the northwest Atlantic midwater trawl fisheries. North American Journal of Fisheries Management 34:828–838.
- Bigg, M. A., and M. A. Perez. 1985. Modified volume: a frequency-volume method to assess marine mammal food habits. Pages 277–283 in J. R. Beddington, R. J. H. Beverton, and D. M. Lavigne, editors. Marine mammals and fisheries. George Allen and Unwin, London.
- Bizzarro, J. J., H. J. Robinson, C. S. Rinewalt, and D. A. Ebert. 2007. Comparative feeding ecology of four sympatric skate species off central California, USA. Environmental Biology of Fishes 80:197–220.
- Bodine, K. A., and D. E. Shoup. 2010. Capture efficiency of Blue Catfish electrofishing and the effects of temperature, habitat, and reservoir location on electrofishing-derived length structure indices and relative abundance. North American Journal of Fisheries Management 30:613–621.
- Boesch, D. F., R. B. Brinsfield, and R. E. Magnien. 2001. Chesapeake Bay eutrophication. Journal of Environmental Quality 30:303–320.
- Bolnick, D. I., L. H. Yang, J. A. Fordyce, J. M. Davis, and R. Svanbäck. 2002. Measuring individual-level resource specialization. Ecology 83:2936–2941.
- Bonvechio, T. F., M. S. Allen, D. Gwinn, and J. S. Mitchell. 2011. Impacts of electrofishing removals on the introduced Flathead Catfish population in the Satilla River, Georgia. Pages 395–407 in P. H. Michaletz and V. H. Travnichek, editors. Conservation, ecology, and management of catfish: the second international symposium. American Fisheries Society, Symposium 77, Bethesda, Maryland.
- Bosher, B. T., S. H. Newton, and M. L. Fine. 2006. The spines of the Channel Catfish, Ictalurus punctatus, as an antipredator adaptation: an experimental study. Ethology 112:188–195.
- Bowen, S. H. 1996. Quantitative description of the diet. Pages 513–532 in B. R. Murphy and D. W. Willis, editors. Fisheries techniques, 3rd edition. American Fisheries Society, Bethesda, Maryland.
- Bringolf, R. B., T. J. Kwak, W. G. Cope, and M. S. Larimore. 2005. Salinity tolerance of Flathead Catfish: implications for dispersal of introduced populations. Transactions of the American Fisheries Society 134:927–936.
- Brown, J. J., K. E. Limburg, J. R. Waldman, K. Stephenson, E. P. Glenn, F. Juanes, and A. Jordaan. 2013. Fish and hydropower on the U.S. Atlantic coast: failed fisheries policies from half‐way technologies. Conservation Letters 6:280–286.
- Brown, J. J., J. Perillo, T. J. Kwak, and R. J. Horwitz. 2005. Implications of Pylodictis olivaris (Flathead Catfish) introduction into the Delaware and Susquehanna drainages. Northeastern Naturalist 12:473–484.
- Brown, S. C., J. J. Bizzarro, G. M. Cailliet, and D. A. Ebert. 2012. Breaking with tradition: redefining measures for diet description with a case study of the Aleutian Skate Bathyraja aleutica (Gilbert 1896). Environmental Biology of Fishes 95:3–20.
- Carreon-Martinez, L., T. Johnson, S. Ludsin, and D. Heath. 2011. Utilization of stomach content DNA to determine diet diversity in piscivorous fishes. Journal of Fish Biology 78:1170–1182.
- Chesson, J. 1978. Measuring preference in selective predation. Ecology 58:211–215.
- Chipps, S. R., and J. E. Garvey. 2007. Assessment of food habits and feeding patterns. Pages 473–514 in C. S. Guy and M. L. Brown, editors. Analysis and interpretation of freshwater fisheries data. American Fisheries Society, Bethesda, Maryland.
- Clavel, J., R. Julliard, and V. Devictor. 2010. Worldwide decline of specialist species: toward a global functional homogenization? Frontiers in Ecology and the Environment 9:222–228.
- Confer, J. L., and M. V. Moore. 1987. Interpreting selectivity indices calculated from field data or conditions of prey replacement. Canadian Journal of Fisheries and Aquatic Sciences 44:1529–1533.
- Conover, W. J., and R. L. Iman. 1981. Rank transformations as a bridge between parametric and nonparametric statistics. American Statistician 35:124–129.
- Cortes, E. 1997. A critical review of methods of studying fish feeding based on analysis of stomach contents: application to elasmobranch fishes. Canadian Journal of Fisheries and Aquatic Sciences 54:726–738.
- Davis, J. P., and E. T. Schultz. 2009. Temporal shifts in demography and life history of an anadromous Alewife population in Connecticut. Marine and Coastal Fisheries: Dynamics, Management, and Ecosystem Science [online serial] 1:90–106.
- Dunn, M. R., A. Szabo, M. S. McVeagh, and P. J. Smith. 2010. The diet of deepwater sharks and the benefits of using DNA identification of prey. Deep Sea Research Part 1: Oceanographic Research Papers 57:923–930.
- Durbin, A., S. Nixon, and C. Oviatt. 1979. Effects of the spawning migration of the Alewife, Alosa pseudoharengus, on freshwater ecosystems. Ecology 60:8–17.
- Edds, D., W. Matthews, and F. Gelwick. 2002. Resource use by large catfishes in a reservoir: is there evidence for interactive segregation and innate differences? Journal of Fish Biology 60:739–750.
- Edwards, M. R., D. L. Combs, S. B. Cook, and M. Allen. 2003. Comparison of single-pass electrofishing to depletion sampling for surveying fish assemblages in small warmwater streams. Journal of Freshwater Ecology 18:625–634.
- Eggleton, M. A., and H. L. Schramm Jr. 2004. Feeding ecology and energetic relationships with habitat of Blue Catfish, Ictalurus furcatus, and Flathead Catfish, Pylodictis olivaris, in the lower Mississippi River, USA. Environmental Biology of Fishes 70:107–121.
- Ferry, L., and G. Cailliet. 1996. Sample size and data analysis: are we characterizing and comparing diet properly? Gutshop 96:71–80.
- Folkerts, G. W. 1999. State and fate of the world’s aquatic fauna. Pages 1–16 in G. W. Benz and D. E. Collins, editors. Aquatic fauna in peril: the southeastern perspective. Southeastern Aquatic Research Institute, Special Publication Number 1, Decatur, Georgia.
- Fuller, P. L., L. G. Nico, and J. D. Williams. 1999. Nonindigenous fishes introduced into inland waters of the United States. American Fisheries Society, Special Publication 27, Bethesda, Maryland.
- Garman, G. C., and D. Mitchell. 1989. Relative abundance and species composition of anadromous fish at selected James and Rappahannock River sites: final report of the first year of biological monitoring to assess initial attempts to re-establish fish passage for migratory fishes in the James and Rappahannock rivers. Virginia Council on the Environment, Richmond.
- Garman, G. C., and L. A. Nielsen. 1992. Medium-sized rivers of the Atlantic slope. Pages 315–349 in C. Hackney, editor. Biotic diversity of the southeastern United States. Wiley-Interscience, New York.
- Glass, K. A., and B. D. Watts. 2009. Osprey diet composition and quality in high- and low-salinity areas of lower Chesapeake Bay. Journal of Raptor Research 43:27–36.
- Goodnight, J. H. 1982. The GLM procedure. Pages 139–200 in J. H. Goodnight, J. P. Sall, and W. S. Sarle, editors. SAS user’s guide: statistics. SAS Institute, Cary, North Carolina.
- Gozlan, R. E. 2008. Introduction of non-native freshwater fish: is it all bad? Fish and Fisheries 9:106–115.
- Graham, K. 1999. A review of the biology and management of Blue Catfish. Pages 37–49 in E. R. Irwin, W. A. Hubert, C. F. Rabeni, H. L. Schramm Jr., and T. Coon, editors. Catfish 2000: proceedings of the international ictalurid symposium. American Fisheries Society, Symposium 24, Bethesda, Maryland.
- Greenlee, R. S., and C. N. Lim. 2011. Searching for equilibrium: population parameters and variable recruitment in introduced Blue Catfish populations in four Virginia tidal river systems. Pages 349–367 in P. H. Michaletz and V. H. Travnichek, editors. Conservation, ecology, and management of catfish: the second international symposium. American Fisheries Society, Symposium 77, Bethesda, Maryland.
- Guier, R. C., L. E. Nichols, and R. T. Rachels. 1984. Biological investigation of Flathead Catfish in the Cape Fear River. Proceedings of the Annual Conference Southeastern Association of Fish and Wildlife Agencies 35:607–621.
- Hall, C. J., A. Jordaan, and M. G. Frisk. 2012. Centuries of anadromous forage fish loss: consequences for ecosystem connectivity and productivity. BioScience 62:723–731.
- Haro, A., W. Richkus, K. Whalen, A. Hoar, W.-D. Busch, S. Lary, T. Brush, and D. Dixon. 2000. Population decline of the American Eel: implications for research and management. Fisheries 25(9):7–16.
- Harris, S. A., and J. L. Jones. 2008. Fish consumption and PCB-associated health risks in recreational fishermen on the James River, Virginia. Environmental Research 107:254–263.
- Hartman, K. J., and F. J. Margraf. 2003. U.S. Atlantic coast Striped Bass: issues with a recovered population. Fisheries Management and Ecology 10:309–312.
- Harvey, C. J., S. P. Cox, T. E. Essington, S. Hansson, and J. F. Kitchell. 2003. An ecosystem model of food web and fisheries interactions in the Baltic Sea. ICES Journal of Marine Science 60:939–950.
- Hasselman, D. J., E. C. Anderson, E. E. Argo, D. Bethoney, S. R. Gephard, D. M. Post, B. P. Schondelmeier, T. F. Schultz, T. V. Willis, and E. P. Palkovacs. 2016. Genetic stock composition of marine bycatch reveals disproportional impacts on depleted river herring genetic stocks. Canadian Journal of Fisheries and Aquatic Sciences 73:951–963.
- Hasselman, D. J., and K. E. Limburg. 2012. Alosine restoration in the 21st century: challenging the status quo. Marine and Coastal Fisheries: Dynamics, Management, and Ecosystem Science [online serial] 4:174–187.
- Herndon, T. M. Jr., and C. T. Waters. 2002. Flathead Catfish diet analysis, stock assessment, and effects of removal on Sutton Lake, North Carolina. Proceedings of the Annual Conference Southeastern Association of Fish and Wildlife Agencies 54(2000):70–79.
- Hewitt, A., J. Ellis, and M. C. Fabrizio. 2009. Fisheries of the York River system. Journal of Coastal Research 57:99–110.
- Hilton, E. J., R. Latour, B. Watkins, and A. Rhea. 2011. Monitoring relative abundance of American Shad in Virginia rivers. Annual Report to the Virginia Marine Resources Commission, Project F-116-R-8, Newport News.
- Hyslop, E. 1980. Stomach contents analysis—a review of methods and their application. Journal of Fish Biology 17:411–429.
- Ivanova, N. V., T. S. Zemlak, R. H. Hanner, and P. D. Herbert. 2007. Universal primer cocktails for fish DNA barcoding. Molecular Ecology Notes 7:544–548.
- Ivlev, V. S. 1961. Experimental ecology of feeding of fish. Yale University Press, New Haven, Connecticut.
- Jackson, D. C. 1999. Flathead Catfish: biology, fisheries, and management. Pages 23–36 in E. R. Irwin, W. A. Hubert, C. F. Rabeni, H. L. Schramm Jr., and T. Coon, editors. Catfish 2000: proceedings of the international ictalurid symposium. American Fisheries Society, Symposium 24, Bethesda, Maryland.
- Jelks, H. L., S. J. Walsh, N. M. Burkhead, S. Contreras-Balderas, E. Diaz-Pardo, D. A. Hendrickson, J. Lyons, N. E. Mandrak, F. McCormick, J. S. Nelson, S. P. Platania, B. A. Porter, C. B. Renaud, J. J. Schmitter-Soto, E. B. Taylor, and M. L. Warren Jr. 2008. Conservation status of imperiled North American freshwater and diadromous fishes. Fisheries 33:372–407.
- Jenkins, R. E., and N. M. Burkhead. 1994. Freshwater fishes of Virginia. American Fisheries Society, Bethesda, Maryland.
- Juanes, F., J. A. Buckel, and F. S. Scharf. 2001. Predatory behaviour and selectivity of a primary piscivore: comparison of fish and nonfish prey. Marine Ecology Progress Series 217:157–165.
- Justus, B. 1994. Observations on electrofishing techniques for three catfish species in Mississippi. Proceedings of the Annual Conference Southeastern Association of Fish and Wildlife Agencies 48:524–532.
- Kemp, W. M., W. R. Boynton, J. E. Adolf, D. F. Boesch, W. C. Boicourt, G. Brush, and L. W. Harding. 2005. Eutrophication of Chesapeake Bay: historical trends and ecological interactions. Marine Ecology Progress Series 303:1–29.
- Kissil, G. W. 1974. Spawning of the anadromous Alewife, Alosa pseudoharengus, in Bride Lake, Connecticut. Transactions of the American Fisheries Society 103:312–317.
- Kwak, T. J., W. E. Pine III, and D. S. Waters. 2006. Age, growth, and mortality of introduced Flathead Catfish in Atlantic rivers and a review of other populations. North American Journal of Fisheries Management 26:73–87.
- Layman, C. A., and J. E. Allgeier. 2011. Characterizing trophic ecology of generalist consumers: a case study of the invasive Lionfish in the Bahamas. Marine Ecology Progress Series 448:131–141.
- Light, T., and M. P. Marchetti. 2007. Distinguishing between invasions and habitat changes as drivers of diversity loss among California’s freshwater fishes. Conservation Biology 21:434–446.
- Limburg, K. E., and J. R. Waldman. 2009. Dramatic declines in North Atlantic diadromous fishes. BioScience 59:955–965.
- Link, J. S. 2004. A general model of selectivity for fish feeding: a rank proportion algorithm. Transactions of the American Fisheries Society 133:655–673.
- Lipcius, R. N., and W. T. Stockhausen. 2002. Concurrent decline of the spawning stock, recruitment, larval abundance, and size of the blue crab Callinectes sapidus in Chesapeake Bay. Marine Ecology Progress Series 226:45–61.
- Lockwood, J. L., M. F. Hoopes, and M. P. Marchetti. 2013. Invasion ecology. Wiley, Hoboken, New Jersey.
- Loxdale, H. D., G. Lushai, and J. A. Harvey. 2011. The evolutionary improbability of “generalism” in nature, with special reference to insects. Biological Journal of the Linnean Society 103:1–18.
- MacAvoy, S., S. Macko, S. McIninch, and G. Garman. 2000. Marine nutrient contributions to freshwater apex predators. Oecologia 122:568–573.
- Macdonald, J. S., and R. H. Green. 1983. Redundancy of variables used to describe importance of prey species in fish diets. Canadian Journal of Fisheries and Aquatic Sciences 40:635–637.
- MacDougall, A. S., and R. Turkington. 2005. Are invasive species the drivers or passengers of change in degraded ecosystems? Ecology 86:42–55.
- Moran, Z., D. J. Orth, J. D. Schmitt, E. M. Hallerman, and R. Aguilar. 2015. Effectiveness of DNA barcoding for identifying piscine prey items in stomach contents of piscivorous catfishes. Environmental Biology of Fishes 99:161–167.
- Moyle, P. B., and T. Light. 1996. Biological invasions of fresh water: empirical rules and assembly theory. Biological Conservation 78:149–161.
- Olden, J. D., N. L. Poff, M. R. Douglas, M. E. Douglas, and K. D. Fausch. 2004. Ecological and evolutionary consequences of biotic homogenization. Trends in Ecology and Evolution 19:18–24.
- Orrell, T. M., and L. Weigt. 2005. The Northern Snakehead Channa argus (Anabantomorpha: Channidae), a non-indigenous fish species in the Potomac River, USA. Proceedings of the Biological Society of Washington 118:407–415.
- Ortaz, M., P. B. Von Bach, and R. Candia. 2006. The diet of the neotropical insectivorous fish Creagrutus bolivari (Pisces: Characidae) according to the “graphic” and “relative importance” methods. Revista de Biologia Tropical 54:1227–1239.
- Pauly, D., V. Christensen, and C. Walters. 2000. Ecopath, ecosim, and ecospace as tools for evaluating ecosystem impact of fisheries. ICES Journal of Marine Science 57:697–706.
- Peng, C. Y. J., K. L. Lee, and G. M. Ingersoll. 2002. An introduction to logistic regression analysis and reporting. Journal of Educational Research 96:3–14.
- Perry, W. G. Jr. 1969. Food habits of Blue and Channel catfish collected from a brackish-water habitat. Progressive Fish-Culturist 31:47–50.
- Peterson, J. T., R. F. Thurow, and J. W. Guzevich. 2004. An evaluation of multipass electrofishing for estimating the abundance of stream-dwelling salmonids. Transactions of the American Fisheries Society 133:462–475.
- Pine, W. E. III, T. J. Kwak, and J. A. Rice. 2007. Modeling management scenarios and the effects of an introduced apex predator on a coastal riverine fish community. Transactions of the American Fisheries Society 136:105–120.
- Pine, W. E. III, T. J. Kwak, D. S. Waters, and J. A. Rice. 2005. Diet selectivity of introduced Flathead Catfish in coastal rivers. Transactions of the American Fisheries Society 134:901–909.
- Pinkas, L., M. S. Oliphant, and L. K. Iverson. 1971. Food habits of Albacore, Bluefin Tuna, and Bonito in California waters. California Department of Fish and Game Fisheries Bulletin 152:1–105.
- Ray, C., and C. R. Robins. 2016. A field guide to Atlantic coast fishes: North America. Houghton Mifflin Harcourt, Boston.
- Richards, R. A., and P. J. Rago. 1999. A case history of effective fishery management: Chesapeake Bay Striped Bass. North American Journal of Fisheries Management 19:356–375.
- Rothschild, B. J., J. S. Ault, P. Goulletquer, and M. Heral. 1994. Decline of the Chesapeake Bay oyster population: a century of habitat destruction and overfishing. Marine Ecology Progress Series 111:29–39.
- Savoy, T. F., and V. A. Crecco. 2004. Factors affecting the recent decline of Blueback Herring and American Shad in the Connecticut River. American Fisheries Society Monograph 9:361–377.
- Schloesser, R. W., M. C. Fabrizio, R. J. Latour, G. C. Garman, B. Greenlee, M. Groves, and J. Gartland. 2011. Ecological role of Blue Catfish in Chesapeake Bay communities and implications for management. Pages 369–382 in P. H. Michaletz and V. H. Travnichek, editors. Conservation, ecology, and management of catfish: the second international symposium. American Fisheries Society, Symposium 77, Bethesda, Maryland.
- Schmidt, R. E., B. M. Jessop, and J. E. Hightower. 2003. Status of river herring stocks in large rivers. Pages 171–182 in K. E. Limburg and J. R. Waldman, editors. Biodiversity, status, and conservation of the world’s shads. American Fisheries Society Symposium 35, Bethesda, Maryland.
- Sharov, A. F., J. H. Vølstad, G. R. Davis, B. K. Davis, R. N. Lipcius, and M. M. Montane. 2003. Abundance and exploitation rate of the blue crab (Callinectes sapidus) in Chesapeake Bay. Bulletin of Marine Science 72:543–565.
- Simberloff, D. 2007. Given the stakes, our modus operandi in dealing with invasive species should be “guilty until proven innocent.” Conservation Magazine 8:18–19.
- Slaughter, J. E. IV, and B. Jacobson. 2008. Gape: body size relationship of Flathead Catfish. North American Journal of Fisheries Management 28:198–202.
- Smith, T. I. 1985. The fishery, biology, and management of Atlantic Sturgeon, Acipenser oxyrinchus, in North America. Environmental Biology of Fishes 14:61–72.
- Thomas, M. E. 1995. Monitoring the effects of introduced Flathead Catfish on sport fish populations in the Altamaha River, Georgia. Proceedings of the Annual Conference Southeastern Association of Fish and Wildlife Agencies 47:531–538.
- Tuckey, T. D., and M. C. Fabrizio. 2010. Estimating relative juvenile abundance of ecologically important finfish in the Virginia portion of Chesapeake Bay. Annual Report to the Virginia Marine Resources Commission, Project F-104-R-14, Virginia Institute of Marine Science, Gloucester Point.
- Tyler, J. D. 1994. Food habits, sex ratios, and size of Longnose Gar in southwestern Oklahoma. Proceedings of the Oklahoma Academy of Science 74:41–42.
- Tyus, H. M. 1974. Movements and spawning of anadromous Alewives, Alosa pseudoharengus (Wilson) at Lake Mattamuskeet, North Carolina. Transactions of the American Fisheries Society 103:392–396.
- Waldman, J. R. 2013. Running silver: restoring Atlantic rivers and their great fish migrations. Rowman and Littlefield, Lanham, Maryland.
- Walter, J. F. III, and H. M. Austin. 2003. Diet composition of large Striped Bass (Morone saxatilis) in Chesapeake Bay. U.S. National Marine Fisheries Service Fishery Bulletin 101:414–423.
- Warton, D. I., and F. K. Hui. 2011. The arcsine is asinine: the analysis of proportions in ecology. Ecology 92:3–10.
- Waters, D. S., T. J. Kwak, J. B. Arnott, and W. E. Pine. 2004. Evaluation of stomach tubes and gastric lavage for sampling diets from Blue Catfish and Flathead Catfish. North American Journal of Fisheries Management 24:258–261.
- Weller, R. R., and M. R. Geihsler. 1999. Angler attitudes concerning the management of introduced Flathead Catfish in the Altamaha River system, Georgia. Pages 435–442 in E. R. Irwin, W. A. Hubert, C. F. Rabeni, H. L. Schramm Jr., and T. Coon, editors. Catfish 2000: proceedings of the international ictalurid symposium. American Fisheries Society, Symposium 24, Bethesda, Maryland.
- Zar, J. H. 1999. Biostatistical analysis. Pearson Education, New Delhi, India.