
Abstract
This study estimated the impact of fishing exploitation and climate change on the stock of Grey Mullet (known as Striped Mullet in North America) Mugil cephalus in the Taiwan Strait. Cohort analysis was employed to estimate the population abundance and instantaneous rate of fishing mortality by age of Grey Mullet in the Taiwan Strait. The instantaneous rate of natural mortality (M) was varied to 0.50, 0.75, 1.00, 1.25, and 1.50 times the estimated M to conduct a sensitivity analysis of varying M on correlation coefficients on other factors. Since 1986, the annual catches have sharply dropped and remained at a very low level despite high fishing intensity, indicating that overfishing has occurred since the 1980s. The population of the age-group 4 years and older has decreased since 1986, reaching 20,000 individuals in 2004, which is only 1% of what the population was in 1981. The overexploitation of Grey Mullet reduced its biomass, and environmental changes during the past two decades are likely to have driven the stock to consecutive years of poor recruitment, causing its current low level in the Taiwan Strait. We also observed that the recruitment population of Grey Mullet was influenced by the Pacific Decadal Oscillation, with the lag in its influence changing from 2–3 years from the time period of 1958–1985 to 0–2 years after 1986. In addition, sea surface temperature anomalies have shown a significant time lag of a 0–2-year effect since 1986. Overexploitation of the Grey Mullet population after the 1980s suggested an increased sensitivity to short-term environmental changes.
Received October 13, 2016; accepted March 30, 2017
The Grey Mullet (known as Striped Mullet in North America) Mugil cephalus is distributed in tropical, subtropical, and temperate coastal zones at latitudes from 42°N to 42°S (Thomson Citation1963). The Grey Mullet occupies a wide variety of marine, estuarine, and freshwater environments but spawns in the sea (Whitfield et al. Citation2012). The main migration by adult Grey Mullet usually occurs during the breeding season in different parts of the world, with spawning migrations corresponding to movement of mature adults from their coastal feeding areas to the open sea (Whitfield et al. Citation2012). The Grey Mullet is one of the most valuable commercial species in the coastal fisheries of Taiwan, and the demand for fish roe elevated the status of Grey Mullet to such an extent that it is colloquially called “grey gold” by fishermen (Hung and Shaw Citation2006). The number of Grey Mullet caught by purse seiners was 2.28 million in 1980, but catch decreased to only 100,000 after 2000 in the coastal fisheries of Taiwan (). The declining population of Grey Mullet has caused fishermen to attempt to reduce personnel expenses and production costs. Therefore, fishermen gradually changed their fishing equipment from purse seines to drift gill nets and trail nets (, ), and after 2003 purse seines were totally replaced by other fishing gear for catching Grey Mullet.
FIGURE 1. Annual trends of the (a) total catch and (b) percentage of Grey Mullet caught using purse seiners, gill nets, trail nets, and set nets and (c) the effort and CPUE of Grey Mullet caught using purse seiners in the Taiwan Strait.
The Grey Mullet that is fished in the coastal fisheries of Taiwan in winter belongs to the M. cephalus species of the northwestern Pacific Ocean, and its distributional range is mainly in the North China Coastal Current (NCCC) oceanographic system (Shen et al. Citation2011). The feeding grounds of juvenile and adult Grey Mullet belonging to the NCCC are located in the coastal and estuarine waters of China (Tung Citation1981; Huang and Su Citation1986). Mature Grey Mullet (at the age of 2–4 years) migrate to the coastal waters of the southeastern Taiwan Strait to spawn along the cold NCCC in wintertime. The decreased catch of Grey Mullet in the Taiwan Strait might be caused by climatic effects (e.g., the Pacific Decadal Oscillation [PDO] or the Oceanic Niño Index [ONI]; Lan et al. Citation2014). The increase in sea surface temperature associated with global warming is another major factor that has reduced the catch in Taiwan (Whitfield et al. Citation2012; Lan et al. Citation2014). The fishing grounds of the Grey Mullet were found to shift to the north of the Taiwan Strait because of the changes in the sea surface temperature (Lan et al. Citation2014).
In addition, overfishing may be another reason for the decline in the annual catch in the 1980s (Tung Citation1981; Huang et al. Citation2005). However, the biomass and recruitment of Grey Mullet stock in the Taiwan Strait have not been examined. Previous work explored the fishing mortality and population of Grey Mullet from 1977 to 1986 (Huang Citation1989). However, the stock size of Grey Mullet was still unclear after 1986, especially since the catches rapidly declined at that time. There is therefore an urgent need to more clearly understand the stock size of Grey Mullet in the Taiwan Strait. The main purpose of this study was to estimate the exploitable stock biomass and recruitment of Grey Mullet in the Taiwan Strait, to ascertain whether overfishing poses a critical threat for the Grey Mullet stock, and to determine whether the climate variability and rising sea surface temperature caused by global warming have an impact on the migration and catch rates of Grey Mullet. The influence of climate on the long-term variability in the stock biomass and recruitment of Grey Mullet was examined to clarify the effects of fishing pressure and climate variability.
METHODS
Estimation of population and instantaneous rate of fishing mortality.—Annual catches of Grey Mullet, expressed as the number of individual fish by age, were collected from the Fisheries Research Institute, Council of Agriculture of Taiwan, from 1958 to 2004. The annual catch per unit effort (CPUE) was calculated as the number of fish captured per vessel on each fishing day (fish/vessel/d). To estimate the parameters of the von Bertalanffy growth equation (von Bertalanffy Citation1938), mean values of total length by age (Su et al. Citation2002; Huang et al. Citation2005) were used (). The instantaneous rate of natural mortality was estimated using equation (1) as follows (Zhang and Megrey Citation2006):
TABLE 1. Length–age composition data of Grey Mullet in the Taiwan Strait.
where M is the instantaneous rate of natural mortality and β is a parameter of the length–weight relationship for the period 1979 to 1981 (Hwang Citation1982). In addition, , where
is 0.302 for pelagic fish and 0.440 for demersal fish. The parameter
is the observed maximum age and K and
are parameters of the von Bertalanffy growth equation (). The instantaneous rate of natural mortality was estimated to be 0.428/year.
TABLE 2. Input parameters used for estimating the instantaneous rate of natural mortality for Grey Mullet in the Taiwan Strait.
A Cohort analysis (Pope Citation1972) was employed to estimate the population and the instantaneous rate of fishing mortality (F) by age of Grey Mullet in the Taiwan Strait from 1958 to 2004. The equation for estimating the population is expressed as follows:
The populations of the final year and individuals of the oldest age were estimated using equation (3):
where is the population of age j in year i,
is the catch number of age j in year i,
is the instantaneous rate of fishing mortality of age j in year i, and M is the instantaneous rate of natural mortality. Because the exploited part of the fish population after tc (age at first capture) is considered, M is assumed to be constant (Gulland Citation1988). Also M was varied to 0.50, 0.75, 1.00, 1.25, and 1.50 times of the estimated M to conduct a sensitivity analysis of varying M on regression coefficients and correlation coefficients on other factors.
In this study, the age structure was assumed to be constant from 2000 to 2004, and the instantaneous rate of total mortality (Z) was estimated by employing the catch-curve method (Baranov Citation1918) using the average age composition for the period. The instantaneous rate of fishing mortality by age of the previous years and ages was estimated by subtracting M from Z, as expressed in equation (4):
The data for the observed total catch number were available for all years, but data on age composition were not available for some years, namely 1965, 1969–1971, 1982–1983, 1985–1988, and 1990–1994. These missing age compositions data were obtained from the mean values of neighboring years and were assigned a recruitment age of 3 years for examining recruitment trends.
Calibration of the instantaneous rate of fishing mortality.—To estimate the population by age for the period, a constant terminal F was used for the final year and the oldest fish with data from 2000 to 2004. Therefore, calibrating F by age and year was necessary. To calibrate F by age, the mean F-values at ages from 1958 to 2003 were estimated and then obtained. Subsequently, F was calibrated using equation (5) to revise F-values, and population and F-values were then estimated using equations (2)–(4) again.
where is the revised F at a specific age,
is the mean value of the instantaneous rate of fishing mortality at age j, and
is the mean value of the entire
.
Calibration of F by year was conducted using equation (6) to compare the ratio of each mean F-value by year with the base F-value in 2004, which had already been revised. The new F-values and population were then estimated using equations (2)–(4) again.
where is the revised F by age and year,
is the mean F-value in year i, and
is the revised mean F-value at the age in 2004.
Long-term correlations between the climatic indices and Grey Mullet populations.—The fishing season begins in the middle of November and continues until February of the following year, and this time frame was used to calculate the annual catch of the year. The fish population behaves as an environmental filter, and its modification through exploitation constitutes the main pathway through which the effects of fisheries interact with the climate (Planque et al. Citation2010). To understand the correlation among the climatic indices, exploitation, and the Grey Mullet population, we examined the influence of long-term climate (annual mean) and winter sea surface temperature (during the fishing season, defined as December, January, and February) variability on the Grey Mullet population before and after overexploitation. The correlations between recruitment and climatic indices or sea surface temperature and year t were examined by conducting a Pearson correlation analysis.
For tropical and extra-tropical climate signals, ONI and PDO were investigated. Both exhibited high correlations with the catch rates of Grey Mullet (Lan et al. Citation2014) and were downloaded from the National Oceanic and Atmospheric Administration Earth System Research Laboratory (http://www.esrl.noaa.gov/). Monthly sea surface temperature data for the period from 1958 to 2004 were downloaded from Simple Ocean Data Assimilation version 2.2.4 (http://www.atmos.umd.edu/~ocean/). Following Tzeng et al. (Citation2012), we used sea surface temperature variations at the Chang-Yuen Rise to estimate variations in the Taiwan Strait. Sea surface temperature anomalies (SSTAs) were computed with respect to monthly climatology data for 1971–2000 (Xue et al. Citation2003).
The cross-correlation function was used to examine the time lag relationships between the population of Grey Mullet and climatic indices corresponding to the Pearson correlation. Cross-correlation analysis is the most valuable and widely used statistical tool for quantifying temporal relationships between variables (Weimerskirch et al. Citation2003). The analysis computes the correlation, expressed as the correlation coefficient, between paired time series containing numerous time lags (Olden and Neff Citation2001). Before the analyses, the population data were log transformed and linearly detrended by both population and climatic indices to meet the assumptions of the cross-correlation test. The significance of the cross-correlations function at different lag points was measured by comparing the ratio correlation (lag/lag SE) with a normal variate by using statistical software (Statistica, version 8.0).
RESULTS
Changes in Population at Age and Recruitment
The parameters of the von Bertalanffy growth equation for Grey Mullet were estimated to be cm, K = 0.340/year, and t0 = –0.935 year by using a nonlinear regression method (). As shown in , there were some fluctuations in the population of Grey Mullet from 1958 to 1980. The population number exhibited a peak of 13 million individuals in 1980 and then continually decreased until 1990. Subsequently, the population remained at a low level until 2004, when it was at its minimum of 247,000 individuals, which was only 2% of the peak.
FIGURE 2. Annual changes in population (black bars) and fishing mortality (gray line) for Grey Mullet in the Taiwan Strait, 1958–2004.
The estimates of the instantaneous rate of fishing mortality for Grey Mullet in the Taiwan Strait from 1958 to 2004 generally increased until 1969 but decreased afterward (). After 1977, the instantaneous rate of fishing mortality increased again, and after the 1990s, the rate of fishing mortality generally remained at a high level. In most scenarios, when the instantaneous rate of fishing mortality was high, the population was low, and when the instantaneous rate of fishing mortality was low, the population increased. The annual biomass estimates of varying M were significantly and positively correlated with the CPUE achieved using purse seines from 1958 to 2004 (–; P < 0.01). The fishing mortality had a significant negative correlation with annual biomass estimates (–j; P < 0.01).
FIGURE 3. Relationships between (a)–(e) the CPUE and population, (f)–(j) population and fishing mortality, and (k)–(o) SSTA and recruitment numbers (ages 2–3) of Grey Mullet caught with varying M (0.50M, 0.75M, 1.00M, 1.25M, and 1.50M) in the Taiwan Strait, 1958–2003.
The population at ages 2–4 was at a high level in approximately 1980, whereas the population at ages 5–7 was at a high level around 1977 (). The population at ages 4–5 was very low after 1987, whereas the population at ages 6–7 almost disappeared after 1980. The major fishing populations at ages 2–3 were strong in the late 1970s and early 1980s, which supported sustaining a high population around 1980. Since 1986, the population markedly dropped and remained at a low level until 2004.
FIGURE 4. Changes in population at (a)–(f) ages 2–7 years for Grey Mullet in the Taiwan Strait, 1958–2004.
Climatic Effects on Grey Mullet Population
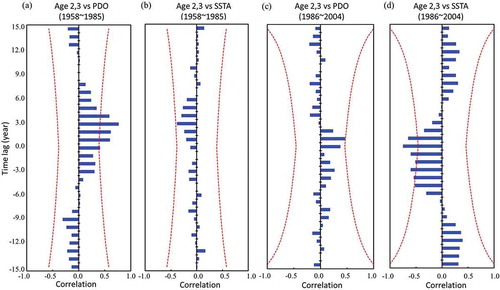
Time series trends of the CPUE exhibited decadal fluctuation from 1958 to 1985 and continued decrease after 1986 (Figure 1c). The population fluctuation also decreased with higher fishing mortality after 1986 (). Belkin and Lee (Citation2014) and Lan et al. (Citation2014) found an increased trend in sea surface temperature in Taiwan Strait since the 1980s. The correlation between the population at ages 2–6 of varying M and the physical environments was further analyzed for the two periods (1958–1985 and 1985–2004) in . The PDO had a significant positive correlation with the population from 1958 to 1985 at ages 2–4 for 0.50M and 0.75M, at ages 3–4 for 1.00M, 1.25M, and 1.25M, and at age 4 for 1.50M. The populations at ages 3–6 and ages 2–6 of varying M had high correlations with the PDO and SSTAs after 1986, respectively. The major fishing population at ages 2–3 also had a significant negative correlation with SSTAs (–; P < 0.01). The ONI did not exhibit any significant correlation with the Grey Mullet population at ages 2–6 in the two periods. The cross-correlation function indicated that the major fishing population at ages 2–3 was influenced by the PDO 2–4 years prior (), and SSTAs had no significant time lag effect from 1958 to 1985 (). However, the time lag of changes in the population at ages 2–3 in response to variations in the PDO and SSTAs changed to 0–2 years during the period of 1986–2004 (.
TABLE 3. Results of Pearson correlation analysis of the Grey Mullet population at ages 2–6 with varying M (0.50M, 0.75M, 1.00M, 1.25M, and 1.50M) against the annual mean Pacific Decadal Oscillation (PDO), Oceanic Nino Index (ONI), and winter sea surface temperature anomalies (SSTAs) for two periods (1958–1985, 1986–2004). An asterisk indicates significance at P < 0.05.
FIGURE 5. Cross-correlation function between recruitment numbers (ages 2–3) and (a), (c) average annual PDO and (b), (d) winter SSTAs for the periods 1958–1985 and 1986–2004. The two red dotted lines represent the limits of significance at the 5% level.
DISSCUSSION
As shown in , the population of Grey Mullet in the Taiwan Strait decreased from the late 1960s to the early 1970s since the instantaneous rates of fishing mortality increased in the 1960s. The Grey Mullet stock then recovered and the population increased from the early 1970s to the early 1980s, when the instantaneous rates of fishing mortality remained at a low level. The population began to decline in the early 1980s because of the increase in instantaneous rates of fishing mortality from the late 1970s to the mid-1980s. Subsequently, because of the constant high level of fishing mortality, the population continually declined and has stayed at a low level. Since 1986, catches have also sharply dropped, despite a high level of fishing intensity, indicating that overfishing has occurred since the 1980s. The significant correlations in population number, CPUE, and fishing mortality with varying M indicate that our estimates of the population and fishing mortality are reasonable, and higher fishing mortality leads to a lower population of Grey Mullet in the Taiwan Strait. However, the absence of 15 years of age composition data, accounting for 32% of a total of 47 periods, is a critical factor affecting the uncertainty of the estimates of the population and fishing mortality in our cohort analysis. Nevertheless, the missing years are not consecutive; therefore, it was possible to generate estimates of age compositions by averaging the proportions of neighboring years’ age compositions, enabling the creation of a trend line of the age compositions of the fish population.
A number of dominant year-classes appeared from 1975 to 1985, supporting the increase in population and catches by strong recruitment during this period. This explains the high population of spawning stock older than 4 years. The fishing mortality of the female Grey Mullet is in the range of 0.3–1.5 and that of the male is in the range of 0.7–2.0, with an average population of approximately 4.5 million individuals from 1977 to 1986 (Huang Citation1989). Our results showed the fishing mortality and average population to be similar to the findings of Huang (Citation1989). However, the population of the age-group 4 years and older has decreased since 1986 declining to 20,000 individuals in 2004, which is only 1/100 of what the population was in 1981. We speculate that the Grey Mullet stock has lost reproductive ability because of severe recruitment overfishing. Additionally, an expansion in the sizes of mainland Chinese fishing fleets targeting Grey Mullet might have caused the sharp decline in Taiwanese catches after 1998 (Huang et al. Citation2005; Hung and Shaw Citation2006). Because of their geographical advantage, fishermen in mainland China first harvest Grey Mullet at the point from which the Grey Mullet migrate, inciting the decline of the Grey Mullet fishery in Taiwan (Hung and Shaw Citation2006). In this study, since the age structure was assumed to be constant from 2000 to 2004 because of the lack of data, uncertainty remains regarding the age changes at full recruitment.
In this study, we assumed that the reason for the large increase in population in the late 1970s and early 1980s was the low level of the instantaneous rate of fishing mortality in the 1970s. However, to more objectively examine the reason for this phenomenon, we must study the interrelationship between the early life stages of the Grey Mullet and influential marine environmental factors at these stages in the Taiwan Strait. Climatic effects as well as an increase in sea surface temperature associated with global warming are other significant factors that have reduced the catch in Taiwan (Huang et al. Citation2005; Hung and Shaw Citation2006; Whitfield et al. Citation2012; Lan et al. Citation2014). The long-term warming of sea surface temperature increased towards the East China Sea, where the sea surface temperature warming in 1957–2011 was about three times that in the South China Sea (Belkin and Lee Citation2014). The long-term warming was strongly enhanced in winter, with the maximum warming of 3.8°C in February (Kuo and Lee Citation2013). In addition, our analysis revealed significant positive coherence between the PDO and the population of Grey Mullet in the Taiwan Strait. The major fishing population (ages 2–3) confirmed a 2–4 year time-lagged response to variations in the PDO from 1958 to 1985. The extratropical climate patterns of the PDO probably play a critical role in affecting current transport, ocean productivity, and eddy activities and hence affect the stock abundance and migration behavior of Grey Mullet in the Taiwan Strait via the NCCC in winter. Previous studies have indicated that increased speeds of northeasterly winds in the winter strengthen the southerly invasion of the cold NCCC during the positive PDO phase (Tzeng et al. Citation2012; Zhang et al. Citation2012). Distribution areas of Grey Mullet were pushed further to the southern Taiwan Strait, which resulted in the increased vulnerability of this species to surface fisheries in winter (Lan et al. Citation2014). The marine environmental variations on the spawning and feeding grounds of Grey Mullet in the coastal waters of the Taiwan Strait and China affected by the PDO may influence the recruitment population after 2–4 years. The sharp decrease around 1986 is associated with the late-1980 regime shift in the North Pacific Ocean, and the PDO showed the decreased trend (Lan et al. Citation2014). A time lag refers to a delayed response in the dynamics of a dependent variable following a stimulus, such as changes in species density following fluctuations in a limited resource or in the dynamics of an interacting species (Borges et al. Citation2003). Furthermore, the sea surface temperature variations in winter caused by the PDO and climate change also affect the abundance and migration behavior of Grey Mullet in the Taiwan Strait.
The ONI did not exhibit any significant correlation with the Grey Mullet population at ages 2–6 in the study. Lan et al. (Citation2014) found that the CPUE of Grey Mullet was positively and significantly correlated with the autumn ONI with 4–6 years periodicity. However, the effects of dominant El Niño–Southern Oscillation events on lower population levels and higher fishing mortality were not consistent. For example, lower population levels and higher fishing mortality corresponded with some but not all strong El Niño events (e.g., 1986–1987 and 1997–1998 but not 1964–1965, 1969–1970, 1979–1980, and 2003–2004). Tzeng et al. (Citation2012) also found that not all El Niño/La Niña events exhibit the same correlation with sea surface temperature in the Taiwan Strait and suggested that other factors influence the spatial distribution of sea surface temperature. This finding requires further supporting studies with higher resolution temporal and spatial fishery and environmental data.
High mortality rates imposed on mature individuals, through factors such as exploitation, can alter these characteristics and ultimately change the response of fish populations to their physical environment (Botsford et al. Citation2011; Rouyer et al. Citation2012). Our results suggest that the overexploitation of Grey Mullet reduced its spawning biomass to the level of the 2–4 year age-classes with varying M. They also suggest that increased sea surface temperature during the past two decades likely drove the stock to consecutive years of poor recruitment and to its current low level in the Taiwan Strait. Furthermore, the recruitment population (ages 2–3) of Grey Mullet was influenced by the PDO, with the 2–4 years lag changing to 0–2 years and SSTAs having a significant time lag effect after 1986. Populations that exhibited a truncation of their age structure were associated with shorter-term fluctuations in time series (Rouyer et al. Citation2012), suggesting an increased sensitivity to short-term environment changes.
Considering that the age at full recruitment changed from 4 years in 1958–1982 to 3 years in 1983–2004, an appropriate analysis must be conducted to understand changes in fish yield by recruited age to determine whether an increase in overfishing occurred in the early 1980s. The lack of effective cooperative fishery management and the strong demand for Grey Mullet in Taiwan have both accelerated the depletion of the Grey Mullet stock and had a negative effect on the welfare of the people in Taiwan (Hung and Shaw Citation2006). Furthermore, the relationship between the stocks in Taiwan Strait and in adjacent regions of the northwestern Pacific Ocean is unclear. We suggest that additional studies on population dynamics are necessary to clarify this problem and should consider potential feedback from changes in the pelagic ecosystem. Including aspects of fishing behavior and landing data from Taiwan and mainland China is a crucial next step in conducting more comprehensive investigations on the influence of climate variability. Finally, ecosystem-based management is an essential complement to existing fisheries management approaches (Zhang et al. Citation2009). When fishery managers understand the complex ecological and socioeconomic environments in which fish and fisheries exist, they will be more able to anticipate the effects that fishery management will have on the ecosystem, as well as the effects that ecosystem change will have on the fisheries.
ACKNOWLEDGMENTS
This study was financially supported by the National Science Council, Taiwan (Ministry of Science and Technology [MOST] 104-2611-M-019-012 and MOST 105-2611-M-019-015), the Council of Agriculture (104AS-17.2.1-FA-F1, 104AS-17.2.2-FA-F1, and 105AS-11.1.5-FA-F1[5]), and the Center of Excellence for Marine Bioenvironment and Biotechnology at National Taiwan Ocean University. We are grateful to the Fisheries Research Institute and the Council of Agriculture of Taiwan for providing us with the fishery data for Grey Mullet.
References
- Baranov, F. I. 1918. On the question of the biological basis of fisheries. Izvestiya 1:81–128. ( Translated from Russian by W. E. Ricker, 1945.)
- Belkin, I. M., and M. A. Lee. 2014. Long-term variability of sea surface temperature in Taiwan Strait. Climatic Change 124:821–834.
- Borges, M. F., A. M. P. Santos, N. Crato, H. Mendes, and B. Mota. 2003. Sardine regime shifts off Portugal: a time series analysis of catches and wind conditions. Scientia Marine 67:235–244.
- Botsford, L. W., M. D. Holland, J. F. Samhouri, J. W. White, and A. Hastings. 2011. Importance of age structure in models of the response of upper trophic levels to fishing and climate change. ICES Journal of Marine Science 68:1270–1283.
- Gulland, J. A., editor. 1988. Fish population dynamics: the implications for management, 2nd edition. Wiley, Chichester, UK.
- Huang, C. S., J. C. Lin, and J. J. Huang. 2005. Length-age composition of Grey Mullet in 2004. Investigation and surveillance of Grey Mullet Resource. FRI (Fisheries Research Institute) Newsletter 9:1–5.
- Huang, C. S., and W. C. Su. 1986. Analysis on the fishing condition of Grey Mullet in Taiwan. Pages 1963–1985 in W. C. Su, editor. Study on the resource of Grey Mullet in Taiwan. Taiwan Fisheries Research Institute, Keelung.
- Huang, S. Y. 1989. Single cohort analysis on stock size of Grey Mullet of Taiwan. Investigation and surveillance of Grey Mullet Resource of Taiwan. TFRI (Taiwan Fisheries Research Institute) Newsletter 7:1.
- Hung, C. M., and D. Shaw. 2006. The impact of upstream catch and global warming on the Grey Mullet fishery in Taiwan: a non-cooperative game analysis. Marine Resource Economics 21:285–300.
- Hwang, S. Y. 1982. Study on the fishery biology of Grey Mullet (Mugil cephalus Linnaeus) of Taiwan. Bulletin of Taiwan Fisheries Research Institute 34:133–148.
- Kuo, Y. C., and M. A. Lee. 2013. Decadal variation of wintertime sea surface temperature in the Taiwan Strait. Journal of Marine Science and Technology 21:117–123.
- Lan, K. W., M. A. Lee, C. I. Zhang, P. Y. Wang, L. J. Wu, and K. T. Lee. 2014. Effects of cyclic fluctuations in climate change on the annual fishing conditions of Grey Mullet (Mugil cephalus L.) in the Taiwan Strait. Climatic Change 126:189–202.
- Olden, J. D., and B. D. Neff. 2001. Cross-correlation bias in lag analysis of aquatic time series. Marine Biology 138:1063–1070.
- Planque, B., J. M. Fromentin, P. Cury, K. F. Drinkwater, S. Jennings, R. I. Perry, and S. Kifani. 2010. How does fishing alter marine populations and ecosystems sensitivity to climate?. Journal of Marine System 79:403–417.
- Pope, J. G. 1972. An investigation of the accuracy of virtual population analysis using cohort analysis. International Commission for the Northwest Atlantic Fisheries Research Bulletin 9:65–74.
- Rouyer, T., A. Sadykov, J. Ohlberger, and N. C. Stenseth. 2012. Does increasing mortality change the response of fish populations to environmental fluctuations? Ecology Letters 15:658–665.
- Shen, K. N., B. W. Jamandre, C. C. Hsu, W. N. Tzeng, and J. D. Durand. 2011. Plio-Pleistocene sea level and temperature fluctuations in the northwestern Pacific promoted speciation in the globally-distributed Flathead Mullet Mugil cephalus. BMC Evolutionary Biology [online serial] 11:83.
- Su, W. C., C. S. Huang, L. J. Wu, and S. H. Hsieh. 2002. Length-age composition of Grey Mullet in 2000. Investigation and surveillance of Grey Mullet Resource of Taiwan. TFRI (Taiwan Fisheries Research Institute) Newsletter 156:9–10.
- Thomson, J. M. 1963. Synopsis of biological data on the Grey Mullet Mugil cephalus Linnaeus 1758. CSIRO Division of Fisheries and Oceanography 1:1–14.
- Tung, I. H. 1981. On the fishery biology of Grey Mullet, Mugil cephalus L., in Taiwan. Report of the Institute of Fishery Biology Ministry of Economic Affairs and National Taiwan University 3:38–102.
- Tzeng, M. T., K. W. Lan, and J. W. Chan. 2012. Interannual variability of wintertime sea surface temperatures in the eastern Taiwan Strait. Journal of Marine Science Technology- Taiwan 20:707–712.
- von Bertalanffy, L. 1938. A quantitative theory of organic growth. Human Biology 10:181–213.
- Weimerskirch, H., P. Inchausti, C. Guinet, and C. Barbraud. 2003. Trends in bird and seal populations as indicators of a system shift in the Southern Ocean. Antarctic Science 15:249–256.
- Whitfield, A. K., J. Panfili, and J. D. Durand. 2012. A global review of the cosmopolitan Flathead Mullet Mugil cephalus Linnaeus 1758 (Teleostei: mugilidae), with emphasis on the biology, genetics, ecology and fisheries aspects of this apparent species complex. Reviews in Fish Biology and Fisheries 22:641–681.
- Xue, Y., T. M. Smith, and R. W. Reynolds. 2003. Interdecadal changes of 30-yr SST normals during 1871-2000. Journal of Climate 16:1601–1612.
- Zhang, C. I., S. Kim, D. Gunderson, R. Marasco, J. B. Lee, H. W. Park, and J. H. Lee. 2009. An ecosystem-based fisheries assessment approach for Korean fisheries. Fisheries Research 100:26–41.
- Zhang, C. I., and B. A. Megrey. 2006. A revised Alverson and Carney model for estimating the instantaneous rate of natural mortality. Transactions of the American Fisheries Society 135:620–633.
- Zhang, Q., Y. Hou, and T. Yan. 2012. Inter-annual and inter-decadal variability of Kuroshio heat transport in the East China Sea. International Journal of Climatology 32:481–488.