
Abstract
Implementation of an ecosystem approach to fisheries management (EAFM) for forage fish requires methods to evaluate tradeoffs associated with competing management objectives that focus on supporting fishery yields or providing food for predators. We developed an Ecopath with Ecosim ecosystem model of the U.S. Northwest Atlantic continental shelf (NWACS) for the period 1982–2013 to inform an EAFM for Atlantic Menhaden Brevoortia tyrannus. The model (with 61 trophic groups and 8 fishing fleets) was parameterized and fitted to time series using data from stock assessments, surveys, and literature. Fifty-year simulations evaluated how Atlantic Menhaden fishing mortality rates (F) influenced different ecosystem indicators, including population biomasses, fishery yields, prey-to-predator ratios, and the proportion of trophic groups that were positively or negatively affected. We quantified tradeoffs associated with a range of alternative ecosystem-based reference points for Atlantic Menhaden F and biomass (B), including F for maximum sustainable yield (FMSY), 0.5FMSY, proxies for current single-species F reference points, 75% of virgin unfished biomass (B0), and 40%B0. Striped Bass Morone saxatilis were most sensitive to increases in Atlantic Menhaden fishing, largely due to their strong dietary reliance on this prey species, but other higher-trophic-level groups (birds, highly migratory species, sharks, and marine mammals) were also negatively impacted. Other commercially important predators of Atlantic Menhaden (e.g., Bluefish Pomatomus saltatrix and Weakfish Cynoscion regalis) had moderate to negligible responses at the highest levels of Atlantic Menhaden F. The alternative reference points considered resulted in (1) variable Atlantic Menhaden biomasses (40–75% of B0) and yields (54–100% of MSY), (2) up to a 60% decline in Striped Bass B and yield, (3) negative impacts on the B of ≤13% of modeled groups, and (4) positive impacts on the B of ≤6% of modeled groups. Simulations demonstrated the varied responses, potential winners and losers, and tradeoffs resulting from alternative management strategies for Atlantic Menhaden. These results and the NWACS model can help to advance an EAFM for Atlantic Menhaden and other fishes.
Received April 4, 2017; accepted July 19, 2017
Ensuring sustainable exploitation of coastal ecosystems will require ecosystem-based approaches to managing fisheries that account for trophic interactions among species and the ongoing environmental and climatic shifts within these systems (Larkin Citation1996; Pikitch et al. Citation2004; Link Citation2010a; Fogarty Citation2014). Federal fishery policy in the U.S. “strongly supports implementation of ecosystem-based fisheries management (EBFM) to better inform and enable better decisions regarding trade-offs among and between fisheries…, aquaculture, protected species, biodiversity, and habitats” (NMFS Citation2016). However, recognizing trade-offs in setting policy objectives is an inherent and challenging feature of EBFM (Link Citation2010a; Essington et al. Citation2016). Simply stated, there are multiple diverse—but often incompatible—objectives that can be legitimate goals of EBFM. Determining the balance of these diverse societal goals is both a management challenge and a scientific challenge.
A gradient of management approaches can be recognized, ranging from single-species management to implementation of full ecosystem-based management, and each management method is associated with objectives and models that differ in complexity and diversity. For example, single-species approaches typically have a single goal related to maximum sustainable yield (MSY) of the fishery and are supported by a diverse array of modeling tools. Multispecies models move beyond single-species models and account for interactions among a restricted suite of species. They are often motivated by a need to account for temporal variability in predation mortality (Whipple et al. Citation2000; Garrison et al. Citation2010). Many modeling tools are available, including multispecies versions of single-species stock assessment models, such as multispecies production models (e.g., Collie and DeLong Citation1999), multispecies virtual population analysis (MSVPA; Garrison et al. Citation2010), and multispecies statistical catch-at-age models (Curti et al. Citation2013). Importantly, the objectives of multispecies models often remain to determine the MSY of a single (or few) key species. Ecosystem approaches to fisheries management (EAFMs) reside at the next level beyond multispecies modeling in the gradient (Fogarty Citation2014). These approaches typically maintain a focus on managing a single species but increase the diversity of issues that can be addressed by including additional ecosystem components, such as predation, habitat, and climate.
Ecosystem approaches to fisheries management transition to EBFM as more species are considered and the fisheries sector is managed as an integrated system while recognizing the biological, economic, and social tradeoffs in the ecosystem (Patrick and Link Citation2015). Implementation of EBFM is often supported by modeling tools, such as network models and end-to-end ecosystem models that consider and include a broad suite of factors from nutrients to fisheries and economics (e.g., Rose et al. Citation2010; Fulton et al. Citation2011). The management objectives for EAFM and EBFM can be much broader than those for single-species and multispecies modeling and commonly include explicit trade-offs between fishery and nonfishery values. Fishery ecosystem plans can document and prioritize these management objectives and tradeoffs and provide a formal mechanism for initiating management actions in a comprehensive fashion (e.g., NOAA-CBFEAP Citation2006; Essington et al. Citation2016).
Here, we consider the management of Atlantic Menhaden Brevoortia tyrannus as a case study of the challenges in transitioning to EAFM or EBFM, and we develop a tool to facilitate the transition. Atlantic Menhaden is an important forage fish found along the eastern seaboard of the USA from Florida to Maine (Nicholson Citation1978). Atlantic Menhaden are consumed by diverse predators, including fishes, marine mammals, and birds (e.g., Walter and Austin Citation2001; Glass and Watts Citation2009; Butler et al. Citation2010; Buchheister and Latour Citation2015); several of these predators, including Striped Bass Morone saxatilis, Bluefish Pomatomus saltatrix, and Weakfish Cynoscion regalis, are themselves commercially and recreationally important fished species (Garrison et al. Citation2010). Atlantic Menhaden also support the largest directed fishery on the U.S. East Coast, with harvested fish used for fish meal and fish oil and for bait in other fisheries (SEDAR Citation2015). Juvenile Atlantic Menhaden (primarily age-0 individuals) filter phytoplankton from the water column and potentially could affect water quality in eutrophic systems (Gottlieb Citation1998; Friedland et al. Citation2006, Citation2011; Lynch et al. Citation2010, Citation2011). Thus, Atlantic Menhaden provide important ecosystem services, including (1) supporting predators as a food resource, (2) supporting a large directed fishery, and (3) filtering phytoplankton from the water column, mostly as age-0 juveniles.
The Atlantic Menhaden fishery is managed by the Atlantic States Marine Fisheries Commission (ASMFC). The current fishery management plan (FMP) strives for EAFM since it seeks to manage the fishery “in a manner that is biologically, economically, socially and ecologically sound, while protecting the resource and those who benefit from it” (ASMFC Citation2012). Of the 13 stated FMP objectives to achieve this broad goal, two in particular emphasize the Atlantic Menhaden’s role as a forage species: (1) “Protect and maintain the Atlantic Menhaden stock at levels to maintain viable fisheries and the forage base with sufficient spawning stock biomass to prevent stock depletion and guard against recruitment failure”; and (2) “Protect and maintain the important ecological role Atlantic Menhaden play along the coast” (ASMFC Citation2012). However, the desire to simultaneously satisfy these multiple ecosystem services has fostered debates among stakeholders and managers. There is a need to provide tools to support the evaluation of trade-offs among these ecosystem services, thereby assisting stakeholders and managers in establishing objectives for the fishery and in setting management reference points that support the management objectives.
Atlantic Menhaden have been managed in a single-species context through fishing mortality rates (F) and biomass (B), or fecundity reference points (SEDAR Citation2015). The present single-species reference points are intended to be interim targets and thresholds until ecological (or ecosystem-based) reference points (ERPs) are developed (ASMFC Citation2012; SEDAR Citation2015). In this context, ERPs are EAFM reference points that reflect and explicitly account for other ecosystem services that a species or community may provide (e.g., supporting predators); accordingly, ERPs move beyond the single-species consideration of a fishery’s sustainability in terms of yield. Alternative ERP targets have been proposed in the literature (Constable et al. Citation2000; Smith et al. Citation2011; Pikitch et al. Citation2012), and these are often presented as F-values relative to F at MSY (FMSY) or as biomasses relative to virgin unfished biomass (B0). However, these ERPs have not been developed or evaluated specifically for Atlantic Menhaden. The most recent stock assessment for Atlantic Menhaden (SEDAR Citation2015) listed approaches that could be adopted to develop or evaluate ERPs for this species, including general ecosystem indicators, modifications of single-species models, multispecies models, and ecosystem models. However, most of the proposed methods do not fully account for dynamic feedbacks between Atlantic Menhaden and their predators, which can be accomplished using ecosystem models.
Ecopath with Ecosim (EwE) is an ecosystem modeling framework that has become a common approach for exploring and evaluating how a fishery ecosystem may respond to strategies to achieve specific management objectives (Christensen and Walters Citation2004; Coll et al. Citation2009; Link Citation2010a). Once it is developed and calibrated to time series of empirical data, an EwE model can be used to explore ecosystem changes that may occur under alternative fisheries management scenarios. Accordingly, within an EAFM framework, EwE model simulations can be run to both (1) identify potential reference points for fishing mortality and biomass that best achieve specific management objectives and (2) evaluate the ecosystem impacts of these management strategies.
Here, we use EwE to model ecosystem components of the U.S. Northwest Atlantic continental shelf (NWACS) to facilitate evaluation of Atlantic Menhaden management decisions in an ecosystem context by explicitly accounting for effects of Atlantic Menhaden fisheries on other components of the ecosystem. The primary objectives of our research were to (1) develop an ecosystem model that can be used as a tool to inform strategic decisions for EAFM of Atlantic Menhaden fisheries, (2) evaluate the ecosystem impacts of a range of different Atlantic Menhaden fishing mortality rates, and (3) compare the performance of some potential reference points proposed for Atlantic Menhaden management.
METHODS
Ecopath with Ecosim modeling framework
The NWACS model was developed using Ecopath with Ecosim version 6.4.3 (www.ecopath.org). Full details of the underlying theory, assumptions, and model mechanics are described elsewhere (Walters et al. Citation1997; Christensen and Walters Citation2004; Christensen et al. Citation2008). Briefly, the Ecopath module is used to develop a mass-balanced description of the ecosystem’s food web at a single point in time. Ecopath models rely on group-specific estimates of B, catch (C), the production-to-biomass ratio (P/B), the consumption-to-biomass ratio (Q/B), biomass accumulation (BA; which accounts for nonequilibrium conditions), diet compositions, and ecotrophic efficiency (the proportion of the production that is utilized in the ecosystem and accounted for in the model).
The Ecosim module provides a time-dynamic representation of the ecosystem that examines the changes in the food web in responses to changes in ecosystem components over time. Changes in consumption rates are calculated based on the foraging arena theory, wherein the rate of effective prey searching by predators is influenced by the transition of prey between vulnerable and invulnerable states (Walters and Juanes Citation1993; Walters et al. Citation1997; Christensen and Walters Citation2004). The transfer rate between these states, determined by a vulnerability parameter, replaces the functional response relationships used in many other multispecies models and ultimately determines the degree to which groups are controlled by top-down or bottom-up forcing (Walters et al. Citation1997; Christensen and Walters Citation2004). Ecosim parameters are determined from a statistical fitting of the model to available time series of relative biomass, fisheries landings, and fishing mortality, often obtained from monitoring surveys and stock assessments. Time series of fishing mortality, fishing effort, or landings can be used to “drive” the model by representing observed perturbations to the historical system.
Northwest Atlantic continental shelf model structure
Our EwE model represents the NWACS ecosystem and major estuaries from North Carolina to Maine (). The model domain includes four continental shelf areas: the Mid-Atlantic Bight (MAB), southern New England (SNE), Georges Bank (GB), and the Gulf of Maine (GOM), each of which has been previously modeled using Ecopath. Although the model domain does not encompass the entire distributional range of Atlantic Menhaden (from Florida to Nova Scotia), we chose this domain to support comparison with an MSVPA model developed for Atlantic Menhaden (Garrison et al. Citation2010) and with existing Ecopath models for the region (Link et al. Citation2008). This domain relies on the natural faunal and oceanographic break in North Carolina (Longhurst Citation1998) while also including the bulk of historical Atlantic Menhaden fishing effort concentrated in Chesapeake Bay and the Mid-Atlantic (SEDAR Citation2015).
FIGURE 1. Map of the Northwest Atlantic continental shelf system, with major subregions and estuaries labeled.
The NWACS model was parameterized by using available data for the ecosystem from 1982 to 2013. Full details are provided by Buchheister et al. (Citation2017). The initial year, 1982, was chosen because this is the first year of catch data and biomass estimates for many of the fish species with stock assessments. The model leveraged a large body of earlier research conducted by the Energy Modeling and Analysis eXercise (EMAX) project (National Oceanic and Atmospheric Administration [NOAA], Northeast Fisheries Science Center [NEFSC]), which developed four Ecopath models of the MAB, SNE, GB, and GOM (Link et al. Citation2006, Citation2008). Estimates and values from the EMAX models were used to parameterize many of the relatively data-poor, non-fish groups that did not have readily available stock assessment or survey information. Eight fishing fleets were modeled to account for the dynamics of fishing operations in the region. These fleets represented the predominant fishing gears used within the model domain based on landings data from NOAA, and they included dredge, trawl, trap, gill-net, purse-seine, recreational, longline, and other fisheries.
The trophic structure of the model represents principal components of the ecosystem, from detritus and phytoplankton to marine mammals and seabirds, assigned to 61 groups (Buchheister et al. Citation2017). Taxa were aggregated into groups based on similar functional or taxonomic characteristics and model objectives. The degree of taxonomic resolution at lower and higher trophic levels largely followed the structure used for the EMAX models (Link et al. Citation2006, Citation2008). We included greater taxonomic resolution relative to the EMAX models for many fish groups to better represent individual Atlantic Menhaden predators (e.g., Striped Bass, Bluefish, and Weakfish), alternative prey for those predators (e.g., Atlantic Herring Clupea harengus, Atlantic Mackerel Scomber scombrus, and anchovies Anchoa spp.), and other fish species of particular management concern or ecological significance (e.g., Atlantic Cod Gadus morhua, Summer Flounder Paralichthys dentatus, and Spiny Dogfish Squalus acanthias). Several fishes were partitioned into two or three distinct age stanzas to account for documented ontogenetic differences in diets or changes in habitat or migration behaviors. Stanzas were defined based on age, but associated length cutoffs were also assigned (using length-at-age relationships) to allow length-based data (e.g., trawl survey catches and diets based on predator length) to be partitioned appropriately among stanzas. For simplicity and consistency in naming of multiple-stanza groups, stanzas were labeled as either small, medium, or large, although they represented specific ages for each species (Buchheister et al. Citation2017). For Atlantic Menhaden, the small, medium, and large stanzas corresponded to age 0, ages 1–2, and age 3+, respectively.
Ecopath model parameterization: general methods
A detailed description of the model, its parameterization, and its balancing is provided by Buchheister et al. (Citation2017); we provide a synopsis here. The model was parameterized using data from the EMAX models, fisheries survey data, stock assessments, and primary literature. Many parameters for lower- and higher-trophic-level groups were adapted from EMAX Ecopath models of the MAB, SNE, GB, and GOM because these estimates were not readily available from other sources (Link et al. Citation2006, Citation2008). Although the EMAX models were parameterized for the years 1996–2000, estimates for many of the data-poor groups (e.g., macrobenthos and seabirds) were derived from other time periods. We assumed that they would be reasonable starting points for our model. Model parameters for the mid-trophic-level groups (i.e., most fishes) were obtained from stock assessments or from the monitoring surveys, which typically included information from 1982. For species with multiple life history stanzas, age-specific information from stock assessments were used to parameterize the B and P/B for each stanza. Various information sources were accessed to parameterize other values needed for the model (e.g., Q/B, the von Bertalanffy K-parameter, weight at maturity, and weight at infinity). To account for nonequilibrium conditions, BAi rates were calculated for assessed species based on the change in biomass from 1982 to 1983, data permitting. Catch data were obtained from online federal databases for commercial and recreational fisheries (NOAA Citation2014a, Citation2014b) or from stock assessments where possible. Food habits data for most fishes were obtained from two large-scale trawl surveys: the NEFSC survey (Link and Almeida Citation2000) and the Northeast Area Monitoring and Assessment Program (NEAMAP) survey (Bonzek et al. Citation2015). Diet estimates for several species were augmented with values from published literature sources. For example, a diet database for an Atlantic Menhaden MSVPA model (Garrison et al. Citation2010; SEDAR Citation2015) was used to parameterize diets for Striped Bass, Weakfish, and Bluefish. As described by Buchheister et al. (Citation2017), the final Ecopath model was derived using the balancing and pre-balancing guidelines recommended by Christensen et al. (Citation2008) and Link (Citation2010b).
The time-dynamic Ecosim module utilized time series of fishing mortality and fishing effort to drive changes in the ecosystem. Time series of F were calculated as C/B for fish species with stock assessments. For any species with multiple age stanzas, the C- and B-estimates were summed across the appropriate ages to calculate the stanza-specific F-value. Effort time series were derived from fishing fleet catch trends, assuming constant catchability (Buchheister et al. Citation2017). Time series of relative B and C were used as reference time series to fit the model. We followed the general process described by Christensen et al. (Citation2008) for Ecosim parameterization. Vulnerability parameters were initially selected by using an automated procedure to minimize the sum of squared deviations between predicted and observed data, but some values were subsequently adjusted to improve fits for some groups (e.g., Atlantic Menhaden and their predators) and to prevent biologically unlikely results, such as species extinctions or explosions (Buchheister et al. Citation2017).
Ecosim simulations and indicators
Projections were conducted using the base NWACS ecosystem model to evaluate the ecosystem effects caused by different levels of fishing on Atlantic Menhaden. Fifty-year simulations were conducted for the period 2014–2063. For these simulations, fishing mortality and effort for all groups except Atlantic Menhaden were maintained at constant levels. Atlantic Menhaden exploitation scenarios are reported relative to changes in the medium-size Atlantic Menhaden stanza (i.e., Fmed.menh, representing the F on medium-stanza Atlantic Menhaden), because medium (age-1–2) individuals accounted for the majority of Atlantic Menhaden landings in recent history. Starting in 2014, scenarios were run at a range of Atlantic Menhaden F-values that were proportional changes from the 2009–2013 average for each stanza. For example, doubling of Fmed.menh was simultaneously accompanied by the doubling of F for the small and large stanzas. Specifically, we simulated Fmed.menh ranging from 0 to 1.6 per year in increments of 0.1/year. The F-values for the other stanzas were scaled accordingly relative to their 2009–2013 mean. Fishing mortality rates for the large- and small-stanza Atlantic Menhaden were 0.335 × Fmed.menh and 0.024 × Fmed.menh, respectively.
First, deterministic simulations were conducted for each Atlantic Menhaden F scenario. Each scenario was run for 50 years (2014–2063) to allow the system to reach equilibrium with the simulated conditions. For each scenario, the median Bi and Ci for each trophic group i was calculated for the final 15 years of the simulation. To provide species-level summaries of multi-stanza groups, the Bi and Ci values were summed across stanzas, yielding 48 aggregated groups from the original 61 groups.
Effects of the different simulated Atlantic Menhaden F scenarios were evaluated using five indicators. The first two indicators were the relative difference in B and the relative difference in C. For each group i, equilibrium Bi was evaluated relative to the equilibrium Bi obtained with no fishing on Atlantic Menhaden (i.e., Fmed.menh = 0/year). Thus, for Atlantic Menhaden, the results are presented as the percent depletion relative to Atlantic Menhaden B0. For all other trophic groups, the biomass results are represented as percent changes from a conditional unfished biomass, in which Atlantic Menhaden are not fished but the fishing mortalities for all other groups remain constant. Trends in equilibrium catch as a function of fishing mortality were evaluated relative to the F scenario that generated the greatest catch for the species, such that the maximum Ci took a value of 1. We focused on relative differences in B and C for the Atlantic Menhaden and three of its commercially fished predators (Striped Bass, Weakfish, and Bluefish) because they are of distinct management interest and are included in an MSVPA model for Atlantic Menhaden (SEDAR Citation2015).
The other three indicators examined the effects of Atlantic Menhaden fishing on the broader ecosystem structure and included the percentage of trophic groups that were negatively impacted, the percentage of trophic groups that were positively impacted, and prey-to-predator biomass ratios (PPRs). For each Atlantic Menhaden fishing scenario, we calculated the percentage of all aggregated trophic groups (n = 48) whose biomass would be either negatively or positively impacted by 25% or 50% relative to the Fmed.menh = 0 scenario. We defined IG+25% and IG+50% as the impacted groups with biomass increases of ≥25% and ≥50%, respectively, relative to the Fmed.menh = 0 scenario. Likewise, IG–25% and IG–50% refer to the percentages of groups declining by those same amounts. Lastly, the equilibrium PPRs were calculated between Atlantic Menhaden and each of the three MSVPA predators (Striped Bass, Weakfish, and Bluefish) by dividing the Atlantic Menhaden biomass by each predator’s biomass. The PPR values were calculated for all Atlantic Menhaden fishing scenarios and were standardized by dividing by the PPR for the Fmed.menh = 0 scenario.
Next, we conducted stochastic Monte Carlo (MC) simulations to evaluate the uncertainty and sensitivity of model projections to Ecopath input values. For each fishing scenario, 100 MC simulations were conducted in which the Ecopath parameters were resampled from a uniform distribution centered on the base model values, with lower and upper bounds set by a value equal to twice the coefficient of variation. For each MC run, up to 10,000 trials were attempted until a balanced model was obtained from the resampled parameters; simulations were only conducted with balanced models. We conducted the sensitivity analyses using the “Monte Carlo simulation” tool in Ecopath with Ecosim software. We resampled the B-parameter with a coefficient of variation of 0.2 to examine uncertainty for that parameter, which tends to be more influential in Ecopath predictions (Essington Citation2007). The calculation of relative differences in B (relative to the Fmed.menh = 0 scenario) and C (relative to the scenario with maximum C) was accomplished using the median of the B- and C-values of the MC runs for the appropriate F scenario.
Evaluation of candidate ecological reference points
Using the NWACS model simulations, we compared the ecosystem effects of some specific F- and B-based reference points that have been proposed for Atlantic Menhaden or for forage species generally. These reference points do not constitute an exhaustive list but rather reflect a range of values to demonstrate potential patterns in ecosystem trade-offs.
We evaluated two biomass-based reference points that are relative to unfished biomass: 40%B0 and 75%B0. The 40%B0 reference point was recommended by Pikitch et al. (Citation2012) as a limit for a forage species that has an intermediate amount of data and information to support its assessment; 75%B0 is a general reference point that has been used for management of krill in the Antarctic (Constable et al. Citation2000) and has been evaluated in other studies (Smith et al. Citation2011; Pikitch et al. Citation2012).
We evaluated four different reference points for Atlantic Menhaden fishing rates: F for MSY of Atlantic Menhaden (FMSY); 0.5FMSY, which has been suggested as a general reference point for forage fish (Pikitch et al. Citation2012); and proxies for the target F (FSS-target*) and threshold F (FSS-threshold*) from the ASMFC’s single-species assessment for Atlantic Menhaden (SEDAR Citation2015). The FMSY was approximated by using the NWACS Fmed.menh scenario that generated the greatest equilibrium Atlantic Menhaden catch, with an estimate of FMSY = 0.8/year. Pikitch et al. (Citation2012) recommended using 0.5FMSY as the fishing mortality limit reference point for any forage species designated as belonging to an “intermediate information tier,” which is an appropriate information level for Atlantic Menhaden. Given the differences in model structure between our model and the Atlantic Menhaden stock assessment, we developed proxies for the current target and threshold F-values used in management. The single-species target and threshold F reference points used for management are calculated based on the geometric mean of fishing mortalities for ages 2–4 (FGM2–4), with a single-species target F equal to 0.38/year and a threshold F equal to 1.26/year (SEDAR Citation2015). We used a linear regression of Fmed.menh versus FGM2–4 from 1982–2013 to develop proxies for the single-species reference points that were more compatible with the ecosystem model, which uses biomass-based measures of F = C/B (Appendix 1). The target and threshold single-species reference point proxies were estimated as follows: FSS-target* = 0.29/year and FSS-threshold* = 0.58/year. This rescaling of single-species reference points is affected by the biomass distribution across ages for Atlantic Menhaden in different years, the different methods used to estimate F, and the uncertainty in the linear regression; these proxies are approximations used for comparative purposes only.
RESULTS
Model Fits
The balanced Ecopath food web was highly interconnected and complex, with a total of 989 trophic links in the system and an average of 16.2 links per trophic group. Atlantic Menhaden were consumed by a total of 22 predator groups (36% of the modeled trophic groups), and they contributed a substantial portion of the diets of some predators, notably 30% for large Striped Bass and 33% for nearshore piscivorous birds ().
FIGURE 2. Contributions of Atlantic Menhaden to the diets of predators in the balanced Northwest Atlantic continental shelf Ecopath model (stanzas: small [S], medium [M], and large [L]; HMS = highly migratory species; pisc. = piscivorous).
![FIGURE 2. Contributions of Atlantic Menhaden to the diets of predators in the balanced Northwest Atlantic continental shelf Ecopath model (stanzas: small [S], medium [M], and large [L]; HMS = highly migratory species; pisc. = piscivorous).](/cms/asset/69834f64-fb16-4b2b-adfd-833b1c765126/umcf_a_1360420_f0002_b.gif)
Ecosim predictions from 1982 to 2013 corresponded well to observed historical trends in biomass (). For some groups (e.g., squid, Butterfish Peprilus triacanthus, and demersal piscivores), there was little contrast (or high interannual variability) in the observed time series, and thus the Ecosim predictions were relatively flat. In other cases, the model did not predict the observed steep biomass changes at the bounds of the time series (e.g., Atlantic Mackerel and large Bluefish).
FIGURE 3. Biomass (metric tons [mt] per km2) fits for the ecosystem model of the Northwest Atlantic continental shelf. Lines depict the predicted biomass estimates by year; points depict the time series of relative biomass from stock assessments and fisheries surveys. Panels are labeled by trophic group number, abbreviation, and stanza (small [S], medium [M], and large [L]) if applicable (trophic groups: 15 = shrimp and similar species; 17 = Atlantic Herring; 19, 20, 21 = Atlantic Menhaden; 23 = Atlantic Mackerel; 24 = squid; 25 = Butterfish; 27, 28, 29 = Bluefish; 30, 31, 32 = Striped Bass; 34, 35 = Weakfish; 36, 37 = Spiny Dogfish; 38, 39, 40 = Atlantic Cod; 41 = Haddock Melanogrammus aeglefinus; 42 = hakes; 43 = Atlantic Croaker Micropogonias undulatus; 45 = Yellowtail Flounder Limanda ferruginea; 46, 47 = Summer Flounder; 48 = skates; 49 = demersal benthivores–other; 50 = demersal piscivores–other). Trophic groups without observed empirical data are excluded.
![FIGURE 3. Biomass (metric tons [mt] per km2) fits for the ecosystem model of the Northwest Atlantic continental shelf. Lines depict the predicted biomass estimates by year; points depict the time series of relative biomass from stock assessments and fisheries surveys. Panels are labeled by trophic group number, abbreviation, and stanza (small [S], medium [M], and large [L]) if applicable (trophic groups: 15 = shrimp and similar species; 17 = Atlantic Herring; 19, 20, 21 = Atlantic Menhaden; 23 = Atlantic Mackerel; 24 = squid; 25 = Butterfish; 27, 28, 29 = Bluefish; 30, 31, 32 = Striped Bass; 34, 35 = Weakfish; 36, 37 = Spiny Dogfish; 38, 39, 40 = Atlantic Cod; 41 = Haddock Melanogrammus aeglefinus; 42 = hakes; 43 = Atlantic Croaker Micropogonias undulatus; 45 = Yellowtail Flounder Limanda ferruginea; 46, 47 = Summer Flounder; 48 = skates; 49 = demersal benthivores–other; 50 = demersal piscivores–other). Trophic groups without observed empirical data are excluded.](/cms/asset/4a0b666e-e3b9-4d1c-9d63-d409b883ea32/umcf_a_1360420_f0003_oc.jpg)
There was a greater diversity in model fits to the catch time series (). Catches for many groups were predicted well (e.g., macrobenthos–molluscs, megabenthos–other, large Bluefish, large Striped Bass, medium Weakfish, small Atlantic Cod, and demersal piscivores). In several cases, model predictions matched the patterns but not the scale or vice versa (; e.g., megabenthos–filterers, Atlantic Herring, medium Atlantic Menhaden, large Atlantic Menhaden, large Weakfish, hakes, and highly migratory species). For some groups (e.g., shrimp, alosines, skates, coastal sharks, and pelagic sharks), both the scale and pattern of simulations deviated from the observed catches. In many cases of poor model fit, the lack of fit was partly attributable to an absence of detailed information on fishing mortality for these groups. For many of these groups, fishing pressure was forced in the model by using patterns of fishing effort from generalized fleets (that capture numerous groups) rather than being forced with a group-specific fishing mortality.
FIGURE 4. Catch (metric tons [mt] per km2) fits for the ecosystem model of the Northwest Atlantic continental shelf. Observed (points) and predicted (lines) catch estimates by year are presented. Panels are labeled by trophic group number, abbreviation, and stanza (small [S], medium [M], and large [L]) if applicable (trophic groups: 11 = macrobenthos–molluscs; 13 = megabenthos–filterers; 14 = megabenthos–other; 15 = shrimp and similar species; 17 = Atlantic Herring; 18 = alosines; 19, 20, 21 = Atlantic Menhaden; 23 = Atlantic Mackerel; 24 = squid; 25 = Butterfish; 26 = small pelagic–other; 27, 28, 29 = Bluefish; 31, 32 = Striped Bass; 34, 35 = Weakfish; 37 = Spiny Dogfish; 38, 39, 40 = Atlantic Cod; 41 = Haddock; 42 = hakes; 43 = Atlantic Croaker; 45 = Yellowtail Flounder; 46, 47 = Summer Flounder; 48 = skates; 49 = demersal benthivores–other; 50 = demersal piscivores–other; 51 = demersal omnivores–other; 52 = medium pelagic–other; 53 = sharks–coastal; 54 = sharks–pelagic; 55 = large pelagics [highly migratory species]). Trophic groups without observed empirical data are excluded.
![FIGURE 4. Catch (metric tons [mt] per km2) fits for the ecosystem model of the Northwest Atlantic continental shelf. Observed (points) and predicted (lines) catch estimates by year are presented. Panels are labeled by trophic group number, abbreviation, and stanza (small [S], medium [M], and large [L]) if applicable (trophic groups: 11 = macrobenthos–molluscs; 13 = megabenthos–filterers; 14 = megabenthos–other; 15 = shrimp and similar species; 17 = Atlantic Herring; 18 = alosines; 19, 20, 21 = Atlantic Menhaden; 23 = Atlantic Mackerel; 24 = squid; 25 = Butterfish; 26 = small pelagic–other; 27, 28, 29 = Bluefish; 31, 32 = Striped Bass; 34, 35 = Weakfish; 37 = Spiny Dogfish; 38, 39, 40 = Atlantic Cod; 41 = Haddock; 42 = hakes; 43 = Atlantic Croaker; 45 = Yellowtail Flounder; 46, 47 = Summer Flounder; 48 = skates; 49 = demersal benthivores–other; 50 = demersal piscivores–other; 51 = demersal omnivores–other; 52 = medium pelagic–other; 53 = sharks–coastal; 54 = sharks–pelagic; 55 = large pelagics [highly migratory species]). Trophic groups without observed empirical data are excluded.](/cms/asset/9c20039c-8dd4-4aec-9e11-b2646bf9ee8d/umcf_a_1360420_f0004_oc.jpg)
Simulation Results
Simulated, projected total Atlantic Menhaden biomass responded quickly to changes in Atlantic Menhaden F-values beginning in 2014, the first year of the projection (). When not exploited, total Atlantic Menhaden biomass increased by 32% over the 2013 biomass of 11.0 metric tons/km2 in the base model. As expected, increasing Fmed.menh values above zero led to progressively lower projected biomasses of Atlantic Menhaden (). The Striped Bass was one of the species whose biomass was affected most by changes in the level of Atlantic Menhaden fishing, with the 2013 predicted biomass of Striped Bass (0.39 metric tons/km2) decreasing by 92% in the Fmed.menh = 1.6 scenario ().
FIGURE 5. Simulated trajectories of total Atlantic Menhaden biomass (metric tons [mt] per km2) under different future projections of fishing mortality for medium-stanza Atlantic Menhaden (Fmed.menh = 0–1.6/year) starting in 2014. Lines are model projections; points represent the time series of relative biomass from the Atlantic Menhaden stock assessments.
![FIGURE 5. Simulated trajectories of total Atlantic Menhaden biomass (metric tons [mt] per km2) under different future projections of fishing mortality for medium-stanza Atlantic Menhaden (Fmed.menh = 0–1.6/year) starting in 2014. Lines are model projections; points represent the time series of relative biomass from the Atlantic Menhaden stock assessments.](/cms/asset/be9d307a-a301-4480-b5c7-0bbc1fc2b979/umcf_a_1360420_f0005_oc.jpg)
FIGURE 6. Simulated trajectories of total Striped Bass biomass (metric tons [mt] per km2) under different future projections of fishing mortality for medium-stanza Atlantic Menhaden (Fmed.menh = 0–1.6/year) starting in 2014. Lines are model projections; points represent the time series of relative biomass from the Striped Bass stock assessments.
![FIGURE 6. Simulated trajectories of total Striped Bass biomass (metric tons [mt] per km2) under different future projections of fishing mortality for medium-stanza Atlantic Menhaden (Fmed.menh = 0–1.6/year) starting in 2014. Lines are model projections; points represent the time series of relative biomass from the Striped Bass stock assessments.](/cms/asset/9e77107f-8c85-40a9-a4fe-40d2abea8e28/umcf_a_1360420_f0006_oc.jpg)
Changes in relative biomass (at the end of the 50-year simulation) demonstrated the variable responses of other modeled groups to a scenario of high Atlantic Menhaden fishing mortality (). Aside from Atlantic Menhaden, the nearshore piscivorous birds, Striped Bass, highly migratory species, and coastal sharks experienced larger decreases in B based on the Fmed.menh = 1.2 scenario relative to the Fmed.menh = 0 scenario (). Most of these groups tended to have a greater reliance on Atlantic Menhaden as prey, indicating a bottom-up effect on predator production. Medium pelagics, Atlantic Cod, anchovies, and alosines benefited the most from reductions in Atlantic Menhaden biomass, likely resulting from indirect interactions in the food web.
FIGURE 7. Biomass of each trophic group for the scenario in which fishing mortality of medium-stanza Atlantic Menhaden (Fmed.menh) was equal to 1.20/year relative to each group’s biomass at Fmed.menh = 0/year (trophic groups: MacroB-poly = macrobenthos–polychaetes; Yflound = Yellowtail Flounder; MegaB-filt = megabenthos–filterers; MacroB-oth = macrobenthos–other; MacroB-moll = macrobenthos–molluscs; MacroB-crus = macrobenthos–crustaceans; Bact = bacteria; Herring = Atlantic Herring; Hake = hakes; Blue = Bluefish; Domni-oth = demersal omnivores–other; Weak = Weakfish; Dpisc-oth = demersal piscivores–other; Dbenth-oth = demersal benthivores–other; Odont = odontocetes; Shark-pel = sharks–pelagic; Pinn = pinnipeds; Seabird = seabirds; Shark-coas = sharks–coastal; HMS = large pelagics [highly migratory species]; Sbass = Striped Bass; Shorebird = shorebirds–piscivorous; Menh = Atlantic Menhaden; MedPel = medium pelagic–other; Cod = Atlantic Cod; Anch = anchovies; Croaker = Atlantic Croaker; Sflound = Summer Flounder; SmPel = small pelagic–other; Mack = Atlantic Mackerel; Microzoo = microzooplankton; Dogfish = Spiny Dogfish; PP-oth = primary producers–other; Butter = Butterfish; Mesopel = mesopelagics; MegaB-oth = megabenthos–other; Shrimp = shrimp and similar species; Cop-L = large copepods; Bwhale = baleen whales; Micronek = micronekton; GelZoop = gelatinous zooplankton; Skate = skates; Cop-S = small copepods; Phyto = phytoplankton).
![FIGURE 7. Biomass of each trophic group for the scenario in which fishing mortality of medium-stanza Atlantic Menhaden (Fmed.menh) was equal to 1.20/year relative to each group’s biomass at Fmed.menh = 0/year (trophic groups: MacroB-poly = macrobenthos–polychaetes; Yflound = Yellowtail Flounder; MegaB-filt = megabenthos–filterers; MacroB-oth = macrobenthos–other; MacroB-moll = macrobenthos–molluscs; MacroB-crus = macrobenthos–crustaceans; Bact = bacteria; Herring = Atlantic Herring; Hake = hakes; Blue = Bluefish; Domni-oth = demersal omnivores–other; Weak = Weakfish; Dpisc-oth = demersal piscivores–other; Dbenth-oth = demersal benthivores–other; Odont = odontocetes; Shark-pel = sharks–pelagic; Pinn = pinnipeds; Seabird = seabirds; Shark-coas = sharks–coastal; HMS = large pelagics [highly migratory species]; Sbass = Striped Bass; Shorebird = shorebirds–piscivorous; Menh = Atlantic Menhaden; MedPel = medium pelagic–other; Cod = Atlantic Cod; Anch = anchovies; Croaker = Atlantic Croaker; Sflound = Summer Flounder; SmPel = small pelagic–other; Mack = Atlantic Mackerel; Microzoo = microzooplankton; Dogfish = Spiny Dogfish; PP-oth = primary producers–other; Butter = Butterfish; Mesopel = mesopelagics; MegaB-oth = megabenthos–other; Shrimp = shrimp and similar species; Cop-L = large copepods; Bwhale = baleen whales; Micronek = micronekton; GelZoop = gelatinous zooplankton; Skate = skates; Cop-S = small copepods; Phyto = phytoplankton).](/cms/asset/5e440ec1-7fae-4f72-be67-4cd5c9c15ce4/umcf_a_1360420_f0007_b.gif)
Atlantic Menhaden fishing levels created the strongest effects in yields of Atlantic Menhaden and Striped Bass, particularly at higher fishing rates (). Most of the other fisheries for which time series of F were available experienced relatively small changes in yield (<10%) across different Fmed.menh scenarios, with broad uncertainty ranges.
FIGURE 8. Fishery yields of select trophic groups for the scenario in which fishing mortality of medium-stanza Atlantic Menhaden (Fmed.menh) was equal to 1.20/year relative to each group’s respective maximum fishery yield. Only species whose catches were driven by fishing mortality rates from stock assessments (as opposed to being driven by fishing effort more generally) are shown (trophic groups: Butter = Butterfish; Yflound = Yellowtail Flounder; Dogfish = Spiny Dogfish; Mack = Atlantic Mackerel; Herring = Atlantic Herring; Hake = hakes; Shrimp = shrimp and similar species; Sflound = Summer Flounder; Croaker = Atlantic Croaker; Cod = Atlantic Cod; Blue = Bluefish; Weak = Weakfish; Menh = Atlantic Menhaden; Sbass = Striped Bass).
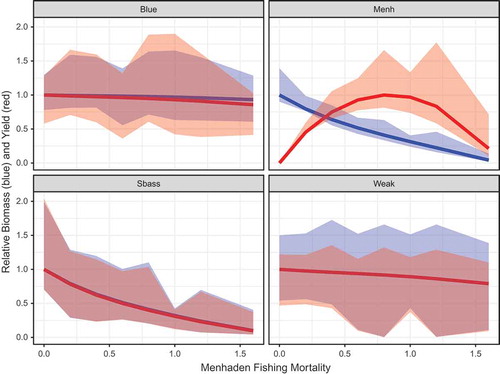
The relative changes in B and C for Atlantic Menhaden and the predators that were included in the MSVPA (Striped Bass, Bluefish, and Weakfish) were visualized as a function of the different Atlantic Menhaden F scenarios. Atlantic Menhaden experienced a steep decline in biomass with increasing F, declining to 4% at Fmed.menh = 1.6/year (). Atlantic Menhaden yield peaked at Fmed.menh = 0.8/year, signifying FMSY, but the uncertainty in C increased at Fmed.menh values greater than 0.6/year () due to a greater number of large outliers in the MC runs. Of the predators in the MSVPA, only Striped Bass exhibited notable changes in response to the level of Atlantic Menhaden fishing. As Atlantic Menhaden biomass in the system declined, Striped Bass B and C declined to approximately 10% relative to the levels at Fmed.menh = 0/year (). Bluefish and Weakfish had relatively stable B and C that were not as strongly dependent on Atlantic Menhaden F, declining by 7% and 21%, respectively, over the simulated range of Fmed.menh.
FIGURE 9. Simulated relative biomass and fishery yields of key trophic groups over a range of fishing mortality rate scenarios for medium-stanza Atlantic Menhaden (Fmed.menh). Relative biomass (in blue) was calculated in reference to the scenario of Fmed.menh = 0/year, and relative yield (in red) was calculated relative to the group’s maximum value. Panels represent Bluefish (Blue), Atlantic Menhaden (Menh), Striped Bass (Sbass), and Weakfish (Weak) values for all stanzas (small, medium, and large) combined. Colored shading depicts the 90% interquantile range (which excludes the upper and lower 5%) of Monte Carlo runs at each level of F.
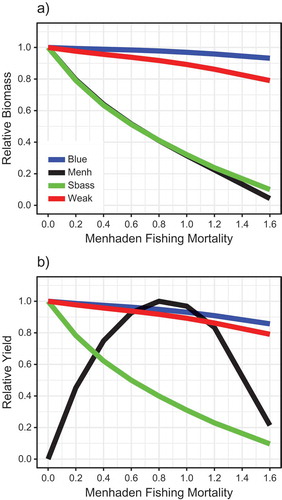
Overlaying the relative biomass and catch curves for Atlantic Menhaden and the three predators conveys the tradeoffs associated with different simulated fishing strategies on Atlantic Menhaden (). For example, if Atlantic Menhaden are fished at their approximate FMSY (i.e., Fmed.menh = 0.8/year), Striped Bass yield and Striped Bass biomass are predicted to be 40% and 41%, respectively, of the levels expected with no fishing on Atlantic Menhaden (). For a different, biomass-based perspective of the tradeoffs, relative biomass and catch were expressed as a function of the relative Atlantic Menhaden biomass (%B0; ). Atlantic Menhaden BMSY was estimated to be at 0.41B0. Striped Bass biomass and yield declined essentially linearly as Atlantic Menhaden B was reduced from B0 (). Bluefish and Weakfish exhibited smaller declines in B and C ranging from 7% to 21%.
FIGURE 10. Simulated (a) relative biomass and (b) relative yield for Atlantic Menhaden and three predators as functions of fishing mortality scenarios for medium-stanza Atlantic Menhaden. Colored lines represent Bluefish (Blue), Atlantic Menhaden (Menh), Striped Bass (Sbass), and Weakfish (Weak), as labeled in panel a.
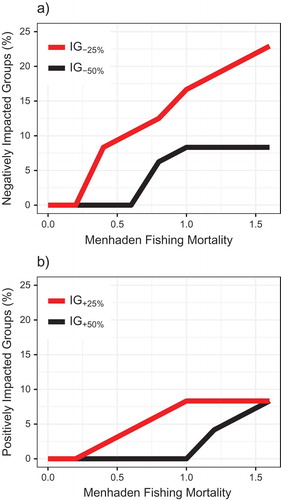
The NWACS model output indicated that increases in Atlantic Menhaden fishing rates affected ecosystem structure. Biomasses of some trophic groups decreased and others increased as fishing on Atlantic Menhaden intensified and as Atlantic Menhaden biomass declined. Up to 23% of groups were negatively impacted by ≥25% (IG–25% = 23%), and up to 8% of all groups declined by ≥50% as Atlantic Menhaden biomass was removed from the system (). The IG–25% increased nearly linearly as Atlantic Menhaden fishing increased, whereas IG–50% stabilized at Fmed.menh values exceeding 1.0 () or at B-values less than 30%B0 (). At the approximate Atlantic Menhaden FMSY, the IG–25% was predicted to be 13% (n = 6 groups, including Atlantic Menhaden, Striped Bass, birds, and other apex predators; ). Some groups were positively impacted by removals of Atlantic Menhaden from the system, with IG+25% = 8% (n = 4 groups, including medium pelagics, Atlantic Cod, anchovies, and alosines) for the highest-F scenario (). However, the percentage of groups that benefited from removal of Atlantic Menhaden was smaller than the percentage of groups that were negatively affected.
FIGURE 11. Percentages of (a) negatively impacted groups and (b) positively impacted groups resulting from different scenarios of fishing mortality for medium-stanza Atlantic Menhaden (Fmed.menh). Impacted groups (as a percentage of all n = 48 aggregated trophic groups) were defined as groups whose biomass decreased by ≥25% (IG–25%) or ≥50% (IG–50%) or groups whose biomass increased by ≥25% (IG+25%) or ≥50% (IG+50%) relative to the scenario of Fmed.menh = 0/year. Note that each trophic group with multiple stanzas (e.g., small, medium, and large Atlantic Menhaden) was combined and treated as a single aggregated group.
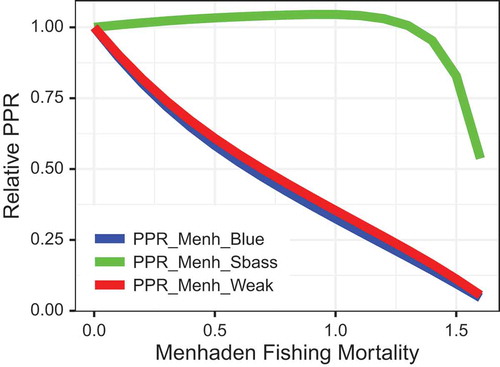
Prey-to-predator ratios () differed depending on the specific predator, a consequence of the contrasting responses of each predator to Atlantic Menhaden fishing (). The PPR for Striped Bass (whose B decreased with increases in Atlantic Menhaden fishing) remained near 1 as Fmed.menh increased, but the PPR crashed at high values of F (). On the other hand, the PPRs for Bluefish and Weakfish (whose B levels were not as strongly tied to Atlantic Menhaden fishing) were nearly linearly related to Atlantic Menhaden F () and Atlantic Menhaden B ().
FIGURE 12. Prey-to-predator ratios (PPRs) for select groups as a function of fishing mortality for medium-stanza Atlantic Menhaden (Fmed.menh). The PPR is plotted for Atlantic Menhaden as prey and Bluefish (blue line), Striped Bass (green line), and Weakfish (red line) as predators. All PPRs were scaled to have a value of 1 at Fmed.menh = 0/year.
We evaluated six potential Atlantic Menhaden reference points in an ecosystem context (). Of the four F reference points examined, the FSS-target* and 0.5FMSY were the most conservative. The FSS-target* reference point conserved 73% of Atlantic Menhaden biomass in the system and 72% of Striped Bass B relative to the Fmed.menh = 0 scenario. At FSS-target*, Atlantic Menhaden and Striped Bass catches would be 59% and 71% of their respective MSYs. Bluefish and Weakfish B and C remained relatively stable (92–99%) across all reference point alternatives. Atlantic Menhaden F reference point options yielded an approximately threefold difference (4–13%) in terms of the percentage of groups with biomass decreases of over 25%, but groups were not negatively affected by over 50% except at the least conservative FMSY reference point (). Effects associated with the Atlantic Menhaden biomass-based reference points of 75%B0 and 40%B0 were nearly identical to the effects at FSS-target* and FMSY, respectively, and represented the range of ecosystem effects from most to least conservative.
TABLE 1. Effects of Atlantic Menhaden fishing mortality (F) and biomass (B) reference points on three types of ecosystem indicators. See Methods text for a description of the reference points. Fishing mortality rates (per year) associated with each reference point are indicated within parentheses. Relative biomass for each species was defined as the biomass for the given F scenario divided by the biomass for the F = 0 scenario; thus, the relative biomass for Atlantic Menhaden is equivalent to B/B0, where B0 is the unfished biomass. Yield was calculated relative to the maximum yield attained.
DISCUSSION
Fisheries managers and scientists continue to explore methods for integrating ecosystem considerations and objectives into management (Link Citation2010a; Fogarty Citation2014; Essington et al. Citation2016). Ecosystem models, such as the EwE model we developed here, can serve as a platform for generating and evaluating ERPs and quantifying the tradeoffs of different management strategies. In this study, the NWACS model was used to quantify possible tradeoffs in population biomasses, fishery yields, and ecosystem structure caused by varying intensity of the Atlantic Menhaden fishery. Simulations suggested that among the commercially exploited species, Striped Bass may be the most sensitive to changes in Atlantic Menhaden fishing. Many higher-trophic-level groups that are less well studied or less well understood (e.g., birds, highly migratory species, sharks, and marine mammals) were also negatively affected by increased fishing on Atlantic Menhaden. A smaller fraction of the modeled groups exhibited increases in biomass as a result of increased fishing pressure on Atlantic Menhaden, demonstrating possible indirect consequences of reduced competition or predatory release. We compared a range of possible F-based and B-based ERPs, demonstrating alternative ecosystem effects that managers should consider in an EAFM context. The inherent complexities and limited understanding of ecosystem processes can be a substantial source of uncertainty, as we demonstrated in stochastic simulations of the model. Despite uncertainty, ecosystem models are helpful in evaluating hypotheses regarding ecosystem dynamics by directing attention to specific key research questions, and they can help managers understand inherent ecosystem trade-offs when they establish management reference points.
The NWACS model suggested a strong coupling of Striped Bass dynamics to Atlantic Menhaden. The Striped Bass is often a focal species of concern in discussions of the Atlantic Menhaden’s ecosystem service of provisioning for predators, and numerous studies have focused on the interaction of these two species (Walter and Austin Citation2001; Griffin and Margraf Citation2003; Pruell et al. Citation2003; Overton et al. Citation2015). The large dietary reliance of Striped Bass on Atlantic Menhaden favors the possibility of strong interactions and supports the possibility of Striped Bass sensitivity. Not surprisingly, a meta-analysis of ecosystem models indicated that predators with a greater dependence on a given prey species will experience greater declines in biomass as the food item is removed (Pikitch et al. Citation2012). Atlantic Menhaden comprised 30% of the diet for large Striped Bass in our model, yet this contribution can be substantially higher in some regions or seasons (Walter and Austin Citation2001; Griffin and Margraf Citation2003; Overton et al. Citation2015). Additionally, there is some evidence of long-term shifts (from the 1950s to recent decades) in Striped Bass diets from pelagic fishes (like Atlantic Menhaden) to benthic invertebrates, likely due to coastal eutrophication and changes in relative prey availability (Griffin and Margraf Citation2003; Hartman and Margraf Citation2003; Pruell et al. Citation2003; Overton et al. Citation2015). These studies also highlight the trophic adaptability that allows fishes to switch to alternative prey—albeit with potential consequences for predator health and body condition, as in the case of Striped Bass.
The strong relationship between Striped Bass and Atlantic Menhaden populations was heavily influenced by the high modeled vulnerability values, which were required to replicate the dramatic recovery of Striped Bass in the late 1980s. Although the importance of Atlantic Menhaden in the diets of Striped Bass has been documented (Walter and Austin Citation2001; Griffin and Margraf Citation2003; Buchheister and Latour Citation2015; Overton et al. Citation2015), strong evidence for a tight coupling of dynamics between Atlantic Menhaden and Striped Bass populations at broad regional or temporal scales is lacking. Wood and Austin (Citation2009) found that recruitment of the two species was negatively correlated, apparently due to climatic factors, but the consequences of this negative correlation for later life history stages have not been explored. Some researchers argue that there is little empirical evidence in general for strong connections between forage fish abundance and the rate of change in abundance of their predators in the USA (Hilborn et al. Citation2017; but see also Pikitch et al., Citationin press). In our model, the parameterizations and coupling of the two species explained the observed historical recovery of Striped Bass, invoking trophic dynamics and fishing as the underlying mechanisms for recovery. Our results suggest that strong underlying predator–prey linkages in a food web can be obscured in empirical data and analyses due to the complexity of interactions in the system. Future analyses could use the NWACS model to evaluate other hypotheses (e.g., environmental drivers or shifts in survival or productivity) as alternative or contributing mechanisms for Striped Bass recovery.
Bluefish and Weakfish are commercially and recreationally important predators of interest for management. However, these two species displayed only weak to moderate responses to increased Atlantic Menhaden fishing. The negligible response by Bluefish can be largely attributed to the low contribution of Atlantic Menhaden to their diets in the model. Atlantic Menhaden can comprise a large fraction (e.g., ~60%) of the Bluefish diet, particularly in estuarine waters during certain seasons (Hartman and Brandt Citation1995; Scharf et al. Citation2004; Buchheister and Latour Citation2015), but the diet fractions were substantially lower (<2%) based on the large-scale NEAMAP and NEFSC trawl surveys on the continental shelf. Spatial and temporal differences in diets and abundances can have bearing on local dynamics, but the NWACS model focused on population-scale changes. Weakfish also can have large diet contributions from Atlantic Menhaden in estuaries (Hartman and Brandt Citation1995; Buchheister and Latour Citation2015), but these contributions are greatly diluted by the low consumption of Atlantic Menhaden in other regions.
The Atlantic Menhaden population supports many predators and thus experiences predation mortality distributed across numerous trophic groups. The current Atlantic Menhaden MSVPA accounts for mortality from Striped Bass, Bluefish, and Weakfish, but in the NWACS model these three predators only accounted for 12–34% of Atlantic Menhaden predation mortality depending on the life stage stanza examined. This suggests that Atlantic Menhaden predation mortality is more diffuse than accounted for in the MSVPA approach. Such diffuse predation is demonstrated in other systems as well, particularly in marine food webs that tend to be highly connected with few strong interactions (Link Citation2002; Pikitch et al. Citation2012). The NWACS model suggests that the impact on Atlantic Menhaden from aggregate fish groups (e.g., demersal piscivores and omnivores) and apex predators (e.g., birds, sharks, highly migratory species, and marine mammals) is substantial. However, these groups include taxa for which model parameters are less reliable (relative to fish groups), particularly B, P/B, and diet compositions. For example, the nearshore piscivorous birds, including great blue herons Ardea herodias, bald eagles Haliaeetus leucocephalus, brown pelicans Pelecanus occidentalis, cormorants, and osprey Pandion haliaetus, have the capacity to consume large amounts of prey per capita due to higher metabolism and Q/B. However, their coastal biomass and diet dependencies have not been well quantified (Bryan Watts, College of William and Mary, personal communication).
Those same upper-trophic-level predators were among the most sensitive groups to the Atlantic Menhaden fishing mortality scenarios, emphasizing their connectivity and reliance on the supply of forage fish like Atlantic Menhaden. Other studies have shown similar sensitivity of seabirds to changes in forage fish abundance and management (Cury et al. Citation2011; Pikitch et al. Citation2012; Dickey-Collas et al. Citation2014). For example, Cury et al. (Citation2011) analyzed empirical data for 14 bird species and 7 ecosystems and demonstrated a threshold-like response of bird productivity that declined dramatically if the biomass of their forage fish prey declined below about 33% of their maxima (i.e., B0).
Reference Points
General management strategies have been proposed for forage species (Pikitch et al. Citation2012; Rice and Duplisea Citation2014). For example, management can be based on minimum escapement goals or biomass thresholds, temporal or spatial closures, harvest protection for sensitive species, or balanced harvesting of all ecosystem components (Pikitch et al. Citation2012; Rice and Duplisea Citation2014). In this study, we focused on management strategies using fixed F-values (e.g., as a proportion of FMSY) and B as a fraction of B0, as these approaches may be the easiest to integrate into current Atlantic Menhaden and forage fish management. Such reference points could also be incorporated into more detailed harvest control rules that account for dynamic changes in stock status (Pikitch et al. Citation2012).
Incorporating ecosystem considerations into forage fish management necessitates a prioritization of competing objectives, such as sustaining a targeted fishery for forage fish or supporting predator populations via reduced fishing pressure on forage species. Importantly, this prioritization results not from a scientific evaluation but from a socio-economic and ecological policy evaluation. However, the F and B reference points we examined represent a range of potential management objectives that might differentially prioritize Atlantic Menhaden landings and their role as forage. Based on the NWACS model, the proxy for the current single-species target F for Atlantic Menhaden (FSS-target* = 0.29/year) was comparable to the 75%B0 reference point (F75%B0 = 0.26/year), which was the most conservative reference point evaluated.
A challenge for integrating our ecosystem modeling results into the established fisheries management framework requires translating across the differences in model structure and magnitudes of predictions as well as understanding the limitations of each approach. For example, the estimate of Atlantic Menhaden B0 from our NWACS model (3,609 thousand metric tons [kmt]) was only 14.8% greater than B0 from the single-species model (3,144 kmt; Amy Schueller, NOAA, personal communication), suggesting some comparability between the two models. However, the respective levels of Atlantic Menhaden biomass depletion estimated in 2013 (B2013/B0) differed more substantially between the two models. The NWACS model estimated B2013/B0 = 0.75, but the stock assessment’s single-species model estimated B2013/B0 = 0.43. The two modeling approaches also differed in the degree to which they matched the Atlantic Menhaden catch time series. Single-species statistical catch-at-age models are typically structured to match observed catches closely, but they may fit fishery-independent time series less well. In contrast, ecosystem models balance fitting time series for many species, and this contributed to the poorer fit to the Atlantic Menhaden catch time series in our EwE model. In addition to these differences, the single-species assessment model was unable to estimate a reliable FMSY value, in part because it models Atlantic Menhaden recruitment as deviations from a median value due to a weak stock–recruit relationship (Amy Schueller, NOAA, personal communication). In contrast, we could estimate FMSY in the EwE framework, although it was sensitive to the vulnerability parameters. Importantly, the lack of an FMSY estimate in the single-species assessment model hindered our ability to scale the reference points to FMSY, which would have facilitated model comparisons. To address this problem, we developed proxies for the target F and threshold F used in Atlantic Menhaden management. Unfortunately, this approach was less than ideal because the relationship between our proxies and the single-species reference points varied depending on the age structure of the population (Appendix 1). This, along with the scale differences in the Atlantic Menhaden catch and the sensitivity of FMSY to the vulnerabilities, may have contributed to our FMSY estimate (FMSY = 0.8/year) being greater than the proxy for the single-species threshold F (FSS-threshold* = 0.58/year). These differences between the NWACS model and the single-species stock assessment model (SEDAR Citation2015) should be investigated in future research.
Indicators for Ecosystem Approaches to Fisheries Management and Ecosystem-Based Fisheries Management
Our model simulations provided insight into the responsiveness of different indicators to changes in Atlantic Menhaden fishing pressure. Many indicators have been proposed, with varying performances and utility in differing situations (e.g., Rice and Rochet Citation2005; Methratta and Link Citation2006; Shin and Shannon Citation2010). Of the indicators we selected, differences in biomass and yield tended to be the most responsive to simulation scenarios, and they would also be the most meaningful for managers. The percentages of positively impacted groups (IG+25%, IG+50%) and negatively impacted groups (IG–25%, IG–50%) provided some contrast across our scenarios, but IG–25% was the single metric exhibiting the greatest change over the evaluated scenarios. The other metrics (IG+25%, IG+50%, and IG–50%) tended to be less responsive to greater F-values or they exhibited more muted responses. This finding suggests that the number of “losers” may be greater than the number of “winners” attributable to fisheries-induced declines in forage fish biomass.
The patterns in equilibrium PPR for three different predators highlighted some of the challenges of using PPR as an indicator for EAFM. The PPR is typically used as an index of relative prey availability and ecosystem health. However, the PPR may be “hyperstable” for predators that are strongly linked to changes in their prey (e.g., Striped Bass in the model simulations), meaning that PPR may decline slowly (or not at all) as prey biomass drops from B0 levels, but then PPR may decline rapidly at lower prey biomass levels or higher forage fish F (, ). In other words, a high PPR can mask declining food availability for a predator whose reproductive numerical response is tied to the prey. This pattern was not observed with PPRs for Weakfish and Bluefish, whose biomasses were less affected by Atlantic Menhaden fishing. Thus, interpretation of PPRs using empirical data is difficult when the reproductive numerical responses of predators relative to changes in prey biomass or ecosystem structure are poorly understood (Hunsicker et al. Citation2011). This suggests that empirical PPR estimates over short time periods—over which reproductive responses may not be expressed—may be more informative of rapid changes in relative prey abundance. Moreover, the patterns exhibited in our simulations highlight a potentially critical issue with the PPR index: it remained high for the predator group (i.e., Striped Bass) whose biomass was most negatively affected by declining prey biomass. Ultimately, the model results indicate that (1) interpretation of empirical PPR estimates is not straightforward if predator populations are strongly linked to the prey and (2) interpretations should be evaluated in conjunction with the magnitude of predator and prey biomasses. The interpretation of PPR would be further complicated by any independent changes to the predator biomass (e.g., via fishing or habitat degradation).
Sensitivity to Parameters
The NWACS model is a simplification of a complex system, and the model has inevitable process and observation errors (Link et al. Citation2012). The main sources of process error relate to the model’s structural complexity (e.g., number of groups, temporal scale, and spatial dynamics) and to the natural variability in the ecosystem (e.g., spatial and temporal variation in ecological conditions). Observation errors in the data to which the model was fit are also present. We used MC sensitivity analyses to explore some of these sources of uncertainty, examining the potential effects of Ecopath parameterizations on the model conclusions. The sensitivity analyses demonstrated that the general patterns of individual group responses were maintained, but the particular parameterizations could have substantial impacts on the magnitude of individual responses (e.g., ). Additional sensitivity analyses could be conducted to evaluate more specific, targeted concerns that managers may have, including, for example, the impact of uncertainty in predator diets, vulnerability estimates, or other alternative model parameterizations.
Researchers have emphasized the sensitivity of model predictions to the vulnerability parameters (Christensen and Walters Citation2004; Heymans et al. Citation2016), which we also observed through the Ecosim calibration process. The vulnerability parameters regulate the relative strength of bottom-up and top-down processes on trophic groups and are generated by many different physical, behavioral, and physiological processes. The vulnerabilities can also be interpreted as the maximum predation mortality a predator may exert on a prey divided by the baseline predation mortality from the Ecopath model (Christensen and Walters Citation2004). There are no empirical approaches to directly measure these parameters (Christensen and Walters Citation2004); instead, researchers often rely on searching for vulnerability estimates that provide better fits to available time series, focusing on parameters that generate the greatest changes to the model sum of squares (Heymans et al. Citation2016). This is the approach we used, but we acknowledge that equally valid alternative parameterizations are possible. Heymans et al. (Citation2016) recommended using the comparison of FMSY estimates from EwE models and single-species models to help calibrate vulnerability parameters (which will affect FMSY estimates), but it was not possible to make this comparison for Atlantic Menhaden since there was no FMSY estimate in the single-species assessment.
Management Implications and Conclusions
The NWACS ecosystem model developed here can serve as a tool for managers, stakeholders, and scientists to explore ecosystem tradeoffs and to inform the development of strategic, long-term management decisions. An important step toward an EAFM of Atlantic Menhaden (and other forage species) is to develop operational and quantitative objectives from any strategic goals that have been articulated in FMPs or stakeholder workshops (Essington et al. Citation2016). Given competing interests and uncertainties, this is a challenging process, but it can be facilitated by structured decision-making approaches (e.g., Miller et al. Citation2010; Irwin et al. Citation2011), which could use the NWACS model to explore alternatives dynamically. This study highlights that there will be benefits and downsides to biomasses, yields, and structure across the ecosystem depending on the Atlantic Menhaden fishing rates, but setting a specific target (e.g., 0.5FMSY or 75%B0) must be determined by managers based on prioritized objectives. We focused on F-based and B-based reference points for the EAFM of Atlantic Menhaden because they are more in-line with current single-species management methods; however, in an EBFM context, it is possible to set target reference points for other indicators (e.g., metrics of biodiversity, functional group biomasses and their ratios, total fisheries landings, and mean trophic level of the catch) that more explicitly address system-level components (e.g., Rice and Rochet Citation2005; Methratta and Link Citation2006; Shin and Shannon Citation2010).
The major benefits of the NWACS model for application to EAFM of Atlantic Menhaden are (1) the model was developed specifically for the species and system and accounts for diverse Atlantic Menhaden predators, such as fishes, birds, and marine mammals; (2) it includes age stanzas of key predators and prey to deal with size selectivity in feeding; (3) it accounts for predator–prey feedbacks, which are lacking in most of the alternative models currently being considered by managers (SEDAR Citation2015); (4) it allows for the quantification and evaluation of potential tradeoffs associated with different management decisions; and (5) it can serve as a modeling foundation for adding further complexity. Although single-species models can yield greater precision and detail at finer resolution, they do not explicitly address the ecological tradeoffs and competing objectives that are inherent in any single-species management decision. The strong linkage in the model between Atlantic Menhaden and other predators such as Striped Bass speaks to the potential flaw of managing linked species individually. Our modeling has also highlighted information gaps for avian, marine mammal, and apex predators that could be used to direct future research (Buchheister et al. Citation2017).
We support and urge continued lines of inquiry and model development, building upon our model as a foundation. For example, a next step could be to examine how changes in primary production or environmentally mediated shifts in fish recruitment (e.g., Buchheister et al. Citation2016) may affect ecosystem dynamics (Peck et al. Citation2014; Hilborn et al. Citation2017). We chose to develop a single regional model to reflect the distribution of Atlantic Menhaden and other fishes in the northeast U.S. continental shelf large marine ecosystem, but many of the functional groups in the NWACS model undergo substantial migrations that contribute to spatial heterogeneity within the model domain. Although this is accounted for to some extent by using average diets and fitted vulnerabilities, the NWACS model can be expanded using Ecospace (Christensen and Walters Citation2004) to investigate the spatially explicit consequences of movement, habitat suitabilities, and spatiotemporal overlap of predators, prey, and fisheries. Given that experimentation at an ecosystem scale is not possible, simulation models such as NWACS are required tools for generating predictions of possible ecosystem impacts resulting from fishing and other perturbations.
There are many challenges and uncertainties associated with ecosystem modeling and EAFM (Fogarty Citation2014; Patrick and Link Citation2015). We propose that the NWACS model can contribute strategically to a multifaceted and balanced management approach. The NWACS model is not intended to provide short-term tactical management advice and thus will not replace any single-species or multispecies model. Instead, the NWACS model can provide strategic advice that is focused on broad-scale assessment of directions and patterns of change and can be used with other modeling approaches (e.g., single-species, multispecies, and other ecosystem models) to inform fisheries management (Christensen and Walters Citation2011). Single-species, multispecies, and ecosystem models differ in complexity, and all make varying underlying assumptions related to mortality processes (e.g., compensation, depensation, and predation), size structure, production of recruits, and spatial dynamics that can affect model predictions (Pine et al. Citation2009; Walters et al. Citation2016; Hilborn et al. Citation2017). Multi-model inference and comparisons will be important for evaluating the uncertainties related to the structural complexity of different models and for addressing the robustness of conclusions from each model. Ultimately, the NWACS model and any future iterations of it can serve as a valuable tool to advance a balanced and more comprehensive EAFM of Atlantic Menhaden and other species in the Northwest Atlantic.
ACKNOWLEDGMENTS
We thank all of the researchers, employees, and volunteers who were responsible for developing, operating, and maintaining the numerous surveys and data collection programs we used. We particularly acknowledge scientists who have conducted the NEFSC trawl surveys (especially Sean Lucey and Brian Smith) and NEAMAP (especially Christopher Bonzek) for providing fish biomass and diet estimates. The work of many scientists on the EMAX project provided an excellent starting point for our research, and we thank everyone involved with that effort. We are grateful to the ASMFC Biological Ecological Reference Point working group for its assistance and consultation, particularly members David Chagaris, Howard Townsend, Micah Dean, Genny Nesslage, and Amy Schueller. Michael Frisk, Adrian Jordaan, and Bia Dias contributed through discussions and exchanges of ideas and data. Johanna Heymans, David Chagaris, and Howard Townsend provided helpful reviews of earlier model versions. Funding was provided by the Lenfest Ocean Program (Contract Number 00025536). This is Contribution 5389 from the University of Maryland Center for Environmental Science.
Related Research Data
References
- ASMFC (Atlantic States Marine Fisheries Commission). 2012. Amendment 2 to the Interstate Fishery Management Plan for Atlantic Menhaden. ASMFC, Arlington, Virginia.
- Bonzek, C. F., J. Gartland, D. J. Gauthier, and R. J. Latour. 2015. Data collection and analysis in support of single and multispecies stock assessments in the mid-Atlantic: Northeast Area Monitoring and Assessment Program near shore trawl survey. Virginia Institute of Marine Science, Final Report NA14NMF4540004 to the National Marine Fisheries Service, Northeast Fisheries Science Center and the Mid-Atlantic Fishery Management Council, Gloucester Point.
- Buchheister, A., and R. J. Latour. 2015. Diets and trophic guild structure of a diverse fish assemblage in Chesapeake Bay, USA. Journal of Fish Biology 86:967–992.
- Buchheister, A., T. J. Miller, E. D. Houde, and D. A. Loewensteiner. 2017. Technical documentation of the Northwest Atlantic continental shelf (NWACS) ecosystem model. Report to the Lenfest Ocean Program, Washington, D.C. by the University of Maryland Center for Environmental Sciences, Report TS-694-17, Solomons.
- Buchheister, A., T. J. Miller, E. D. Houde, D. H. Secor, and R. J. Latour. 2016. Spatial and temporal dynamics of Atlantic Menhaden (Brevoortia tyrannus) recruitment in the Northwest Atlantic Ocean. ICES Journal of Marine Science 73:1147–1159.
- Butler, C. M., P. J. Rudershausen, and J. A. Buckel. 2010. Feeding ecology of Atlantic Bluefin Tuna (Thunnus thynnus) in North Carolina: diet, daily ration, and consumption of Atlantic Menhaden (Brevoortia tyrannus). U.S. National Marine Fisheries Service Fishery Bulletin 108:56–69.
- Christensen, V., and C. J. Walters. 2004. Ecopath with Ecosim: methods, capabilities and limitations. Ecological Modelling 172:109–139.
- Christensen, V., and C. J. Walters. 2011. Progress in the use of ecosystem modeling for fisheries management. Pages 189–208 in V. Christensen and J. Maclean, editors. Ecosystem approaches for fisheries management: a global perspective. Cambridge University Press, New York.
- Christensen, V., C. J. Walters, D. Pauly, and R. Forrest. 2008. Ecopath with Ecosim, version 6, user guide. Lenfest Ocean Futures Project, Washington, D.C.
- Coll, M., A. Bundy, and L. J. Shannon. 2009. Ecosystem modelling using the Ecopath with Ecosim approach. Pages 225–291 in B. A. Megrey and E. Moksenss, editors. Computers in fisheries research. Springer, Dordrecht, The Netherlands.
- Collie, J. S., and A. K. DeLong. 1999. Multispecies interactions in the Georges Bank fish community. Pages 187–210 in Ecosystem approaches for fisheries management. University of Alaska Sea Grant, AK-SG-99-01, Fairbanks.
- Constable, A. J., W. K. De La Mare, D. J. Agnew, I. Everson, and D. Miller. 2000. Managing fisheries to conserve the Antarctic marine ecosystem: practical implementation of the Convention on the Conservation of Antarctic Marine Living Resources (CCAMLR). ICES Journal of Marine Science 57:778–791.
- Curti, K. L., J. S. Collie, C. M. Legault, and J. S. Link. 2013. Evaluating the performance of a multispecies statistical catch-at-age model. Canadian Journal of Fisheries and Aquatic Sciences 70:470–484.
- Cury, P. M., I. L. Boyd, S. Bonhommeau, T. Anker-Nilssen, R. J. M. Crawford, R. W. Furness, J. A. Mills, E. J. Murphy, H. Österblom, M. Paleczny, J. F. Piatt, J.-P. Roux, L. Shannon, and W. J. Sydeman. 2011. Global seabird response to forage fish depletion: one-third for the birds. Science 334:1703–1706.
- Dickey-Collas, M., G. H. Engelhard, A. Rindorf, K. Raab, S. Smout, G. Aarts, M. Van Deurs, T. Brunel, A. Hoff, R. A. M. Lauerburg, S. Garthe, K. H. Andersen, F. Scott, T. Van Kooten, D. Beare, and M. A. Peck. 2014. Ecosystem-based management objectives for the North Sea: riding the forage fish rollercoaster. ICES Journal of Marine Science 71:128–142.
- Essington, T. E. 2007. Evaluating the sensitivity of a trophic mass-balance model (Ecopath) to imprecise data inputs. Canadian Journal of Fisheries and Aquatic Sciences 64:628–637.
- Essington, T. E., P. S. Levin, L. Anderson, A. Bundy, C. Carothers, F. Coleman, L. Gerber, J. H. Grabowski, E. Houde, O. Jensen, C. Mollman, K. Rose, J. Sanchirico, and T. Smith. 2016. Building effective fishery ecosystem plans. Lenfest Fishery Ecosystem Task Force, Washington, D.C.
- Fogarty, M. J. 2014. The art of ecosystem-based fishery management. Canadian Journal of Fisheries and Aquatic Sciences 490:479–490.
- Friedland, K. D., D. W. Ahrenholz, J. W. Smith, M. Manning, and J. Ryan. 2006. Sieving functional morphology of the gill raker feeding apparatus of Atlantic Menhaden. Journal of Experimental Zoology 305A:974–985.
- Friedland, K. D., P. D. Lynch, and C. J. Gobler. 2011. Time series mesoscale response of Atlantic Menhaden Brevoortia tyrannus to variation in plankton abundances. Journal of Coastal Research 277:1148–1158.
- Fulton, E. A., J. S. Link, I. C. Kaplan, M. Savina-Rolland, P. Johnson, C. Ainsworth, P. Horne, R. Gorton, R. J. Gamble, A. D. M. Smith, and D. C. Smith. 2011. Lessons in modelling and management of marine ecosystems: the Atlantis experience. Fish and Fisheries 12:171–188.
- Garrison, L. P., J. S. Link, D. P. Kilduff, M. D. Cieri, B. Muffley, D. S. Vaughan, A. Sharov, B. Mahmoudi, and R. J. Latour. 2010. An expansion of the MSVPA approach for quantifying predator-prey interactions in exploited fish communities. ICES Journal of Marine Science 67:856–870.
- Glass, K. A., and B. D. Watts. 2009. Osprey diet composition and quality in high- and low-salinity areas of lower Chesapeake Bay. Journal of Raptor Research 43:27–36.
- Gottlieb, S. J. 1998. Nutrient removal by age-0 Atlantic Menhaden (Brevoortia tyrannus) in Chesapeake Bay and implications for seasonal management of the fishery. Ecological Modelling 112:111–130.
- Griffin, J. C., and F. J. Margraf. 2003. The diet of Chesapeake Bay Striped Bass in the late 1950s. Fisheries Management and Ecology 10:323–328.
- Hartman, K. J., and S. B. Brandt. 1995. Trophic resource partitioning, diets, and growth of sympatric estuarine predators. Transactions of the American Fisheries Society 124:520–537.
- Hartman, K. J., and F. J. Margraf. 2003. U.S. Atlantic coast Striped Bass: issues with a recovered population. Fisheries Management and Ecology 10:309–312.
- Heymans, S. J. J., M. Coll, J. S. Link, S. Mackinson, J. Steenbeek, and V. Christensen. 2016. Best practice in developing, balancing, fitting and using Ecopath with Ecosim food-web models for ecosystem-based management. Ecological Modelling 331:173–184.
- Hilborn, R., R. O. Amoroso, E. Bogazzi, O. P. Jensen, A. M. Parma, C. Szuwalski, and C. J. Walters. 2017. When does fishing forage species affect their predators? Fisheries Research 191:211–221.
- Hunsicker, M. E., L. Ciannelli, K. M. Bailey, J. A. Buckel, J. Wilson White, J. S. Link, T. E. Essington, S. Gaichas, T. W. Anderson, R. D. Brodeur, K. S. Chan, K. Chen, G. Englund, K. T. Frank, V. Freitas, M. A. Hixon, T. Hurst, D. W. Johnson, J. F. Kitchell, D. Reese, G. A. Rose, H. Sjodin, W. J. Sydeman, H. W. Van Der Veer, K. Vollset, and S. Zador. 2011. Functional responses and scaling in predator–prey interactions of marine fishes: contemporary issues and emerging concepts. Ecology Letters 14:1288–1299.
- Irwin, B. J., M. J. Wilberg, M. L. Jones, and J. R. Bence. 2011. Applying structured decision making to recreational fisheries management. Fisheries 36:113–122.
- Larkin, P. A. 1996. Concepts and issues in marine ecosystem management. Reviews in Fish Biology and Fisheries 6:139–164.
- Link, J. S. 2002. Does food web theory work for marine ecosystems? Marine Ecology Progress Series 230:1–9.
- Link, J. S. 2010a. Ecosystem-based fisheries management: confronting tradeoffs. Cambridge University Press, New York.
- Link, J. S. 2010b. Adding rigor to ecological network models by evaluating a set of pre-balance diagnostics: a plea for PREBAL. Ecological Modelling 221:1580–1591.
- Link, J. S., and F. P. Almeida. 2000. An overview and history of the food web dynamics program of the Northeast Fisheries Science Center, Woods Hole, Massachusetts. NOAA Technical Memorandum NMFS-NE-15.
- Link, J. S., C. A. Griswold, E. T. Methratta, and J. Gunnard. 2006. Documentation for the Energy Modeling and Analysis eXercise (EMAX). National Oceanic and Atmospheric Administration, Northeast Fisheries Science Center, Reference Document 06-15, Woods Hole, Massachusetts.
- Link, J. S., T. F. Ihde, C. J. Harvey, S. K. Gaichas, J. C. Field, J. K. T. Brodziak, H. M. Townsend, and R. M. Peterman. 2012. Dealing with uncertainty in ecosystem models: the paradox of use for living marine resource management. Progress in Oceanography 102:102–114.
- Link, J. S., W. Overholtz, J. O’Reilly, J. Green, D. Dow, D. Palka, C. Legault, J. Vitaliano, V. Guida, M. Fogarty, J. Brodziak, L. Methratta, W. Stockhausen, L. Col, and C. Griswold. 2008. The Northeast U.S. continental shelf Energy Modeling and Analysis eXercise (EMAX): ecological network model development and basic ecosystem metrics. Journal of Marine Systems 74:453–474.
- Longhurst, A. 1998. Ecological geography of the sea. Academic Press, New York.
- Lynch, P., M. Brush, E. Condon, and R. Latour. 2010. Net removal of nitrogen through ingestion of phytoplankton by Atlantic Menhaden Brevoortia tyrannus in Chesapeake Bay. Marine Ecology Progress Series 401:195–209.
- Lynch, P. D., M. J. Brush, and R. J. Latour. 2011. Simulated short-term impacts of the Atlantic Menhaden reduction fishery on Chesapeake Bay water quality. North American Journal of Fisheries Management 31:70–78.
- Methratta, E., and J. Link. 2006. Evaluation of quantitative indicators for marine fish communities. Ecological Indicators 6:575–588.
- Miller, T. J., J. A. Blair, T. F. Ihde, R. M. Jones, D. H. Secor, and M. J. Wilberg. 2010. FishSmart: an innovative role for science in stakeholder-centered approaches to fisheries management. Fisheries 35:424–433.
- Nicholson, W. R. 1978. Movements and population structure of Atlantic Menhaden indicated by tag returns. Estuaries 1:141–150.
- NMFS (National Marine Fisheries Service). 2016. Ecosystem-based fisheries management policy of the National Marine Fisheries Service, National Oceanic and Atmospheric Administration. NMFS Policy Directive 01-120, Silver Spring, Maryland. Available: www.nmfs.noaa.gov/op/pds/index.html. ( May 2016).
- NOAA (National Oceanic and Atmospheric Administration). 2014a. NOAA National Marine Fisheries Service commercial fisheries statistics. Available: http://www.st.nmfs.noaa.gov/commercial-fisheries/index. (August 2015).
- NOAA (National Oceanic and Atmospheric Administration). 2014b. NOAA National Marine Fisheries Service recreational fisheries statistics. Available: http://www.st.nmfs.noaa.gov/recreational-fisheries/index. (August 2015).
- NOAA (National Oceanic and Atmospheric Administration) and CBFEAP (Chesapeake Bay Office–Chesapeake Bay Fisheries Ecosystem Advisory Panel). 2006. Fisheries ecosystem planning for Chesapeake Bay. American Fisheries Society, Trends in Fisheries Science and Management 3, Bethesda, Maryland.
- Overton, A. S., J. C. Griffin, F. J. Margraf, E. B. May, and K. J. Hartman. 2015. Chronicling long-term predator responses to a shifting forage base in Chesapeake Bay: an energetics approach. Transactions of the American Fisheries Society 144:956–966.
- Patrick, W. S., and J. S. Link. 2015. Myths that continue to impede progress in ecosystem-based fisheries management. Fisheries 40:155–160.
- Peck, M. A., S. Neuenfeldt, T. E. Essington, V. M. Trenkel, A. Takasuka, H. Gislason, M. Dickey-Collas, K. H. Andersen, L. Ravn-Jonsen, N. Vestergaard, S. F. Kvamsdal, A. Gardmark, J. Link, and J. C. Rice. 2014. Forage fish interactions: a symposium on “creating the tools for ecosystem-based management of marine resources.” ICES Journal of Marine Science 71:1–4.
- Pikitch, E. K., P. D. Boersma, I. L. Boyd, D. O. Conover, P. Cury, T. E. Essington, S. S. Heppell, E. D. Houde, M. Mangel, D. Pauly, É. Plagányi, K. Sainsbury, and R. S. Steneck. 2012. Little fish, big impact: managing a crucial link in ocean food webs. Lenfest Ocean Program, Washington, D.C.
- Pikitch, E. K., P. D. Boersma, I. L. Boyd, D. O. Conover, P. Cury, T. E. Essington, S. S. Heppell, E. D. Houde, M. Mangel, D. Pauly, É. Plagányi, K. Sainsbury, and R. S. Steneck. In press. The strong connection between forage fish and their predators: a response to Hilborn et al. (2017). Fisheries Research. DOI: 10.1016/j.fishres.2017.07.022.
- Pikitch, E. K., C. Santora, E. A. Babcock, A. Bakun, R. Bonfil, D. O. Conover, P. Dayton, P. Doukakis, D. Fluharty, B. Heneman, E. D. Houde, J. Link, P. A. Livingston, M. Mangel, M. K. McAllister, J. Pope, and K. J. Sainsbury. 2004. Ecosystem-based fishery management. Science 305:346–347.
- Pine, W. E., S. J. D. Martell, C. J. Walters, and J. F. Kitchell. 2009. Counterintuitive responses of fish populations to management actions: some common causes and implications for predictions based on ecosystem modeling. Fisheries 34:165–180.
- Pruell, R. J., B. K. Taplin, and K. Cicchelli. 2003. Stable isotope ratios in archived Striped Bass scales suggest changes in trophic structure. Fishery Management and Ecology 10:329–336.
- Rice, J., and D. Duplisea. 2014. Management of fisheries on forage species: the test-bed for ecosystem approaches to fisheries. ICES Journal of Marine Science 71:143–152.
- Rice, J., and M. Rochet. 2005. A framework for selecting a suite of indicators for fisheries management. ICES Journal of Marine Science 62:516–527.
- Rose, K. A., J. I. Allen, Y. Artioli, M. Barange, J. Blackford, F. Carlotti, R. Cropp, U. Daewel, K. Edwards, K. Flynn, S. L. Hill, R. HilleRisLambers, G. Huse, S. Mackinson, B. Megrey, A. Moll, R. Rivkin, B. Salihoglu, C. Schrum, L. Shannon, Y.-J. Shin, S. L. Smith, C. Smith, C. Solidoro, M. St. John, and M. Zhou. 2010. End-to-end models for the analysis of marine ecosystems: challenges, issues, and next steps. Marine and Coastal Fisheries: Dynamics, Management, and Ecosystem Science [online serial] 2:115–130.
- Scharf, F. S., J. P. Manderson, M. C. Fabrizio, J. P. Pessutti, J. E. Rosendale, R. J. Chant, and A. J. Bejda. 2004. Seasonal and interannual patterns of distribution and diet of Bluefish within a Middle Atlantic Bight estuary in relation to abiotic and biotic factors. Estuaries 27:426–436.
- SEDAR (Southeast Data, Assessment, and Review). 2015. SEDAR 40: Atlantic Menhaden stock assessment report. SEDAR, North Charleston, South Carolina.
- Shin, Y. J., and L. J. Shannon. 2010. Using indicators for evaluating, comparing, and communicating the ecological status of exploited marine ecosystems I: the indiSeas project. ICES Journal of Marine Science 67:686–691.
- Smith, A. D. M., C. J. Brown, C. M. Bulman, S. Mackinson, M. Marzloff, and L. J. Shannon. 2011. Impacts of fishing low-trophic level species on marine ecosystems. Science 333:1147–1150.
- Walter, J. F., and H. M. Austin. 2001. Diet composition of large Striped Bass (Morone saxatilis) in Chesapeake Bay. U.S. National Marine Fisheries Service Fishery Bulletin 101:414–423.
- Walters, C., V. Christensen, B. Fulton, A. D. M. Smith, and R. Hilborn. 2016. Predictions from simple predator–prey theory about impacts of harvesting forage fishes. Ecological Modelling 337:272–280.
- Walters, C., V. Christensen, and D. Pauly. 1997. Structuring dynamic models of exploited ecosystems from trophic mass-balance assessments. Reviews in Fish Biology and Fisheries 7:139–172.
- Walters, C. J., and F. Juanes. 1993. Recruitment limitation as a consequence of natural selection for use of restricted feeding habitats and predation risk taking by juvenile fishes. Canadian Journal of Fisheries and Aquatic Sciences 50:2058–2070.
- Whipple, S. J., J. S. Link, L. P. Garrison, and M. J. Fogarty. 2000. Models of predation and fishing mortality in aquatic ecosystems. Fish and Fisheries 1:22–40.
- Wood, R. J., and H. M. Austin. 2009. Synchronous multidecadal fish recruitment patterns in Chesapeake Bay, USA. Canadian Journal of Fisheries and Aquatic Sciences 66:496–508.
Appendix 1: Calculation of Proxy Reference Points from the Atlantic Menhaden Single-Species Stock Assessment
Given the differences in model structure between our model and the Atlantic Menhaden stock assessment, we developed proxies for the current target and threshold fishing mortality (F) values used in management. Whereas the Northwest Atlantic continental shelf (NWACS) model has three stanzas of Atlantic Menhaden (small [age 0], medium [ages 1–2], and large [age 3+]), the stock assessment models the Atlantic Menhaden population based on annual ages from age 0 to age 6+. For the 2015 Atlantic Menhaden stock assessment (AMTC Citation2015; SEDAR Citation2015), the values for single-species F reference points were calculated as the geometric mean of F on ages 2–4 (FGM2–4). The assessment relies on a statistical catch-at-age model, and the values of F are based on abundance. For the assessment, the single-species target F (F57%MSP = 0.38/year) and threshold F (F26%MSP = 1.26/year) values correspond with the median and minimum values of maximum spawning potential (MSP), where spawning potential is expressed as fecundity (AMTC Citation2015). For comparative purposes, we rescaled these single-species target and threshold F-values to a proxy F for the medium (i.e., age-1–2) Atlantic Menhaden stanza in our model (Fmed.menh; ). Fishing mortality rates in the NWACS model were estimated annually as catch divided by biomass using the data from the assessment report. The linear relationship between the two F metrics was Fmed.menh = (0.332 × FGM2–4) + 0.166, with an R2 of 0.42 (). Based on this relationship, we calculated the proxy single-species target F-value as FSS-target* = (0.332 × 0.38) + 0.166 = 0.29 and the single-species threshold F-value as FSS-threshold* = (0.332 × 1.26) + 0.166 = 0.58. Using the same approach, a proxy for the terminal-year (2013) F from the assessment could be calculated as
The variability in the linear relationship stems from the different methods used to estimate F and the different ages used in developing the reference point values. For most years, FGM2–4 values tended to be larger than Fmed.menh, partly because Fmed.menh included younger fish (ages 1–2), and F tended to be lower for age-1 fish (). We note that in recent years (2002–2013), all values of FGM2–4 have been less than 0.43, and all values of Fmed.menh have been less than 0.31. The Fmed.menh is affected by the relative biomass distribution of the composite ages, whereas FGM2–4 is not affected by the relative abundance (or biomass) of fish from ages 2 to 4 because it is a geometric mean of the age-specific F. The rescaling of single-species reference points is an approximation for comparative purposes to relate the F-values in the two models, but we make such comparisons cautiously given the uncertainty in the relationship.
FIGURE A.1.1. Relationship between fishing mortality (F) for medium-stanza Atlantic Menhaden in the Northwest Atlantic continental shelf model (Fmed.menh) and the geometric mean F for Atlantic Menhaden ages 2–4 (FGM2–4) from the single-species stock assessment (SEDAR Citation2015). Linear regression fit (dotted line), equation, and R2 value are included.
Appendix 2: Additional Figures
TABLE A.1.1. Fishing mortality rates (F) for Atlantic Menhaden. Age-specific F-values (1982–2013) are from the single-species (SS) stock assessment (Table 7.2.2.1 in SEDAR Citation2015). The F used in the Northwest Atlantic continental shelf (NWACS) model was calculated as catch divided by biomass for three different age stanzas (small [age-0], medium [ages 1–2], and large [age 3+]). The SS stock assessment reference points were determined based on the geometric mean (GM) for ages 2–4 (FGM2–4).
FIGURE A.2.1. Simulated (a) relative biomass and (b) relative yield for Atlantic Menhaden and three predators as functions of Atlantic Menhaden biomass. The Atlantic Menhaden biomass was calculated as B/B0, where B0 is biomass in the unfished scenario, holding all other model parameters and fishing rates constant. Colored lines represent Bluefish (Blue), Atlantic Menhaden (Menh), Striped Bass (Sbass), and Weakfish (Weak), as labeled in panel a.
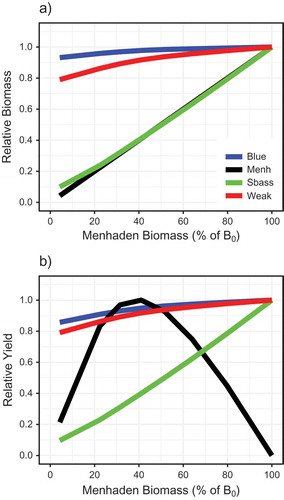
FIGURE A.2.2. Percentages of (a) negatively impacted groups and (b) positively impacted groups as a function of different Atlantic Menhaden biomass scenarios. Impacted groups (as a percentage of all n = 48 aggregated trophic groups) were defined as groups whose biomass decreased by ≥25% (IG–25%) or ≥50% (IG–50%) or groups whose biomass increased by ≥25% (IG+25%) or ≥50% (IG+50%) relative to the scenario in which fishing mortality of medium-stanza Atlantic Menhaden was zero. Atlantic Menhaden biomass is expressed as a percentage of unfished biomass (B0). Note that each trophic group with multiple stanzas (e.g., small, medium, and large Atlantic Menhaden) was combined and treated as a single aggregated group.
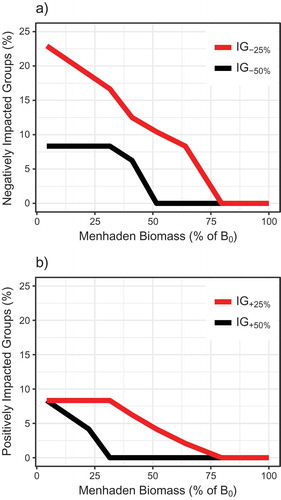
FIGURE A.2.3. Prey-to-predator ratios (PPRs) for select groups as a function of total Atlantic Menhaden biomass (expressed as a percentage of unfished biomass B0). The PPR is plotted for Atlantic Menhaden as prey and Bluefish (blue line), Striped Bass (green line), or Weakfish (red line) as predators. All PPRs were scaled to have a value of 1 when fishing mortality of medium-stanza Atlantic Menhaden was zero.
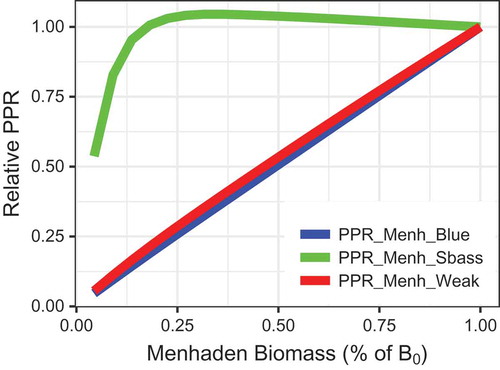
APPENDIX REFERENCES
- AMTC (Atlantic Menhaden Technical Committee). 2015. Memo M15-038 to the Atlantic Menhaden Management Board regarding “peer reviewed biological reference points and projection runs” (April 20, 2015). Atlantic States Marine Fisheries Commission, Arlington, Virginia. <!--${if: isGetFTREnabled}--><!--${/if:}--> <!--${ifNot: isGetFTREnabled}--><!--${/ifNot:}--><!--${if: isGetFTREnabled}--><!--${/if:}--><!--${googleScholarLinkReplacer: %00empty%00 book Memo+M15-038+to+the+Atlantic+Menhaden+Management+Board+regarding+%E2%80%9Cpeer+reviewed+biological+reference+points+and+projection+runs%E2%80%9D %00empty%00 2015 AMTC+%28Atlantic+Menhaden+Technical+Committee%29.+2015.+Memo+M15-038+to+the+Atlantic+Menhaden+Management+Board+regarding+%E2%80%9Cpeer+reviewed+biological+reference+points+and+projection+runs%E2%80%9D+%28April+20%2C+2015%29.+Atlantic+States+Marine+Fisheries+Commission%2C+Arlington%2C+Virginia. %00empty%00 %00null%00 %00empty%00 %00empty%00 %00empty%00 %00empty%00 %00empty%00 getFTREnabled FULL_TEXT %00empty%00}--><!--${sfxLinkReplacer: e_1_3_3_3_2_1_1 %00empty%00 url_ver%3DZ39.88-2004%26rft.genre%3Dbook%26rfr_id%3Dinfo%3Asid%2Fliteratum%253Atandf%26rft.aucorp%3DAMTC%2520%2528Atlantic%2520Menhaden%2520Technical%2520Committee%2529%26rft.date%3D2015%26rft.btitle%3DMemo%2520M15-038%2520to%2520the%2520Atlantic%2520Menhaden%2520Management%2520Board%2520regarding%2520%25E2%2580%259Cpeer%2520reviewed%2520biological%2520reference%2520points%2520and%2520projection%2520runs%25E2%2580%259D %00empty%00}-->
- SEDAR (Southeast Data, Assessment, and Review). 2015. SEDAR 40: Atlantic Menhaden stock assessment report. SEDAR, North Charleston, South Carolina. <!--${if: isGetFTREnabled}--><!--${/if:}--> <!--${ifNot: isGetFTREnabled}--><!--${/ifNot:}--><!--${if: isGetFTREnabled}--><!--${/if:}--><!--${googleScholarLinkReplacer: %00empty%00 book SEDAR+40%3A+Atlantic+Menhaden+stock+assessment+report %00empty%00 2015 SEDAR+%28Southeast+Data%2C+Assessment%2C+and+Review%29.+2015.+SEDAR+40%3A+Atlantic+Menhaden+stock+assessment+report.+SEDAR%2C+North+Charleston%2C+South+Carolina. %00empty%00 %00null%00 %00empty%00 %00empty%00 %00empty%00 %00empty%00 %00empty%00 getFTREnabled FULL_TEXT %00empty%00}--><!--${sfxLinkReplacer: e_1_3_3_3_2_2_1 %00empty%00 url_ver%3DZ39.88-2004%26rft.genre%3Dbook%26rfr_id%3Dinfo%3Asid%2Fliteratum%253Atandf%26rft.aucorp%3DSEDAR%2520%2528Southeast%2520Data%252C%2520Assessment%252C%2520and%2520Review%2529%26rft.date%3D2015%26rft.btitle%3DSEDAR%252040%253A%2520Atlantic%2520Menhaden%2520stock%2520assessment%2520report%26rft.pub%3DSEDAR %00empty%00}-->