
 ?Mathematical formulae have been encoded as MathML and are displayed in this HTML version using MathJax in order to improve their display. Uncheck the box to turn MathJax off. This feature requires Javascript. Click on a formula to zoom.
ABSTRACT
This study is to investigate college students’ choice of train trips for homecoming during the Spring Festival travel rush, which is triggered by two facts in China that the annual Spring Festival travel rush has been challenging the national transportation system and that the high-speed railway in China has made a great progress in the latest years. To this end, a stated choice experiment was designed, where four hypothetical train trips (two conventional and two high-speed train trips) consisted of a choice set. A survey based on this design was carried out, where 2768 valid observations were collected. Given the potential correlations within alternatives and the heterogeneity of respondents’ preferences, a latent class nested logit model was established and estimated, in which two classes were identified that one payed more attention to economy while the other cared more about services. The estimation results answered the questions that which determinants and to what extent of these determinants have influence on college students’ choice of homecoming train trips and who are more likely to choose high-speed train trips. In addition, this study also provides analysis of willingness to pay and market share changes.
Introduction
The Spring Festival is the most important holiday in a year for Chinese people. Everyone all over China would come back to their hometowns and celebrate the upcoming Chinese New Year together with their families. Mainly because a lot of Chinese people study and work in big cities which may be far away from their hometowns and also partly because that the Spring Festival is a great opportunity for tourism travel, billions of trips are generated across the whole country in that particular period, which cause the largest human migration on earth called ‘Chunyun,’ also known as Spring Festival travel rush. The Spring Festival travel rush, normally begins 15 days before the Chinese New Year’s Day and lasts for around 40 days, is characterized by a significant feature that can be hardly found in other periods of a year and other places of the world: the extremely huge travel demand within such a short time period. As shown in about the numbers of trips carried by different modes in the Spring Festival travel rush for the latest 4 years,Footnote1 there are totally near 3 billion trips generated every year during this period, among which highway carries most trips (accounting for around 85%), followed by railway (accounting for around 12%), and the numbers of trips carried by highway and waterway level off or slightly decrease during the 4 years while the numbers for railway and airline increase continuously.
Figure 1. Number of trips in the Spring Festival travel rush for the latest 4 years (unit: 100 million)
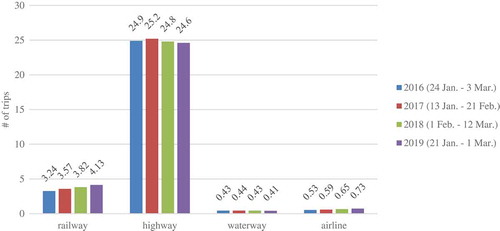
Such a huge demand inevitably poses a lot of technical, economic, and also social problems to managers and operators of the transportation system. One significant problem is the difficulty to purchase tickets. For instance, trains tickets in the Spring Festival travel rush normally would be available online for sale 1 month in advance. However, the tickets are always sold out in a few minutes. This is especially an issue for civilian workers, those who have normally received lower levels of education and may be not familiar with purchasing the tickets online. Those cannot get tickets have to change their schedules, such as delaying the departure date or choosing other travel modes or even buying tickets from scalpers. Another significant problem is the heavy congestion whether it is on the highways or at the stations. shows that most trips in the Spring Festival travel rush are carried by highway (around 2.5 billions), which certainly cause heavy congestion on the highways. On the other hand, heavy congestion also happens in big railway stations such as Guangzhou South Railway Station and Shanghai Hongqiao Railway Station, which makes the travelers be stranded at the stations for a very long time. The congestion becomes even severer if extreme weather (e.g. the snow disaster of southern China in 2008) occurs.
Although the Spring Festival travel rush is a big challenge to the national transportation system, problems caused by the huge demand have still rarely been studied yet. Only a few could be found. Wang et al. (Citation2013) simulated the pedestrian flow in a station hall during the Spring Festival travel rush using a modified social force model. It reported that the speed of passing through the waiting corridor was affected by passenger numbers in the corridor, ticket checking patterns, baggage volumes, and passengers’ anxiety emotion. Li et al. (Citation2016) explored the spatial-temporal characteristics of the Spring Festival travel rush in 2015 through the whole nation using time series analysis and complex network analysis techniques based on multisource big data. The results revealed the locations of travel peaks and valley and that the travel network at the provincial scale showed multicenter and geographic clustering characteristics. Particularly, it emphasized the importance of high-speed railways and information-communication technologies to alleviate the problems during the Spring Festival travel rush. Lin et al. (Citation2018) investigated the effectiveness of the road toll discount policy on mode choice behavior during the Spring Festival travel rush. A mixed logit model was established and estimated using both revealed and stated preference data. The results indicated that the discount policy on road toll would decrease the use of various public transits and the order of how much they would be affected, from the most to the least was coach, high-speed railway, conventional railway and airplane; the propensity of mode shifting in response to this policy was firstly increasing and then decreasing with the increasing of distance.
As mentioned by Li et al. (Citation2016), the development of high-speed railway could relieve the pressure on the transportation systems. Typically, high-speed railways are featured by higher speed and more comfortable carriage environment compared to conventional railways and cheaper ticket fare and higher accessibility compared to airplanes. When realizing these facts, in the last decades, the Chinese government vigorously promoted the construction of high-speed railway. By the end of 2018, the total length of high-speed railway network has already exceeded 29,000 km – the number is expected over 30,000 in 2019 (Xinhua Citation2019). Especially, in the middle of 2017, the new generation of high-speed rains, known as ‘Fuxing,’ was officially published, which attracted people’s great interest and attention to high-speed railway.
Based on the above considerations, the objective of this study is to investigate college students’ choice of train trips for homecoming during the Spring Festival travel rush. One of the emphases is put on college student because that college students, together with civilian workers, consist of a larger part of the migration. According to the Minister of Education of the PRC, there are totally over 30 million students (undergraduates and postgraduates) studying in colleges/universities in 2019, the majority of whom leave their hometowns and study in the different cities that may be far away. In addition, college students are characterized by several features that differ from others, such as low-income but less economic pressures, flexible schedule, and openness to new things. Another emphasis is put on railway due to the fact that the number of trips carried by railway keeps increasing for the latest 4 years as indicated and that the high-speed railway has made a great progress in the latest years, which is deemed to change travelers’ choice behavior remarkably. To this end, a stated preference approach was employed in which college students’ hypothetical choices among train trips described by multiple attributes with different levels were collected and their preferences toward these attributes were measured using discrete choice modeling approach. Although stated preference survey may suffer from some limitations, such as it cannot reflect respondents’ real choices and phasing of the questions may influence respondents’ answers, it is still a promising tool in decision-choice analysis and widely used in the literature.
In the literature, there are many studies in which travelers’ mode choices involving railway are modeled. The following only lists some latest studies and corresponding findings on this topic. Travel time (sometimes it is reflected by travel distance) and ticket fare are widely recognized determinants that have significant influence on travelers’ preference toward railway. For instance, Li and Sheng (Citation2016) found that high-speed railway was dominant in medium-distance (around 1,000 km) travel and once the distance exceeded a threshold, its market share shifted to other modes, such as air and high-speed railway integration. Yang and Chang (Citation2011) found that a discount on ticket fare would definitely affect travelers’ choices between reserved and unreserved train cabins. However, one thing should be noted is that the ticket fare of a certain train line is fixed all along in China. Difference only occurs among different ticket types, which might be caused by the fact that in China the railway system is ministered solely by the government. However, different ticket pricing strategies stated to be adopted recently as a response to various demands in different periods of a year and in different regions. Travel purpose is another determinant that usually singled out to investigate its influence. Studies (e.g., Behrens and Pels Citation2012; Wang et al. Citation2014; Moeckel, Fussell, and Donnelly Citation2014; Lee, Yoo, and Song Citation2016; Chang and Jung Citation2017) found that with different travel purposes, travelers’ preference varied a lot. For instance, Lee, Yoo, and Song (Citation2016) found that compared with leisure travelers, business travelers would pay more attention to mode safety and reveal less heterogeneous preferences in ticket fare. Behrens and Pels (Citation2012) even found insignificant effect of travel time for leisure trips. Frequency serves of railway was also investigated in some studies (e.g., Behrens and Pels Citation2012; Flügel et al. Citation2015) which concluded that higher frequency normally resulted in higher market share. Access/egress time is also considered sometimes, although it is not directly related to the railway itself, it is believed that it measures the accessibility of the stations and may have influence on travelers’ mode choice behavior. At last, some studies also found that travelers’ choice behavior is influenced by their socio-demographic characteristics, such as age, gender, occupation, income, and car ownership (e.g., Yang and Chang Citation2011; Yang, Tsai, and Chang Citation2015; Li and Sheng Citation2016). For instance, Yang, Tsai, and Chang (Citation2015) found that younger travelers had significant positive preference toward buses and railways.
The remainder of the paper is structured as follows. Section 2 describes the details of the experiment design and the data collection. Section 3 presents the model specifications. Section 4 shows estimation results as well as analysis of willingness to pay and market share changes. Section 5 finalizes the paper with some conclusions.
Data
Given the composition of railway system in China, a choice set containing two conventional and two high-speed train trips is considered. In this study, a conventional train (CT) refers to that whose number starts with T or K while a high-speed train (HS) refers to that whose number starts with G or D. Normally, a conventional train has lower priority, speed, ticket fare, and punctuality than a high-speed train does. shows the considered attributes in this study and their corresponding levels.
Table 1. Attributes and corresponding levels
As mentioned above, travel time and ticket fare are widely considered attributes in the literature. Another widely considered attribute is ticket type since different ticket types offer totally different travel experience, especially in the Spring Festival travel rush. A train’s average delay is used to represent its punctuality performance. To date, this kind of information is still unavailable for travelers. However, with the faster development of information and communication technologies, it is believed that this kind of information could be available in the near future. Note that one preeminent advantage of stated preference experiment is that it can mimic situations that have not yet existed in the current real world. The reason that arrival time rather than departure time is considered is that it is easier and more flexible for college students to go to the departure stations from campus than to go home from the arrival stations since normally the campus and the origin station are located in a same city while a student’s home may locate in a village even mountain area. Given the same reason, the egress time is also adopted. It is actually the travel time for the next trip and is related to the accessibility to the railway station, which may provide some information for the government about the location choice of a station to be constructed. At last, given the different performance on travel time, ticket fare, punctuality, and ticket type, the levels in terms of these attributes for conventional and high-speed trains are set differently.
A simultaneous orthogonal design (i.e. orthogonality is held across alternatives in a choice set) with 128 profiles was implemented using R package ‘support.CEs’ (Aizaki Citation2012). The reason of using orthogonal design rather than efficient design (Rose and Michiel Citation2005; Rose et al. Citation2008) is that the accuracy of an efficient design depends on not only the prior values of estimated parameters but also the exact model specification that is going to be used. A misspecified model may result in an even less efficient design (van Cranenburgh, Rose, and Chorus Citation2018; Walker et al. Citation2018). Therefore, for the sake of the generality, orthogonal design was finally used. The 128 profiles (choice sets) were further grouped into 16 blocks, which means each respondent was required to complete 8 choice tasks. Note that no ‘opt-out’ option was included in a choice set. This is because such an option actually cannot provide any valid information contributing to the analysis and may be more realistic in pivot/reference designs (ChoiceMetrics Citation2018).
The survey was administered from December 16, 2018, to February 26, 2019, through Internet in China. In detail, the questionnaires were dispensed on an academic economic forum,Footnote2 which was originally established in 2003. The forum has over 10 million registered users (including numerous college students and researchers) and attracts over 400 thousands visits per day. Each respondent who completed the questionnaire was rewarded 50 credits which could be used in this forum. Although the questionnaire was targeted to college students, there was no such filter rule in the questionnaire. In fact, the respondents were asked to report their occupations including the option ‘college student’, based on which the targeted respondents were selected manually after the survey was finished. Note that this study does not aim at college students’ choices in particular regions or toward particular train lines. In other words, there were no requirements about the sample except that they should be college students in China. Finally, 1008 respondents started the questionnaire and 432 completed, in which the questionnaires from 346 respondents (who reported they are college students in China) were deemed valid. summarizes the socio-demographic characteristics of the respondents. The term ‘family-college locations’ indicates whether a respondent’ family and college locate in a same province; the term ‘family location’ indicates where a respondent’s family locates (rural region vs. urban region); and the term ‘studying years’ indicates how long a respondent has been studying in the current college/university. To sum up, shows that female respondents are slightly more than male respondents (57.23% vs. 42.77%); respondents whose families locate in urban region are slightly more than those whose families locate in rural region (56.36% vs. 43.64%); the percentage of respondents whose families and colleges locate in different provinces is slightly higher (accounting for 55.78%). Meanwhile, most respondents are aged between 18 and 25 (accounting for 86.13%), have middle/low monthly expenditure (≤ ¥3000, accounting for 96.53%) and have been studying in the current college less than 5 years (accounting for 84.97%). In terms of hypothetical choices of a home coming train trip, the 346 respondents totally generated 2768 observations, in which 1505 show the respondents prefer a high-speed train trip, accounting for 54.37%, which is slightly higher than those choosing a conventional train trip.
Table 2. Descriptive statistics of respondents’ socio-demographic characteristics
Model
According to the design, it is reasonable to assume that the two conventional train trips and the two high-speed train trips are correlated, respectively. To test and capture this potential correlation, nested logit model is considered (Koppelman and Bhat Citation2006; Train Citation2009), in which the corrected alternatives are grouped into one nest. Thus, the choice set is split into two nests (i.e. CT & HS). It is realized that an error component logit model may also be suitable and even outperform a nested logit model in some cases. However, in this study, the results from error component logit model revealed that the estimated values and standard errors of the error components turned out to be unstable and keep fluctuating with the increasing of number of Halton draws used for simulation. Therefore, a nested logit model is finally adopted.
Moreover, respondents’ potential heterogeneous preferences toward different attributes are also investigated. To this end, random parameter model and latent class model could be adopted. However, in a random parameter model, one has to assume specific distributions of all random parameters which lead to considerable testing work for different assumptions and the results may be unstable if too many random parameters need to be estimated. Besides, some studies confirmed that latent class model outperformed random parameter model in particular cases (e.g. Greene and Hensher Citation2003; Shen Citation2009). Therefore, in this study, a latent class model is adopted.
In a latent class model, it is assumed that there exist a certain number of latent classes among individuals. Individuals’ heterogeneous preferences could be observed across different classes. In other words, individuals’ preferences are homogeneous within each class. According to the rule of random utility maximization, the random utility of an alternative for a certain class could be specified as follows:
where denotes the individual
s random utility of alternative
for class
;
and
denote the corresponding representative utility and random error term, respectively; subscript
denotes the attribute toward which individuals show heterogeneous preferences and
is the corresponding parameter for class
; subscript
denotes the attribute toward which individuals reveal homogeneous preference and
is the corresponding parameter;
and
represents the level of corresponding attribute
and
, respectively. Based on the specific assumption of the random error term
, the probability of choosing a specific alternative on the condition that the individual
is in class
, labeled as
, could be given – in this study, it is given by a nested logit formulation.
The membership probability of each class , which indicates the probability of the individual
being in the class
, could be represented by a standard logit formulation. Therefore, the unconditional probability of individual
choosing a specific alternative
could be expressed as follows:
where
Here denotes the class variable
, which is normally one of individuals’ socio-demographic characteristic; and
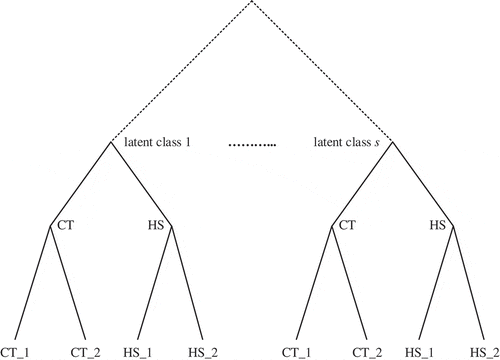
is the corresponding parameter. presents the model structure, in which the solid lines indicate the nesting structure of choices and the dotted lines indicate latent class structure.
Figure 2. Model structure
The model could be estimated using maximum likelihood estimation approach. The log-likelihood function could be given as follows:
where denotes the log-likelihood,
is a dummy variable, which equals one if the individual
chooses alternative
otherwise zero. In terms of the specific case in this study, the random utility of CT or HS is described as follows:
where and
denote the individual
s random utility of train trips CT
and HS
for class
, respectively;
and
denote the corresponding representative utility terms and
and
denote the corresponding random error terms;
and
are alternative-specific constants;
and
are parameters for class
in terms of alternative-specific attribute
of train trips CT and HS, respectively;
and
represents the level of alternative-specific attribute
of train trips CT
and HS
, respectively;
represents the level of the socio-demographic characteristic
of individual
and the
is the corresponding parameter for class
. In this study, it is assumed that heterogeneity exists in respondents’ socio-demographic characteristics and alternative-specific attributes. In other words, only the alternative-specific constants and inclusive parameters stay constant across classes. In terms of the membership probability of each class, no socio-demographic characteristics are considered. In other words, only constants need to be estimated, which means membership probabilities stay constant across individuals. This is due to the consideration that confounding may exist if introducing socio-demographic characteristics into membership probabilities
and the alternative’s choice probabilities
at the same time. In addition, since the socio-demographic characteristics only affect the utility of a high-speed train trip, this part could be seen as utility of the nest HS. Mathematically, this could be interpreted that the contributions of socio-demographic characteristics to a conventional train trip are fixed to 0 so that it can be compared with their contributions to a high-speed train trip.
Estimation
Estimation results
Latent class nested logit models were estimated in terms of 1-, 2-, 3-, and 4-class solutions using R package ‘apollo’ (Hess and Palma Citation2019). All socio-demographics were regarded as categorical and effects coded except ‘studying year’ which entered the models continuously. Specifically, given the distribution of respondents’ monthly expenditure, some of the levels were combined. At last, there were three levels remain: equal or less than ¥1000, between ¥1000 and ¥2000 and more than ¥2000. All alternative-specific attributes were also treated as categorical and effects coded except travel time and ticket fare. In addition, in the pretest results it was found the parameter of ticket fare was too small thus in the final results presented here the level of ticket fare was divided by a 100. Moreover, given the difference of conventional and high-speed trains, different parameters were estimated in terms of travel time, ticket fare, delay, and ticket type.
Various goodness of fit indices for the models with different numbers of latent classes are presented in . The convergent log-likelihoods and adjusted Rho-squared increase with the number of latent class, which confirms the existence of heterogeneous preferences among respondents. Besides, to determine the optimal number of latent class, the AIC and BIC indices are adopted, which have the lowest value for 4-class and 2-class models, respectively. However, regarding AIC, the difference between 1-class and 2-class models are remarkably larger than the difference between 2-class and 3-class models. Therefore, the 2-class model is deemed as the optimal in this study.
Table 3. Goodness of fit for the latent class nested logit models
The estimation results of the 2-class nested logit model are presented in , in which all insignificant attributes were removed.Footnote3 The adjusted Rho-squared is 0.2519, which is satisfactory (Louviere, Hensher, and Swait Citation2000; Koppelman and Bhat Citation2006). From , some conclusions could be made. First of all, the two inclusive value parameters are both lower than 1, confirming the existence of correlation among alternatives in nests (although the one of nest CT is insignificantly different from 1). Specifically, correlation coefficient between the two conventional train trips equals 0.0603 while it equals 0.1704 between the two high-speed train trips.Footnote4 The reason that correlation in nest HS is higher than it is in nest CT maybe lie in the fact that in China the composition of conventional trains is more diverse than the composition of high-speed trains is.
Table 4. Estimation results for latent class nested logit model with two classes
Secondly, the results reveal that all alternative-specific attributes are significant for both classes, except the attribute ‘delay’ which has no significant influence on conventional and high-speed train trips for both classes (it was removed from the final estimation results). As for the attribute ‘delay’, this may be because college students have already expected delay – after all, Spring Festival travel rush is featured by large delay. In this sense, a reference-based model may be more relevant, where college students’ prior expectations are regarded as a reference. However, the data in this study does not allow doing so. In terms of travel time, the influence for high-speed train trips is much higher than it is for conventional train trips. This is understandable since high-speed trains are known as the speed. A similar conclusion could be drawn in terms of ticket fare. In terms of ticket type, college students who choose a conventional train trip prefer bunk tickets rather than hard-seat or standing-only tickets – their impacts are nonlinear. The difference between different bunk tickets is relatively smaller while the different between bunk tickets and others are relatively larger (especially compared to the standing-only tickets). This is absolutely true since passengers with hard-seat tickets and standing-only tickets share common carriages and those carriages would be extremely crowded in the Spring Festival travel rush. Likewise, those choosing a high-speed train trip prefer second-class tickets rather than standing-only tickets. In terms of arrival time, college students are apt to choose a train trip that arrives at 8:00 AM or 2:00 PM – this is also reasonable since arriving at those moments makes arranging the next trip easier. Note that the level ‘8:00 PM’ has positive impact for classes 1 and less negative impact for class 2 than the level ‘2:00 AM’ does. The reason maybe lie in the fact that arriving at 8:00 PM means the college students could stay night in a hotel and continue the their trips in the next day while arriving at 2:00 AM means the college students have to keep awake in the midnight and continue their trips without enough rest. In terms of egress time, college students, as expected, would like to choose a train trip with short egress time, which means they prefer a train trip whose destination station is closer to their home (i.e. higher accessibility of the destination station).
Thirdly, comparing to the estimated values in , it could be found that respondents in class 1 are more sensitive to ticket fare while respondents in class 2 are more sensitive to ticket type and egress time. Therefore, class 1 could be labeled as ‘economy-favor’ class while class 2 as ‘service-favor’ class. In addition, according to the estimated values of membership constants, the membership probability of each class could be computed: 36% for class 1 and 64% for class 2 – almost two-thirds of the respondents prefer a train trip which could provide good services. It is understandable – on the one hand, most college students have little economic pressures so they cares less about the monetary cost; on the other hand, coming home in the Spring Festival travel rush is exhausting and good services, such as comfortable seats or short egress times, could relieving physical stress and fatigue of the trip.
Fourth, in terms of respondents’ socio-demographic characteristics, they also have different influences in different classes. In detail, the socio-demographic characteristics only influence respondents’ behavior of choosing a high-speed train trip in class 2: respondents whose family locates in urban region are more likely to choose a high-speed train trip – this may be either because those living in urban region have higher income or because the accessibility of high-speed trains in urban region is higher; respondents whose family and college locate in different provinces are more likely to choose a high-speed train trip – this can be explained by the fact that the advantages of high-speed trains are more significant for medium or long distance trips (Li and Sheng Citation2016); respondents who study longer in the current college prefer high-speed trains, which could be explained by that college students who studying longer are likely to have more experience about coming home during the Spring Festival travel rush which make them avoid conventional trains and choose high-speed trains as far as possible.
Willingness-to-pay & market share changes
To policy makers, only knowing which attribute would be considered by travelers is far from enough. One importation thing that always interests them is willingness-to-pay – the maximum price that a traveler would like to pay for marginal improvement of an alternative. Based on , college students’ willingness-to-pay in terms of a non-monetary attribute could be computed. Note that here the attribute ‘egress time’ is not considered as it actually describes the travel time of next trip from destination station to home rather than describing a train trip itself.
In terms of class 1, college students’ willingness to pay for travel time of conventional train trips equals 0.0900 while for high-speed train trips the value is 0.3522, which means that college students in class 1 would like to pay at most ¥9.00 for an hour saving in terms of conventional train trips but ¥35.22 in terms of high-speed train trips – the value is almost four times higher than it is for conventional train trips. In terms of class 2, the corresponding values are 0.3039 and 0.6018, respectively – that is, college students in class 2 would like to pay at most ¥30.39 for an hour saving in terms of conventional train trips but ¥60.18 in terms of high-speed train trips – the value is two times higher than it is for conventional train trips. The difference between class 1 and class 2, both for conventional and high-speed trains, is in line with our analysis above as class 1 is identified as ‘economy-favor.’ Meanwhile, these conclusions emphasize the importance of speed to high-speed trains and are especially helpful for the policymakers since in China there was a time the speed of high-speed trains was reduced as a response to the public query to their safety.
The attribute ‘ticket type’ is categorical and entered the model after effects coded. shows that the influence of this attribute is non-linear; therefore, the concept of willingness-to-pay in terms of this attribute indicates college students’ willingness to pay for a change from one certain level to another certain level. The results with respect to conventional train trips are shown in for college students in class 1 and class 2, respectively. The lower triangular part of the tables indicates the values of willingness-to-pay while the upper triangular part indicates the willingness-to-accept. Since the model used in this study is not reference-based and the effect of loss aversion was not considered, these two parts are symmetric (in terms of the absolute values). In detail, college students in class 1 who get standing-only tickets would like to pay hundreds to upgrade the ticket type, even only for a hard-seat (i.e., ¥197.96). A similar conclusion can be found for those with hard-seat tickets. For high-speed trains, college students would like to pay ¥130.59 at most for ticket type upgrade from standing only to having a second-class seat. However, the willingness-to-pay with respect to ticket type is much higher for college students in class 2. For instance, they averagely would like to pay ¥824.27 for an upgrade from for standing-only tickets to middle/bottom-bunk tickets for conventional train trips and would like to pay ¥468.48 to ticket switch from standing-only to second class seats for high-speed train trips. Given that class 1 is identified as ‘economy-favor’ while class 2 as ‘service-favor’, this higher difference between class 1 and class 2 is expected.
Table 5. Willingness-to-pay for ticket type changing in conventional trains (class 1)
Table 6. Willingness-to-pay for ticket type changing in conventional trains (class 2)
Since the attribute ‘arrival time’ is also categorical and effects coded, same analysis approach could be adopted. show the willingness-to-pay (more precisely, the lower triangular part in each table) of college students in class 1 for arrival time change in terms of conventional and high-speed train trips, respectively; and show the corresponding willingness-to-pay values for college students in class 2. During the Spring Festival travel rush, the government may operate additional overnight trains in order to meet the huge demand. That means the regular timetable and ticket fare should be re-designed, in which the results presented here could provide a reference.
Table 7. Willingness-to-pay for arrival time changing in conventional trains (class 1)
Table 8. Willingness-to-pay for arrival time changing in high-speed trains (class 1)
Table 9. Willingness-to-pay for arrival time changing in conventional trains (class 2)
Table 10. Willingness-to-pay for arrival time changing in high-speed trains (class 2)
Another question that may interest policy makes is how the market shares of conventional and high-speed trains change as the changes of ticket fare and travel time. To answer this question, the market share changes are computed by decreasing 10% of ticket fare and travel time for conventional and high-speed train trips. The results show that (1) when the ticket fares of these two conventional train trips (or high-speed train trips) are decrease by 10%, 1.41% (or 4.01%) of the market share will be switched; (2) when the travel time of these two conventional train trips (or high-speed train trips) decreases 10%, the conventional trains (or high-speed trains) will attract 2.96% (or 2.33%) of the market share. This result shows that decreasing ticket fare is more effective for high-speed trains while decreasing travel time is more effective for conventional trains. This is reasonable since for a same origin-destination pair, normally the level of ticket fare of a conventional train trip is lower while the level of travel time is longer – as it is deigned in this study.
Summary and discussions
The Spring Festival travel rush challenges the national transportation system of China annually. Any studies focusing on this particular period should be encouraged. This study investigated Chinese college students’ choice of train trip for homecoming during the Spring Festival travel rush using a latent class nested logit model based on stated preference data. In general, the model provides satisfactory results. It identifies two different classes among respondents – one cares more about economy and the other cares more about services; when choosing a train trip for homecoming, travel time, ticket fare, arrival time, egress time, and ticket fare are what college students would consider and college students from different classes have different preferences. It also reveals that for college students in the ‘service-favor’ class, those live in urban region, attend a college in the same province as they live and study longer in the current college would prefer to choosing high-speed trains for homecoming in the Spring Festival travel rush.
Although the results in this study are satisfactory and fruitful, it still suffers from some limitations and there are some issues need to be explored and clarified in the future. First of all, this study did not involve any revealed preference data, such as college students’ recent travel experiences during the Spring Festival. Although there are many studies address the advantages and disadvantages of stated and revealed preference data, a combination of these two kinds of data is definitely worthwhile and may provide less biased results. For instance, data could be collected using a stated preference experiment in which the levels of each attribute are pivoted from respondents’ latest experience. Secondly, this study only considered college students’ home coming trips by train. However, with the development of civil aviation industry in China, going home by air in the Spring Festival travel rush becomes a popular option among college students. Therefore, the competition among different travel modes in this particular period should be explored. Thirdly, the distributions of the sample in terms of socio-demographic characteristics were not compared with the distributions in the population due to the lack of statistic data in the population. Therefore, it should be noted that the analyses about willingness-to-pay and market share changes may be biased in the population. Fourthly, the impacts of respondents’ socio-demographic characteristics on their preferences toward high-speed railway were explored; however, it is believed that their image of high-speed railway could also affect college students’ preferences. Since image is latent that cannot be observed directly, some indicators representing this image should be added to the survey and a hybrid choice model is expected to be established. Fifthly, a prominent feature for homecoming train trip in the Spring Festival travel rush is the difficulty to purchase tickets, which was not considered in the current study. Various strategies would be applied to deal with such difficulty, such as changing the departure date, choosing other modes, or simply looking for other train trips. It would be very interesting to explore which strategy college students would adopt in certain context. Finally, it would be interesting to compare the Spring Festival travel rush with other travel rush phenomena in the world, such as Christmas travel rush in Christian world or the Hajj in Islamic world.
Notes
1. Data collected in the website of National Development and Reform Commission of the PRC (www.ndrc.gov.cn).
2. URL of this forum: https://bbs.pinggu.org/.
3. Although insignificant attributes were removed here, all attributes were actually included when determining the number of latent classes.
4. According to Hensher, Rose, and Greene (Citation2015), the correlation coefficient of two alternatives in a same nest equals 1 minus the inclusive value parameter in terms of corresponding nest.
References
- Aizaki, H. 2012. “Basic Functions for Supporting an Implementation of Choice Experiments in R.” Journal of Statistical Software 50: 1–24. doi: 10.18637/jss.v050.c02.
- Behrens, C., and E. Pels. 2012. “Intermodal Competition in the London-Paris Passenger Market: High-Speed Rail and Air Transport.” Journal of Urban Economics 71 (3): 278–288. doi:10.1016/j.jue.2011.12.005.
- Chang, J. S., and D. Jung. 2017. “Valuations on Quality of Service for Intercity Travels Using High-Speed Rail.” Transportation Letters: the International Journal of Transportation Research 9 (4): 228–242. doi:10.1080/19427867.2016.1226726.
- ChoiceMetrics. 2018. Ngene 1.2 User Manual & Reference Guide: The Cutting Edge in Experimental Design, http://www.choice-metrics.com.
- Flügel, S., A. H. Halse, J. D. D. Ortúzar, and L. I. Rizzi. 2015. “Methodological Challenges in Modelling the Choice of Mode for a New Travel Alternative Using Binary Stated Choice Data - the Case of High Speed Rail in Norway.” Transportation Research Part A: Policy and Practice 78: 438–451.
- Greene, W. H., and D. A. Hensher. 2003. “A Latent Class Model for Discrete Choice Analysis: Contrasts with Mixed Logit.” Transportation Research Part B: Methodological 37 (8): 681–698. doi:10.1016/S0191-2615(02)00046-2.
- Hensher, D. A., J. M. Rose, and W. H. Greene. 2015. Applied Choice Analysis. 2nd ed. Cambridge University Press, UK.
- Hess, S., and D. Palma. 2019. “Apollo: A Flexible, Powerful and Customisable Freeware Package for Choice Model Estimation and Application.” Journal of Choice Modelling 32: 100170. doi:10.1016/j.jocm.2019.100170.
- Koppelman, F. S., and C. R. Bhat. 2006. A Self Instructing Course in Mode Choice Modeling: Multinomial and Nested Logit Models, Prepared for U.S. Department of Transportation Federal Transit Administration.
- Lee, J.-K., K.-E. Yoo, and K.-H. Song. 2016. “A Study on Travelers’ Transport Mode Choice Behavior Using the Mixed Logit Model: A Case Study of the Seoul-Jeju Route.” Journal of Air Transport Management 56: 131–137. doi:10.1016/j.jairtraman.2016.04.020.
- Li, J., Y. Qingqing, X. Deng, Y. Liu, and Y. Liu. 2016. “Spatial-Temporal Analysis on Spring Festival Travel Rush in China Based on Multisource Big Data.” Sustainability 8: 11. doi:10.3390/su8111184.
- Li, Z., and D. Sheng. 2016. “Forecasting Passenger Travel Demand for Air and High-Speed Rail Integration Service: A Case Study of Beijing-Guangzhou Corridor, China.” Transportation Research Part A: Policy and Practice 94: 397–410.
- Lin, X., Y. O. Susilo, C. Shao, and C. Liu. 2018. “The Implication of Road Toll Discount for Mode Choice: Intercity Travel during the Chinese Spring Festival Holiday.” Sustainability 10: 8.
- Louviere, J. J., D. A. Hensher, and J. Swait. 2000. Stated Choice Methods: Analysis and Applications. Cambridge University Press, UK.
- Moeckel, R., R. Fussell, and R. Donnelly. 2014. “Mode Choice Modeling for Long-Distance Travel.” Transportation Letters: the International Journal of Transportation Research 7 (1): 35–46. doi:10.1179/1942787514Y.0000000031.
- Rose, J. M., and C. J. M. Bliemer. 2005. “Constructing Efficient Choice Experiments.” ITLS-WP-05-07. Institute of Transport and Logistics Studies Working Paper.
- Rose, J. M., C. J. Michiel, D. A. Bliemer, and A. T. Collins. 2008. “Designing Efficient Stated Choice Experiments in the Presence of Reference Alternatives.” Transportation Research Part B: Methodological 42 (4): 395–406. doi:10.1016/j.trb.2007.09.002.
- Shen, J. 2009. “Latent Class Model or Mixed Logit Model? A Comparison by Transport Mode Choice Data.” Applied Economics 41 (22): 2915–2924. doi:10.1080/00036840801964633.
- Train, K. E. 2009. Discrete Choice Methods with Simulation. 2nd ed. Cambridge University Press, UK.
- van Cranenburgh, S., J. M. Rose, and C. G. Chorus. 2018. “On the Robustness of Efficient Experimental Designs Towards the Underlying Decision Rule1.” Transportation Research Part A: Policy and Practice 109: 50–64. Elsevier.
- Walker, J. L., Y. Wang, M. Thorhauge, and M. Ben-Akiva. 2018. “D-Efficient or Deficient? A Robustness Analysis of Stated Choice Experimental Designs.” Theory and Decision 84 (2): 215–238. doi:10.1007/s11238-017-9647-3.
- Wang, L., Q. Zhang, Y. Cai, J. Zhang, and M. Qingguo. 2013. “Simulation Study of Pedestrian Flow in a Station Hall during the Spring Festival Travel Rush.” Physica A: Statistical Mechanics and Its Applications 392 (10): 2470–2478. doi:10.1016/j.physa.2013.01.044.
- Wang, Y., L. Lei, L. Wang, A. Moore, S. Staley, and L. Zongzhi. 2014. “Modeling Traveler Mode Choice Behavior of a New High-Speed Rail Corridor in China.” Transportation Planning and Technology 37 (5): 466–483. doi:10.1080/03081060.2014.912420.
- Xinhua. 2019. “China’s High-Speed Railway Length to Top 30,000 Km in 2019.” Accessed April 9. http://www.xinhuanet.com/english/2019-01/03/c_137715444.htm
- Yang, C., and C. Chang. 2011. “Applying Price and Time Differentiation to Modeling Cabin Choice in High-Speed Rail.” Transportation Research Part E: Logistics and Transportation Review 47: 1. doi:10.1016/j.tre.2010.07.003.
- Yang, C., M. Tsai, and C. Chang. 2015. “Investigations of Interactions between Bus Rapid Transit and General Traffic Flows.” Journal of Advanced Transportation 49 (1): 326–340. doi:10.1002/atr.1268.