
 ?Mathematical formulae have been encoded as MathML and are displayed in this HTML version using MathJax in order to improve their display. Uncheck the box to turn MathJax off. This feature requires Javascript. Click on a formula to zoom.
ABSTRACT
Mobility-as-a-Service (MaaS) can be considered the latest innovative technological solution to sustainable transportation. It offers travelers access to a pre-paid bundle of transportation modes on a single app with the additional convenience of the integration of planning, booking, and payment. Capturing the impact of this new technology on travel behavior remains a challenge, given the scarce number of comprehensive MaaS pilots. In this study, a stated adaptation experiment was designed to determine travelers’ propensity toward using this new service. Such knowledge sheds light on the potential of MaaS to alter daily travel patterns.
Introduction
Concepts such as shared and on-demand mobility as well as electric and autonomous vehicles are expected to change transportation mode choice. Recently, Mobility-as-a-Service (MaaS) is viewed as another flexible, innovative mobility solution that can be tailored to users’ different tastes and needs, and forms a convenient alternative compared to the usage of private vehicles. Although the definition of the concept differs widely, in the European context it tends to refer to a subscription to a prepaid bundle of different (on demand) transportation modes with various pricing schemes, organized on a digital platform that allows planning, booking, and payment of transportation services (Hietanen Citation2014; Finger, Bert, and Kupfer Citation2015; Kamargianni et al. Citation2016; Jittrapirom et al. Citation2017).
Recently, there have been attempts to model the adoption of MaaS and estimate the demand for the service as a function of pricing schemes and bundling options (Ho et al. Citation2018; Matyas and Kamargianni Citation2018; Caiati, Rasouli, and Timmermans Citation2019) since obtaining insights from involved stakeholders and future users (Polydoropoulou, Pagoni, and Tsirimpa Citation2018) is of the utmost importance for a successful implementation of MaaS. To complement these studies, the focus of this paper is on modeling the effect of MaaS on changing travel patterns, particularly on the choice of transportation mode. Empirical evidence on the effect of MaaS is relevant for various parties; for policymakers to coordinate incentives toward sustainable mobility (mode choice), for transportation operators to refine strategies and avoid cannibalization and for network providers to optimize their service offerings.
The number of studies regarding the impact of MaaS is very limited. Few insights were provided based on small-scale pilots in Sweden and Austria regarding the potential effect of MaaS on travel behavior. Based on a small number of registered users of the six-month Swedish pilot (Sochor, Strömberg, and Karlsson Citation2015a; Sochor, Strömberg, and Karlsson Citation2015b; Sochor, Karlsson, and Strömberg Citation2016) report the effects on the travel patterns at the household level, mentioning a reduction in private car use, a modal shift toward public transportation and car-sharing services as well as minor changes in trip destination and route choice. Karlsson et al. (Citation2017) remark the positive effect of the Austrian pilot (SMILE) on user’s mobility behavior in terms of the use of sharing services and electric mobility, however, stress that the available data obtained from MaaS or MaaS-related schemes are inadequate for a thorough impact assessment of such service. This has also been highlighted by Durand et al. (Citation2018), who conducted an explorative and systematic literature review and pinpointed potential behavioral impacts of MaaS including its possible implications for environmental and social sustainability. Storme et al. (Citation2019) question the possibility of MaaS to substitute car-ownership based on a quite small-scale Belgian MaaS-pilot, since despite the noted decrease of privately owned cars during the intervention, more evidence is needed from larger, in content and sample size, pilot-studies. Interesting insights are also given by Ho et al. (Citation2018) about the effect of current travel patterns on MaaS uptake and the possibility to disrupt car-ownership models in the Australian context.
Considering the largely unknown impact of MaaS, the aim of this paper is to better understand the intended behavioral change (change of transportation mode) as a result of the availability of MaaS, for people that consider themselves likely to adopt such a system by acquiring a subscription to the service. To that end, a transportation mode choice model is estimated.
The next sections describe the data collection process, the design of the stated adaptation experiment, followed by the results of the model examining the propensity of mode-choice adaptations as the result of a subscription to MaaS.
Experiment
Similar to traditional stated choice surveys, stated adaptation experiments attempt to capture individual choice processes. The specific focus concerns the question whether individuals change their current behavior given a new (hypothetical) context and/or choice alternatives. Respondents are asked to complete a set of choice tasks that systematically varying a set of attribute levels by indicating whether under the new hypothetical circumstances they would adapt their behavior and if so how (e.g. D’Arcier, Andan, and Raux Citation1998; Bladel et al., Citation2008). The stated adaptation experiment was part of a larger questionnaire, distributed through a market research company in Rotterdam, Amsterdam, and Utrecht in the Netherlands. The questionnaire consisted of 4 parts:
Part I: Introduction and Screening Question
Part II: Baseline Behavior (4-day Travel Diary)
Part III: Stated Adaptation Experiment
Part IV: Personal/Household information and Attitudes
First, to familiarize respondents with the new concept, an animated video explaining MaaS was shown. It was followed by a screening question, asking respondents to indicate their level of interest in a subscription to MaaS, choosing one of three options: uninterested/low chance of subscription; interested/good chance of subscription; very interested/high chance of subscription. From the initial sample of 2143 respondents, 37% was not interested in MaaS and were excluded from the main survey, since we are interested into obtaining data from potentially future users of MaaS. Those interested (53%) and very interested (10%) were asked to proceed and invited to report their typical travel patterns for 2 trips per day across any three weekdays, and one non-weekday. The third part concerned the stated adaptation experiment. Four different subscription schemes (bundles) were configured for the purpose of our study ().
Figure 1. The four MaaS bundles (Feneri, Rasouli, and Timmermans Citation2019).
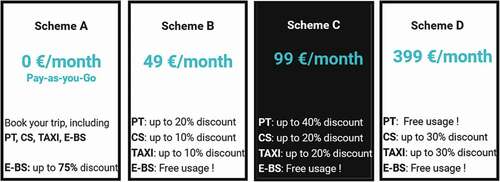
Respondents were assigned a single randomly selected bundle to avoid they had to mentally process different bundles during the experiment. They were then asked, imagining they subscribed to that bundle, to indicate for the reported trips whether they would continue to use the same transportation mode (Status Quo) or choose one of the modes included in the assigned MaaS bundle.
The constructed design was an orthogonal fractional factorial design, pivoted around the respondent’s reported information for each documented trip to create realistic choice situations. A common problem of such designs using travel time information is that unlikely combinations of travel times by transportation mode are created (e.g. bus being faster than car). To avoid this problem, for each current transportation mode, realistic proportional speed profiles for the modes included in the Maas bundle were assumed (Feneri, Rasouli, and Timmermans Citation2019). Consequently, the created design is orthogonal in attribute differences with the main potential advantages of equidistant coverage of attribute space and attribute level balance. This design strategy resulted in 128 profiles that were blocked into 16 orthogonal subsets and ultimately led to 8 choice sets per respondent.
In the last part of the main questionnaire, socio-demographic characteristics and personal attitudes toward multimodality, environmental awareness, and innovation value were collected. After the screening question and the data cleaning process, 8080 observations collected from a sample of 1010 respondents were used for analysis and model estimation.
Methodology
In order to examine the determinants of mode choice as a result of the introduction of MaaS, an Error Components Logit (ECLogit) model was estimated. This model estimates extra parameters with respect to the correlation that may exist between the choice alternatives (Train Citation2009; Hensher, Rose, and Greene Citation2013). It assumes that the probability of choosing a mode within a MaaS bundle depends on the monthly price of the bundle, the pricing schemes of various transportation modes within the bundle, and few other relevant attributes such as travel time, parking time, and waiting time (depending on the specific transportation mode), while also considering covariances that may exist across the choice alternatives.
As shown in EquationEquation 1(1)
(1) , a linear relationship is assumed.
is the utility of alternative SQ1-m chosen in choice task t, given Status Quo 1 (Drive Alone) to m (EBike) for individual n, xnkj is alternative-specific attribute k, βk is its corresponding coefficient,
is socio-demographic characteristic z of respondent n with its corresponding coefficient
,
is decision context variable h (such as trip purpose, level of interest in MaaS), and εnjt is an error term for choice j in choice task t, assumed to be identically and independently Gumbel distributed (IID). ASC is an alternative-specific constant and
is an index identifying the type of reference mode, consisting of Drive Alone (DA), Passenger (PASSENG), Walk, Bike and Ebike and
the corresponding coefficient. EquationEquation 2
(2)
(2) shows that
is the utility of alternative j for individual n in choice task t and expresses the relative utility for each one of the four MaaS alternatives (MaaS-PT, MaaS-CS, MaaS-BS, MaaS-TAXI). The reasons to separate the utility of Status Quo and the one of MaaS alternatives in two equations are two-fold. First, while in EquationEquation 1
(1)
(1) separate constants have been defined and estimated for the type of mode in Status Quo (to enable us to understand the intensity of inertia for different modes in Status Quo), only a generic constant has been included in the utility function of MaaS options (EquationEquation 2
(2)
(2) ). The second reason is the treatment of the error structure in the utility functions of MaaS alternatives (which does not exist for Status Quo; EquationEquation (1)
(1)
(1) ).
In order to capture any unobserved similarity among alternatives and the panel effect, m alternative and individual specific error terms are introduced. is an index which is equal to 1 if effect p appears in alternative j and zero otherwise.
is the effect p for individual n (with standard normal distribution). Interactions between socio-demographic variables, attributes of the choice alternatives and type of Status Quo modes were also estimated. The most significant ones which contributed most to model performance were selected for the final model, and are reported in the table of results ().
Table 1. Results of Error Components Logit Model
Lastly, the probability for individual
to select transportation mode
in choice situation
among the set of alternatives
(
= 1, … j …,Q), is as shown in EquationEquation 3
(3)
(3) . The following equation expresses the likelihood function
(EquationEquation 4
(4)
(4) ) which was estimated by simulation.
= 1 if individual
chooses alternative
in choice situation
, 0 otherwise.
Results
reports the results of the model. The goodness of fit of the model as indicated by McFadden’s adjusted Rho-Squared is 0.434.
Inertia effects
The respondents’ choice sets include 4 or 5 alternatives depending on their reported transportation mode. More precisely, since all four MaaS bundles include E-Bike Sharing (E-BS), Public transportation (PT), Car sharing (CS), and Taxi, if respondents reported one of these modes as their current mode for a certain trip, their choice set includes four alternatives (which exist within their MaaS bundle). Alternatively, when respondents previously reported a trip based on walking, E-/biking, car as a Driver or Passenger, they have 5 alternatives in their choice set. Respondents could either remain with their current transportation mode (Status Quo-SQ) or choose one of the alternatives available in their MaaS bundle. The model allowed for covariances among the four MaaS modes. Results revealed the highest covariance between MaaS_CS and MaaS_BS (1.916). The smallest covariance exists between MaaS_PT and MaaS_Taxi (0.456), which is expected given the very different nature of these two transportation modes.
The sign of the SQ constant is positive (5.446) and significantly higher than the other 4 constants, indicating that respondents tend to stick with their current transportation mode. About the effects of socio-demographics on inertia, we notice a negative significant coefficient for young millennials (−0.975), indicating that younger age groups are more eager to choose a MaaS mode compared to older age groups. People are sensitive to trip duration (−0.047) and cost (−1.525), which are seen as important factors to choose a MaaS alternative. This sensitivity to price is also confirmed by the positive coefficient (0.299) for free parking and the negative parameter for higher parking cost (−0.171). Regarding the effect of occupational status, we notice that those looking for a job are less eager to stick with their status Quo mode (−0.867). It is also evident that people are sensitive to waiting and parking time, yet the estimated coefficients are not statistically significant.
The tendency to continue using the current transportation mode varies between modes. The estimated inertia effects for car drivers (−1.315) and car passengers (−1.383) signal a lower tendency for these groups to stick with the reported transportation mode, while bikers are mostly inclined to keep using their bike for the reported trip (0.526).
Moreover, we included interaction effects between inertia, and socio-demographic and contextual variables. Results indicate that inertia effects are larger for female Bikers (0.279), Drivers (0.169), and Passengers (0.324). The effect of the variable measuring interest in MaaS was estimated in combination with the type of current transportation mode. The negative signs of the coefficients for Walkers (−0.345), Bikers (−0.529), Drivers (−0.640), and Passengers (−0.382) suggest that in general people with a higher interest in MaaS show a significantly lower tendency to continue using their current mode than average, but this tendency differs between current modes. Moreover, it seems that in case of commuting trips, those who previously walked (−0.642) or traveled as Passengers (−0.269) have a higher tendency to choose one of the MaaS modes. Although users, on average, are sensitive to higher travel expenses and travel time, the interaction effect between travel time and current transportation mode suggests that this sensitivity is lower for car drivers and passengers, followed by walkers (evidenced by the estimated interaction effect of 0.045, 0.031, and 0.013, respectively).
Choice of transportation modes within MaaS bundle
The estimated constants for PT (3.719), CS (1.621), and BS (2.978) as MaaS options indicate that respondents have a higher tendency to choose public transportation, followed by bike sharing, from the inventory of transportation modes in their MaaS bundle. The unemployment and people in search of job are less inclined to choose MaaS public transportation (−0.874). As expected, if their reported travel does not need any transfer (using PT), they are more likely to choose PT (0.162). As for the influence of type of bundle, the results show that subscribing to Bundle A where travelers have to pay per ride leads to a lower tendency of choosing MaaS-PT (−0.224), while Bundle C with 40% discount for public transportation positively impacts the tendency of choosing this mode (0.261). The effect of Bundle D (which offers free usage of PT) is smaller than for Bundle C. An explanation could be that since users pay a relatively high monthly fee (€399) for Bundle D, some of them will be inclined to use other fancier transportation modes even if the use of PT is free. Sensitivity to cost and trip duration can also be examined by the marginal effects. Results show that the marginal effect of cost and travel time is respectively 0.006 and 0.018.
Regarding choosing Car-sharing, results reveal that travel expenses negatively affect the choice of MaaS-CS (−0.024). Coefficients associated with waiting times show that respondents prefer to have a 5 to 10 minutes time lag between ordering and arrival of the vehicle (0.152). Moreover, the pricing scheme of Bundle C (20% discount for CS, 40% discount for PT, and 20% discount per Taxi ride) appears to be the most attractive to choose car sharing (0.357). Although Bundle D gives higher discount on Car-sharing (30%), this bundle shows a smaller effect, perhaps due to a very interesting pricing scheme (free usage) of PT for this bundle. The reported marginal effects () of travel cost and time for MaaS-CS are 0.016 and 0.008, respectively.
Table 2. Marginal Effects
Regarding the fourth alternative MaaS-BS, its utility decreases with increasing trip duration (−0.034) and travel cost (−0.300). As expected, using bike or ebike as part of MaaS increases as these options are offered for free, which is the case for bundles B (0.358) and C (0.665). Although Bundle D offers free bike as well, respondents are less inclined to choose this transportation mode compared to Bundle B and C, possibly due to the high monthly price of the package, leading them to use otherwise more costly modes. The interaction of gender and bundle shows that BS becomes more attractive for women for Bundle B (0.286) and less desirable for women for bundle C (−0.301). also reveals that females are more sensitive to travel time and that an increase in the trip duration de-motivates them to choose this option (−0.005). shows the marginal effect of cost is 0.006 and of duration is 0.077 with respect to MaaS-BS.
Finally, not many parameters could be estimated for the MaaS-TAXI mode since this mode was chosen only a few times. The signs of the estimated parameters are as expected, yet not significant. shows that the marginal effects for MaaS-Taxi are 0.003 and 0.007 for, respectively, travel cost and time.
Discussion/conclusion
MaaS is attracting a lot of attention from policymakers, industry, and academia with its potential to draw travelers away from using private cars and, therefore, offering a new sustainable transportation mode. The aim of this study was to shed light on the influence of a set of factors on the usage of MaaS transportation modes. The design of the study reflects this focus. The paper discusses an approach to the analysis of mode choice assuming that people have subscribed to this new service. Important to highlight the key role of the consideration of various mobility bundles for what concerns the design of this survey and our model estimation.
Results show that it is not price per se but the combination of monthly fees and the discounts for various transportation modes within a specific bundle that primarily influence the increase or decrease of the use of a specific mode included in the MaaS bundle. Another important and assuring observation is that travelers who currently are drivers or passengers of privately owned cars are less willing to continue using their current mode compared with walkers or bikers. That might be in contradiction with the expectations assuming that getting people out of their private car is more difficult than convincing people who are already multi-modal to use MaaS. Our results, however, should be interpreted keeping in mind that the sample who were recruited were the ones who indicated relatively high interest in MaaS. Preserving such condition was necessary for our study as the respondents would have to assume that they had already subscribed to MaaS.
While the outcome of this work can be used to understand the degree of switching to various transportation modes once MaaS is adopted, the total changes in demand can only be accurately estimated combining these research results with those associated with the prediction of the demand for MaaS subscription. (Caiati, Rasouli, and Timmermans Citation2019). The prediction of market shares under certain scenarios requires representative activity-travel patterns of a synthetic population to which the probability of choosing a particular bundle (including the ‘none’ option) (e.g. Caiati, Rasouli, and Timmermans Citation2019) and the estimated coefficients in this study are applied.
Acknowledgments
The authors are grateful to the Netherlands Organization for Scientific Research (NWO) for funding this research. This work is part of the project “SCRIPTS”, which is part of the program “Smart Urban Region of the Future” (SURF).
Disclosure statement
No potential conflict of interest was reported by the authors.
References
- Arcier, B. F. D., O. Andan, and C. Raux. 1998. “Stated Adaptation Surveys and Choice Process: Some Methodological Issues.” Transportation 25 (2): 169–185. doi:https://doi.org/10.1023/a:1005042505063.
- Bladel van, K., T. Bellemans, D. Janssens, G. Wets, E. W. L. Nijland, T. A. Arentze, and H. J. P. Timmermans. 2008. “Design of Stated Adaptation Experiments: Discussion of Some Issues and Experiences.” In Proceed. 8th Intern. Conference on Survey Methods in Transport Annecy, France, CD-Rom, 14. Intern. Steering Committee for Travel Survey Conferences
- Caiati, V., S. Rasouli, and H. J. P. Timmermans. 2019. “Bundling, Pricing Schemes and Extra Features Preferences for Mobility as a Service: Sequential Portfolio Choice Experiment.” Transportation Research Part A: Policy and Practice. doi:https://doi.org/10.1016/j.tra.2019.09.029.
- Durand, A., L. Harms, S. Hoogendoorn-Lanser, and T. Zijlstra. 2018. Mobility-as-a-Service and Changes in Travel Preferences and Travel Behaviour: A Literature Review. The Hague, Netherlands: Ministry of Infrastructure and Water Management.
- Feneri, A.-M., S. Rasouli, and H. J. P. Timmermans. 2019. “Mobility-as-a-Service in the Smart City Era: The Design of a Stated Adaptation Experiment to Assess the Effects of MaaS on Day-to-day Travel Mode Choice Behavior.” Proceedings of the 9th International Congress on Transportation Research ICTR, Athens, Greece, 24-25 October.
- Finger, M., N. Bert, and D. Kupfer. 2015. Mobility-as-a-Service: from the Helsinki experiment to a European model? doi:https://doi.org/10.2870/07981
- Hensher, D. A., J. M. Rose, and W. H. Greene. 2013. Applied Choice Analysis 2nd ed. Vol. 53. Cambridge University Press. doi:https://doi.org/10.1017/CBO9781107415324.004.
- Hietanen, S. 2014. ““Mobility as a Service”—The New Transport Model?” Eurotransport 12 (2): 2–4.
- Ho, C. Q., D. A. Hensher, C. Mulley, and Y. Z. Wong. 2018. “Potential Uptake and Willingness-to-pay for Mobility as a Service (Maas): A Stated Choice Study.” Transp. Res. Part A: Policy and Practice. 117: 302–318. doi:https://doi.org/10.1016/j.tra.2018.08.025.
- Jittrapirom, P., V. Caiati, A.-M. Feneri, S. Ebrahimigharehbaghi, M. Alonso-González, and J. Narayan. 2017. “Mobility as A Service: A Critical Review of Definitions, Assessments of Schemes and Key Challenges.” Urban Planning 2 (2): 13–25. doi:https://doi.org/10.17645/up.v2i2.
- Kamargianni, M., W. Li, M. Matyas, and A. Schäfer. 2016. “A Critical Review of New Mobility Services for Urban Transport.” Transportation. Research Procedia 14: 3294–3330. doi:https://doi.org/10.1016/j.trpro.2016.05.277.
- Karlsson, M., J. Sochor, A. Aapaoja, J. Eckhardt, and D. König. 2017. “Deliverable 4: Impact Assessment.” MAASiFiE project funded by CEDR
- Matyas, M., and M. Kamargianni. 2018. “The Potential of Mobility as a Service Bundles as a Mobility Management Tool.” In TRB 2018 Annual Meeting.
- Polydoropoulou, A., I. Pagoni, and A. Tsirimpa. 2018. “Ready for Mobility as a Service? Insights from Stakeholders and End-users.” Travel Behaviour and Society. doi:https://doi.org/10.1016/j.tbs.2018.11.003.
- Sochor, J., M. Karlsson, and H. Strömberg. 2016. “Trying Out Mobility as a Service: Experiences from a Field Trial and Implications for Understanding Demand.” Transportation Research Record: Journal of the Transportation Research Board 2542: 57–64. doi:https://doi.org/10.3141/2542-0.
- Sochor, J., H. Strömberg, and I. C. M. Karlsson. 2015a. “An Innovative Mobility Service to Facilitate Changes in Travel Behavior and Mode Choice.” Proceedings of the 22nd World Congress on Intelligent Transportation Systems, Bordeaux, October 5-9
- Sochor, J., H. Strömberg, and M. Karlsson. 2015b. “Implementing Mobility-as-a-Service: Challenges in Integrating User, Commercial and Societal Perspectives in an Innovative Mobility Service.” Transportation Research Record 2536 (1): 1–9. doi:https://doi.org/10.3141/2536-01.
- Storme, T., V. J. De, P. L. De, and F. Witlox. 2019. “Limitations to the Car-substitution E Ff Ect of MaaS. Findings from a Belgian Pilot Study.” Transportation Research Part A. doi:https://doi.org/10.1016/j.tra.2019.09.032.
- Train, K. E. 2009. Discrete Choice Methods with Simulation. 2nd ed. Cambridge, UK: Cambridge University Press.