
 ?Mathematical formulae have been encoded as MathML and are displayed in this HTML version using MathJax in order to improve their display. Uncheck the box to turn MathJax off. This feature requires Javascript. Click on a formula to zoom.
ABSTRACT
This study was aimed at comparing cyclists’ perceptions of comfort when in traffic and when online. Questions about comfort were structured according to three hierarchical levels, namely strategic (city level), tactical (frequent route level) and operational (survey spot level). The purpose is to understand how the cyclists’ perceptions of comfort at different levels vary between questionnaire administration methods. The results suggest that cyclists are more positive and optimistic about the cycling comfort when answering online questionnaires than when answering in-traffic questionnaires, but only when the questions refer to the operational level (at a more general level, their answers were not statistically different). Cycling planners and researchers could incorporate these findings in their data collection policies by selecting online approaches, which are generally less expensive than but equally effective as in-traffic approaches, when carrying out studies that concern the strategic and/or tactical levels of comfort.
Introduction
Cycling is an environmentally friendly mode of transport which is receiving increased support from governments across the world (Chen, Yan, and Wang Citation2015; Chen Citation2019; Chen and Lu Citation2015; Melson, Duthie, and Boyles Citation2014). Cycling has a variety of benefits, including improved health and reduced gas emissions and fuel consumption (Hood, Sall, and Charlton Citation2011; Leao, Lieske, and Pettit Citation2017). Research about the travel characteristics of transport modes could contribute to providing additional insights for planning purposes. A great body of research has been dedicated to travel behavior analysis in order to assist transport planners (Burbidge and Goulias Citation2009; Davis, Lee, and Goulias Citation2016; de Abreu E Silva, Martinez, and Goulias Citation2012; LaMondia and Bhat Citation2011; Ruiz and García-Garcés Citation2015; Sivakumar, Batley, and Polak Citation2012). Targets have been set and programmes have been developed to increase the appeal of cycling as a mode of transport. Such efforts could be greatly enhanced by improving the quality of the cycling experience, thereby making this transport mode even more attractive (Heinen, Maat, and Wee Citation2011).
To help understand how the quality of transport facilities is experienced from a user perspective, the concept of Level-of-Service (LOS) was developed in 1965 by the Highway Capacity Manual (HCM Citation2000). Since then, this concept has found widespread circulation in the field of cycling research, often through some sort of index capable of aggregating different cycling-related aspects (Botma Citation1995; Jensen Citation2007). Each index has its own characteristics and considers its own range of variables. However, all these indices share an emphasis on the importance of user perceptions regarding infrastructure conditions. This has often been studied by issuing questionnaires to transport users – in this case, cyclists.
Collecting user opinions via questionnaires has some drawbacks: For instance, users may interpret the questions differently, or they may answer strategically in the hope of receiving government funding; some users may not even take the questions seriously. There is also the question of how to choose the most appropriate time and place to administer questionnaires, as this choice may dramatically affect the results (Debois Citation2019). In bicycle comfort studies (Ayachi, Dorey, and Guastavino Citation2015; Fernández-Heredia, Monzón, and Jara-Díaz Citation2014; Li et al. Citation2012a; Verma et al. Citation2016), a commonly employed method is to stop cyclists and ask them to complete questionnaires. In the present study, this method was called the ‘in-traffic’ questionnaire. The main problem with this method is that the cyclists must first come to a complete stop, then take the time to fill out the questionnaire, and then continue cycling. As cycling requires substantial physical effort, stopping and then resuming cycling is not only time-consuming but also quite strenuous. Consequently, many cyclists do not stop at all, while those who do often complete the questionnaire in a rushed and somewhat annoyed manner.
One (expected) benefit of the online approach is that the cyclists would not be stopped for as long and would therefore be less likely to respond negatively, both initially and later on, since they can complete the questionnaire at their own leisure. An obvious drawback is that there may ultimately be fewer respondents, since many cyclists could either forget to complete the questionnaire or simply choose not to. Another issue is that the stress and physical exertion experienced by cyclists while being stopped are more representative of the experience of cycling in traffic than the relative calm and comfort experienced when completing the questionnaire online.
On the other hand, knowing the cycling quality perception will determine the output of LOS and is thus a vital concept in the planning, design and management of transportation systems (Beura and Bhuyan Citation2017). As a consequence, the assessment of cyclists’ perceptions should be precisely carried out in order to build an accurate LOS model.
Based on this observation, the present study explored a novel method, one that employed a hierarchical framework for assessing cyclists’ perceptions of comfort at different levels. The study compared cyclists’ in-traffic questionnaire responses with those given online, on a questionnaire consisting of the same concepts. The latter were answered when the cyclists had left the traffic situation and were in a more comfortable environment.
The purpose of the study design was to investigate whether actual differences existed between the two questionnaire administration methods and, if they did, whether the online method could serve as an effective replacement for the in-traffic method. Such determinations can be considered a practice-ready output of this study, since a better understanding of cyclists’ perceptions could contribute to planners’ decisions and their data collection strategies in terms of time and cost adjustment and based on their project context and scope.
Literature review
Over recent decades, it has become progressively more important to promote the cycling modal share; finding possible strategies to raise the level of perceived comfort has been considered one valid approach. Many LOS indices have been suggested to assess the Quality of Service (QOS) of cycling; these indices can be categorized based on transport component features, such as link-based – bicycle safety index rating (Botma Citation1995); node-based – bicycle level of service (at intersections) (Jensen Citation2013); and network-based – level of traffic stress (Mekuria, Furth, and Nixon. Citation2012).
All the aforementioned studies attempted to translate user perceptions into LOS indices in an effort to help planners and decision-makers gain a better understanding of user requirements. To do so, either geometrical and physical variables related to infrastructure were considered, or variables related to traffic composition and condition were assessed.
In the data collection phase of LOS studies, video techniques, direct observations or questionnaires are typically used (Asadi-Shekari, Moeinaddini, and Zaly Shah Citation2013), since these issues require more in-depth analysis. Recording a video of the case study and showing it to the research participants is one approach that has been used quite frequently (Hummer et al. Citation2005; Jensen Citation2013; Petritsch et al. Citation2007).
Regarding the exploration of cyclists’ opinions in traffic, Bai et al. (Citation2017) conducted their field study at signaled intersections downstream of selected bike lanes, where cyclists were stopped and asked to evaluate their perceptions of comfort about the bike lane they had just passed. This survey was only performed at the exact location (i.e. intersection) cyclists had just passed, after the targeted bike lane. Moreover, data collection with questionnaires has been used to explore factors influencing cycling comfort. Ayachi, Dorey, and Guastavino (Citation2015) stated that cycling comfort is affected by factors related to bicycle components, environmental factors and factors related to the cyclists themselves (body position, adjustments, anatomy). Fernández-Heredia, Monzón, and Jara-Díaz (Citation2014) documented four variables – namely convenience, pro-bike, physical determinants and exogenous restrictions – as key variables for understanding cyclists’ perceptions. Li et al. (Citation2012a) defined the physical environmental factors which influence cyclists’ perceptions of comfort regarding two types of facilities. They reported that road geometry and surrounding conditions on physically separated facilities and the effective riding space and traffic situation on on-street bicycle lanes are the most important factors that affect cyclists’ comfort.
Considering user perceptions is fundamental when dealing with new transport-related policies, investments and/or improvements to the current system. Recent studies have already highlighted the importance of collecting individual perceptions to help practitioners evaluate which transport improvements should be implemented.
Akar and Clifton (Citation2009) conducted a web survey within the campus of the University of Maryland to understand the specific issues that cyclists have to face and to help transportation planners be more aware of the main reasons preventing some people from bicycling. Another study by Li et al. (Citation2012b) investigated the psychological perception of comfort related to separated bike paths in Nanjing, China; additionally, Yamanaka, Pan, and Sanada (Citation2013) tested the relation between perception and behavior while using a bike, via a Probe Bicycle System. More recently, Fitch and Handy (Citation2018) compared the relationship between cyclists’ experiences and those of video survey participants in terms of cycling safety and comfort. They concluded that video survey participants felt less safe and comfortable than those who live the real-time experience.
Regardless of the type of research, questionnaires have constituted a main data collection tool in many different disciplines. The subject of the validity of questionnaires has been considered in previous research (Barbosa, Tureli, and Gavião Citation2009; Benson and Holmberg Citation1985). As a case in point, questionnaires are often the most practical solution in large-scale physical activity studies. A systematic review study of reliability and objective criterion-related validity of physical activity questionnaires reported that very few physical activity questionnaires showed good results on both reliability and validity (Helmerhorst et al. Citation2012). Another systematic review study on physical activity showed that questionnaires have good reliability; however, there is no evidence of good criterion validity compared to objective measures (Kwak et al. Citation2011). Lachat et al. (Citation2008) conducted a study to validate questionnaires in rural and urban areas. They concluded that, overall, both rural and urban questionnaires had poor validity and low reliability and classification properties in rural areas. This stream of research highlights the importance of confirming the validity and reliability of questionnaires in the transport field.
In this framework, and when considering the importance of individual perceptions when dealing with transportation-related matters, it is questionable whether a different data collection method may influence – and if so, to what extent – the final user responses. It is clear that collected data are the basis for further analysis in all studies, and that the effect range of different data collection methods should be evaluated to avoid biases in studies. Especially in cycling comfort and LOS studies, it is crucial to reflect cyclists’ perceptions of comfort in the collected data. A similar issue has been considered relevant in different research areas (for instance, the reader could refer to (Harrison et al. Citation2009) regarding a global health assessment via questionnaire, or (Lajunen and Summala Citation2003) about drivers’ self-reports). In particular, it has often been labeled with the words, ‘same question, different answers’ (Kilic and Sohnesen Thomas Citation2017). which means that the same question, submitted to the same person, might sometimes lead to a different answer due to different factors, such as a different context or a different wording of the question.
Originality and scope of the paper
In the realm of cycling comfort and LOS research, in-traffic questionnaires have been applied as one of the main tools to evaluate users’ perspectives; however, it is unclear whether the results would be the same using different data collection approaches. Furthermore, cyclists’ comfort has been treated as a single value at all levels, i.e. city-based, route-based and survey spot-based.
The novelty of this study is that it defined hierarchical levels of questions (related to comfort) which cyclists could use to express their opinions more explicitly about the cycling infrastructure. If cyclists had different opinions about different conditions of the cycling infrastructure, each opinion would not create a bias at the other levels. To better validate survey approaches, comparing the same questions in the in-traffic and online administration conditions, while maintaining their hierarchical levels, is suggested. Doing so could help planners and researchers design surveys more specific to their purposes.
Methodology
Data were collected by presenting cyclists with two questionnaire forms once they had stopped:
A paper form, to be answered in traffic;
An online form, to be answered online.
While the first questionnaire had to be answered immediately, the online version could be answered at a later time – at the cyclists’ own leisure – via a flyer with a weblink, when the stress of being stopped had faded away.
The two forms had the same items, expressing the same concepts, with slight differences in the phrasing of the questions (this aspect is discussed in subsection 3.3). Each form was composed of different statements/questions about various aspects of the urban cycling infrastructure, and the cyclists were asked to state their level of agreement via a Likert scale.
The following subsections demonstrate in detail the features included in the questionnaire’s design and implementation. This approach has general validity and can be applied to any urban context to deepen knowledge about users’ cycling perceptions.
Survey conditions
The survey was implemented in two different conditions:
In the first condition, called the in-traffic phase, cyclists were asked to stop on the road, i.e. in traffic. This can be difficult, since being stopped can make cyclists angry, which can in turn affect their responses to the questionnaire.
In the second condition, called the online phase, a rephrased version of the in-traffic questionnaire was designed. The aim here was to compare the answers to the in-traffic and online questions from each participant and to test for differences between the two conditions. Toward this end, a specific ID reference (unique, same for each respondent) was embedded in both forms.
Levels of questions
For the levels of questions, a hierarchical model has been proposed and implemented in similar areas (such as traffic safety), whereby different levels of risk have been attributed to different levels of conditions and perceptions (Van Der Molen and Bötticher Citation1988).
This hierarchical framework presents a different definition in terms of question design and perception levels:
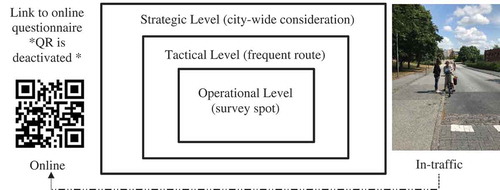
Strategic level: At this level (the highest level), the questions concentrated on revealing cyclists’ perceptions about the city-level (holistic view of the system/network);
Tactical level: This level refers to cyclists’ perceptions about their frequent routes (these can be either home-based or non-home-based routes);
Operational level: The survey spot is the lowest level in the framework. Cyclists were asked about their perceptions in the exact spot at which they were stopped by the interviewer.
Since being aware of the hierarchical framework used in this study could have affected cyclists’ answers, they were told only that the survey focused on their evaluations of comfort, without specifying that the actual aim of the research was to compare in-traffic and online answers at different hierarchical levels for consistency or variation. shows the implemented framework of the study.
Figure 1. Hierarchical framework of the study
Tone of questions
Although the main purpose of the study was to compare answers to online and in-traffic questions at various hierarchical levels, one ‘sub-analysis’ was conducted about the tone of the questions. The idea was to gain a preliminary understanding of whether differences in phrasing could impact how cyclists answered the questions in either condition. Moreover, it was assumed that questionnaire responses would be given reasonably quickly in the online phase; therefore, rephrasing the questions decreases the possibility of remembering the exact words and places of questions when responding. An internal assessment (with a small sample of 15 persons) was carried out to control the consistency of the meaning of each question in both questionnaire types. This process ensured that the rephrasing process did not generate any bias or misunderstandings of the meanings of the questions.
To evaluate how the tone of questions could have affected user perceptions in this study, we formulated the questions with two distinct tones:
A positive tone (asking cyclists, for example: ‘how easy … ?’, or ‘how good … ?’)
A neutral tone (a more subjective tone; for instance: ‘how would you rate … ?’)
Concepts like framing and anchoring are well-known in fields like psychology and behavioral economics; they suggest that if positive words are included in questions, the response rate might be slightly higher (Guyatt et al. Citation1999; Roszkowski and Soven Citation2010; Weems, Onwuegbuzie, and Lustig Citation2003).
The choice of tone used in the in-traffic and online questionnaires had to be randomized and paired such that if a positive phrase was used in the first condition, a neutral phrase was used in the second.
Data processing
The case study, the city of Lund, Sweden, was selected to preliminarily apply the proposed methodology due to its specific cycling-related features. Lund is located in the southern part of Sweden and has 121,274 inhabitants (Kommuner Citation2018). It is a relatively small city, and bicycling is the main transport mode (28%) after automobiles. According to the Lund municipality, bicycle traffic has increased by about 30% over the past 20 years; moreover, the city has among the largest number of cyclists in Sweden (Trafiken Citation2018).
Some specific data collection spots were selected considering that Lund University is an important component in attracting cyclists. All data collection spots had the same conditions (e.g. pavement quality, accessibility, modal interaction and so on) on a path between the Faculty of Engineering and a student housing area (where many student houses are located). The chosen path was also used by other individuals (not students), but they were not asked to participate in the study since they were expected to be less prone to completing the second phase (the online questionnaire).
The cyclists were stopped within time intervals and asked to fill out the in-traffic form. Then, the cyclists were given a flyer with a short URL and a QR-code () for use in completing the online version.
Questionnaire design
In this subsection, the main points regarding the questionnaire design (more extensively described in Section 3) are addressed.
Survey conditions
To permit the comparison of the answers to the in-traffic and online questionnaires of each respondent, a specific code was embedded in both forms that was unique to each respondent. This individual code has been required to the respondent before starting to fill in the online questionnaire. This approach guaranteed completely anonymous data handling in both the data collection and analysis phases.
Variable selection
Two different approaches were employed to correctly select the variables relevant to the case study. In the first approach, an extensive review of the literature was conducted to identify a wide range of variables. In the second approach, two focus groups (namely, one group of undergraduate students in the Faculty of Engineering, and one group of random cyclists and pedestrians on campus) were preliminarily interviewed. The interview process was smooth and friendly in an attempt to gain a deeper understanding of the users’ main concerns connected to comfort. The set of variables which had the greatest effect in both approaches was selected for the study. Consequently, pavement quality (Var i), modal interaction (Var j) and lane accessibility (Var q) were ultimately selected as the main study variables and were subsequently formulated and organized according to each level of the hierarchy.
Levels of questions
Based on the selected variables, nine questions were formulated (three for each level) in the city-level (strategic level), frequent route-level (tactical level) and survey spot-level (operational level) hierarchy.
Tone of questions
To avoid perplexities with the online/paper-dimension and to properly randomize the positive and neutral tones, two questionnaire designs were developed, A and B, as mirror images of one another. So, if Design A used a positive tone on Question 1 in the in-traffic questionnaire, and a neutral tone on the same question in the online version, then Design B did the reverse, with a neutral tone used on Question 1 in the in-traffic version, and a positive tone used on the same question in the online version. We attempted to keep the questions simple and easy for the respondents, thereby allowing them to understand and answer each question properly. shows the survey framework: Var i,j,q stand for LOS variables, while the positive/negative (+/) symbols were attributed, respectively, to the positive and neutral tones of the questions. The concept behind this framework was inspired by previous studies in traffic safety (Van Der Molen and Bötticher Citation1988).
Figure 2. Hierarchical survey diagram
Data overview
In total, 258 responses to the in-traffic questionnaire were collected, of which 120 were accompanied by responses to the online questionnaire (with an online answering rate close to 50%). The study location (road segments) remained the same for all respondents for the duration of the study. The researchers attempted to use the same approach to stop cyclists and administer the questionnaires. The interviewers did not provide any specific time duration for completing the in-traffic questionnaires so as not to pressure the respondents. However, it typically took no more than five minutes to complete each in-traffic questionnaire. On the other hand, respondents were asked to complete the online questionnaires as soon as possible (within 24 hours of completing the in-traffic questionnaire). We do not believe that this time restriction generally affected the responses. If the cyclists decided to stop, they were (on average) willing to stay and complete the questionnaires; otherwise, they did not stop at all.
Associated with the research question, several control questions were included to, for instance, determine whether negative emotions caused by being stopped in traffic affected cyclists’ in-traffic responses. The following issues were also assessed:
If the gender of the bicyclists may have influenced their responses;
If the different levels of bike usage may have affected responses – with the expectation that neither of these factors should make any difference.
Questionnaire validation
The completed questionnaires were validated using Cronbach’s alpha analysis (Cronbach Citation1951). Cronbach’s alpha is commonly used to assess the internal consistency of a questionnaire (or survey) that makes use of multiple Likert-type scales and items.
A low Cronbach’s alpha indicates a lack of correlation between the items in a scale, which makes summarizing the items unjustified. A very high Cronbach’s alpha indicates a high correlation among the items in the scale, i.e. the redundancy of one or more items. Furthermore, a very high Cronbach’s alpha is usually found for scales with a large number of items, because Cronbach’s alpha is dependent upon the number of items in the scale. Note that Cronbach’s alpha gives no information on the number of subscales in a questionnaire, since alpha can be high when two or more subscales with high alphas are combined. Nunnally and Bernstein (Citation1994) proposed a criterion of 0.70–0.90 as a measure of good internal consistency. However, other studies assessed a positive rating for internal consistency even for Cronbach’s alpha values that oscillate between 0.65 and 0.95 (Panayiotis Citation2013).
present the results by reporting the summary statistics of each question and the related Cronbach’s alphas in two different ways: the general validity of the questionnaires, and the alphas for each item, which represent the value that Cronbach’s alpha would have by removing that specific item.
Table 1. Summary result of Cronbach’s alpha test in online questionnaires
Table 2. Summary result of Cronbach’s alpha test in in-traffic questionnaires
All the items reported in have Cronbach’s alpha values (K) within the limit for internal consistency, thereby validating the questionnaire.
Data analysis
For the evaluation of the differences between the responses on the online and in-traffic questionnaires, the data were first transformed to provide a binary response. To this end, a threshold was set to define when an answer expressed a clear positive opinion, considering lower scores as neutral or negative. A positive response was defined when the average rate was equal to or greater than 7, while a neutral-negative response was defined when the average rate was 6 to zero. The threshold of 7 was chosen in order to keep a strictly positive response and to avoid a possible neutral response (such as a rate of 5 or 6). This approach was used to avoid binary responses to the questions (i.e. yes/no) and thereby give the respondents the freedom to express their opinions. However, the real intent was to investigate whether their answers were consistent in a general way, either positively or negatively (distinguishing the really positive responses from the negative/neutral responses).
For this purpose, the Bayes ‘proportions’ method was used to compare the proportions of positive answers among the three different classes of questions, considering a random tone and different phrasings of the items on the online and in-traffic questionnaires.
The proportions method compared the proportions of positive answers among the two different questionnaire approaches for the three levels (Cafiso, La Cava, and Pappalardo Citation2012; Lyon et al. Citation2007).
The proportion of positive answers for sample i (in-traffic or online questionnaire) was defined as µi (EquationEquation 1(1)
(1) ):
where xi is the number of positive answers in sample i, and ni is the total number of answers in the same questionnaire.
Considering m = 2, i.e. the two different samples included in this research (in-traffic and online questionnaires), the mean proportion of the positive answers is given by EquationEquation 2(2)
(2) :
The premise of the ‘proportions’ method is that if the true proportion of sample i is μi, then the probability of observing xi positive answers with ni total questions is given by the Binomial distribution:
Moreover, the parameter μi will vary between the respondents and is assumed to follow the Beta distribution, defined as:
where , with
= gamma function.
The parameters α e β of the Beta distribution can be estimated from the sample mean and the variance of a reference population, using the following equations:
where s2 is the variance given by
Using Bayes theorem, the prior Beta distribution is combined with sample i specific proportion of positive answers (ni, xi) to derive the adjusted posterior distribution that is again a beta distribution:
where αi’e βi’ are posterior parameters defined as:
For the posterior distribution, the mean value and variance for each site i can be calculated with the following equations:
Defining and μmi, respectively the median of the prior and posterior distributions, the probability P(
) is given by:
Based on the not large sample dimension, a probability of 95% can be assumed as acceptable for considering the difference to be significant. In the present work, the methodology was adapted to the case study to assess the difference between the two proportions by taking one of the two as a reference (online and in-traffic questionnaires) and assessing the difference of the proportion when only one exceed with a probability of 95%, the inverse of the posterior distribution.
The responses to the questions related to the operational level were the only results to provide a difference between the two questionnaire types. below reports the parameters computed in the estimation of the posterior distribution of the Bayesian proportion.
Table 3. Parameters of the estimation of the posterior distribution of the Bayesian proportion for the operational level set of questions
For the strategic and tactical levels, the methodology reported no differences between the online and in-traffic questionnaires. The same result occurred when a lower threshold was chosen – that is, when selecting a threshold equal to 5 or 6 between positive and negative answers, no differences were detected between the in-traffic and online responses. From an analytical perspective the posterior means showed as their reflect the actual proportions with a set probability of 0.95.
The city of Lund (strategic level) seems to globally have a configuration that leads to a good level of comfort, especially concerning the lane accessibility variable. reports summary statistics proportion of positive vs. negative and neutral in the different hierarchical levels.
Table 4. Summary statistics of proportion of positive vs. negative and neutral with threshold equal to six in the different hierarchical levels
At the operational level, both the modal interaction and the pavement quality variables showed very similar data configurations, with one-half of the observations following in a range greater than the third quartile of both the strategic and the tactical levels. On the other hand, lane accessibility showed a different trend (looking at the strategic level data in comparison with the data from the other two levels). These results are related to the inherent characteristics of the selected survey spots, which reflect the diverse range of individual comfort perceptions of the cyclists.
Since the collected data demonstrated a good distribution of gender, and they included a randomized tone in the questions, these two variables were checked separately in both the online and in-traffic questionnaires, and also within each group. We explored the tone of the questions and the gender of the respondents at each hierarchical level to determine statistically significant differences based on these variables. However, we can conclude that, at least in this study context, neither the gender of the respondents nor the tone of the questions (neutral and positive) had any effect on the responses.
Results and discussion
In all studies dependent on survey data, it is crucial to have an accurate data collection method. Bicycle comfort and LOS studies often use questionnaires for in-traffic conditions. Cyclists are stopped in traffic, which is clearly difficult, and the act of stopping them can understandably stoke negative emotions, which might affect their responses to the questionnaire. According to the collected responses, it appears that responses to the online version of the questionnaire were more positive. These results might be interpreted considering that the act of stopping cyclists is itself difficult; consequently, this could affect their final evaluation of comfort. However, these higher comfort ratings are supported by data only at the operational level, the only level to show statistically significant differences.
If this result could generally be taken to imply that cyclists are subconsciously affected by the level of the questions, then survey conditions, such as in-traffic and online, should be properly selected based on the research purpose. Another explanation may be that cyclists could lose some information about survey spot features while answering the online questions related to the operational level. However, in this study, all responses were received within 24 hours of the in-traffic survey.
The requirement was to answer to the online questionnaire not straight away but within 24 hours. The main difference between the online and in-traffic responses was the context in which the cyclist was standing – either ‘in traffic’ or in a more comfortable environment. It is not really a matter of remembering the scores that have been attributed. On the contrary, the ‘24-hour interval’ was set intentionally to avoid the cyclists ‘forgetting’ the network information connected to the operational level. Strategic and tactical questions are more general, being linked with the general perception each cyclist has on a medium/large scale, and this is probably the reason why we found a greater consistency. Furthermore, the choice of the tone used in the in-traffic and online questionnaires was randomized and paired. This additional aspect decreased the possibility of recalling the exact answers given to each question during the in-traffic administration.
Since 80% of the cyclists claimed to use a bicycle on a daily basis, the probability of forgetting information at the operational level was reduced.
As people tend to be more positive regarding their cycling comfort when answering the same questions at home, we can conclude that some kind of pressure is exerted on cyclists when they are stopped in the road and asked to answer questions. However, the final aim of the present research was not to define the most suitable way to issue a questionnaire to cyclists but rather to investigate whether the manner in which a questionnaire is administered may influence the general perceptions of infrastructure. This paper could be helpful for practical and academic applications, specifically those aimed at reducing the burden of data collection or improving sample sizes. Planners and academics could coordinate their data collection methods (in-traffic or online) based on the chosen level of analysis. For instance, when what is needed is the evaluation of the strategic and tactical aspects of a given infrastructure, we have demonstrated that the survey method does not affect the results; hence, it is expected that the responses would be quite similar.
The hierarchical structure presented in this study may also assist planners and researchers when carrying out an analysis at different levels in the network. In this way, the bias of having one opinion about one level of infrastructure would not affect other levels, and the result would be more concrete per se. The consistent answers for both the strategic and tactical levels in both questionnaire approaches imply that both administrations could convey sufficient information without losing any important information.
These preliminary results suggest the need for further study, as the method presented here may be a valuable and simple way to assist cycling planners in making decisions and enhancing cycling conditions for a greater number of users. Indeed, different survey outcomes affect the decision-making process, which can result in the adoption of different policies and implementation strategies related to cycling infrastructures, from the perspective of meeting the needs of the largest possible number of users in a given population. This could be crucial to gaining a proper comprehension of individual feelings and perceptions, with the long-term goal of better promoting urban cycling by making it more appealing to all potential users.
Conclusion
This study investigated the possibility of presenting the cyclists, once stopped, with a link to an online questionnaire, which they could then answer at their own leisure without the stress of being stopped in traffic. The novelty of this study was its introduction of hierarchical levels of user perception (comfort consideration) in the case of comfort rating: strategic level (city level), tactical (frequent route level) and operational level (survey spot level).
After applying the Bayesian proportion method to check whether the online questionnaires had the same proportion of positive answers (in the extreme value). The results show that respondents expressed the same opinions for the strategic and tactical levels in the online and in-traffic questionnaires. However, at the operational level, the opinions expressed were more positive in the online questionnaire.
The results of the comparison show that people tended to answer in mostly the same way concerning the strategic and tactical level questions, both online and in traffic. This implies that if the planner/practitioner wants to make general improvements/changes related to the cycling network/infrastructure or policies of any urban context, it may be okay to stop cyclists on the road in order to collect their opinions about such issues. The same cannot be done if a more detailed level is the target of the investigation.
Disclosure Statement
No potential conflict of interest was reported by the authors.
References
- Akar, G., and K. Clifton. 2009. “Influence of Individual Perceptions and Bicycle Infrastructure on Decision to Bike.” Transportation Research Record: Journal of the Transportation Research Board 2140: 165–172. doi:10.3141/2140-18.
- Asadi-Shekari, Z., M. Moeinaddini, and M. Zaly Shah. 2013. “Non-motorised Level of Service: Addressing Challenges in Pedestrian and Bicycle Level of Service.” Transport Reviews 33 (2): 166–194. doi:10.1080/01441647.2013.775613.
- Ayachi, F. S., J. Dorey, and C. Guastavino. 2015. “Identifying Factors of Bicycle Comfort: An Online Survey with Enthusiast Cyclists.” Applied Ergonomics 46: 124–136. doi:10.1016/j.apergo.2014.07.010.
- Bai, L., P. Liu, C.-Y. Chan, and Z. Li. 2017. “Estimating Level of Service of Mid-block Bicycle Lanes considering Mixed Traffic Flow.” Transportation Research Part A: Policy and Practice 101: 203–217. doi:10.1016/j.tra.2017.04.031.
- Barbosa, T. S., M. C. M. Tureli, and M. B. D. Gavião. 2009. “Validity and Reliability of the Child Perceptions Questionnaires Applied in Brazilian Children.” BMC Oral Health 9 (1): 13. doi:10.1186/1472-6831-9-13.
- Benson, G., and M. B. Holmberg. 1985. “Validity of Questionnaires in Population Studies on Drug Use.” Acta Psychiatrica Scandinavica 71 (1): 9–18. doi:10.1111/j.1600-0447.1985.tb05045.x.
- Beura, S. K., and P. K. Bhuyan. 2017. “Development of A Bicycle Level of Service Model for Urban Street Segments in Mid-sized Cities Carrying Heterogeneous Traffic: A Functional Networks Approach.” Journal of Traffic and Transportation Engineering (English Edition) 4 (6): 503–521. doi:10.1016/j.jtte.2017.02.003.
- Botma, H. 1995. “Method to Determine Level of Service for Bicycle Paths and Pedestrian-Bicycle Paths.” Transportation Research Record (1502): 38–44.
- Burbidge, S., and K. Goulias. 2009. “Active Travel Behavior.” Transportation Letters 1 (2): 147–167. doi:10.3328/TL.2009.01.02.147-167.
- Cafiso, S., G. La Cava, and G. Pappalardo. 2012. “A Comparative Analysis of Powered Two Wheelers Crash Severity among Different Urban Areas.” Procedia - Social and Behavioral Sciences 53: 890–899. doi:10.1016/j.sbspro.2012.09.938.
- Chen, C. Y., S. Yan, and L. Wang. 2015. “A Model with A Solution Algorithm for the Planning of A Preliminary Commuter-bikeway Network under A Roadway Network System.” Transportation Letters: the International Journal of Transportation Research 7 (5): 289–299. doi:10.1179/1942787514Y.0000000049.
- Chen, S. Y., and C. C. Lu. 2015. “Investigating the Psychology of Green Transportation via the Green Service Profit Chain.” Transportation Letters 7 (3): 143–153. doi:10.1179/1942787514Y.0000000043.
- Chen, S.-Y. 2019. “Eco-friendly Value or Others’ Environmental Norms? Arguing the Environmental Using Psychology of Bike-sharing for the General Public.” Transportation Letters 11 (8): 425–435. doi:10.1080/19427867.2017.1379722.
- Cronbach, L. J. 1951. “Coefficient Alpha and the Internal Structure of Tests.” Psychometrika 16 (3): 297–334. doi:10.1007/BF02310555.
- Davis, A., J. H. Lee, and K. G. Goulias (2016). “Taking Place Attitudes into Travel Behavior Research.” Paper presented at the Transportation Research, Board.Washington DC, United States
- de Abreu E Silva, J., L. Martinez, and K. Goulias. 2012. “Using a Multi Equation Model to Unravel the Influence of Land Use Patterns on Travel Behavior of Workers in Lisbon.” Transportation Letters 4 (4): 193–209. doi:10.3328/TL.2012.04.04.193-209.
- Debois, S. (2019). https://surveyanyplace.com/questionnaire-pros-and-consAccessed on 07 10 2019
- Fernández-Heredia, Á., A. Monzón, and S. Jara-Díaz. 2014. “Understanding Cyclists’ Perceptions, Keys for a Successful Bicycle Promotion.” Transportation Research Part A: Policy and Practice 63: 1–11. doi:10.1016/j.tra.2014.02.013.
- Fitch, D. T., and S. L. Handy. 2018. “The Relationship between Experienced and Imagined Bicycling Comfort and Safety.” Transportation Research Record 2672 (36): 116–124. doi: 10.1177/0361198118787635.
- Guyatt, G. H., D. J. Cook, D. King, G. R. Norman, S. L. Kane, and C. van Ineveld. 1999. “Effect of the Framing of Questionnaire Items regarding Satisfaction with Training on Residents’ Responses.” Academic Medicine 74 (2): 192–194. https://journals.lww.com/academicmedicine/Fulltext/1999/02000/Effect_of_the_framing_of_questionnaire_items.18.aspx
- Harrison, M. J., A. Boonen, P. Tugwell, and D. P. Symmons. 2009. “Same Question, Different Answers: A Comparison of Global Health Assessments Using Visual Analogue Scales.” Quality of Life Research: an International Journal of Quality of Life Aspects of Treatment, Care and Rehabilitation 18 (10): 1285–1292. doi:10.1007/s11136-009-9546-3.
- HCM. 2000. HCM: Transportation Reserach Board of National Academic. Washington, DC.
- Heinen, E., K. Maat, and B. Wee. 2011. “The Role of Attitudes toward Characteristics of Bicycle Commuting on the Choice to Cycle to Work over Various Distances.” Transportation Research Part D: Transport and Environment 16 (2): 102–109. doi:10.1016/j.trd.2010.08.010.
- Helmerhorst, H. H. J. F., S. Brage, J. Warren, H. Besson, and U. Ekelund. 2012. “A Systematic Review of Reliability and Objective Criterion-related Validity of Physical Activity Questionnaires.” International Journal of Behavioral Nutrition and Physical Activity 9 (1): 103. doi:10.1186/1479-5868-9-103.
- Hood, J., E. Sall, and B. Charlton. 2011. “A GPS-based Bicycle Route Choice Model for San Francisco, California.” Transportation Letters 3 (1): 63–75. doi:10.3328/TL.2011.03.01.63-75.
- Hummer, J., N. Rouphail, R. Hughes, S. Fain, J. Toole, R. Patten, … A. Do. 2005. “User Perceptions of the Quality of Service on Shared Paths.” Transportation Research Record: Journal of the Transportation Research Board 1939: 28–36. doi:10.3141/1939-04.
- Jensen, S. 2007. “Pedestrian and Bicyclist Level of Service on Roadway Segments.” Transportation Research Record: Journal of the Transportation Research Board 2031: 43–51. doi:10.3141/2031-06.
- Jensen, S. (2013). “Pedestrian and Bicycle Level of Service at Intersections, Roundabouts, and Other Crossings.” https://www.trafitec.dk/sites/default/files/publications/ped%20bike%20los%20at%20intersec.pdf
- Kilic, T., and P. Sohnesen Thomas. 2017. “Same Question but Different Answer: Experimental Evidence on Questionnaire Design’s Impact on Poverty Measured by Proxies.” Review of Income and Wealth. doi:10.1111/roiw.12343.
- Kommuner, S. (2018). https://www.scb.se/hitta-statistik/sverige-i-siffror/kommuner-i-siffror/#?region1=1281®ion2=00 Accessed on 07 10 2019
- Kwak, L., K. I. Proper, M. Hagströmer, and M. Sjöström. 2011. “The Repeatability and Validity of Questionnaires Assessing Occupational Physical Activity - a Systematic Review.” Scandinavian Journal of Work, Environment & Health 37 (1): 6–29. Retrieved from www.jstor.org/stable/40967883
- Lachat, C. K., R. Verstraeten, L. N. B. Khanh, M. Hagströmer, N. C. Khan, N. D. A. Van, … P. W. Kolsteren. 2008. “Validity of Two Physical Activity Questionnaires (IPAQ and PAQA) for Vietnamese Adolescents in Rural and Urban Areas.” International Journal of Behavioral Nutrition and Physical Activity 5 (1): 37. doi:10.1186/1479-5868-5-37.
- Lajunen, T., and H. Summala. 2003. “Can We Trust Self-reports of Driving? Effects of Impression Management on Driver Behaviour Questionnaire Responses.” Transportation Research Part F: Traffic Psychology and Behaviour 6 (2): 97–107. doi:10.1016/S1369-8478(03)00008-1.
- LaMondia, J., and C. Bhat. 2011. “A Study of Visitors’ Leisure Travel Behavior in the Northwest Territories of Canada.” Transportation Letters 3 (1): 1–19. doi:10.3328/TL.2011.03.01.1-19.
- Leao, S. Z., S. N. Lieske, and C. J. Pettit. 2017. “Validating Crowdsourced Bicycling Mobility Data for Supporting City Planning.” Transportation Letters 1–12. doi:10.1080/19427867.2017.1401198.
- Li, Z., W. Wang, P. Liu, and D. R. Ragland. 2012a. “Physical Environments Influencing Bicyclists’ Perception of Comfort on Separated and On-street Bicycle Facilities.” Transportation Research Part D: Transport and Environment 17 (3): 256–261. doi:10.1016/j.trd.2011.12.001.
- Li, Z., W. Wang, P. Liu, R. Schneider, and D. Ragland. 2012b. “Investigating Bicyclists’ Perception of Comfort on Physically Separated Bicycle Paths in Nanjing, China.” Transportation Research Record: Journal of the Transportation Research Board 2317: 76–84. doi:10.3141/2317-10.
- Lyon, C., B. Gotts, W. K. F. Wong, and B. N. Persaud. 2007. “Comparison of Alternative Methods for Identifying Sites with High Proportion of Specific Accident Types.” Transportation Research Record: Journal of the Transportation Research Board 2019 1: 212–218. Retrieved from.
- Mekuria, M. C., P. G. Furth, and H. Nixon. (2012). “Low-stress Bicycling and Network Connectivity.” https://merritt.cdlib.org/d/ark:%2F13030%2Fm5b32gx5/1/producer%2FMTI%20Report%2011-19.pdf
- Melson, C. L., J. C. Duthie, and S. D. Boyles. 2014. “Influence of Bridge Facility Attributes on Bicycle Travel Behavior.” Transportation Letters 6 (1): 46–54. doi:10.1179/1942787513Y.0000000010.
- Nunnally, J. C., and I. H. Bernstein. 1994. “The Assessment of Reliability.” Psychometric Theory (1): 248–292.
- Panayiotis, P. 2013. “Coefficient Alpha: Interpret With Caution.” Europe’s Journal of Psychology 9: 4.
- Petritsch, T. A., B. W. Landis, H. F. Huang, P. S. McLeod, D. R. Lamb, W. Farah, and M. Guttenplan. 2007. “Bicycle Level of Service for Arterials.” Transportation Research Record: Journal of the Transportation Research Board 2031: 34–42.
- Roszkowski, M. J., and M. Soven. 2010. “Shifting Gears: Consequences of Including Two Negatively Worded Items in the Middle of a Positively Worded Questionnaire.” Assessment & Evaluation in Higher Education 35 (1): 113–130. doi:10.1080/02602930802618344.
- Ruiz, T., and P. García-Garcés. 2015. “Measuring the Impact of Travel Behavior Change Programs on the Activity Scheduling Process.” Transportation Letters 7 (2): 104–113. doi:10.1179/1942787514Y.0000000037.
- Sivakumar, A., R. Batley, and J. Polak. 2012. “Toward the Future of Travel Behaviour and Demand Modelling.” Transportation Letters 4 (2): 75–77. doi:10.3328/TL.2012.04.02.75-77.
- Trafiken, S. (2018). https://www.lund.se/trafik–stadsplanering/trafik-och-gator/trafiken-i-siffror/ Accessed on 07 10 2019
- Van Der Molen, H. H., and A. M. T. Bötticher. 1988. “A Hierarchical Risk Model for Traffic Participants.” Ergonomics 31 (4): 537–555. doi:10.1080/00140138808966698.
- Verma, M., T. M. Rahul, P. V. Reddy, and A. Verma. 2016. “The Factors Influencing Bicycling in the Bangalore City.” Transportation Research Part A: Policy and Practice 89: 29–40. doi:10.1016/j.tra.2016.04.006.
- Weems, G. H., A. J. Onwuegbuzie, and D. Lustig. 2003. “Profiles of Respondents Who Respond Inconsistently to Positively- and Negatively-worded Items on Rating Scales.” Evaluation & Research in Education 17 (1): 45–60. doi:10.1080/14664200308668290.
- Yamanaka, H., X. Pan, and J. Sanada. 2013. “Evaluation Models for Cyclists’ Perception Using Probe Bicycle System.” Journal of the Eastern Asia Society for Transportation Studies 10: 1413–1425. doi:10.11175/easts.10.1413.