
 ?Mathematical formulae have been encoded as MathML and are displayed in this HTML version using MathJax in order to improve their display. Uncheck the box to turn MathJax off. This feature requires Javascript. Click on a formula to zoom.
ABSTRACT
This study considered two types of congestion pricing, high-occupancy toll (HOT) lanes and cordon pricing, and the factors influencing their public acceptability if they are to be implemented in Abu Dhabi city in the United Arab Emirates (UAE). A revealed preference (RP) and stated preference (SP) surveys were conducted in the city to collect data. The public acceptability was analyzed based on respondents’ willingness to pay (WTP) a toll or cordon fee to circumvent congestion. Furthermore, the distribution of the generated revenue was analyzed as an additional indicator of public acceptability. The results indicated that trip conditions (travel speed, travel distance, and trip urgency); respondents’ age, income, employment status, and car ownership; and toll fees are significant factors in determining public acceptability of HOT lanes, while respondents’ average monthly income, age, employment status, car ownership, and saving in travel time are significant factors of determining public acceptability of cordon pricing.
Introduction
Many transportation economists and traffic planners consider congestion pricing an effective way to reduce road congestion and associated negative impacts of the transportation system, such as the environmental impact (Franz Citation2020; Abulibdeh Citation2017; Anas and Lindsey Citation2011; King, Manville, and Shoup Citation2007). The cities worldwide, such as Singapore in Asia, and London, Stockholm, Valetta, Rome, and Milan in Europe, have applied cordon pricing, area-wide pricing, and other congestion-pricing policies, while cities in North America and Canada, such as Toronto, Los Angeles, Atlanta, Oakland, Miami, Denver, and San Diego, have applied HOT lanes. Their success has resulted in increasing the interest in introducing or evaluating congestion-pricing policies in a number of other cities (e.g., Gothenburg, Copenhagen, San Francisco, Jakarta, Budapest, and Sydney). However, the number of cities that have actually implemented congestion pricing is still limited – some of the critical reasons for their non-implementation are public rejection and concerns. Thus achieving public acceptance is considered by practitioners to be an essential precondition for successful implementation of such schemes (Hess and Börjesson Citation2019; Grisolía, López, and Ortúzar Citation2015; Sikow-Magny Citation2003). The lack of public support for congestion-pricing policies has been reported in cities like New York, Manchester, and Edinburgh (Schaller Citation2010; Ryley and Gjersoe Citation2006).
Various studies have been conducted on high-occupancy toll (HOT) lanes and cordon pricing, while concentrating on four main areas: drivers’ willingness to pay (WTP) and how it is influenced by drivers’ socioeconomic characteristics and trip conditions e.g., (Abulibdeh and Zaidan Citation2018; Finkleman, Casello, and Fu Citation2011); public acceptance of congestion pricing e.g., (Hess and Börjesson Citation2019; Grisolía, López, and Ortúzar Citation2015; Schuitema, Steg, and Rothengatter Citation2010); the equity impact (Abulibdeh Citation2018; Abulibdeh, Andrey, and Melnik Citation2015; Abulibdeh Citation2013); and appropriate modeling and statistical measures to investigate WTP (Abulibdeh, Zaidan, and Alkaabi Citation2018).
There is also a growing research interest in public acceptability of congestion pricing (Hess and Börjesson Citation2019; Grisolía, López, and Ortúzar Citation2015; Hensher and Bliemer Citation2014; Chorus et al. Citation2011; Noordegraaf, Annema, and van Wee Citation2014; Odeck and Kjerkreit Citation2010). Some studies have examined the factors that may contribute to low or high acceptance of congestion pricing. Others have focused on lessons learnt from the existing congestion-pricing schemes and identified the importance of the level of information given to users about the pricing policy, its prospective benefits, revenue generation, and revenue usage (Abulibdeh Citation2013). The practice of cordon pricing in Stockholm successfully demonstrates that acceptability of congestion-pricing scenarios tends to increase with familiarity and after drivers experience the benefits of the system (Eliasson and Jonsson Citation2011; Schuitema, Steg, and Rothengatter Citation2010). Other research has focussed on public acceptability of hypothetical charging scenarios using different methodologies, particularly stated-preference surveys and discrete choice modeling (Petrik, de Abreu E Silva, and Moura Citation2016; Li and Hensher Citation2012). Such studies have concluded that public acceptability scenarios should be addressed prior to implementing congestion pricing. Recent reviews have identified the following four critical factors affecting public acceptability of congestion-pricing scenarios:
(1) Self-interest: Self-interest aspect includes the toll fees paid by drivers, the travel time saved, and spending of the revenue generated. Some travelers may view these schemes from a cost-benefit perspective, whereas those who use their cars to commute daily can be expected to be more opposed than those who use public transportation (Gehlert et al. Citation2011; Kottenhoff and Brundell-Freig Citation2009; Cain Citation2005). The acceptability of congestion-pricing scenarios can be expected to be positively associated with each driver’s value of time, suggesting that if the value gained by time saved is higher than toll fees, then a rational and self-interested driver would support the policy. Other drivers will not support it unless they see the benefit they gain from the usage of the revenue generated (Li, Citation2020; Fan Citation2017; Borjesson and Kristoffersson Citation2012; Verhoef and Small Citation2004). The knowledge of the negative effects of using private automobiles can lead to higher public acceptability of congestion pricing (Steg, Citation2003). For instance, the individuals who have a strong concern about environment can be expected to support congestion pricing. The expectation of personal benefits is reported to be one of the main explanatory factors for the acceptability of congestion pricing (Schade and Schlag Citation2003). For example, in a referendum on congestion pricing in Edinburgh in 2005, the car drivers were significantly more found to be prone to vote ”No” than non-drivers (Gaunt, Rye, and Allen Citation2007).
(2) Revenue generation: The lack of public acceptance of congestion pricing is attributed by many researchers to the lack of confidence in the government’s use of the revenue generated (Eliasson and Jonsson Citation2011; Kim et al. Citation2013; Hensher and Li Citation2013; Hensher Citation2013). Acceptability increases when people have clear information about the final use of the revenue generated as it indicates the potential benefits that can be derived from congestion pricing (Abulibdeh Citation2013; Albalate and Bel Citation2009; Steg, Citation2003). Collective outcomes and benefits, including the development of public transport, environmental improvements, and equity and environmental justice, are reported to be vital for public acceptability than individual income (Rentziou et al. Citation2011; Schuitema, Steg, and van Kruining Citation2001; Kottenhoff and Brundell-Freig Citation2009). Different studies highlight the association between referendum voting intentions and congestion-pricing acceptability and underline the significance of providing information to public about the effectiveness and efficiency of the system and its potential impact on road congestion. Hence, the transportation authorities must appropriately and adequately market any proposed congestion-pricing scheme (Cools et al. Citation2011; Ardic, Annema, and Van Wee Citation2013).
(3) Equity among different socioeconomic groups: This issue is considered one of the most important obstacles to public acceptance (Abulibdeh, Andrey, and Melnik Citation2015; Levinson Citation2010). Some socioeconomic groups, particularly low-income drivers, may be disproportionately affected by congestion pricing.
(4) Particular features of the pricing scheme: These include the area covered, period of charging, and the amount of the toll paid (Kockelman and Kalmanje Citation2005). The complexity of a scheme may also decrease public acceptability since people may have difficulty in understanding the scheme (De Palma, Lindsey, and Proost Citation2007; Hensher Citation2013).
The aim of this study was to perform a quantitative assessment of drivers’ acceptance of two hypothetical congestion-charging scenarios, HOT lanes and cordon pricing, considering their implementation in Abu Dhabi city. The intention was not to compare the two scenarios as each one has different characteristics and conditions. Public acceptability was assessed as a function of drivers’ WTP, travel time saved, and distribution of the generated revenue. WTP is a technical term derived from the concept of income equivalency (Hicksian measurement of welfare adjustments). In transport (discrete choice in general) the term has been adapted to describe marginal WIP to pay or measurement of substitution between money and other attributes. In this study, WTP was used to describe a stated price point. WTP was considered as a utility of the influence caused by drivers’ socioeconomic characteristics and trip conditions. Different trip conditions and drivers’ socioeconomic characteristics identified in the literature were considered when examining the drivers’ WTP for decreasing their travel time. In terms of trip conditions, trip frequency, travel time, travel speed and distance, toll rate, desired arrival time, trip urgency, and trip purpose have been identified as key determinants of WTP (e.g., Abulibdeh, Zaidan, and Alkaabi Citation2018; Hawas, Hassan, and Abulibdeh Citation2016; Finkleman, Casello, and Fu Citation2011; Davis III, Sinha, and Mannering Citation2009; Ozbay, Yanmaz-Tuzel, and Holguin-Veras Citation2006; Senbil and Kitamura Citation2006; Burris and Stockton Citation2004); these determinants were considered in this study to evaluate WTP. An additional aim was to investigate the public acceptability of cordon pricing as a valuable utility to save time. HOT lanes have been implemented in many cities of North America, while cordon pricing has been implemented in some cities of Europe and in Singapore but not in the Middle East cities. The overall goal of the study was to improve the understanding of the factors influencing the successful implementation of congestion-pricing policies that could increase their public acceptability.
Methodology and data collection
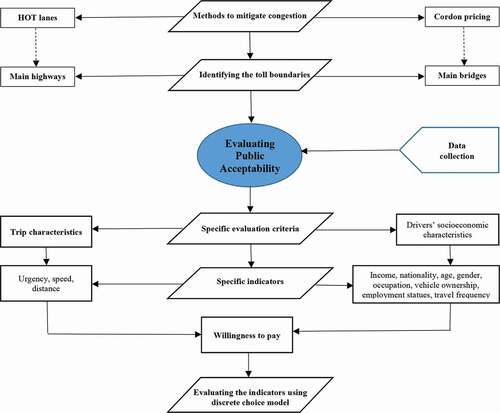
This section describes the methods, spatial unit of analysis, data sources, and variables used in the study. The steps illustrated in were followed to analyze and measure public acceptability of the two strategies.
Figure 1. Proposed methodology for assessing the implementation of HOT lanes and/or cordon pricing in Abu Dhabi city.
Methods
To investigate the acceptability of HOT lanes and cordon pricing, the general approach adopted in this study was to analyze the WTP under different trip conditions and commuters’ socioeconomic factors, in addition to analyzing revenue distribution scenarios. The insight into the acceptability of congestion-pricing policies was obtained through discrete choice modeling (binary logistic regression, generalized linear-mixed model, and linear regression with repeated measures model), and the analysis of trip characteristics and respondents’ socioeconomic characteristics. The aim of the models was to envisage and comprehend drivers’ willingness to use different congestion-pricing policies at all. Two groups of explanatory variables were used: (i) trip conditions including trip urgency, travel speed, and travel distance; and (ii) socioeconomic attributes of commuters such as household income, age, employment status, nationality, gender, and education.
Analyzing drivers’ WTP to escape the congestion based on trip conditions and their socioeconomic characteristics provided a way of investigating their acceptance of congestion-pricing policies. The hypothesis stated that any driver willing to pay the toll fee would be willing to accept the policy whereas any driver not willing to pay would not be willing to accept the policy. In other words, modeling drivers’ WTP to use HOT lanes is a useful tool for estimating the scheme’s acceptability as drivers who refuse to use HOT lanes at any non-zero price would represent those who oppose the underlying principle of HOT lanes.
The utility function is usually expressed by a linear model consisting of a group of explanatory variables that are elements affecting the dependent variable. In this study, the utility function of accepting congestion-pricing scenarios (m) based on trip conditions and commuters’ socioeconomic characteristics is demonstrated by Equationequation 1(1)
(1) (McFadden, Citation1974).
where:
Um = Utility function of accepting HOT lanes or cordon pricing
C = Constant
Ai = Coefficients (weight of each attribute based on survey’s data)
Xi = Explanatory variables correlated with dependent variable
A binary logistic regression model is used to investigate the influence of trip conditions and commuters’ socioeconomic characteristics on commuters’ acceptability of HOT lanes and cordon pricing, and this model is based on random utility theory (McFadden, Citation1974; Lerman, 1984; Ben Akiva and Lerman, 1985; Abulibdeh and Zaidan Citation2018). The logit regression model is a significant component of discrete choice models due to their ability to characterize complex features of commuting decisions by integrating imperative trip characteristics and socioeconomic characteristics of commuters’ explanatory variables. A set of independent factors is used in this model to envisage a categorical variable. This model speculates that a utility value influences the choice of a commuter to select an alternative that attains the maximum utility. Hence, the utility gained from a specific alternative determines the probability of choosing that alternative. In this study, as such, the probability of accepting HOT lanes and cordon pricing (i) is equal to the probability that the utility of this alternative (i) is greater than or equal to the utility associated with an alternative choice (j). Accordingly, commuters will choose to accept the scenario that yields the highest utility. Mathematically, the utility can be expressed as shown in Equationequation 2(2)
(2) :
where:
Uin is the utility attained by commuter n due to accepting congestion-pricing scenario (i). This formula shows that utility Uin is a function (f) of the attribute value of accepting congestion-pricing scenario (i) regarding commuter n, which is represented as Xin. Sin is the characteristic value of commuter n who has accepted congestion-pricing scenario (i). Since Uin cannot be measured with certainty and is considered to be random, it can be expressed as a sum of the observed (Vin) that relates to commuters’ acceptability of congestion-pricing scenarios and the unobserved or random (ɛin) components (Equationequation 3(3)
(3) ).
where:
βn is a vector of the estimated parameters in terms of variable Xin. Therefore, the binary logistic regression model is expressed by formulas 4 and 5:
Therefore, commuter (n) accepts congestion-pricing scenario (i) if the utility is greater than or equal to the not-accepting (j) utility, as shown in Equationequation 6(6)
(6) :
Therefore, the probability of HOT lanes or cordon pricing scenarios (i) is stated in Equationequation 7(7)
(7) :
To formulate a binary logistic regression model, the probability can be expressed as shown in Equationequation 8(8)
(8) :
where:
Pin: the probability that commuter n selects to accept congestion-pricing scenarios;
βXin: the utility function obtained when commuter n selects to accept congestion-pricing scenarios;
βXjn: the utility function obtained when commuter n selects not to accept congestion-pricing scenarios.
where:
Zi is the ith variable;
ai is the coefficient of the ith variable in βXn1;
bi is the coefficient of the ith variable in βXn2.
Spatial unit of analysis
The recent literature describes different ways of exploring and evaluating public acceptability of congestion-pricing scenarios. This study took a novel approach by focusing on drivers’ WTP as an indicator of their acceptance of suggested congestion-pricing policies (i.e., willingness to use HOT lanes or cordon pricing at any non-zero price). While different pricing systems can be used for HOT lanes and cordon pricing, the general system applied in this study was to charge all users of the proposed HOT lanes or all those (residents and nonresidents) crossing an imaginary charging zone boundary.
Variables studied
In investigating the acceptance of HOT lanes, the WTP based on trip conditions and travelers’ socioeconomic characteristics was considered the main variable. Trip conditions included urgency of the trip (urgent (U) vs not-urgent (NU)), travel speed (S) (high speed (70 km/h) vs low speed (30 km/h)) and travel distance (D) (long distance (30 km) vs short distance (15 km)). The explanatory variables used in this model to evaluate public acceptability were divided into trip conditions and drivers’ socioeconomic characteristics. For socioeconomic characteristics, age (A), income (I), employment status (ES), gender (G), and vehicle ownership (VO) were considered as main explanatory variables, as shown in . Eight trip scenarios (I–VIII) of examining HOT lanes were derived using these three trip characteristics. These eight scenarios were applied on each of the four major highways in the city. Respondents’ socioeconomic characteristics included household nationality, income, age group, gender, vehicle ownership, and employment status. In investigating the acceptance of cordon pricing, drivers’ WTP relative to their value of time was considered the main variable, suggesting that the analysis was based on the respondents’ WTP a fixed amount of money to save travel time.
Table 1. Attributes used in modeling acceptability of congestion-pricing scenarios along with their levels
Data collection
The data for the study were obtained through stated preference (SP) and revealed preference (RP) paper-based surveys in Abu Dhabi using a face-to-face interview method. The questionnaire focused on attitudes, perceptions, and reported travel behaviors of the respondents and comprised three sections: (1) questions about the respondents’ WTP to use HOT lanes, including various RP and SP questions; (2) questions related to travelers’ preferences concerning the distribution of the generated revenues from the implementation of these two scenarios; and (3) questions to gather information about respondents’ socioeconomic characteristics.
In RP questions, the respondents were asked about their current driving behaviors, such as trip frequency on main highways and bridges in Abu Dhabi and trip purpose. In SP questions, hypothetical choice scenarios were tested by asking the respondents about their willingness to accept either of the two congestion-pricing scenarios (HOT lanes and cordon pricing) if implemented in the city. Thus, SP survey questions dealt with what respondents say rather what they actually do. The advantage of SP is that it allowed implementation of the congestion-pricing scenarios to be assessed in a more comprehensive manner by collecting data on respondents’ reactions. The SP survey method has been used extensively in transportation planning research to forecast impacts on travel demand for transport policies based on respondents’ stated preferences in fictitious situations (e.g., Halse, Østli, and Killi Citation2020; Hasnine, Rashedi, and Habib Citation2020; Zaidan and Abulibdeh Citation2018; Tanriverdia, Shakibaeib, and Tezcan Citation2012; Patila et al. Citation2011; Hensher Citation1994). SP surveys are flexible and allow for the analysis of a range of various prospective indicators. Here, the SP data obtained from the survey were used to estimate a utility function, which was used in turn to forecast behavior change.
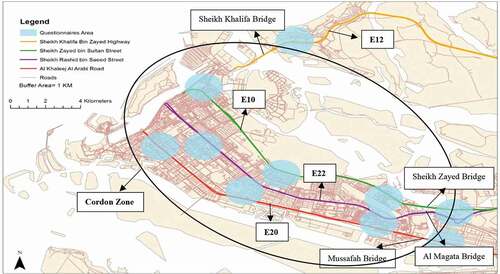
To assess commuter accessibility, the respondents were asked to define their WTP to escape congestion under different trip conditions, as shown in . The interviewers were trained to describe the meaning of the term ‘urgency’ to respondents as this term is subject to interpretation. Here, the term was defined as requiring fast action and having to be dealt with immediately before dealing with anything else. The sampling and distribution methods were chosen to reflect the purpose of the study and target population. The survey was conducted in different locations in the city, considering the proximity to main highways and four bridges that connect the city with its surroundings, as shown in . The locations where the survey was conducted are shown in . In all, 6,054 commuters were interviewed and the questionnaire was completed during September 2015 – January 2016.
Figure 2. An example of WTP question included in the survey.
Figure 3. Major highways, cordon zone covering the four main bridges and survey locations in Abu Dhabi city.
The design, sampling, and distribution method chosen for this study reflect the survey’s purpose and target population. The survey was designed to satisfy the requirements of assessing public acceptability of HOT lanes and cordon pricing if implemented in the city while considering different trip condition scenarios and the socioeconomic characteristics of the travelers. The survey consists of four parts. The first part was designed to gather information on the HOT lanes’ scenario. This part starts by asking respondents on their highway usage including their frequent trips and the purpose of these trips. This part includes a set of questions that hypothesize different trip conditions to determine travelers’ WTP. The second part of the survey asks questions related to the cordon pricing scenario such as how often travelers cross the main bridges and their purpose of trips in addition to question on travelers’ WTP to escape congestion. The third part consists of the questions addressing scenarios to distribute the generated revenues of both congestion-pricing schemes. Finally, the last part addresses the socioeconomic characteristics of the travelers.
To ensure the greater likelihood of a comprehensive response, the survey was randomly conducted at different locations in Abu Dhabi city. Furthermore, to ensure the population is well represented, different elements were considered when selecting the survey locations including proximity to four highways and bridges (where HOT lanes and the cordon zone are proposed) and in consideration of a range of distances from the central business district area. A sample of survey locations is shown in , where a buffer zone of 1 km around the highways and close to bridges was considered for conducting the survey.
Case study
Spatially, Abu Dhabi Island is attached to the mainland by four main bridges: Sheik Zayed Bridge, Sheikh Khalifa Bridge, Mussafah Bridge, and Al Maqta Bridge (). Therefore, the charging zone for the cordon pricing policy included those four bridges, and any driver crossing one of those bridges traveling toward or away from the island was assumed to be charged. The city also has a well-developed multilane highway network, with the most important roads being the E10 (Abu Dhabi–Al Shahama); E12 (Abu Dhabi – Al Falah); E22 (Abu Dhabi – Al Ain); and Al Khaleej Al Arabi Street (). The HOT lanes were assumed to be implemented on those four highways.
Acceptability analysis
Overall results
To ensure that respondents use the highways and bridges in the study area, they were asked ‘How often do you travel on Abu Dhabi highways?’ and ‘How often do you travel from/to Abu Dhabi Island crossing Mussafah Bridge, Maqta Bridge, Sheikh Zayed Bridge, or Sheikh Khalifa Bridge?’ Most respondents indicated that they used the highways or crossed the bridges on a daily basis (59% and 54%, respectively). The purpose of the travel varied among respondents. For about 50%, travelers, it was commuting to work from their homes, while 37% reported travel for leisure activities, such as shopping (11%), visiting friends/families (13%), or recreation purposes (13%). Only 8% of the respondents reported commuting to school and 5% for business purposes as shown in .
Table 2. Descriptive statistics on respondents’ commuting behavior and their socioeconomic characteristics
Prior to planning and implementation of any congestion-pricing policy, government agencies should consider public acceptance and support for their policy. Therefore, we asked respondents the following question: ‘Have you ever been frustrated by congestion or slow-moving traffic on Abu Dhabi highway network?’ Most of the respondents (77%) replied in the affirmative. This high rate of frustration illustrates the severity of road congestion in Abu Dhabi city. We also asked the respondents ‘Would you support HOT lanes if implemented on Abu Dhabi’s highways?’ and the same question was asked relating to cordon pricing. The responses revealed strong support (65% of respondents) for the HOT lanes’ scenario and weak support (28% of respondents) for cordon pricing. This continued to hold true when responses were broken down by nationality, age, gender, income, vehicle ownership, and employment status.
To assess more comprehensively the respondents’ willingness to support either policy, we cross-tabulated respondents’ willingness to support HOT lanes and cordon pricing with their socioeconomic characteristics. The results indicated that respondents were more willing to support HOT lanes than cordon pricing regardless of their socioeconomic characteristics. On the other hand, the results showed that low-income and unemployed respondents were not willing to support either scenario, HOT lanes were strongly supported by UAE nationals and Arab residents, and HOT lanes were also highly supported by other nationalities, including Asians. Cordon pricing was strongly supported by UAE nationals, but it received a weak support from other nationalities.
The results showed that respondents of different ages were willing to support HOT lanes over the cordon pricing scenario, and both males and females were willing to support HOT lanes more than cordon pricing. In terms of income, there was an inverse relationship between respondents’ income and their willingness to support HOT lanes and/or cordon pricing. The respondents with high average monthly income were more willing to support both scenarios compared with respondents from other income categories. Furthermore, the respondents with the lowest average monthly income were more willing to reject both scenarios. As the number of cars owned by an individual increased, their willingness to support HOT lanes and/or cordon pricing decreased (). Finally, the respondents with full-time employment were more willing to support both scenarios.
Acceptability of the HOT lane scenario
The first step in measuring public WTP for using HOT lanes was to determine the percentage of the respondents willing to pay in each trip scenario and then calculate the respondents’ mean WTP for each of these scenarios. The results showed that 91% of the respondents were willing to pay a mean value of AED 4.92 (USD 1.0 = 3.67 AED) to use HOT lanes under trip scenario V, where trip conditions were the worst (). There was an inverse relationship between WTP and trip conditions, with WTP starting to decrease when trip conditions started improving. In trip scenario I, for example, about 88% of the respondents were willing to pay AED 2.99 per km. and show the significance of trip conditions for WTP as four of the top five stated values of WTP were high-urgency trips.
Figure 4. Importance of trip conditions on respondents’ willingness to pay (WTP) to avoid road congestion.
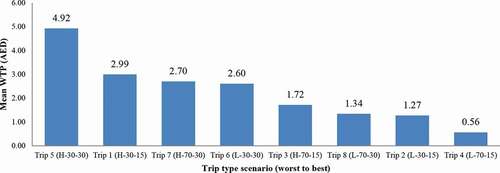
Table 3. Respondents’ mean willingness to pay (WTP) for different trip scenarios (I–VIII) differing in urgency, speed, and distance
The use of HOT lanes reduced the travel time. This travel time saving was derived from survey responses and not directly using travel time saving to measure the respondents’ WTP. shows respondents’ WTP as a function of time saving based on different trip scenarios. It is clear that trip conditions significantly influenced respondents’ WTP to save travel time.
Table 4. Respondents’ willingness to pay (WTP) for travel time saving based on trip conditions
Effect of socioeconomic characteristics on WTP for HOT lanes
The correlation between WTP and respondents’ socioeconomic characteristics, including respondents’ age, gender, average monthly income, vehicle ownership, nationality, and employment status, was determined. Based on their average monthly income, respondents were divided into three main groups: (i) low income when the average monthly income was less than AED 14,999; (ii) middle income when the average monthly income was in the range of AED 15,000–24,999; and (iii) high income when the average monthly income was equal to or higher than AED 25,000. Respondents’ WTP varied depending on their monthly income and trip conditions. The percentage of respondents who were not willing to pay for any of the scenarios in to escape congestion varied based on their income. Most respondents reported an average monthly income of less than AED 14,999. The results showed that WTP increased with the increasing income, which was expected. A one-way ANOVA test revealed that mean WTP differed significantly among the income groups at the 95% confidence interval (CI) for all trip designations ().
Table 5. Effect of household income on willingness to pay (WTP) to reduce travel time using HOT lanes
One-way ANOVA model was used to search for any statistically significant differences between respondents’ mean WTP based on gender, nationality, employment status, age, and vehicle for scenarios III and IV. It was found that mean WTP was lower for males than for females except for scenarios III and IV, for which the mean WTP for females was slightly lower. One-way ANOVA tests demonstrated that mean WTP differed among nationality groups (95% CI) for all trip designations. Mean WTP was the highest for American/Europeans and Arabs, followed by UAE nationals, regardless of trip conditions, while it was the lowest for Asians/Africans. The employment status was another indicator of respondents’ WTP. One-way ANOVA tests revealed significant differences (95% CI) in mean WTP among different employment groups for all trip designations, with higher values for full-time employees compared to part-time employees or the unemployed. The age was another socioeconomic factor influencing the respondents’ WTP. One-way ANOVA tests demonstrated that mean WTP differed significantly (95% CI) among different age groups for all trip designations. The respondents in the age group 25–35 years were more willing to pay than respondents of other age groups for most trip designations, followed by respondents aged 45 and older. The vehicle ownership was found to be a significant factor influencing WTP to use HOT lanes and escape road congestion. One-way ANOVA tests demonstrated that mean WTP differed significantly (95% CI) among vehicle ownership groups for all trip designations, with mean WTP being higher for respondents who owned three or more vehicles compared to other groups.
Effect of driving route on WTP for HOT lanes
Next, we examined whether the highways most used by respondents (frequency of travel and trip purpose) influenced their mean WTP. We found no significant differences in respondents’ WTP, which implies that they encountered road congestion at similar rates on all four major highways in the city. Furthermore, the respondents who commuted daily on these highways were willing to pay more to escape congestion than those who did not commute on a daily basis, with the highest WTP reported for trip scenario V. The results also indicated that respondents who traveled on highways less often were more willing to pay. Finally, the results showed that those commuting to/from work and traveling to visit friends/families had higher WTP to escape congestion, particularly in the worst trip scenarios.
The application of a linear regression model with repeated measures showed that trip urgency was a significant factor influencing the respondents’ WTP, increasing WTP by 1.62 to 1.67 points more than in non-urgent conditions (). The travel speed was another factor that significantly influenced respondents’ WTP, with higher travel speed having a positive effect on WTP and lower travel speed a negative effect (). Trip distance was the third significant factor influencing respondents’ WTP as commuting long distances increased WTP.
Table 6. WTP based on different trip scenarios (I–VIII) as a function of trip conditions and respondents’ socioeconomic characteristics (R2 = 0.296)
The model results also revealed the impact of different socioeconomic characteristics on respondents’ WTP. In terms of age, the respondents in age groups 25–34 years and 35–44 years were less willing to pay (by 1.07 and 1.6 points, respectively) than respondents aged 45 years or older. Another significant factor was the average household income, with WTP increasing with the increasing household income. The respondents with higher household income had higher WTP than middle and lower-income groups (by 0.35 and 0.59 points, respectively). This reflected the effect of the employment status, where full-time and part-time employees had higher WTP (by 0.55 and 0.19 points, respectively) than unemployed respondents. Surprisingly, the model results showed that males had a lower WTP than females (by 0.011 points). Regarding vehicle ownership, the model results showed an inverse relationship between the number of cars owned and WTP, indicating that respondents who owned one car had a higher WTP than those who owned two or more cars. From this correlation, we can conclude that respondents were willing to pay the amount of toll if the trip was urgent and included the features like low-speed and long-distance journey or the driver possessed the features such as increasing age, income, vehicle ownership, employment (either full-time or part-time). This indicates the factors that increase WTP also increase public acceptability of the HOT lanes’ scenario. Therefore, the calibrated model for the sample data was as follows:
WTP = 3.09–1.65NU – 0.016S + 0.0077D – 0.108A2 – 0.16A3 – 0.59LI – 0.354MI + 0.197PES + 0.55FES + 0.12 VO1 + 0.11VO2
bThis parameter is set to zero because it is redundant.
Model analysis of the HOT lane scheme
A generalized linear-mixed model (binary logistic regression model) was created and calibrated to examine the impact of trip conditions and respondents’ socioeconomic characteristics on their acceptance of HOT lanes. In this model, a set of predictor variables was utilized to predict a categorical variable. In addition, the probability of selecting to accept HOT lanes/cordon pricing was set to equal the probability that the utility of this choice is equal to or greater than the utility associated with an alternative choice. Therefore, the driver will choose the acceptability choice that yields the maximum utility.
This model was used to determine the extent to which price was a factor in the choice to use HOT lanes and consequently in the acceptability of this system, so that all other factors could be monetized (e.g., the value of time could be inferred from a choice model that included price as an input variable). The model was based on the assumptions of rational choice behavior. Under this model, it was assumed that respondents would accept any price up to their threshold price and reject any price above that. By applying the latter assumption, it was easy to restructure the data in a format that could be used to produce a choice model with price as a variable. This was done by splitting each response into a set of derivative responses crafted around different hypothetical price points (e.g., AED 0.50, AED 1.00, AED 1.50, and AED 2.00), inheriting all other variable values from the original response (e.g., trip urgency, age, income, and gender), and deriving the proper choice for each price point (i.e., all price points below the respondents’ stated limit result in a choice to use the HOT lane and all price points above the limit result in a decision not to use the HOT lane). There is much greater value for practitioners in being able to predict the proportion of drivers who will use HOT lanes at a given price and how sensitive that proportion is to price and other factors. In this case, the model was valuable as a tool for estimating HOT lane acceptance, with those who refused to use the lanes at any non-zero price representing those opposing the underlying principle of HOT lanes.
The binary logistics regression model was designed for two options, which included accepting the HOT lanes scenario and not accepting it, to determine the drivers who would accept HOT lanes. To compare the choices and determine factors that might affect the acceptability choice, the dependent variable in the model was set to ‘0’ for accepting HOT lanes and to ‘1’ for not accepting this scenario. All trip conditions and socioeconomic characteristics included in the model were found to be statistically significant at P < 0.05 except for owning two cars, which was significant at P < 0.10. In general, the calibrated model for the sample data was:
Acceptability of HOT lanes = 4.656–0.065D – 0.023S + 1.339 U – −5.531NWTP – 5.069WTP1 – 4.173 WTP2 – 3.747 WTP3 – 2.650 WTP4 – 1.289 WTP5 + 0.165FES – 0.301A1 – 0.339A2 + 0.003A3 – 0.016LI + 0.763MI + 0.180VO2.
Regarding trip conditions, the trip distance was found to be significant (P < 0.05) and had a negative value (). This implies that as trip distance decreased, along ith low travel speed, the probability of accepting HOT lanes decreased as the value of time decreased in this case. Urgency was more critical with regard to acceptability; trip urgency was observed to be significant (P < 0.05), and it had a positive value, with an odds ratio of 3.816. This implies that high trip urgency associated with low travel speed increased the acceptability of HOT lanes. An increase in trip urgency of 1.339 units could be expected to increase the preference for accepting using HOT lanes by 3.816 units. In terms of WTP to use HOT lanes, its association with low speed was significant (P < 0.05) and had a negative value (). The amount of toll fees that respondents’ willing to pay increased as trip conditions worsened. For example, a decrease in trip conditions by 1.289 units could be expected to increase the preference to pay AED 5 (USD 1.36) or more by 0.227 units. The model results also showed an estimate of 0.015 and an odds ratio of 1.015 for men, meaning that male drivers are more likely to accept HOT lanes than female drivers; although the difference was not significant. Personal average monthly income was found to be a significant factor in public acceptability, which decreased with decreasing income. Low-income drivers are thus less likely to use HOT lanes and pay toll fees. This is logical as drivers with high income have higher WTP to escape congestion and consequently are more willing to accept a congestion-pricing scenario. The age coefficient was positive for 35–44 years’ age group, which had the highest odds ratio (1.003), meaning the drivers in this group are more willing to accept HOT lanes than younger drivers. Similar findings were made for employment status, with drivers in full-time and part-time employment (odds ratio 1.179) being more willing to accept HOT lanes than unemployed drivers. Finally, the model results indicated that drivers who own three cars or more (odds ratio 1.197) are more willing to accept HOT lanes than drivers who own one or two cars ().
Table 7. Parameter estimates of the logistics regression model on willingness to pay (WTP) for HOT lanes
Acceptability of the cordon pricing scenario
The acceptability of cordon pricing was examined separately as a function of respondents’ WTP to cross the cordon zone as a function of travel time reduction and respondents’ socioeconomic characteristics. The range of value that respondents set on travel time saving enables cordon pricing to function, indicating that if all drivers set the same value on time-saving then cordon pricing would not be an effective policy, as drivers would either pay fees and drive as usual or nobody would pay fees. In general, the respondents’ WTP was found to be influenced by the degree of travel time saved and their socioeconomic characteristics. A generalized linear-mixed model was used to assess cordon pricing acceptability, and one-way ANOVA was used to assess the significance of these trip characteristics and the driver income factor.
As in HOT lanes’ analysis, the assumptions were based on rational choice behavior. Thus, it was assumed that drivers would accept any price up to their threshold price and reject any price above that. The data produced a choice model with price as a variable. Each response was split into a set of derivative responses crafted around different hypothetical price points, based on respondents’ WTP, inheriting all other variable values from original responses, and indicating the proper choice for each price point (i.e., all price points below the respondents’ stated limit resulted in a choice to use the cordon pricing scenario, and all price points above the limit resulted in a decision not to use the cordon pricing).
The generalized linear-mixed model was estimated and calibrated to examine the impact of travel time saving and drivers’ socioeconomic characteristics on their acceptance of this policy based on gender. The explanatory variables used in the model were travel time saved, household income, age, trip purpose, vehicle ownership, and employment status. The dependent variable in the model was set to ‘0’ for accepting the cordon pricing scenario and to ‘1’ for not accepting it. The reference category in the model was gender (male). All drivers’ socioeconomic characteristics included in the model were found to be statistically significant at P < 0.05 except for visiting families/friends/recreation trips, which was not significant (P > 0.05). The general calibrated model for the sample data was:
Acceptability of cordon pricing = 2.816–1.915S5 – 1.461S10 – 0.709S15 + 0.703LI + 0.885MI + 0.513A1 + 1.674A2 + 0.863A3 – 2.036FES – 2.258PES + 1.078VO1 + 1.175VO2 + 0.500TPW + 0.593 TPB + 0.437TPF + 1.802 NWTP +0.794WTP1 – 1.465WTP2 – 0.476WTP4
The results showed that females are less willing to accept cordon pricing scenario to save time compared with males (). The explanatory variable ‘save 5, 10, and 15 minutes of travel time,’ was observed to be significant (P < 0.05) and had a negative value. This indicates that female drivers have lower WTP to save time benefiting from the cordon pricing system, and hence they are less willing to accept this congestion-pricing scenario than male drivers. This also implies that males rate their time more highly than females. However, the results also showed that as travel time saved increases, females are more willing to accept the cordon pricing scenario ().
Table 8. Parameter estimates of the logistics regression model on willingness to pay (WTP) for cordon pricing; Reference (Males) (R2 = 0.265)
Personal monthly income was found to be a significant factor for acceptability and had a positive impact on public acceptability of cordon pricing. The model results revealed that low- and middle-income females are more willing to accept this scenario (odds ratio 2.020 and 2.423, respectively) than the corresponding groups of males. The age coefficient was negative for 8–24 years age group and positive for other age groups. Females in the 18–24 age group were found to be less likely to accept cordon pricing (odds ratio 0.599) than males in the same age group. On the other hand, females in other age groups are more likely to accept cordon pricing than males. The generic variable, employment status, was observed to be significant (P < 0.05) and had a negative sign. This implies that full-time (odds ratio 0.131) and part-time (odds ratio of 0.105) employed female drivers are less likely to accept cordon pricing than full-time and part-time employed males. In terms of car ownership, the results show that regardless of the number of cars owned, females are more willing to accept cordon pricing than males. Similar results apply for trip purpose, as regardless of the trip purpose, females are still more willing to accept cordon pricing than males (e.g., odds ratio of 1.649 for female drivers traveling to/from work).
Finally, the explanatory variable, WTP, was observed to be significant (P < 0.05) for not paying the toll fees, or paying 1, 2, and 4 AED as toll fees to escape congestion. However, WTP AED 1 had a positive sign for female drivers, indicating that they are more willing to accept cordon pricing at the threshold. The odds ratio of not paying the toll fees for female drivers was 6.061, which implies that female drivers are more in favor of not paying toll fees than male drivers (). On the other hand, the odd ratio of paying 1 AED tool fee was 2.211 for female drivers compared with male drivers. In addition, the model results indicated that female drivers are less willing to pay 2 AED and 4 AED as toll fees for cordon pricing than male drivers. In conclusion, the model results indicated how much (i.e., AED amount) people would pay to avoid various levels of congestion for different trip types or, alternatively, how cost enters into the decision to cross the cordon zone or not, given various other trip/driver characteristics). This model is valuable as a tool for estimating cordon pricing acceptance, as those who refused to cross the cordon zone at any non-zero price represent who oppose the underlying principle of cordon pricing.
Impact of household income on public acceptability of cordon pricing
In examining public acceptability of cordon pricing, a one-way ANOVA test was conducted to determine whether household income influenced drivers in their WTP to reduce their travel time by 5, 10, 15, and 20 minutes. The results indicated significant differences (P < 0.05) between different income groups (). Household income had a significant influence on mean WTP to reduce travel time by the indicated amount. High-income drivers appear to be more willing to pay to reduce their travel time by 15 and 20 minutes than low- and middle-income groups (). In terms of saving 5 minutes, the multinomial logit model outcomes revealed significant differences (P < 0.05) between the high- and middle-income groups in paying AED 2–3 to save 5 minutes of total travel time. The model results also revealed significant differences between the willingness of different income groups to pay to save 10, 15, and 20 minutes of their travel time. High-income drivers are more willing to pay than other income groups to save travel time. Low-income drivers are willing to pay some amount to save travel time but less than other income groups for every travel time reduction tested. This is an interesting observation that reflects the value of time for each income group. Income and amount of toll that drivers are willing to pay to avoid congestion was separated into discrete categories and each represented by a zero or one indicator variable.
Table 9. Effect of household income on drivers’ willingness to pay (WTP) to reduce travel time
Table 10. Multinomial logit analysis of drivers’ willingness to pay (WTP) to save 5, 10, 15, and 20 minutes of travel time (Reference high income (AED ≥24,999) (R2 = 0.409))
Revenue distribution
The survey investigated five different scenarios for the distribution of the revenue generated by the proposed cordon pricing scheme in Abu Dhabi. These included (1) improvement in road infrastructure; (2) improvement in public transport; (3) reduction in public transport fare; (4) support to the municipal budget in general; and (5) improvement in cycling and walking conditions. Respondents’ preferences for these revenue distribution scenarios are shown in . The revenue scenarios can be divided into three groups in terms of respondents’ perception of the benefits to them: First, the revenue can be used for direct traffic-related purposes (scenarios 1, 2, and 3). This distribution of revenue was accepted by the vast majority of respondents. Scenarios 4 and 5, where the revenue generated would be used to support the municipal budget or improve cycling and walking conditions, were supported by a majority of the respondents.
Table 11. Multinomial logit analysis of respondents’ perceptions of different ways of spending the revenue generated by congestion-charging schemes (R2 = 0.374)
Distribution of the revenue based as suggested would affect different income groups in different ways. Thus, there would be significant differences between different income groups in their preferences for using the revenue to improve road infrastructure. Drivers from higher-income neighborhoods could be expected to support this scenario most as they need better road infrastructure, would pay charges, and continue to drive as before. However, the majority of individuals in all income groups supported scenario 1 and, surprisingly, respondents from low-income neighborhoods supported it the most (94%, compared with 70% and 92% of respondents from middle- and high-income neighborhoods, respectively). The results also showed that drivers from low-income neighborhoods supported investing revenue to improve cycling and walking (scenario 5) more than other income groups.
Respondents’ expectations about how the local authorities might use the revenue also varied, but majority of the respondents wanted the revenue to be distributed in a conventional manner. About 85% of the respondents wanted the revenue to go to improving road infrastructure, and about 61% believed that the authorities would do so. Around 88% of the respondents supported using the revenue to improve public transport, but only 55% believed that the authorities would do so. Interestingly, around 58% of the respondents opposed using the money to support the municipal budget (scenario 4), but more than 50% believed that the authorities would use the money for that purpose. This belief may be attributed to the lack of trust by respondents in the authorities and/or to a belief that the authorities lack other resources to support their budget. The data revealed that respondents from middle-income neighborhoods opposed scenario 4 the most. The most positive expectations expressed were concerning the improvement in public transportation and road infrastructure. On the other hand, there were negative expectations regarding support to the municipal budget and improvement in cycling and walking conditions. The respondents wanted to see a reduction in public transport fares; however, they believed that authorities would not use the revenue generated for that purpose. There was some evidence that respondents supported the objectives of the revenue distribution and also believed that revenue would be used by the relevant authorities for those objectives. In addition, there was an association between the income group and the perception of how local authorities would distribute the revenue – with drivers from low-income neighborhoods being most likely to believe that local authorities would use the revenue to improve road infrastructure, public transport, and cycling and walking conditions.
In terms of using the revenue to reduce public transport fares, no empirical study found in the literature has suggested or examined this scenario. We found no significant differences between any of the different income groups in their response to this scenario; although respondents from low-income neighborhoods tended to favor it the most.
The multinomial logit model revealed significant differences between income groups (low, middle, and high) in terms of the revenue distribution methods. The scenario ranking for the low-income group was: reduce public transport fares, support the municipal budget in general, improve cycling and walking conditions, improve road infrastructure, reduce public transport fees, and improve public transport (i.e., 3, 4, 5, 1, 2). For the middle-income group, the ranking was improve cycling and walking conditions, reduce public transport fares, improve road infrastructure, support the municipal budget in general, and improve public transport (i.e., 5, 3, 1, 4, 2).
Findings of this study compared to studies on other regions in the world
This study used a generalized linear-mixed model (binary logistic regression model) to investigate the effect of socio-demographic characteristics and trip conditions on acceptability of an assumed congestion-pricing scenarios in Abu Dhabi, UAE. We found some differences and similarities in comparison with previous research conducted in different cities around the world depending on the variables used in these studies. This study showed that trip conditions (travel speed, travel distance, and trip urgency); respondents’ age, income, employment status, and car ownership; and toll fees are significant factors in public acceptability of HOT lanes, while respondents’ average monthly income, age, employment status, car ownership, and saving in travel time are significant indicators of public acceptability of cordon pricing. The findings in this research support the findings of other studies. The studies conducted in other regions in the world (see ) found that the socioeconomic characteristics are significant determinants of the acceptability of congestion-pricing scenarios. Furthermore, the toll fees, adequate public transportation system, and the expected benefits of congestion-pricing system are also significant in increasing public acceptability of congestion pricing.
Table 12. Acceptability studies across different regions in the world
Limitations of the current research
This study analyzed the public acceptability based on respondents’ WTP a toll or cordon fee to circumvent congestion. However, we are aware that there may be some who are willing to accept these policies but are not willing to pay fees. For example, if the revenue obtained is used for public transport improvement or for general environmental concerns, an individual might accept it in principle (but not pay). Nevertheless, the aim of this study was to measure public acceptability based on WTP and the distribution of the generated revenues, which is a novel approach in this regard. The future research may consider other factors or use other measurement approaches. Another limitation of the study is that the relationship between variables is moderate for cordon pricing (R2 = 0.265) and hence additional investigations are required.
Conclusions and recommendations
This study investigated public acceptability of two forms of congestion pricings HOT lanes and cordon pricing, if implemented in Abu Dhabi city. First, we examined public acceptability of these two scenarios as a WTP function to escape congestion. The model developed in this study proved valuable as a tool for estimating HOT lanes and cordon pricing acceptability, as respondents who stated that they would refuse to use their vehicles in HOT lanes or cross the cordon pricing zone at any non-zero price were believed to represent those who disapprove of the underlying principle of HOT lanes and cordon pricing. The model assumed rational choice behavior and that the respondents would accept any price up to their threshold price and reject any price above that. Different factors were found to affect public acceptability of the two congestion-pricing scenarios. For HOT lanes, trip conditions were found to be significant in increasing or decreasing public acceptability. Low-travel speed, long travel distance, and urgent trips were factors that increased the public acceptability of implementing HOT lanes on Abu Dhabi roads, while only travel time saved increased the public acceptability of cordon pricing. Overall, these results reveal higher WTP for time savings enabled by congestion-pricing schemes.
Revenue redistribution is significant to assess the acceptability of HOT lanes and cordon pricing. The distribution of the generated revenue among individuals in different groups, who are unequal in other aspects, is one of the pillars of accepting these congestion-pricing scenarios. HOT lanes and cordon pricing, in general, can achieve more desirable distributional outcomes when the generated revenues are distributed to those who pay the charges. The use of the revenue plays an important role in considering the fairness among drivers who pay the toll and make them feel that they are treated fairly among themselves. Accordingly, utilizing the generated revenue effectively is a significant step toward achieving equity among different socioeconomic travelers. Revenue allocation among travelers in equal or unequal shares could play an important role in solving the above-mentioned inequity issues. It can help diminish the negative impacts on different socioeconomic groups. In addition, people must see benefits for themselves corresponding to the additional cost of trip because of the charges. Therefore, it is vital to examine revenue redistribution among travelers and how equitable that distribution is.
Knowing the conditions that encourage or discourage public acceptability may aid in designing and implementing more effective congestion-pricing scenarios. HOT lanes and cordon pricing consist not only of WTP and pricing components but investing the generated revenues in a variety of alternatives that achieve fairness between commuters and encourage them to use alternative travel modes of transportation.
In the future research, the studies should focus on three main things. First, other congestion-pricing policies should be explored (such as city center toll ring, variable toll systems, time-, distance-, and/or place-based pricing). The aim is to determine which congestion pricing is more suitable for this city. Second, studies should take different explanatory variables (attitudes about environment, equity, and taxes) to understand acceptability in a more comprehensive form. Finally, the future studies could model the effect of introducing a metro in the study on the acceptability of congestion pricing. Increasing public transport mode choice may encourage more car drivers to use the public transportation system.
Acknowledgments
Open Access funding provided by the Qatar National Library.
Disclosure statement
No potential conflict of interest was reported by the author.
References
- Abulibdeh, A. (2013). “Equity Implications of Cordon Pricing in Downtown Toronto.” A thesis presented to the University of Waterloo in fulfillment of the thesis requirement for the degree of Doctor of Philosophy in Geography Waterloo, Ontario, Canada, 2013.
- Abulibdeh, A. 2017. “Chapter 11: Congestion Pricing: Methodologies and Equity Implications.” In Urban Transport Systems, InTech, 2017.
- Abulibdeh, A. 2018. “Implementing Congestion Pricing Policies in a MENA Region City: Analysis of the Impact on Travel Behaviour and Equity.” Cities 74 (3): 196–207. doi:https://doi.org/10.1016/j.cities.2017.12.003.
- Abulibdeh, A., and E. Zaidan. 2018. “High-occupancy Toll (HOT) Lanes on the Main Highways of the City of Abu Dhabi: The Public’s Willingness to Pay.” Journal of Transport Geography 66: 91–105. doi:https://doi.org/10.1016/j.jtrangeo.2017.11.015.
- Abulibdeh, A., E. Zaidan, and K. Alkaabi. 2018. “Empirical Analysis of the Implementation of Cordon Pricing: Potential Impacts on Travel Behaviour and Policy Implications.” Transportation Research Part F. Psychology and Behaviour 53 (3): 130–142. doi:https://doi.org/10.1016/j.trf.2018.01.006.
- Abulibdeh, A., J. Andrey, and M. Melnik. 2015. “Insights into the Fairness of Cordon Pricing Based on Origin-Destination Data.” Journal of Transport Geography 49: 61–67. doi:https://doi.org/10.1016/j.jtrangeo.2015.10.014.
- Albalate, D., and G. Bel. 2009. “What Local Policy Makers Should Know about Urban Road Charging: Lessons from World Wide Experience.” Public Administration Review 69: 962–975. doi:https://doi.org/10.1111/j.1540-6210.2009.02045.x.
- Anas, A., and R. Lindsey. 2011. “Reducing Urban Road Transportation Externalities: Road Pricing in Theory and in Practice.” The Review of Environmental Economics and Policy 5: 66–88. doi:https://doi.org/10.1093/reep/req019.
- Ardic, O., J. A. Annema, and B. Van Wee. 2013. “Has the Dutch News Media Acted as a Policy Actor in the Road Pricing Policy Debate?” Transport Research Part A 57: 47–63.
- Borjesson, M., and I. Kristoffersson (2012). “Estimating Welfare Effects of Congestion Charges in Real World Settings.” CTS Working paper 2012: 13. Available at: http://swopec.hhs.se/ctswps/abs/ctswps2012_013.htm
- Burris, M., and W. Stockton. 2004. “HOT Lanes in Houston—Six Years of Experience.” Journal of Public Transportation 7 (3): 1–21. doi:https://doi.org/10.5038/2375-0901.7.3.1.
- Cain, A. 2005. “Achieving Majority Public Support to Urban Road Pricing: Preserving the Driver’s Right to Choose.” Transportation Research Record: Journal of the Transportation Research Board 1932: 119–128. doi:https://doi.org/10.1177/0361198105193200114.
- Chorus, G. G., J. A. Annema, N. Mouter, and B. Van Wee. 2011. “Modelling Politicians’ Preferences for Road Pricing Policies: A Regret-based and Utilitarian Perspective.” Transport Policy 18: 856–861. doi:https://doi.org/10.1016/j.tranpol.2011.05.006.
- Cools, M., K. Brijs, H. Tormans, E. Moons, D. Janssens, and G. Wets. 2011. “The Socio- Cognitive Links between Road Pricing Acceptability and Changes in Travel Behaviour.” Transport Research Part A 45: 779–788.
- Davis III, R. W., K. Sinha, and F. Mannering (2009). “Factors Affecting Willingness to Pay for High-occupancy-toll Lanes.” DVD: Transportation Research Board 88th Annual Meeting, 22.
- De Palma, A., R. Lindsey, and S. Proost. 2007. “Synthesis of Case Study Results and Future Prospects in Investment and the Use of Tax and Toll Revenues in the Transport Sector.” Research in Transportation Economics 19: 269–297. doi:https://doi.org/10.1016/S0739-8859(07)19012-0.
- Eliasson, J., and L. Jonsson. 2011. “The Unexpected “Yes”: Explanatory Factors behind the Positive Attitudes to Congestion Charges in Stockholm.” Transport Policy 18: 636–647. doi:https://doi.org/10.1016/j.tranpol.2011.03.006.
- Fan, D. W. 2017. “Social Welfare Maximization by Optimal Toll Design for Congestion Management: Models and Comprehensive Numerical Results.” Transportation Letters 9: 2,81–89. doi:https://doi.org/10.1080/19427867.2016.1175165.
- Finkleman, J., J. Casello, and L. Fu. 2011. “Empirical Evidence from the Greater Toronto Area on the Acceptability and Impacts of HOT Lanes.” Transport Policy 18 (6): 814–824. doi:https://doi.org/10.1016/j.tranpol.2011.05.002.
- Franz, L. M. 2020. “Decision Support Model for Variable Speed Limit Control in Recurrent Congestion.” Transportation Letters 12 (1): 37–44. doi:https://doi.org/10.1080/19427867.2018.1502915.
- Gaunt, M., T. Rye, and S. Allen. 2007. “Public Acceptability of Road User Charging: The Case of Edinburgh and the 2005 Referendum.” Transport Reviews 27 (1): 85–102. doi:https://doi.org/10.1080/01441640600831299.
- Gehlert, T., C. Kramer, O. A. Nielsen, and B. Schlag. 2011. “Socioeconomic Differences in Public Acceptability and Car Use Adaptation Towards Urban Road Pricing.” Transport Policy 18: 685–694. doi:https://doi.org/10.1016/j.tranpol.2011.01.003.
- Grisolía, M. J., F. López, and J. D. Ortúzar. 2015. “Increasing the Acceptability of a Congestion Charging Scheme.” Transport Policy 39: 37–47. doi:https://doi.org/10.1016/j.tranpol.2015.01.003.
- Halse, H. A., V. Østli, and M. Killi. 2020. “Revealed and Stated Preferences for Reliable Commuter Rail in Norway.” Transportation Letters 12 (4): 288–292. doi:https://doi.org/10.1080/19427867.2019.1586088.
- Hasnine, S. M. D., Z. Rashedi, and N. K. Habib. 2020. “Making Use of Elicited Confidence Ratings of the SP Survey in A Joint RP-SP Model: A Case Study of Commuting Mode Choices for TDM Evaluations.” Transportation Letters 12: 4,274–287. doi:https://doi.org/10.1080/19427867.2019.1585687.
- Hawas, E. Y., N. M. Hassan, and O., . A. Abulibdeh. 2016. “A Multi-criteria Approach of Assessing Public Transport Accessibility.” Journal of Transport Geography 57: 19–34. doi:https://doi.org/10.1016/j.jtrangeo.2016.09.011.
- Hensher, D. A. 1994. “State Preference Analysis of Travel Choices: The State of Practice.” Transportation 21: 107–133. doi:https://doi.org/10.1007/BF01098788.
- Hensher, D. A. 2013. “Exploring the Relationship between Perceived Acceptability and Referendum Voting Support for Alternative Road Pricing Schemes.” Transportation 40: 935–959. doi:https://doi.org/10.1007/s11116-013-9459-4.
- Hensher, D. A., and M. C. J. Bliemer. 2014. “What Type of Road Pricing Scheme Might Appeal to Politicians? View Points on the Challenge in Gaining the Citizen and Public Servant Vote by Staging Reform.” Transportation Research A 61: 227–237.
- Hensher, D. A., and Z. Li. 2013. “Referendum Voting in Road Pricing Reform: A Review of the Evidence.” Transport Policy 25: 186–197. doi:https://doi.org/10.1016/j.tranpol.2012.11.012.
- Hess, S., and M. Börjesson. 2019. “Understanding Attitudes Towards Congestion Pricing: A Latent Variable Investigation with Data from Four Cities.” Transportation Letters 11 (2): 63–77. doi:https://doi.org/10.1080/19427867.2016.1271762.
- Kim, J., J. D. Schmöcker, S. Fuji, and R. B. Noland. 2013. “Attitudes Towards Road Pricing and Environmental Taxation among US and UK Students.” Transportation Research A 48: 50–62.
- King, D., M. Manville, and D. Shoup. 2007. “The Political Calculus of Congestion Pricing.” Transport Policy 14: 111–123. doi:https://doi.org/10.1016/j.tranpol.2006.11.002.
- Kockelman, K. M., and S. Kalmanje. 2005. “Credit-based Congestion Pricing: A Policy Proposal and the Public’s Response.” Transportation Research A 39: 671–690.
- Kottenhoff, K., and K. B. Brundell-Freig. 2009. “The Role of Public Transport for Feasibility and Acceptability of Congestion Charging- the Case of Stockholm.” Transportation Research A 43: 297–305.
- Levinson, D. 2010. “Equity Effects of Road Pricing: A Review.” Transport Reviews 30: 33–57. doi:https://doi.org/10.1080/01441640903189304.
- Li, X., Yuan, Y., Wang, H., and Hu, J. (2020). “Understanding Public Acceptability of Congestion Charging in Beijing”. Journal of Transportation Engineering, Part A: Systems 146 (8): 04020080 doi:https://doi.org/10.1061/JTEPBS.0000394
- Li, Z., A. D. Hensher, and C. Ho. 2020. “An Empirical Investigation of Values of Travel Time Savings from Stated Preference Data and Revealed Preference Data.” Transportation Letters 12 (3): 166–171. doi:https://doi.org/10.1080/19427867.2018.1546806.
- Li, Z., and D. A. Hensher. 2012. “Congestion Charging and Car Use: A Review of Stated Preference and Opinion Studies and Market Monitoring Evidence.” Transport Policy 20: 47–61. doi:https://doi.org/10.1016/j.tranpol.2011.12.004.
- McFadden, D. (1974). “The measurement of urban travel demand”. Journal of Public Economics 3(4), November 1974, Pages 303–328 doi:https://doi.org/10.1016/0047-2727(74)90003-6
- Milenković, M., Glavić, D., and Maričić, M. (2019). Determining factors affecting congestion pricing acceptability. Transport Policy 82, pp 58 – 74 doi:https://doi.org/10.1016/j.tranpol.2019.08.004
- Noordegraaf, D. V., J. A. Annema, and B. van Wee. 2014. “Policy Implementation Lessons from Six Road Pricing Cases.” Transportation Research A 59: 172–191.
- Odeck, J., and A. Kjerkreit. 2010. “Evidence on Users’ Attitudes Towards Road User Charges-across-sectional Survey of Six Norwegian Toll Schemes.” Transport Policy 17: 349–358. doi:https://doi.org/10.1016/j.tranpol.2010.04.001.
- Ozbay, K., O. Yanmaz-Tuzel, and J. Holguin-Veras. 2006. “Theoretical Derivation of Value of Travel Time and Demand Elasticity: Evidence from New Jersey Turn- Pike Toll Road.” In Transportation Research Record, 248–256.
- Patila, S., M. Burrisb, W. D. Shawc, and S. Concas. 2011. “Variation in the Value of Travel Time Savings and Its Impact on the Benefits of Managed Lanes.” Transportation Planning and Technology 34: 6.
- Petrik, O., J. de Abreu E Silva, and F. Moura. 2016. “Stated Preference Surveys in Transport Demand Modeling: Disengagement of Respondents.” Transportation Letters 8: 1, 13–25. doi:https://doi.org/10.1179/1942787515Y.0000000003.
- Rentziou, A., C. Milioti, K. Gkritza, and M. Karlaftis. 2011. “Urban Road Pricing: Modelling Public Acceptance.” Journal of Urban Planning and Development 137: 56–64. doi:https://doi.org/10.1061/(ASCE)UP.1943-5444.0000041.
- Ryley, T., and N. Gjersoe. 2006. “News Paper Response to the Edinburgh Congestion Charging Proposals.” Transport Policy 13: 66–73. doi:https://doi.org/10.1016/j.tranpol.2005.08.004.
- Schade, J., and B. Schlag. 2003. “Acceptability of Urban Transport Pricing Strategies.” Transportation Research. Part F, Traffic Psychology and Behaviour 6 (1): 45–61. doi:https://doi.org/10.1016/S1369-8478(02)00046-3.
- Schaller, B. 2010. “New York City’s Congestion Pricing Experience and Mplications for Road Pricing Acceptance in the United States.” Transport Policy 17: 266–273. doi:https://doi.org/10.1016/j.tranpol.2010.01.013.
- Schuitema, G., L. Steg, and J., . A. Rothengatter. 2010. “The Acceptability, Personal Outcome Expectations, and Expected Effects of Transport Pricing Policies.” Journal of Environmental Psychology 30: 587–593. doi:https://doi.org/10.1016/j.jenvp.2010.05.002.
- Schuitema, G., L. Steg, and M. van Kruining. 2001. “When are transport pricing policies fair and acceptable?” Social Justice Research 24: 66–84.
- Senbil, M., and R. Kitamura. 2006. “Valuing Expressways under Time Pressures.” In CD- ROM: Transportation Research Board 85th Annual Meeting, 19.
- Sikow-Magny, C. 2003. “Efficient Pricing in Transport: Overview of European Commission’s Transport Research Program.” In Acceptability of Transport Pricing Strategies, edited by J. Schade and B. Schlag, 13–26. Oxford: Elsevier.
- Steg, L. 2003. “Factors Influencing Acceptability and Effectiveness of Transport Pricing.” In Acceptability of Transport Pricing Strategies, edited by J. Schade and B. Schlag, 187–202. Oxford: Elsevier.
- Sun, X., Feng, S., and Lu, J. (2016). “Psychological factors influencing the public acceptability of congestion pricing in China”. Transportation Research Part F: Traffic Psychology and Behaviour 41 (2016) 104–112 doi:https://doi.org/10.1016/j.trf.2016.06.015
- Tanriverdia, C. S., S. Shakibaeib, and O. H. Tezcan (2012). “A Stated Preference (SP) Study on Individuals’ Transportation Decisions, Focused on Marmaray Project in Istanbul. Energy Efficient Transportation Network.” 15th Edition of the Euro Working Group on Transportation. International Scientific Conference, Paris.
- Verhoef, E. T., and K. A. Small. 2004. “Product Differentiation on Roads.” Journal of Transport Economics and Policy 38 (1): 127–156.
- Zaidan, E., and A. Abulibdeh. 2018. “Modeling Ground Access Mode Choice Behavior for Hamad International Airport in the 2022 FIFA World Cup City, Doha, Qatar.” Journal of Air Transport Management 73: 32–45. doi:https://doi.org/10.1016/j.jairtraman.2018.08.007.
- Zefreh, M. M., Esztergar-Kiss, D., and Torok A. (2020). Implications of different road pricing schemes in urban areas: a case study for Budapest https://www.icevirtuallibrary.com/doi/abs/10.1680/jtran.19.00094