
 ?Mathematical formulae have been encoded as MathML and are displayed in this HTML version using MathJax in order to improve their display. Uncheck the box to turn MathJax off. This feature requires Javascript. Click on a formula to zoom.
ABSTRACT
Interchange provides more flexibility in route choice, a key travel behaviour in urban rail transit, but its influence is usually simplified. This paper investigates how interchange affects route choice with passenger perception considered. At single-interchange level, perceived interchange time was proposed and modelled under three resolutions to capture passenger perception and its sensitivity. At route level, the influence of interchange was modeled by first comparing eight quantifications of interchange. Mixed logit models with the best interchange proxy were further developed to address the correlation among alternative routes and reveal the potential taste variations among passengers. Results based on Shanghai Metro data showed perceived interchange time, including passenger perception and interchange environment, better represents the influence of interchange in route choice, meanwhile the weights of interchanges on one route rise sequentially and non-linearly. The results can improve route choice prediction in demand modelling and route recommendation in advanced traveller information systems.
Introduction
In urban rail transit, route choice is one of the key behaviors that influences passenger flows over the entire network, affecting service performance measurement, operation strategies analysis, and infrastructure development evaluation. Choosing one route out of multiple alternatives is quite common for passengers traveling in a complex urban rail transit network. According to the latest survey for the London Underground (Transport for London Citation2017), 34.42% of the investigated 33,289 Origin–Destination (OD) station pairs had more than one used route, and 1420 had more than three. The survey also showed for each tube journey in London, the average number of interchanges is 1.44, while in the Shanghai Metro, it was 1.73 in 2017 (China Urban Rail Transit Association Citation2017).
Route choice is a comprehensive decision-making process based on each passenger’s subjective perceptions of many factors, including journey time, in-vehicle crowdedness, the ease of interchange(s), etc. Interchange becomes an indispensable factor of route choice in urban rail transit as its topological structure only allows travelers to change between lines at a set of specific stations, also called interchange stations. This is quite distinctive from road and bus transit traffic, where travelers can change from one road/route to others more easily through crossings or multi-line bus stops and thus interchange does not play a significant role. The limited number of interchange options in urban rail networks makes interchange a key factor when passengers face several alternative routes between their origin and destination stations, especially when the numbers and attributes of interchange processes involved in each route are different.
Thanks to the rapid advancement of information and communication technology, Advanced Traveler Information System (ATIS) can now make use of more real-time data from both the operator side (e.g. Automatic Vehicle Location (AVL), Automated Fare Collection (AFC), Automatic Passenger Counters (APCs), etc.), and passenger side (e.g. smart card data, mobile phone data, social media data, GPS data, etc.) (Welch and Widita Citation2019) to give advice to travelers for trip planning, such as route recommendation in urban rail transit. However, most ATISs do not provide ‘soft’ characteristics such as convenience, comfort and privacy, about which travelers often wish to be informed (Chorus, Molin, and Van Wee Citation2006); unfortunately, information about interchange processes is one of them. Furthermore, most ATISs have two drawbacks, which are insufficiently personalized services and carelessness of traveler diversity. Although improvements are made to overcome them by considering traveler’s preferences and variety (Arentze Citation2013; Ceder and Jiang Citation2020; Kem, Balbo, and Zimmermann Citation2017; Nuzzolo et al. Citation2014, Citation2013), passenger perception of route attributes has not been given enough emphasis to date. Thus, the alternative routes recommended by ATISs may not suit all passengers.
Interchange provides more flexibility as passengers potentially have more feasible routes to choose from. For some OD station pairs having direct routes, routes with interchange are also competitive thanks to less time and/or crowdedness. However, it cannot be denied that interchange itself still causes inconvenience, which may lessen the appetite of passengers to use such routes (Lam and Xie Citation2002). The influence of interchange is mainly quantified at single-interchange and route levels. Weighted walking time between services, weighted waiting time for the connection and pure penalty, i.e. the inconvenience and risks involved in interchange, are commonly distinguished as three components of interchange disutility (Wardman and Hine Citation2000). Two major issues with this conception are its simplification of the pure penalty and neglect of the influence of passenger perception.
The pure penalty should theoretically consider the factors specific to each interchange process and its environment, including safety and security, ease of way-finding during interchange, availability of escalators, etc. (Guo and Wilson Citation2011). However, it is usually held constant, with identical values for the same types of interchange situations regardless of interchange environments (Cheng et al. Citation2019; Douglas and Karpouzis Citation2006; Jung and Casello Citation2019; Ministry of Land, Infrastructure, Transport and Tourism, Citation2012; Transport for London Citation2013; Wallis, Lawrence, and Douglas Citation2013). There is scant literature on how environment variables influence pure penalty. Douglas and Jones (Citation2013) have indicated that ‘cross-platform transfers’ at rail stations have a lower pure penalty than an ‘up/down interchange’, but the limited dimensionality of choice situations in stated preference surveys also restricts how interchange disutility can be directly integrated into route choice models. The influence of passenger perception has been gradually catching more attention. Hua et al. (Citation2020) investigated metro transfer perception time (MTPT), but the limited number of transfer stations and categorized values of MTPT did not provide a clear, overall picture of how passenger perception may be affected.
For route-level modeling, the simplest way to interpret interchange is to include a dummy or nominal variable denoting how many interchanges are included in a route, along with in-vehicle time or overall journey time in the utility of a route (Wardman Citation2001; Wardman and Hine Citation2000). Although this straightforward method considers the premium cost of interchanges, it punishes all the interchanges indiscriminately without considering different interchange environments. Furthermore, interchange time is either ignored or given the same weight as other components of the overall journey time. Inspired by the study of single interchange disutility, some researchers have extracted interchange time from overall journey time and assigned it different weights from other time components (Guo and Wilson Citation2011; Jia et al. Citation2020; Liu Citation2013). Jin et al. (Citation2017) introduced a perceived transfer threshold to further differentiate the weight of each interchange’s time. When the number of interchanges exceeds a threshold, the weight of interchange time will increase to reflect how the attitudes of passengers change, but within one segment, each interchange’s time shares the same weight.
The influence of interchange environment has been explored in other studies. Stations layout (ascending, even and descending levels) and stations infrastructure (assisted, semi-assisted, and non-assisted) attributes were introduced into route utility and were shown to have significant effects on route choice (Raveau et al. Citation2014; Raveau, Muñoz, and de Grange Citation2011). However, due to the diversity and complexity of interchange processes, whether these characteristics can sufficiently represent the effect of interchange environments remains questionable. One counterexample is for a descending level interchange, the interchange process may involve going-up in part, such as changing from Victoria line to Piccadilly line at King’s Cross and St. Pancras station (Godwin Citation2012). Also, the semi-assisted option in station infrastructure characteristic is very ambiguous.
Guo and Wilson (Citation2011) considered more interchange environment variables, studying the 303 interchange processes involved in the London Underground. Escalator availability, the number of stairs, horizontal distance, ramp length, and whether the two transfer platforms were at the same level were five significant influencing factors for route choice. Interchange cost was found to be unevenly distributed across stations and platforms at a station, and interchange stations are perceived very differently by passengers. However, the dummy variables that represented the involvement of specific interchange stations are not transferable for cases other than London as there was no way to externally determine the coefficients of station-based dummy variables.
No matter how interchange is quantified at the route level, its influence on route choice is usually investigated using discrete choice models based on random utility theory (Ben-Akiva, Lerman, and Lerman Citation1985). The multinomial logit model (MNL) is the most popular model because of its closed-form formula and ease of interpretation, however, the independence from irrelevant alternatives (IIA) property derived from the assumption of independent distributions largely limits the model’s applicability and fidelity. Nested logit and other variations were then developed to overcome these problems, followed by great progress in the new Generalized Extreme Value (GEV) family of models and mixed logit models (McFadden Citation2001), which provide more flexibility. Particularly, mixed logit models can approximate any random utility model (McFadden and Train Citation2000). A more advanced version, the hybrid choice model has now been developed based on the discrete choice model to enhance the predictability of choice models (Ben-Akiva et al. Citation2002).
Although the above-mentioned literature has contributed to a deepened understanding of the influence of interchange on route choice, the difference between the facts of interchange and passenger perception, and their potential influence on route choice demand more attention. Passenger taste variations about interchange also need to be discussed. This research explores the influencing factors on passenger perception of interchange and integrates the perception into route choice modeling using ‘perceived interchange time’ to investigate how this affects passengers’ route choices. The three main questions to be addressed are listed below.
a)Whether interchange environment variables have an impact on passengers’ perceived interchange time? If so, how do they impact?
b)What is the best quantification of interchange in route choice modeling?
c)How do passengers weigh the different interchanges within their routes?
The remaining parts of this paper are structured as follows. Section 2 models passenger perception of single interchanges by introducing perceived interchange time and identifies the resolution of passenger perception of interchange. Section 3 specifies eight different models to investigate the best quantification of interchange in route choice models, and adopts mixed logit models to understand passenger taste variation. Section 4 introduces how the surveys were designed and carried out with a brief description of the data collected. Section 5 analyses the results of perceived interchange time prediction models and route choice models considering the influence of interchange. Lastly, Section 6 summarizes the main findings of this paper.
Passenger perception of single interchanges
Perceived interchange time
In this paper, an interchange is defined as a movement process from a passenger alighting from the train of a starting line to arrival at the platform of an ending line. Actual interchange time is defined as the difference between these two time points, with waiting time on the platform of the ending line excluded as it only depends on the operation of the line so there is no difference between interchanging passengers and other passengers waiting on the platform. The definition indicates that each interchange has a certain direction depending on its starting and ending lines, that is, an interchange station of n lines involves at least n! interchanges. One special case is when a line’s platforms in different directions are asymmetrically located; in this case, the interchange process needs a further split. Each interchange process is composed of several stages, which can be categorized into two types of movements, horizontal or vertical, as shown in . Horizontal movement refers to the movement where passengers move in an open space (e.g. platform or concourse) or along a passageway or an upward/downward ramp with very little level change, while vertical movement refers to the movement where passengers move up or down mainly to change levels. Moving directions (ascending or descending) is a property specific to vertical movements. Assistance situations (non-assisted or assisted) are applicable for both. Movement with the help of moving walkway, escalator or lift is categorized as assisted movement. A continuous movement with the same movement type, moving direction and assistance situation is defined as a stage.
Figure 1. An example of the interchange process.
Perceived interchange time is proposed to quantify passenger perception of a single interchange, referring to their mental perception of the time spent for an interchange, which is the sum of a) the mean perceived interchange time, representing passengers’ collective perceptions, mainly influenced by the mean of actual interchange time, interchange environment and mean perception difference and b) the random error representing individual perception deviations caused by other unobserved factors as shown in EquationEquation (1)(1)
(1) . Perception coefficients can then be calculated as the ratio of mean perceived and actual interchange time.
where I is the number of interchanges; PITi is the perceived interchange time for interchange process I; is the mean perceived interchange time; α is the mean difference between perceived and actual interchange time, which is identical for all interchanges; xt and xe are the vectors of interchange time variables and interchange environment variables, respectively; βt and βe are the vectors of coefficients; and εi is the random error of interchange i, which is assumed to be normally distributed with zero as its mean,
. The perceived interchange time can be predicted using regression techniques, with the parameters α and βs estimated by the ordinary least square method.
Independent variables under hypotheses of perception resolution on interchange time
The influencing factors of perceived interchange time consist of two parts, actual interchange time and interchange environment. As the basis of passengers’ perceived interchange time, actual interchange time is influenced by movement type and the assistance situation, which can be measured by surveyed time. Meanwhile, interchange environment factors mainly include:
a)interchange form, which is categorized into three types: cross-platform, in-station and out-of-station interchanges. Note that the interchange between two lines sharing the same track and platform only generates extra waiting time without additional walking time, so such cases are excluded from this study;
b)the number of shifts, representing the complexity of an interchange process, which may cause passenger mental fatigue;
c)the grade of interchange movement distance, to capture additional influences caused by long-distance movements aside from just movement time;
d)the level of assistance, reflecting the convenience of an interchange process, which is measured by the percentage of assisted distance for a specific part (process/movement/stage).
It is worth noting that the sensitivity of passenger perception of interchange time may lead to different selections of quantitative proxies for the abovementioned influencing factors. Three hypotheses of passenger perception resolution were thus put forward to explore how sensitive passengers are to perceptions of single interchanges as listed below according to resolution ascendingly.
Hypothesis I (Process-level resolution): Passengers perceive their interchange time without thinking about different types of movements or stages separately.
Hypothesis II (Movement-level resolution): Passengers perceive their interchange time with horizontal and vertical movements being separately considered. But for each type of movement, stages are not separately considered.
Hypothesis III (Stage-level resolution): Passengers perceive their interchange time with stages that have different moving directions and/or assistance situations being separately considered.
Depending on the hypotheses of perception resolution, alternative independent variables for the regression model were aggregated at different levels to represent the influencing factors (see ), and then input into the regression models. After comparison, the best-performing regression model was adopted to predict the perceived interchange time for all interchanges, which is to be input in the route-level analysis. The corresponding hypothesized passenger’s perception resolution, indicating the sensitivity level at which passengers perceive single interchanges, will be accepted.
Table 1. Alternative regressors under different hypotheses of perception resolution
The influence of interchange on route choice
The framework of route choice modeling
Based on the understanding of passenger perception of single interchanges, the influence of interchange at route level could then be investigated by modeling passengers’ route choices using discrete choice methods based on random utility theory (Ben-Akiva, Lerman, and Lerman Citation1985). Random utility theory assumes that each passenger tries to choose a route from all alternative routes to obtain the maximum utility according to his/her perception. The utility of a route consists of two components: the representative utility influenced by explanatory factors that can be observed, such as interchange, in-vehicle time, waiting time, etc., and the random error, which captures the impact of factors that could not be observed, as shown in EquationEquation (2)(2)
(2) .
where N is the number of passengers; Jn is the number of alternatives for passenger n depending on the specific OD pair he/she travels; Unj is the utility of alternative route j for passenger n; Vnj is the representative utility of alternative route j for passenger n; xnj is the vector of explanatory variables of alternative route j for passenger n; θn is the vector of coefficients representing the weights attached to explanatory factors by passenger n; and εnj is the random error of alternative route j for passenger n.
Depending on the assumptions of the distribution of random error, various discrete choice models can be used. The most widely used is the Multinomial Logit (MNL) model, assuming each εnj is an independently, identically Gumbel-distributed extreme value. The choice probability of passenger n to choose route j in MNL models is given by EquationEquation (3)(3)
(3) .
The specification of the utility function, especially the representative utility, reflects how different factors influence passengers’ choices and their importance. To better understand how interchange influences route choice, specifications with different quantifications of interchanges were developed (Section 3.2) and analyzed by comparing the predictive performances of MNL models using corresponding specifications of utility functions. Mixed logit models with the optimal specification were further developed (Section 3.3) and estimated to reveal the potential passenger taste variations on interchange.
Note that for each OD pair, passengers may consider a set of alternative routes with the values of their key attributes within a reasonable range compared to the shortest route. A good alternative route set will also improve the predictive power of a route choice model, as it includes used routes and excludes un-used routes as far as possible. To generate alternative route sets of high quality, a two-step procedure was applied here. The first step is adopting a depth-first searching algorithm with qualitative and slightly relaxed quantitative constraints to create initial alternative routes to cover used routes as much as possible, without worrying about including some unreasonable routes due to identical thresholds for all OD pairs because they will be filtered out later on. Then, in the second step, the initial alternative routes for each OD pair are given two ranks within the whole set by sorting them in ascending order of travel time and the number of interchanges, respectively. When one is prioritized as the major ranking criteria, the other serves as auxiliary criteria in case of ties caused by using the main criteria only. Then, routes with both ranks less than a predetermined threshold were accepted as final alternative routes to be input into route choice models. This procedure avoids arbitrary adjustments of weight combinations of link costs in labeling approach (Ben-Akiva et al. Citation1984) and does not only pay attention to the shortest route.
Utility function specifications
In route choice modeling, the explanatory variables of utility function mainly include passengers’ socio-economic characteristics and route features. Although researchers have tried adding variables like train and station usage, topological factors, etc., travel time is still the most traditional and important variable for explaining route-choice behavior, which can be further divided into in-vehicle time, waiting time and interchange time. Besides these, the number of interchanges is commonly used to reflect the influence of interchange. As this paper investigates the influence of interchange on route choice, variables were categorized into interchange-related and non-interchange-related, with interchange time and the number of interchanges in the former category whilst in-vehicle time and waiting time at the origin station and interchange stations in the latter. Ticket fare was not considered, as it is the same between a specific OD pair in the case of the Shanghai Metro, no matter which route was chosen, but this may be of concern for other networks. The key difference of this paper from existing studies is how it broadens the concept of interchange time by allowing it to be chosen from actual interchange time and perceived interchange time, as mentioned in Section 2, with the influence of interchange environment considered.
To understand how interchange affects passengers’ route choices, eight specifications were developed and compared to examine a) whether actual or perceived interchange time better quantifies the influences of interchanges, b) whether the number of interchanges should be separately considered, and c) whether passengers consider interchange processes individually or holistically. As seen in the framework of specifications shown in , Specification 1 and 5 shared a similar structure, and so forth. Specification 1 was taken as a benchmark as it is widely used in previous studies.
Figure 2. Utility function specifications.
Mixed logit model
Although the MNL model is widely used, its assumptions usually contradict with reality, which leads to two major problems, i.e. there is no correlation among error terms and no taste variation among individual decision-makers. The first problem becomes severe in the context of route choice modeling in urban rail transit because the limited number of interchanges in urban railways further reduces the diversity of alternative routes for each OD pair and hence causes an extensive existence of overlap among alternative routes. Besides the inevitable and not negligible correlation among error terms, the assumption of no taste variation among passengers may also hurt the MNL model’s interpretability and predictability.
To address these issues, Mixed Logit (MXL) models (McFadden and Train Citation2000) were adopted as they introduce random coefficients and create correlation among the utilities for different alternative routes. In an MXL model, coefficients are divided into two groups, fixed and random, as given by EquationEquation (4)(4)
(4) . A fixed coefficient means passengers have very similar tastes such that deviations are small enough to be omitted, while a random coefficient means passengers have obvious taste variations among themselves and is composed of the average taste of all passengers and his/her deviation from this mean value, as shown in EquationEquation (5)
(5)
(5) .
where xfnj is a 1 × P vector of variables with fixed coefficients; xvnj is a 1 × Q vector of variables with random coefficients; θf and θrn are the vectors of fixed coefficients and random coefficients for passenger n, respectively; and εnj remains the same meaning as the random error with independently, identically distributed extreme value. For random coefficients, is the mean value of the qth random coefficient representing the average taste of all passengers and
is the deviation of passenger n from the mean value of the qth random coefficient. The random coefficient follows a distribution with density
, where
is a vector of distribution parameters and the number and meanings of parameters depend on the distribution chosen (such as normal, lognormal, uniform distribution, etc.). It can be inferred that in an MXL model, the unobserved stochastic portion of utility is
, instead of random error εnj alone. Thus, correlations among alternatives are created, the patterns of which depend on the selection of attributes with random coefficients and assumptions of the distributions of taste variation. Once the utility function is specified, a mixed logit model is constructed, the choice probabilities of which are the integrals of standard logit probabilities over possible variables of coefficients. Given the choice and variable data, MXL models could be estimated using the maximum simulated likelihood method. In this paper, all MXL models were estimated by using modified Matlab codes based on the ones developed by Train (Citation2009), with 100 modified Latin hypercube sampling (MLHS) draws (Hess et al. Citation2006).
Survey design and data
For analyzing passenger perception of single interchanges, detailed infrastructure characteristics and the interchange time of each interchange is indispensable. A field survey was carried out on 30th March and April 13 2017 by four groups of investigators to manually collect and double-check the data for each stage in every interchange. All of the 154 interchange processes of the 51 interchange stations in Shanghai Metro present at that point in time were surveyed, 140 of which were in-station interchanges, 2 cross-platform interchanges and 12 out-of-station interchanges. The survey excluded pseudo-interchanges between two lines or trunk and subsidiary lines at the stations where they share platforms; furthermore, interchanges from a shared platform to/from other lines were not separately considered for the platform-sharing lines.
Passengers’ perceived interchange time and their route choices for route-level analysis were investigated using a specifically designed three-part survey shown in . Each respondent was instructed to answer all the questions. Only questions related to interchanges in the actual route could be skipped if the route chosen was a direct one without interchange. Besides passenger socio-economic characteristics and metro usage information, passengers’ actual routes used in the first metro trip on the latest weekday and passengers’ perceived interchange time for interchanges were also queried. Note that passengers’ perceived interchange time was asked twice. The question in part II was defined as short-term memory-based while the ones in part III was defined as long-term memory-based. Levene’s test was used to identify the difference between the two types of perceived interchange time.
Table 2. Survey questions for passenger perception of interchanges and route choices
The survey plan and designs were approved by Tongji University (Reference No.: 35,744) and the questionnaire was released from June to August 2017 through an online survey platform. This platform owns a database of registered users who would like to answer questionnaires. A total of 2086 people were randomly sampled from the users whose records showed they live in Shanghai and were emailed the survey link. To ensure respondents were familiar with Shanghai Metro and highly likely to have perceived interchange time based on two types of memories, each individual was filtered by being asked a) whether (s)he lives in Shanghai and b) whether (s)he uses Shanghai Metro every week. Only when both answers were ‘yes’, was a respondent be allowed to access the questionnaire. All the responses were checked carefully to avoid any missing, inconsistent or incorrect answers, for example, the name of metro station or the interchange station on the route in Part II or III did not exist in the Shanghai Metro system. After removing all questionable responses, the sample was input for analysis. A total of 748 records of short-term memory-based perceived interchange time covering 144 interchanges were provided by 658 respondents who used routes with at least one interchange on the latest weekday, while 3921 records of long-term memory-based perceived interchange time covering 150 interchanges were contributed by 1461 respondents. summarizes the socio-economic and travel characteristics of respondents for the two types of perceived interchange time. Both samples were evenly distributed in gender. Most respondents were adults, with age mainly ranging from 18 to 60 years old. For the trips on the latest weekday, commuting (either going to work or school) was the main travel purpose, accounting for 70%. Shopping and business followed with 9.88% and 8.81%. The distribution of trip purposes matched with the results reported by Shanghai travel survey (Shanghai Municipal Urban and Rural Construction and Transportation Commission et al., Citation2010) that the main trip purpose of rail users in Shanghai Metro is commuting. As it is also the main trip purpose for people from 18 to 60 as reported, the overall ridership and sampled respondent group tend to be young, which indicates the sample representative. More than 70% of the respondents traveled by metro more than 3 times in one week, and most of them used the metro on weekdays. This indicates the respondents surveyed were familiar with Shanghai Metro network, so their answers should be reliable.
Table 3. Respondents’ socio-economic and metro usage profile
For constructing a topological network and modeling route choice, network information, journey time between stations and waiting time of train services in the year of 2017 was either obtained from open data sources or provided by the operator of Shanghai Metro, Shanghai Shentong Metro Co., Ltd., while the surveyed interchange time was used as actual interchange time. Note that the perceived interchange time needed in the route choice models was predicted by the best regression model for the single-interchange–level analysis.
Results and discussions
Single-interchange–level regression analysis
Levene’s test shows for 87.27% of interchanges, the distributions of perceived interchange time based on short-term or long-term memories had equal variances and means. For those with unequal means, the averages of long-term memory-based perceived interchange time were a little greater. It indicates passengers basically have consistent perceptions for most of the interchanges that did not change substantially over time, so the two samples of perceived interchange time could be merged for further analysis. All of the 132 interchanges with more than five respondents were chosen for regression analysis.
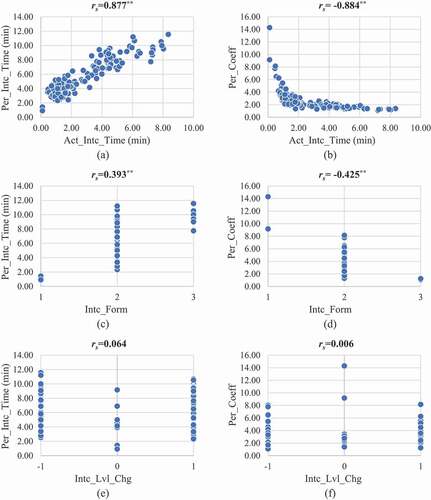
shows that perceived interchange time had a strong positive correlation with actual interchange time, while the perception coefficient was negatively correlated with actual interchange time in a non-linear way. With an increase of actual interchange time, perception coefficients gradually decreased but stayed greater than one, indicating psychological amplification played a large role, especially when actual interchange time was shorter than 2 mins. An increasing trend of perceived interchange time existed when interchange form changed from cross-platform to out-of-station as the difficulty of an interchange process increased, while the perception coefficient decreased. Because in-station interchange covered most of the interchange processes in our case, more environment variables were needed to differentiate them. Regarding the interchange-level change, it was obviously not correlated with either perceived interchange time or perception coefficient, which pointed out it could not represent the influence of environment on interchange processes. Using ascending or descending as an attribute of an interchange process, based on absolute level change, will not reflect reality and may cause distortion.
Figure 3. Correlation among five variables.
Three regression models of perceived interchange time under different hypotheses of perception resolution were constructed using the stepwise technique. The descriptive statistics of all independent variables at the process-level, movement-level and stage-level resolution are shown in . The variances in variables indicated there were wide differences among interchange processes, so that they should not be treated in the same way.
Table 4. The descriptive statistics of independent variables at different levels
From , we can see all regression models were significant and showed relatively high predictability. The constant in each model represented the fixed part of the pure penalty, which was not influenced by environment variables. It indicated that each interchange can cause extra psychological time because interchange needs passengers to get off and on trains and may increase uncertainty. It is not surprising that actual interchange time variables in all models were significant and had positive coefficients as they are the essential components of perceived interchange time. On the other hand, interchange environment variables also had significant contributions to the models at different levels. As one of the most important environment variables, the interchange form played a large role at each resolution level. Cross-platform interchange can reduce perceived interchange time more than 1.5 min because of its least difficulty. The out-of-station interchange also had a negative coefficient, which means it can reduce perceived interchange time as well. This may seem counter-intuitive, but because passenger perception coefficients decrease as the actual interchange time rises, it could be explained as counteract the over-estimation caused by long actual interchange time for this type of interchange processes.
Table 5. Estimation results of regression models based on different perception resolutions
The best-performing model was based on process-level resolution, with an adjusted R2 of 0.845. This suggested that passengers basically perceived interchange as a whole process rather than separate movements or stages, and perceived interchange time was formed based on general feelings. According to this result, every 1 min actual interchange time was enlarged as 1.122 min perceived interchange time, while the percentage of assisted movement distance could help passengers feel like they spent less time in interchange overall. Every 1% increase could reduce 0.034 min perceived interchange time, which implies more assistance infrastructure could be introduced to shorten perceived interchange time.
This finding clearly pointed out that the pure penalty should be determined based on environment variables of each interchange process, especially its interchange form and level of assistance, instead of an identical value for all interchange processes in most applications. Higher expediency would greatly change passengers’ impression and reduce their perceived interchange time of one interchange process. This gave some implications for both transport designers and operators. When an interchange process is being designed, the cross-platform form is worth more priorities than in-station and out-of-station forms if available. For existing interchanges, more effort could be put in upgrading their ease of use by installing more infrastructure to assist passengers’ movements, both horizontally and vertically.
Route-level discrete choice model considering the influence of interchange
All route choice models were estimated with the actual route choices of respondents in Shanghai Metro network. The records of eight passengers who took unnecessarily tortuous routes were screened out to avoid generating superfluous alternative routes and estimation bias, hence, 650 passengers’ route choices were used for estimating route choice models. A total of 520 passengers’ route choices (80%) were used for estimation, while the remaining 130 passengers’ route choices (20%) for validation in MNL models. Stratified sampling according to each OD pair’s shortest travel time was adopted to avoid bias. Alternative route sets were generated with quantitative constraints being 25 min for absolute difference, 100% for relative difference and 3 for the maximal number of interchanges in the first step and the predetermined rank threshold being 5 in the second step. A total of 3906 alternative routes were generated, on average six routes for each OD pair.
presents the estimation results of multinomial logit models with different utility function specifications. Most variables passed significance tests except the actual interchange time of the third interchange in Model 3 and the number of interchanges in Model 7. Log-likelihood is an indicator of the relative explanatory power of a model. Less negative values in the log-likelihood are associated with a greater ability of a model to explain the pattern of choices in the data, while adjusted Rho-squared is used to measure the goodness-of-fit describing how well a model fits a set of observations. For models with similarly structured specifications shown in , the results indicated that the model using perceived interchange time always outperformed the model using actual interchange time, no matter whether interchange processes were considered individually or holistically or the number of interchanges was added. The higher predictive ability provided strong evidence that perceived interchange time better quantified the influence of interchanging, not only because it included the perception influence but also because it integrated environment variables.
Table 6. Estimation results of multinomial logit models with different specifications
After knocking out models with insignificant variables, the models with Specifications 1 and 8 were the best models for those using actual interchange time and perceived interchange time, respectively. For the model applying actual interchange time, it was better to represent the influence of interchange by total actual interchange time and separately considering the number of interchanges. However, the same was not true for the models using perceived interchange time. In that case, passengers consider interchange processes individually without the influence of the number of interchanges. This difference could be understood as the perceived interchange time has already considered the fixed part of the pure penalty, so there was no need to count it twice, and individual perceived interchange time can represent diverse interchange processes more properly. The model with Specification 8 had the best performance, with an adjusted Rho-squared of 0.763. For the training set with 520 passengers’ records, the model’s hit rate of alternatives was 94.7%, while the one for the choice condition was 84.2%. For a test set with 130 passenger records, the hit rate of alternatives was 94.1% while the one with the choice condition was 81.5%.
Based on this specification, the MXL models were developed with all coefficients initially assumed to be random with normal distributions. According to the estimation results, coefficients with insignificant standard deviations were removed from random coefficients. The final estimation result in shows all coefficients were significant and the adjusted Rho-squared increased to 0.770, indicating the MXL model’s predictive value exceeded all MNL models. It demonstrated that passengers only had taste variations in terms of in-vehicle time and the perceived interchange time for the first interchange on a route, with a 0.139 and 0.320 as standard deviation, respectively. The coefficients of the other three attributes had very little deviation, so they were regarded as fixed. In other words, passengers perceived the unit disutility of the first interchange differently but agreed on the ones of the other two interchanges.
Table 7. Estimation result of mixed logit route choice model
The relative weights, calculated by dividing the mean values of coefficients by the one of in-vehicle time showed that 1 min waiting time equaled 1.816 min in-vehicle time, which is close to 2.0 times applied by many transport authorities. The weights of perceived interchange time increased sequentially. The weight of the first interchange time was the smallest, equivalent to 0.790 min in-vehicle time; meanwhile, the weights of the second and third interchanges were much higher, 1.618 and 1.941 min in-vehicle time, respectively. The interchange time of the first interchange may have been weighted less than in-vehicle time because perceived interchange time had already magnified actual interchange time by adding a fixed value (2.848 min).
The relationship among the weights for different interchanges interestingly shows that the influence of interchange did not linearly increase. The ratio of coefficients between the first and second interchange was 2.048, while the ratio between the second and third interchange was only 1.200, so the rate of increase declined as the number of interchanges went up. This also implies that for the same interchange process, if its order on a route is different, passengers may give it different weights. If one route includes more than one interchange, then the later an interchange happens, the bigger negative impact each unit of perceived interchange time will have. This finding was different from Wardman and Hine (Citation2000), who found that the second interchange had a smaller effect than the first.
The models suggested that in future information provision systems information about interchange processes should be provided and route recommendations for passengers should not only focus on in-vehicle time, total journey time, and the number of interchanges, but also pay attention to the perceived interchange time and the order of each interchange. Every single interchange on a route has a different influence on passengers’ route choices and the influence of passenger perception should not be ignored. Information about interchanges could help passengers to pick their most preferred routes. When passengers are facing different alternative routes with the same in-vehicle and waiting time but different interchanges, they do not always choose routes with fewer interchanges, because more interchanges does not definitively mean more inconvenience and disutility. For example, two cross-platform interchanges might outperform an out-of-station interchange in some circumstances. For one interchange, when it occurs in a particular route will also affect how much influence it will have. The diverse combinations of interchanges in alternative routes play a large part in passengers’ final route choice decisions.
Conclusions
Interchange is an important part of an urban railway network that helps passengers travel more efficiently but may cause some inconvenience. This paper investigates how interchange affects passengers’ route choices in urban rail transit, at both single-interchange and route levels. The main findings of this study are summarized as follows:
Passenger perception did magnify the interchange time and should be considered. Perceived interchange time was a good representative of the influence of interchange at the single-interchange level. It is larger than actual interchange time due to the influence of passenger perception at interchange process-level, with the ratio between them decreasing with the increase of actual interchange time, but always greater than one.
Interchange environment variables did have an impact on passenger perception, so it could be inferred that pure penalty in traditional applications should not be an identical value but vary accordingly. Cross-platform and out-of-station interchange may have a lower pure penalty while a higher level of assistance could help reduce perceived interchange time.
The best way to quantify the influence of interchange on route choice was by using perceived interchange time on one route individually, without the number of interchanges. Perceived interchange not only took different interchange processes into account but also captured the impact of the number of interchanges and their orders.
The weights varied among interchanges with different orders on one route. The later an interchange happened on a route, the bigger negative impact each unit of perceived interchange time had. Regarding variance, passengers only showed taste variations in terms of the perceived interchange time of the first interchange on a route.
These findings will help better predict the route choices of passengers in demand modeling and provide more helpful information to passengers for route choice in ATIS. By further introducing crowding impacts in the future, the route choice model can be developed as a part of dynamic transit assignment models to predict passenger patterns when a brand-new or modified urban rail network is proposed.
Acknowledgments
This research did not receive any specific grant from funding agencies in the public, commercial, or not-for-profit sectors.
Disclosure statement
The authors declare that there is no conflict of interest regarding the publication of this paper.
Data availability statement
The data that support the findings of this study are available from the corresponding author, Y. Cheng, upon reasonable request.
References
- Arentze, T. A. 2013. “Adaptive Personalized Travel Information Systems: A Bayesian Method to Learn Users’ Personal Preferences in Multimodal Transport Networks.” IEEE Transactions on Intelligent Transportation Systems 14 (4): 1957–1966. doi:https://doi.org/10.1109/TITS.2013.2270358.
- Ben-Akiva, M., D. McFadden, K. Train, J. Walker, C. Bhat, M. Bierlaire, D. Bolduc, A. Boersch-Supan, D. Brownstone, and D. S. Bunch. 2002. “Hybrid Choice Models: Progress and Challenges.” Marketing Letters 13 (3): 163–175. doi:https://doi.org/10.1023/A:1020254301302.
- Ben-Akiva, M., M. J. Bergman, A. J. Daly, and R. Ramaswamy, 1984. Modeling Inter-urban Route Choice Behaviour, in: Proceedings of the 9th International Symposium on Transportation and Traffic Theory. VNU Science Press Utrecht, The Netherlands, Delft, The Netherlands, pp. 299–330.
- Ben-Akiva, M. E., S. R. Lerman, and S. R. Lerman. 1985. Discrete Choice Analysis: Theory and Application to Travel Demand. MIT press, Cambridge, Massachusetts, United States.
- Ceder, A. (Avi), and Y. Jiang. 2020. “Route Guidance Ranking Procedures with Human Perception Consideration for Personalized Public Transport Service.” Transportation Research Part C: Emerging Technologies 118: 102667. doi:https://doi.org/10.1016/j.trc.2020.102667.
- Cheng, L., X. Chen, J. De Vos, X. Lai, and F. Witlox. 2019. “Applying a Random Forest Method Approach to Model Travel Mode Choice Behavior.” Travel Behaviour and Society 14: 1–10. doi:https://doi.org/10.1016/j.tbs.2018.09.002.
- China Urban Rail Transit Association, 2017. Annual Statistical Report on China Urban Rail Transit 2017 [WWW Document]. http://www.camet.org.cn/index.php?m=content&c=index&a=show&catid=18&id=13532 (accessed 23 8 2019).
- Chorus, C. G., E. J. E. Molin, and B. Van Wee. 2006. “Use and Effects of Advanced Traveller Information Services (ATIS): A Review of the Literature.” Transport Reviews 26 (2): 127–149. doi:https://doi.org/10.1080/01441640500333677.
- Douglas, N., and G. Karpouzis, 2006. Estimating the Passenger Cost of Train Overcrowding, in: 29th Australasian Transport Research Forum. Gold Coast, Australia.
- Douglas, N. J., and M. Jones, 2013. Estimating Transfer Penalties and Standardised Income Values of Time by Stated Preference Survey, Australasian Transport Research Forum, ATRF 2013 - Proceedings. Brisbane, Australia.
- Godwin, A., 2012. King’s Cross St. Pancras 3D station map [WWW Document]. https://stations.aeracode.org/
- Guo, Z., and N. H. M. Wilson. 2011. “Assessing the Cost of Transfer Inconvenience in Public Transport Systems: A Case Study of the London Underground.” Transportation Research Part A: Policy and Practice 45 (2): 91–104. doi:https://doi.org/10.1016/j.tra.2010.11.002.
- Hess, S., Train, K.E., Polak, J.W. 2006. “On the Use of a Modified Latin Hypercube Sampling (MLHS) Method in the Estimation of a Mixed Logit Model for Vehicle Choice.” Transportation Research Part B: Methodological 40 (2): 147–163. doi:https://doi.org/10.1016/j.trb.2004.10.005
- Hua, W., X. Feng, C. Ding, and Z. Ruan. 2020. “Bayesian Network Modeling Analyzes of Perceived Urban Rail Transfer Time.” Transportation Letters 1–8. doi:https://doi.org/10.1080/19427867.2020.1733201.
- Jia, F., X. Jiang, H. Li, X. Yu, X. Xu, and M. Jiang. 2020. “Passenger-oriented Subway Network Capacity Calculation and Analysis Based on Simulation.” Transportation Letters 1–13. doi:https://doi.org/10.1080/19427867.2020.1741778.
- Jin, F., E. Yao, Y. Zhang, S. Liu, and X. Ma. 2017. “Metro Passengers’ Route Choice Model and Its Application considering Perceived Transfer Threshold.” PLoS One 12 (9): 1–17. doi:https://doi.org/10.1371/journal.pone.0185349.
- Jung, Y. J., and J. M. Casello. 2019. “Assessment of the Transit Ridership Prediction Errors Using AVL/APC Data.” Transportation (Amsterdam). doi:https://doi.org/10.1007/s11116-019-09985-7.
- Kem, O., F. Balbo, and A. Zimmermann. 2017. “Traveler-Oriented Advanced Traveler Information System Based on Dynamic Discovery of Resources: Potentials and Challenges.” Transportation Research Procedia 22: 635–644. doi:https://doi.org/10.1016/j.trpro.2017.03.059.
- Lam, S. H., and F. Xie. 2002. “Transit Path-choice Models that Use Revealed Preference and Stated Preference Data.” Transportation Research Record: Journal of the Transportation Research Board 1799 (1): 58–65. doi:https://doi.org/10.3141/1799-08.
- Liu, X., 2013. Research on the Dynamic Flow Assignment Model Based on Train Schedule for Urban Subway Network. Chang’an University.
- McFadden, D. 2001. “Economic Choices.” American Economic Review 91 (3): 351–378. doi:https://doi.org/10.1257/aer.91.3.351.
- McFadden, D., and K. Train. 2000. “Mixed MNL Models for Discrete Response.” Journal of Applied Econometrics 15 (5): 447–470. doi:https://doi.org/10.1002/1099-1255(200009/10)15:5<447::aid-jae570>3.0.CO;2-1.
- Ministry of Land, Infrastructure, Transport and Tourism, J., 2012. Cost-effective Analysis of Railway Projects Manual 2012.
- Nuzzolo, A., A. Comi, U. Crisalli, and L. Rosati, 2013. An Advanced Pre-trip Planner with Personalized Information on Transit Networks with ATIS. IEEE Conf. Intell. Transp. Syst. Proceedings, ITSC 2146–2151. The Hague, Netherlands. doi: https://doi.org/10.1109/ITSC.2013.6728546
- Nuzzolo, A., U. Crisalli, A. Comi, and L. Rosati. 2014. “An Advanced Traveller Advisory Tool Based on Individual Preferences.” Procedia - Social and Behavioral Sciences 160: 539–547. doi:https://doi.org/10.1016/j.sbspro.2014.12.167.
- Raveau, S., J. C. Muñoz, and L. de Grange. 2011. “A Topological Route Choice Model for Metro.” Transportation Research Part A: Policy and Practice 45 (2): 138–147. doi:https://doi.org/10.1016/j.tra.2010.12.004.
- Raveau, S., Z. Guo, J. C. Muñoz, and N. H. M. Wilson. 2014. “A Behavioural Comparison of Route Choice on Metro Networks: Time, Transfers, Crowding, Topology and Socio-demographics.” Transportation Research Part A: Policy and Practice 66: 185–195. doi:https://doi.org/10.1016/j.tra.2014.05.010.
- Shanghai Municipal Urban and Rural Construction and Transportation Commission, Shanghai City Comprehensive Transportation Planning Institute, Office of the Fourth Comprehensive, Transportation Survey of Shanghai, 2010. Report on the fourth Shanghai comprehensive travel survey. Shanghai.
- Train, K. E. 2009. Discrete Choice Methods with Simulation, Discrete Choice Methods with Simulation. Cambridge, United Kingdom: Cambridge university press. doi:https://doi.org/10.1016/S0898-1221(04)90100-9.
- Transport for London. 2013. Business Case Development Manual. London: TfL Programme Management Office. doi:https://doi.org/10.1002/9781118693643.ch16.
- Transport for London, 2017. Rolling Origin & Destination Survey (RODS) [WWW Document]. https://data.london.gov.uk/dataset/tfl-rolling-origin-and-destination-survey
- Wallis, I., A. Lawrence, and N. Douglas, 2013. Economic Appraisal of Public Transport Service Enhancements.
- Wardman, M. 2001. “A Review of British Evidence on Time and Service Quality Valuations.” Transportation Research Part E: Logistics and Transportation Review 37 (2–3): 107–28. doi:https://doi.org/10.1016/S1366-5545(00)00012-0
- Wardman, M., and J. Hine, 2000. Costs of Interchange: A Review of the Literature.
- Welch, T. F., and A. Widita. 2019. “Big Data in Public Transportation: A Review of Sources and Methods.” Transport Reviews 39 (6): 795–818. doi:https://doi.org/10.1080/01441647.2019.1616849.